Article

The Effects of Crude Oil Price Surprises on National Income: Evidence from India

by
Chinnadurai Kathiravan
1,*,
Murugesan Selvam
2,
Balasundram Maniam
3,
Leo Paul Dana
4 and
Manivannan Babu
5
1
VIT Business School, Vellore Institute of Technology, Vellore 632014, India
2
Department of Commerce and Financial Studies, Bharathidasan University, Tiruchirappalli 620024, India
3
Department of General Business and Finance, Sam Houston State University, Huntsville, TX 77340, USA
4
Faculty of Management, Dalhousie University, Halifax, NS B3H 4R2, Canada
5
Bharathidasan School of Management, Bharathidasan University, Tiruchirappalli 620024, India
*
Author to whom correspondence should be addressed.
Energies 2023, 16(3), 1148; https://doi.org/10.3390/en16031148
Submission received: 16 November 2022 / Revised: 6 January 2023 / Accepted: 9 January 2023 / Published: 20 January 2023

Abstract

:
The goal of this study is to look into how changes in crude oil prices affect GDP per capita and exchange rate fluctuations.to investigate the influence of crude oil price shocks on GDP per capita and exchange rate movements. This research employed yearly time series data for the price of crude oil, exchange rate (USD/INR), and GDP per capita, from 1990 to 2020. Arithmetical tools such as Descriptive, Unit Root, Granger Causality Test, and OLS Model were applied. The present study discovered a strong bi-directional Granger causality effect of Dubai crude oil prices on exchange rates, as well as a bi-directional Granger influence of exchange rates on WTI crude oil prices. The diagnostic tests were successfully passed by the estimated models. According to the OLS model, the exchange rate was driven only by the price of Dubai crude oil, although the price of WTI crude oil influenced both the GDP per capita and the exchange rate over the research period. The key policy recommendation derived from this analysis is that the Reserve Bank of India (RBI) must depreciate the rupee, first to restore much-needed exchange rate stability, then to stimulate domestic manufacturers, and finally, to attract foreign capital inflows.

1. Introduction

Crude oil price movements have significant impact on the world economy and market movements and are a critical component in the expansion of a country’s industrial growth [1,2]. Academic, market practitioners, and politicians are increasingly interested in determining the reasons and repercussions of oil price changes. Because crude oil is a critical energy source and a widely traded commodity, a great number of academics believe that price fluctuations have significant impact on economic changes and development [3,4]. Many institutions, such as the central bank, government, and energy-related corporations, require accurate predictions of oil price tendencies to assess risk and develop appropriate policies and projects. Since the previous century, oil has been a key source of energy [5,6]. Crude oil accounted for the majority of the world’s energy sources [7]. After World War II, the significance of oil, as a source of energy, expanded dramatically, especially with the growing use of vehicles as the primary mode of transportation [8,9]. Agreeing to the International Energy Outlook (2013), the energy consumption in Asian countries is expected to increase, on average, by 17% over the period from 2010–2040. India is the fourth biggest consumer of crude oil in the globe [10,11].
Since 1991, when economic reforms were adopted, the country’s demand for oil has been rising quickly. The amount of oil consumed by India has substantially increased recently, reaching 195.5 million tonnes in 2015. This is an increase from 12.6 million tonnes in 1965 and 57 million tonnes in 1991–1992. The total domestic crude oil production fell by 1.36% during 2014–2015, from 37.461 million metric tonnes (MMT) to 36.950 million tonnes (736,000 bbl/day). Hence after coal, crude oil is regarded as one of the commercial energy sources in India. The percentage of oil in India’s principal commercial energy mix was at 36.39% (in 2003–2004), according to the Integrated Energy Policy (IEP), which is projected to go down to 29.43% in 2031–2032 [10].
India imports 80% of its total oil, and it is among the leading importers of oil in the world, accounting for one third of its total imports; however, the oil price in India is fluctuating due to huge imports [12,13]. The fluctuations in oil prices, especially when it falls, will lead to reductions in the value of imports. This reduces the amount of foreign exchange India owes to the rest of the world, which is known as its current account deficit. The current account deficit is reduced by $9.2 billion as a result of a $10 per barrel drop in oil prices, according to Livemint report. This represents almost 0.43% of Gross Domestic Product, a measurement of the size of the economy. Hence, the oil is used for the transportation of goods and services; the price of oil has an impact on the whole economy. All goods and services’ prices are directly related to the oil price changes. When the price of gasoline and diesel rise, this will impact all the prices of the entire end users. High inflation is detrimental to an economy. Companies are influenced both directly either by increase in inputs cost and/or indirectly by a decline in customer demand.
As the price of gasoline and diesel rises, it also directly affects all of us. Inflation increases as a result [14]. High inflation is detrimental to an economy. Companies are also impacted, both directly by an increase in input costs and indirectly by a decline in customer demand [15,16]. India will benefit when there is a decline in the global crude price. A Money control research states that for every $10 per barrel drop in crude oil prices, retail inflation is reduced by 0.2%, and wholesale inflation price is reduced by 0.5%. The cost of fuel is set at a subsidized rate by the government and as protection to the companies, if any losses occur in selling petroleum goods for less to the corporations. The term “under-recoveries” refers to these losses, and as a result, government overall spending increases, increasing the fiscal deficit for the amount it borrows from the market. When the oil price is lower, it will reduce the business losses and oil subsidies and help in the fiscal deficit. The decline in oil prices will, however, have a less significant impact on the government budget deficit when diesel is unregulated [17,18]. Furthermore, the government is still responsible for covering earlier under recoveries. The payments benefits for prior under-recoveries will outweigh any advantage from fall.
Policymakers, economists, and the general public have been predominantly attracted to the link between crude oil prices and economic growth [9,19,20]. Furthermore, a few studies have formerly established that the connection between crude oil price and economic growth is non-causal [21]. Several additional studies have established that fluctuations in crude oil prices facilitated a rise in national revenue. The layout of the paper is as follows. The literature is introduced in Section 2. The data and procedures are detailed in Section 3. Section 4 contains the findings and discussion, while Section 5 has the conclusion and policy implications.

2. Literature Review

In recent years, an emerging number of studies have examined the link between crude oil prices and economic activity. There has been continuous argument in the literature about the trend in crude oil prices and its impact on economic position. According to certain research, the upsurge in the oil price was caused by the self-centreed desires of some exporting nations, resulting in an increase in their revenue and, as a result, investment [22]. Exporting nations’ consumption and earnings increased over the course of time, resulting in stronger GDP growth for these countries [23]. The literature section of this study comprises two parts: studies that have focused on the exchange rate and variations in the price of crude oil, and studies which discuss the crude oil price changes and economic movements (GDP).

2.1. Currency Exchange Rates and Crude Oil

Numerous studies revealed that there is a positive correlation between changes in crude oil prices and exchange rates, as was previously mentioned [24]. The price of crude oil has been one of the major determinants of trade terms [25]. More significantly, ref. [26] discovered that there was an equilibrium link between exchange rates and oil prices for oil-dependent countries. Since the price of crude oil had a significant long-term impact on exchange rates, other research examined the long-term relationship between exchange rates and oil prices [27,28]. Similarly, to this, ref. [29] examined the relationship between changes in the exchange rate and the price of crude oil in the context of India and discovered two different sorts of outcomes. The price of crude oil increases leads to two things: first, a devaluation of the Indian rupee; and second, a long-lasting effect on the exchange rate. In the G20 nations, oil prices and exchange rates were inversely correlated, claimed [30].

2.2. Crude Oil and GDP

To prove a connection between changes in crude oil and economic activity, much academic research has been conducted [31,32,33,34,35]. The possibility of nonlinear behaviours in the Indian GDP have come to light more recently than it did twenty years ago. Variations in crude oil prices have a substantial impact on economic development, evidenced by previous researchers [36,37,38]. Changing crude oil prices have an impact on the economy both directly and indirectly [39]. The supply and demand sides of the economy are both impacted by changes in crude oil prices [40]. Numerous elements, including import cost, inflation, the price of petroleum products, and production expenses, which impede economic activity, were affected by the rise in crude oil prices [41]. Changes in crude oil prices had an effect on investment as well, which in turn affected economic growth [42]. Economic growth is negatively impacted by the price of crude oil, particularly in countries that import crude oil [43,44]. Increased production costs as a result of the surge in crude oil prices hurt supply [45]. More significantly, refs. [46,47] discovered that although the consumer price index was positively impacted by the crude oil price shock, China’s GDP and exchange rate were negatively impacted. The relationship between crude oil prices and exchange rates, inflation, and interest rates in Brazil, India, Indonesia, South Africa, and Turkey were found to be negative by [48]. According to [49], unanticipated changes in crude oil prices have a negative impact on economies and the general progress of the country. According to [6], Norway’s economy profited from the change in crude oil prices. [50] investigated how it affected Liberia. Refs. [51,52] examined the implications for Pakistan and Indonesia, respectively. According to [53], fluctuations in crude oil prices had a negligible impact. There was a significant correlation between changes in crude oil prices and Venezuelan economic variables such as GDP, investment, and government revenue [54]. The majority of earlier studies on the relationship between crude oil prices and economic activity focused on developed economies while neglecting developing Asian nations such as India. India contributed roughly 7.09 percent of the world’s GDP in 2020, and by 2026, this is anticipated to rise to 8.36 percent. Therefore, it is important to investigate the significance of crude oil prices, exchange rates, and their effects on the Indian economy. In light of this, the current study examines the relationship between the fluctuations in the oil price of crude oil and the performance of the Indian economy. El Anshasy (2009) [55] found out how oil prices affected economic growth in oil-exporting nations between 1970 and 2004. He discovered that there was a positive impact on GDP during the study period. Additionally, Ref. [56] examined the relationship between changes in crude oil prices and Iran’s growing economy. It was discovered that the price of oil had a favourable effect on economic expansion. Table 1 contains the literature review’s executive summary. Only a small portion of earlier research looked at non-oil-exporting nations such as India; the majority of earlier studies had a strong emphasis on countries that export crude oil, such as Kuwait, Saudi Arabia, and Russia. Therefore, the purpose of this study is to investigate how changes in global crude oil prices affect the Indian economy. While the majority of other research concentrated only on the movement in crude oil prices and the stock price, this study exclusively evaluates the effects of two crude oil prices, specifically WTI and Dubai crude, on the Indian national income.

3. Research Methods

3.1. Objectives of the Study

This study’s primary objective was to determine how changes in crude oil prices affected India’s GDP per capita and exchange rate.

3.2. Hypotheses of the Study

The following hypotheses were established and evaluated, in order to achieve the above objective, in the present study.
  • NH1—There is no normal distribution among the crude oil price shocks on GDP per capita and exchange rates (USD/INR).
  • NH2—There is no stationarity among the crude oil price shocks on GDP per capita and exchange rates (USD/INR).
  • NH3—There is no causal relationship between the crude oil price shocks and GDP per capita and exchange rates (USD/INR).
  • NH4—There is no influence of crude oil price shocks on GDP per capita and exchange rates (USD/INR).

4. Theoretical Background

The main driver of a country’s economic growth is its gross domestic product. International crude oil is regarded as the crucial input in the gross domestic production process since production cannot take place without energy resources, despite labour, capital, and land being known as the key inputs of GDP. When general prices rise due to an increase in supply due to the increase in oil prices, enterprises’ output is reduced [72]. It should be emphasised that not all countries are affected equally by the transportation of crude oil; instead, it depends on the category to which each one of them belongs (exporting or importing countries). The common consensus is that countries that export crude oil benefit from rising crude oil prices, while the nation that import crude oil will suffer [73].

5. Data Source and Estimation Techniques

5.1. Sample Selection

The purpose of this study was to examine the impact of crude oil prices on GDP per capita and the exchange rate movement in India. For the purpose of this study, annual time series data on GDP per capita, exchange rates (USD/INR), Dubai crude oil prices, and WTI crude oil prices were utilised from 1990 to 2020, as used by [74].

5.2. Sources of Data

The required data were collected from the official websites of the Ministry of Finance (https://www.finmin.nic.in/data-and-statistics, accessed on 20 May 2021), World Bank databank (https://databank.worldbank.org/home.aspx, accessed on 20 May 2021), International Monetary Fund (IMF) (https://www.imf.org/en/Data, accessed on 20 May 2021), and Federal Reserve Bank of St. Louis (https://fred.stlouisfed.org/categories, accessed on 20 May 2021).

5.3. Variables

In the light of the relevant literature, four variables, GDP Per Capita, Exchange Rate (USD/INR), Dubai Crude Oil, and WTI Crude Oil, were used. Figure 1 shows the graphical expression for the data of GDP per capita in India, while the graphical expression for the data of exchange rates of the US Dollar (US $)/Indian Rupee (INR) during 1990 to 2020 is displayed in Figure 2. The graphical expression for the data of Dubai crude oil price per barrel (in USD) during 1990 to 2020 is shown in Figure 3, and the graphical expression for the data of WTI crude oil price per barrel (in USD) during 1990 to 2020 is presented in Figure 4. The daily closing prices of crude oil, exchange rates, and GDP were converted by a natural logarithm of the raw data. The returns, used in each of the sample variables, were computed as follows:
R t = ln I t I t 1 × 100
where
Rt = Daily return,
ln = Natural log,
It = Daily closing value
It−1 = Closing value on trading day (t − 1).
Figure 1. Graphical Expression for the Data of GDP per Capita in India during 1990 to 2020; Sources: Compiled from https://databank.worldbank.org/home.aspx and computed using E. Views-10.
Energies 16 01148 g001
Figure 2. Graphical Expression for the Data of Exchange Rates of US Dollar (US $)/Indian Rupee (INR) during 1990 to 2020; Sources: Compiled from https://www.imf.org/en/Data and computed using E-Views-10.
Energies 16 01148 g002
Figure 3. Graphical Expression for the Data of Dubai Crude oil Price per barrel (in USD) during 1990 to 2020; Sources: Compiled from https://fred.stlouisfed.org/categoriesa (accessed on 20 May 2021) and computed using E. Views-10.
Energies 16 01148 g003
Figure 4. Graphical expression for the Data of WTI Crude Oil Price per barrel (in USD) during 1990 to 2020; Sources: Compiled from https://fred.stlouisfed.org/categoriesa and computed using E. Views-10.
Energies 16 01148 g004

6. Analysis and Findings of the Study

This section uses descriptive statistics, unit root tests, Granger causality tests, and an OLS regression test to examine the influence of crude oil price shocks on GDP per capita and the exchange rate (USD/INR). The data estimations and tests of the model were conducted by EVIEWS-10 software. This paper includes analysis presented as follows:
  • Normality test for the GDP and exchange rate effects of crude oil prices (USD/INR)
  • Stationarity for the Effects of Crude Oil Prices on GDP and Exchange Rates (USD/INR)
  • Granger Causality Test for the Impact of Oil Prices on GDP and Exchange Rate (USD/INR)
  • OLS Regression Test for GDP and exchange rate effects of crude oil prices (USD/INR)
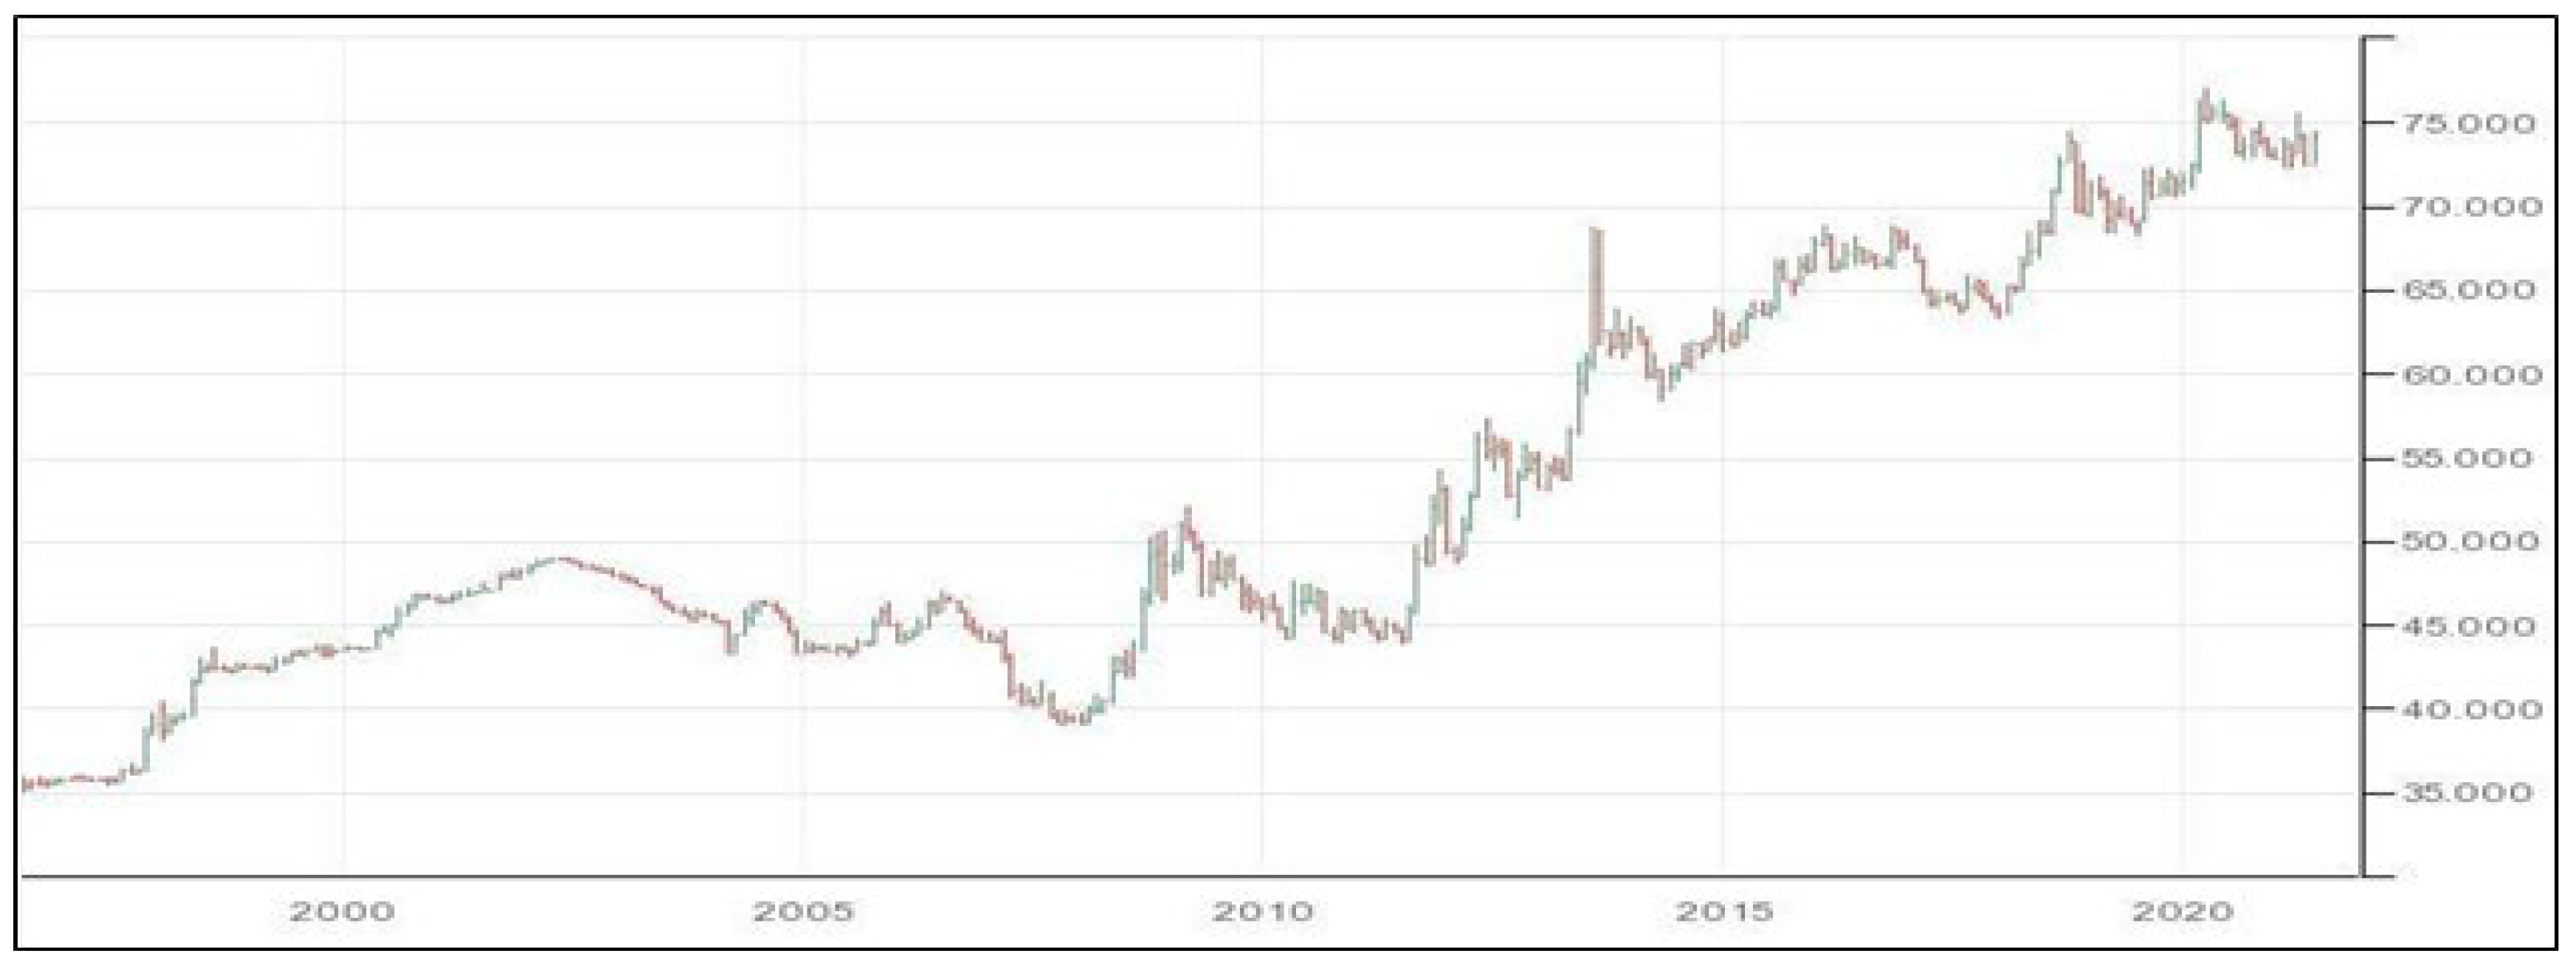
  • Graphical Expression for Crude Oil Price on GDP and Exchange Rate (USD/INR)

6.1. Normality Test for Crude Oil Price on GDP and Exchange Rate (USD/INR)

The statistical values of the sample variables were calculated in the first half of this section. As stated earlier, the descriptive statistics provide the historical context for the behaviour of sample variables’ data, such as GDP per capita, exchanges rates, and crude oil (Dubai crude and WTI crude), used in the study. From the results of descriptive statistics presented in Table 2, it is observed that the crude oil price, GDP, and exchange rate were not stable at all during the period from 1990 to 2020. It is to be noted that the Std. Dev., Skewness, Probability values, Minimum, Mean, Maximum, Kurtosis, and Jarque-Bera were used for the analysis of the sample variables. With respect to crude oil prices, WTI earned a high mean value of 0.05494, followed by Dubai crude oil prices (−0.001579), exchange rates (0.007888), and GDP per capita (−0.054688) during the study period. These values clearly established the volatility of the sample variables. From the differences between the maximum values (0.212836 for GDP, 0.200351 for exchange rate, 0.886789 for Dubai crude, and 0.581721 for WTI crude) and minimum values (−0.215476 for GDP, −0.170664 for exchange rate, −0.345377 for Dubai crude and −0.476589 for WTI crude), it is evident that the sample variables were extremely volatile during the study period. The measures of skewness indicated that all the sample variables, except WTI crude oil prices, skewed positively during the study period. It is significant to note from Table 1 that all the sample variables earned values of kurtosis larger than three, and values of Jarque-Bera (JB) were also greater than three. It is clear from the overall analysis of descriptive statistics that the sample variables (GDP per capita, exchanges rate, Dubai crude oil, and WTI crude) were normally distributed. Hence the null hypothesis, NH1—There is no normal distribution among the crude oil price shocks on GDP per capita and Exchange rates (USD/INR), was rejected during the study period.

6.2. Stationarity for Crude Oil on GDP and Exchange Rate (USD/INR)

The first stage was to look at the stationary property of sample variables’ time series data, choose the best econometric approach, and avoid getting false findings. The use of non-stationary variables in the time series analysis could lead to misleading inferences [53]. The results of the unit root test for the returns of GDP per capita, exchanges rate, and crude oil (Dubai crude and WTI crude), during the period from 1990 to 2020, are presented in Table 3. The presence of unit roots for all the sample variables in the mean equation was tested by applying ADF and PP tests. It is to be noted that the stationary level was analyzed at 1%, 5%, and 10% levels of significance. The probability values for all the four sample variables were zero on the basis of the two tools (ADF and PP). The statistical values using ADF test for all the sample variables were at −6.281444 for GDP, −3.921206 for exchanges rate, −4.808928 for WTI crude oil prices, and −4.799945 for Dubai Crude, while the statistical values of PP tests for sample variables were at −6.375143 for GDP, −3.956364 for exchanges rate, −4.775808 for WTI crude oil prices, and −4.793186 for Dubai crude oil prices. It is clear that these values were less than those of test critical values at 1%, 5%, and 10% levels of significance. Therefore, the results of the unit root test clearly revealed that the return data for all sample variables attained stationarity during the study period. Hence, the null hypothesis (NH2), namely, there is no stationarity among the crude oil price shocks on GDP per capita and exchange rates in India, was rejected.

6.3. Granger Causality Test for Crude Oil on GDP and Exchange Rate (USD/INR)

According to Figure 5, the inverse roots of AR characteristic polynomials were within the circle, and this confirmed the stability of the VAR model. Table 4 shows different lag length criteria for a VAR specification of the endogenous variables, with a maximum of five lags in each case. It is to be noted that lag order selection was based on AIC (Akaike Information Criterion), while an optimal lag length was five periods. Using the five (5) lag orders, the results of the Granger causality test [1,37] for the returns of GDP per capita, exchanges rate, and crude oil (Dubai crude and WTI crude), during the period from 1990 to 2020, are presented in Table 5. It is clear from the table that Dubai crude oil recorded a one-way unidirectional causal relationship (with F-Statistic values of 4.93553 and p Values of 0.0165) with exchange rates. Further, the study recorded one-way bidirectional causality relations between exchanges rates and WTI crude oil prices, with the value of F-Statistics (6.79922) and p Value (0.0048), during the study period. It is understood that GDP recorded a one-way causal relationship with WTI crude oil price during the study period. Hence, the null hypothesis (NH03)—There is no causal relationship among the crude oil price shocks on GDP per capita and exchange rate in India, was partially accepted.

6.4. OLS Regression Test for the Returns of Crude Oil Price Shocks on GDP per Capita, and Exchange Rate (USD/INR)

The returns of Dubai crude oil prices, GDP per capita, and exchange rates in India, from 1990 to 2020, were analysed by an OLS regression test, and the results are presented in Table 6. The price of crude oil was used as the dependent variable in the study’s analysis. The study used ordinary least square (OLS) to conduct the robustness check on a long-run basis. The OLS model is capable of addressing the endogeneity issue, simultaneity bias, and small sample bias. The analysis amply shows that during the study, GDP per capita (0.0012) and exchange rate (0.0003) had positive coefficient values. However, the R2 was 0.7909, the F-statistics value was 1.0669, and the probability (F-statistic) value was modest (0.3743) during the study period. The result of the Durbin–Watson statistic (2.1255) suggested residuals. Only one of the two variables, the exchange rate, had achieved the customary threshold of significance per the analysis of the Table 6. It is obvious that during the study period, variations in the price of Dubai’s crude oil had a statistically significant impact on changes in the values of the returns on exchange rates. Table 7 displays the findings of the OLS test for the WTI crude oil price for the years 1990 to 2020. It is clear that the sample variables’ coefficient values were positive. The price of WTI crude oil was regarded as the independent variable for the study’s analysis. Furthermore, during the study period, the R2 was 0.6926. According to the analysis of the F-statistic value, the study period, had a positive value (2.2255). The Durbin–Watson analysis (2.4284) revealed that there were residuals throughout the research period. Two variables, namely, GDP per capita and exchange rates, had reached conventional levels of significance, according to the table. It is obvious that during the study period, fluctuations in the price of WTI crude oil had a statistically significant impact on the returns for GDP per capita and exchange rates. As a result, part of the null hypothesis (NH04) that shocks to the price of crude oil have no effect on India’s GDP per capita or exchange rate was partially accepted.
The graphical expression for the impact of returns of crude oil prices (WTI crude oil price and Dubai crude oil price) on GDP per capita and exchange rates in India, during the study period from 1990 to 2020, is presented in Figure 6, Figure 7, Figure 8 and Figure 9. It is to be noted that the lines of all the sample variables showed more volatility during the study period. However, the values of crude oil prices experienced highly fluctuating movements, with positive sharp spikes in 1996, 2000, and 2014, while negative sharp spikes were observed in 1999, 2010, and 2015. It is clearly observed from the Figures that the movements in the Dubai crude oil price and exchange rate were in the same direction during the study period. Changes in the WTI crude oil price and GDP per capita and exchange rate also moved in the same direction during the study period.

7. Conclusions

Crude oil constitutes a crucial energy resource in the global economy [75], and therefore, understanding its behaviour has aroused the interest of many experts and decision makers in a variety of corporate enterprises and government agencies. A large body of academic study has proven that the changes in crude oil prices have impacted economic activities. India has been facing oil-related problems for many years, specifically due to its enhanced demand for crude oil in every sector of the economy, hence the study of the impact of oil price shocks on the national income. Besides, this study empirically investigated the effects of crude oil price shocks (Dubai crude oil price and TI crude oil price) on the exchange rates (USD/INR) and GDP per capita of India using annual data from January 1990 to December 2020. Time series data were used in this study to test the impact of global crude prices on the economic variables through descriptive statistics and theADF test, Granger causality test, and OLS regression test. The relationship between the two variables (Exchange rate (USD/INR) and GDP per capita) is crucial, particularly for developing countries such as India which have been heavily dependent on the import of crude oil and, therefore, subject to different exchange rate regimes [76,77]. The Granger causality test revealed significant bi-directional Granger causality between Dubai crude oil prices and exchange rates, while exchange rates reported a uni-directional Granger causality relationship with WTI crude oil prices. According to the OLS model, Dubai crude oil prices influenced exchange rates alone, but WTI crude oil price changes influenced GDP per capita and exchange rates during the study period. The present study has clearly found that the crude oil price impacted GDP per capita and exchange rates. Policymakers need to ensure adequate investments in renewable energies, and alternative energy systems should be developed using technological innovation. The switching over to these new energy systems should be the major priority of developing countries such as India, in order to minimize the effects of crude oil markets on the economy. The key policy recommendation derived from this analysis is that the Reserve Bank of India (RBI) should depreciate the rupee, first to restore much-needed exchange rate stability, then to stimulate domestic manufactures, and finally, to attract foreign capital inflows.

8. Limitations of this Study

This study suffered from the following limitations.
  • Only two crude oil indices, namely, the Dubai index and WTI index, were selected as the sample.
  • Only secondary data were used to support the study.
  • This study may potentially be subject to the limitations associated with various statistical techniques.

9. Scope for Further Research

  • Researchers could attempt to forecast other macro-economic variables, with reference to crude oil price movements.
  • A study of this nature could be conducted in comparison with other countries.
  • The study can be extended by using other econometric models to accommodate the breakpoints in the data series, which could give more insight into the data.

Author Contributions

C.K.: Conceptualization; Data curation; Formal analysis; Investigation; Writing—original draft, M.S.: Formal analysis; Investigation, B.M.: Investigation and Funding acquisition, L.P.D.: Investigation and Funding acquisition, M.B.: Investigation and Funding acquisition. All authors have read and agreed to the published version of the manuscript.

Funding

This research received no external funding.

Data Availability Statement

Not applicable.

Conflicts of Interest

The authors declare no conflict of interest.

References

  1. Gbatu, A.P.; Wang, Z.; Wesseh, P.K.; Tutdel, I.Y. Asymmetric and dynamic Effects of oil price shocks and exchange rate fluctuations: Evidence from a panel of economic community of West African States (ECOWAS). Int. J. Energy Econ. Policy 2017, 7, 1–3. [Google Scholar]
  2. Akpan, E.O. Oil price shocks and Nigeria’s macro economy. In Proceedings of the Annual Conference of CSAE Conference, Economic Development in Africa March, Oxford, UK, 17–19 March 2019; pp. 22–24. [Google Scholar]
  3. Ju, H.; Zhang, R. Optimal resource allocation in full-duplex wireless-powered communication network. IEEE Trans. Commun. 2014, 62, 3528–3540. [Google Scholar] [CrossRef] [Green Version]
  4. Babu, M.; Lourdesraj, A.A.; Hariharan, C.; Jayapal, G.; Indhumathi, G.; Sathya, J.; Kathiravan, C. Dynamics of Volatility Spillover between Energy and Environmental, Social and Sustainable Indices. Int. J. Energy Econ. Policy 2022, 50–55. [Google Scholar] [CrossRef]
  5. Akaike, H. A new look at the statistical model identification. IEEE Trans. Autom. Control. 1974, 19, 716–723. [Google Scholar] [CrossRef]
  6. Bjørnland, H.C. The dynamic effects of aggregate demand, supply and oil price shocks—A comparative study. Manch. Sch. 2000, 68, 578–607. [Google Scholar] [CrossRef]
  7. Kathiravan, C.; Selvam, M.; Maniam, B.; Venkateswar, S. Relationship between Crude Oil Price Changes and Airlines Stock Price: The Case of Indian Aviation Industry. Int. J. Energy Econ. Policy 2019, 9, 7–13. [Google Scholar] [CrossRef]
  8. Kathiravan, C.; Selvam, M.; Venkateswar, S. Investor behavior and weather factors: Evidences from Asian region. Ann. Oper. Res. 2021, 299, 349–373. [Google Scholar] [CrossRef]
  9. Edwards, E.A. Development of a new scale for measuring compulsive buying behavior. Financ. Couns. Plan. 1993, 4, 67–84. [Google Scholar]
  10. Hem, C.D.; Sundvold-Gjerstad, V.; Granum, S.; Koll, L.; Abrahamsen, G.; Buday, L.; Spurkland, A. T cell specific adaptor protein (TSAd) promotes interaction of Nck with Lck and SLP-76 in T cells. Cell Commun. Signal. 2015, 13, 31. [Google Scholar] [CrossRef] [Green Version]
  11. Bal, D.P.; Rath, B.N. Nonlinear Causality between Crude Oil Price and Exchange Rate: A Comparative Study of China and India. Energy Econ. 2015, 51, 149–156. [Google Scholar] [CrossRef]
  12. Planning Commission—Government of India. Government of India Planning Commission. 2006, Volume II. Available online: https://nhm.gov.in/images/pdf/publication/Planning_Commission/12th_Five_year_plan-Vol-1.pdf (accessed on 20 May 2021).
  13. Briefing, U.S. International energy outlook 2013. US Energy Inf. Adm. 2013, 506, 507. [Google Scholar]
  14. Burbidge, J.; Harrison, A. Testing for the effects of oil-price rises using vector auto regressions. Int. Econ. Rev. 1984, 25, 459–484. [Google Scholar] [CrossRef]
  15. Ng, S.; Perron, P. Unit root tests in ARMA models with data-dependent methods for the selection of the truncation lag. J. Am. Stat. Assoc. 1995, 90, 268–281. [Google Scholar] [CrossRef]
  16. Chen, S.S.; Chen, H.C. Oil prices and real exchange rates. Energy Econ. 2007, 29, 390–404. [Google Scholar] [CrossRef]
  17. Yu, L.; Wang, S.; Lai, K.K. Forecasting crude oil price with an EMD-based neural network ensemble learning paradigm. Energy Econ. 2008, 30, 2623–2635. [Google Scholar] [CrossRef]
  18. Cunado, J.; De Gracia, F.P. Oil prices, economic activity and inflation: Evidence for some Asian countries. Q. Rev. Econ. Financ. 2005, 45, 65–83. [Google Scholar] [CrossRef] [Green Version]
  19. Edwards, S. Openness, productivity and growth: What do we really know? Econ. J. 1998, 108, 383–398. [Google Scholar] [CrossRef] [Green Version]
  20. Wagner, J. Exports and productivity: A survey of the evidence from firm-level data. World Econ. 2007, 30, 60–82. [Google Scholar] [CrossRef] [Green Version]
  21. Frankel, J.A.; Romer, D.H. Does trade cause growth? Am. Econ. Rev. 1999, 89, 379–399. [Google Scholar] [CrossRef] [Green Version]
  22. Cunado, J.; Jo, S.; de Gracia, F.P. Macroeconomic impacts of oil price shocks in Asian economies. Energy Policy 2015, 86, 867–879. [Google Scholar] [CrossRef]
  23. Dabachi, U.M.; Mahmood, S.; Ahmad, A.U.; Ismail, S.; Farouq, I.S.; Jakada, A.H.; Kabiru, K. Energy consumption, energy price, energy intensity environmental degradation, and economic growth nexus in African OPEC countries: Evidence from simultaneous equations models. J. Environ. Treat. Tech. 2020, 8, 403–409. [Google Scholar]
  24. Almulali, U.; Sab, C.N.B.C. Exploring the impact of oil revenues on OPEC members’ macroeconomy. OPEC Energy Rev. 2013, 37, 416–428. [Google Scholar] [CrossRef]
  25. Cologni, A.; Manera, M. The asymmetric effects of oil shocks on output growth: A Markov–Switching analysis for the G-7 countries. Econ. Model. 2009, 26, 1–29. [Google Scholar] [CrossRef] [Green Version]
  26. Mensah, G.A.; Wei, G.S.; Sorlie, P.D.; Fine, L.J.; Rosenberg, Y.; Kaufmann, P.G.; Mussolino, M.E.; Hsu, L.L.; Addou, E.; Engelgau, M.M.; et al. Decline in cardiovascular mortality: Possible causes and implications. Circ. Res. 2017, 120, 366–380. [Google Scholar] [CrossRef]
  27. Camarero, M.; Tamarit, C. Oil prices and Spanish competitiveness: A cointegrated panel analysis. J. Policy Model. 2002, 24, 591–605. [Google Scholar] [CrossRef]
  28. Zhang, Y.J.; Fan, Y.; Tsai, H.T.; Wei, Y.M. Spillover effect of us dollar exchange rate on oil prices. J. Policy Model. 2008, 30, 973–991. [Google Scholar] [CrossRef]
  29. Ghosh, S. Examining crude oil price-exchange rate nexus for India during the period of extreme oil price volatility. Appl. Energy 2011, 88, 1886–1889. [Google Scholar] [CrossRef]
  30. Turhan, M.I.; Sensoy, A.; Hachihasanoglu, E. A comparative analysis of the dynamic relationship between oil prices and exchange rates. J. Int. Financ. Mark. Inst. Money 2014, 32, 397–414. [Google Scholar] [CrossRef]
  31. Mork, K.A. Oil and the macroeconomy when prices go up and down: An extension of Hamilton’s results. J. Political Econ. 1989, 97, 740–744. [Google Scholar] [CrossRef]
  32. Ferderer, J.P. Oil price volatility and the macroeconomy. J. Macroecon. 1996, 18, 1–26. [Google Scholar] [CrossRef]
  33. Kilian, L. The economic effects of energy price shocks. J. Econ. Lit. 2008, 46, 871–909. [Google Scholar] [CrossRef] [Green Version]
  34. Rahman, S.; Serletis, A. Oil price uncertainty and the Canadian economy: Evidence from a VARMA, GARCH-in-Mean, asymmetric BEKK model. Energy Econ. 2012, 34, 603–610. [Google Scholar] [CrossRef]
  35. Narayan, P.K.; Sharma, S.S. Firm return volatility and economic gains: The role of oil prices. Econ. Model. 2014, 38, 142–151. [Google Scholar] [CrossRef]
  36. Hamilton, J.D. Oil and the macroeconomy since World War II. J. Political Econ. 1983, 91, 228–248. [Google Scholar] [CrossRef]
  37. Kathiravan, C.; Selvam, M.; Kannaiah, D.; Lingaraja, K.; Thanikachalam, V. On the relationship between weather and Agricultural Commodity Index in India: A study with reference to Dhaanya of NCDEX. Qual. Quant. 2019, 53, 667–683. [Google Scholar] [CrossRef]
  38. Lorusso, M.; Pieroni, L. Causes and consequences of oil price shocks on the UK economy. Econ. Model. 2018, 72, 223–236. [Google Scholar] [CrossRef] [Green Version]
  39. Basak, S.; Pavlova, A. A model of financialization of commodities. J. Financ. 2016, 71, 1511–1556. [Google Scholar] [CrossRef] [Green Version]
  40. Kilian, L. Not all oil price shocks are alike: Disentangling demand and supply shocks in the crude oil market. Am. Econ. Rev. 2009, 99, 1053–1069. [Google Scholar] [CrossRef] [Green Version]
  41. Cavalcanti, T.; Jalles, J.T. Macroeconomic effects of oil price shocks in Brazil and in the United States. Appl. Energy 2013, 104, 475–486. [Google Scholar] [CrossRef]
  42. Loungani, P. Oil price shocks and the dispersion hypothesis. Rev. Econ. Stat. 1986, 68, 536–539. [Google Scholar] [CrossRef]
  43. Filis, G.; Degiannakis, S.; Floros, C. Dynamic correlation between stock market and oil prices: The case of oil-importing and oil-exporting countries. Int. Rev. Financ. Anal. 2011, 20, 152–164. [Google Scholar] [CrossRef]
  44. Murshed, M. An empirical analysis of the non-linear impacts of ICT-trade openness on renewable energy transition, energy efficiency, clean cooking fuel access and environmental sustainability in South Asia. Environ. Sci. Pollut. Res. 2020, 27, 36254–36281. [Google Scholar] [CrossRef] [PubMed]
  45. Jiménez-Rodríguez, R.; Sánchez, M. Oil price shocks and real GDP growth: Empirical evidence for some OECD countries. Appl. Econ. 2005, 37, 201–228. [Google Scholar] [CrossRef]
  46. Ratti, R.A.; Vespignani, J.L. Why are crude oil prices high when global activity is weak? Econ. Lett. 2013, 121, 133–136. [Google Scholar] [CrossRef]
  47. Lingaraja, K.; Mohan, C.; Selvam, M.; Raja, M.; Kathiravan, C. Exchange rate volatility and causality effect of Sri Lanka (LKR) with Asian emerging countries currency against USD. Int. J. Manag. 2020, 11. [Google Scholar]
  48. Nazlioglu, S.; Gupta, R.; Bouri, E. Movements in international bond markets: The role of oil prices. Int. Rev. Econ. Financ. 2020, 68, 47–58. [Google Scholar] [CrossRef]
  49. Sreenu, N. A Study of Advance Capital Assets Pricing Model (CAPM) and Three Factor Model of FAMA: The France Context. IPE J. Manag. 2016, 6, 1. [Google Scholar]
  50. Gbatu, A.P.; Wang, Z.; Wesseh, P.K., Jr.; Tutdel, I.Y. The impacts of oil price shocks on small oil-importing economies: Time series evidence for Liberia. Energy 2017, 139, 975–990. [Google Scholar] [CrossRef]
  51. Usman, M.; Kousar, R.; Yaseen, M.R.; Makhdum, M.S. An empirical nexus between economic growth, energy utilization, trade policy, and ecological footprint: A continent-wise comparison in upper-middle-income countries. Environ. Sci. Pollut. Res. 2020, 27, 38995–39018. [Google Scholar] [CrossRef]
  52. Widarjono, A.; Anto, M.; Fakhrunnas, F. Financing Risk in Indonesian Islamic Rural Banks: Do Financing Products Matter? J. Asian Financ. Econ. Bus. 2020, 7, 305–314. [Google Scholar] [CrossRef]
  53. Kathiravan, C.; Selvam, M.; Maniam, B.; Dharani, M. Effect of weather on stock market: A literature review and research agenda. Cogent Econ. Financ. 2021, 9, 1971353. [Google Scholar] [CrossRef]
  54. Anashasy, E.A.; Bradley, M.D.; Joutz, F. Evidence on the Role of Oil Prices in Venezuela’s Economics Performance (1950–2001); Working Paper; University of Washington: Seattle, WA, USA, 2005. [Google Scholar]
  55. El Anshasy, A. Oil prices and economic growth in oil-exporting countries. In Proceedings of the 32nd International IAEE Conference, San Francisco, CA, USA, 21–24 June 2009. [Google Scholar]
  56. Farzanegan, M.R.; Markwardt, G. The effects of oil price shocks on the Iranian economy. Energy Econ. 2009, 31, 134–151. [Google Scholar] [CrossRef] [Green Version]
  57. Mendoza, O.; Vera, D. The asymmetric effects of oil shocks on an oil-exporting economy. Cuad. Econ. 2010, 47, 3–13. [Google Scholar] [CrossRef] [Green Version]
  58. Fezzani, B.; Nartova, D. Oil prices fluctuation impact on Iraq’s economy. Eur. J. Soc. Sci. 2011, 26, 626–633. [Google Scholar]
  59. Moshiri, S.; Banihashem, A. Asymmetric effects of oil price shocks on economic growth of oil-exporting countries. SSRN 2012, 2006763. [Google Scholar] [CrossRef]
  60. Ito, K. The impact of oil price volatility on the macroeconomy in Russia. Ann. Region. Sci. 2012, 48, 695–702. [Google Scholar] [CrossRef]
  61. Alkhathlan, K.; Javid, M. Energy consumption, carbon emissions and economic growth in Saudi Arabia: An aggregate and disaggregate analysis. Energy Policy 2013, 62, 1525–1532. [Google Scholar] [CrossRef]
  62. Nwani, C.; Orie, J.B. Economic growth in oil-exporting countries: Do stock market and banking sector development matter? Evidence from Nigeria. Cogent Econ. Financ. 2016, 4, 1153872. [Google Scholar] [CrossRef] [Green Version]
  63. Nusair, S.A. The effects of oil price shocks on the economies of the Gulf Co-operation Council countries: Nonlinear analysis. Energy Policy 2016, 91, 256–267. [Google Scholar] [CrossRef]
  64. Benramdane, A. Oil price volatility and economic growth in Algeria. Energy Sources Part B Econ. Plan. Policy 2017, 12, 338–343. [Google Scholar] [CrossRef]
  65. Sadeghi, A. Oil Price Shocks and Economic Growth in Oil-Exporting Countries: Does the Size of Government Matter? Int. Monet. Fund 2017. [Google Scholar] [CrossRef]
  66. Vohra, R. The impact of oil prices on GCC economies. Int. J. Bus. Soc. Sci. 2017, 8, 7–14. [Google Scholar]
  67. Foudeh, M. The long run effects of oil prices on economic growth: The case of Saudi Arabia. Int. J. Energy Econ. Policy 2017, 7, 171. [Google Scholar]
  68. Alekhina, V.; Yoshino, N. Impact of world oil prices on an energy exporting economy including monetary policy. ADBI Work. Pap. 2018. [Google Scholar]
  69. Taghizadeh-Hesary, F.; Yoshino, N.; Rasoulinezhad, E.; Chang, Y. Trade linkages and transmission of oil price fluctuations. Energy Policy 2019, 133, 110872. [Google Scholar] [CrossRef]
  70. Balashova, S.; Serletis, A. Oil prices shocks and the Russian economy. J. Econ. Asymm. 2020, 21, e00148. [Google Scholar] [CrossRef]
  71. Abdelsalam, M.A. Oil price fluctuations and economic growth: The case of MENA countries. Rev. Econ. Political Sci. 2020. [Google Scholar] [CrossRef]
  72. Jahangir, S.R.; Dural, B.Y. Crude oil, natural gas, and economic growth: Impact and causality analysis in Caspian Sea region. Int. J. Manag. Econ. 2018, 54, 169–184. [Google Scholar] [CrossRef] [Green Version]
  73. Jiménez-Rodríguez, R. Oil price shocks and stock markets: Testing for non-linearity. Empir. Econ. 2015, 48, 1079–1102. [Google Scholar] [CrossRef]
  74. Mukhtarov, S.; Aliyev, S.; Mikayilov, J.I.; Ismayilov, A.; Rzayev, A. The FDI-CO2 nexus from the sustainable development perspective: The case of Azerbaijan. Int. J. Sustain. Dev. World Ecol. 2021, 28, 246–254. [Google Scholar] [CrossRef]
  75. Mankiw, N.G.; Romer, D.; Weil, D.N. A contribution to the empirics of economic growth. Q. J. Econ. 1992, 107, 407–437. [Google Scholar] [CrossRef]
  76. Demirer, R.; Jategaonkar, S.P.; Khalifa, A.A. Oil price risk exposure and the cross-section of stock returns: The case of net exporting countries. Energy Econ. 2015, 49, 132–140. [Google Scholar] [CrossRef]
  77. Silvapulle, P.; Smyth, R.; Zhang, X.; Fenech, J.P. Nonparametric panel data model for crude oil and stock market prices in net oil importing countries. Energy Econ. 2017, 67, 255–267. [Google Scholar] [CrossRef]
Figure 5. AR Characteristic Polynomial of the Endogenous Graph of the Crude Oil Price Shocks on GDP per Capita, and Exchange Rate in India during the period from 1990 to 2020; Source: Developed by authors.
Energies 16 01148 g005
Figure 6. Graphical Expression for the Return Data of Exchange Rates of US dollar (US $)/Indian Rupee (INR), GDP per Capita and Dubai Crude Oil Price in US dollar (US $) during 1990 to 2020; Sources: Compiled from https://www.imf.org/en/Data, https://databank.worldbank.org/home.aspx, and https://fred.stlouisfed.org/categoriesa, and computed using E. Views-10.
Energies 16 01148 g006
Figure 7. Graphical Expression for the Return Data of Exchange Rates of US dollar (US $)/Indian Rupee (INR), GDP per Capita and WTI Crude Oil Price in US dollar (US $) during 1990 to 2020; Sources: Compiled from https://www.imf.org/en/Data, https://databank.worldbank.org/home.aspx, and https://fred.stlouisfed.org/categoriesa, and computed using E. Views-10.
Energies 16 01148 g007
Figure 8. Graphical Expression for the Return Data of Exchange Rates of US dollar (US $)/Indian Rupee (INR), GDP per Capita, WTI Crude Oil Price in US dollar (US $), and during 1990 to 2020; Sources: Compiled from https://www.imf.org/en/Data, https://databank.worldbank.org/home.aspx, and https://fred.stlouisfed.org/categoriesa, and computed using E. Views-10.
Energies 16 01148 g008
Figure 9. Graphical Expression for the Return Data of Exchange Rates of US dollar (US $)/Indian Rupee (INR), GDP per Capita, WTI Crude Oil Price in US dollar (US $), and during 1990 to 2020; Sources: Compiled from https://www.imf.org/en/Data, https://databank.worldbank.org/home.aspx, and https://fred.stlouisfed.org/categoriesa, and computed using E. Views-10.
Energies 16 01148 g009
Table 1. Executive Summary on the Literature Review.
Authors DetailsCountryCrude Oil Impact on GDP
El Anshasy (2009) [55]15 oil-exporting countriesPositive effect
Farzanegan, M.R (2009) [56]IranPositive effect
Mendoza and Vera (2010) [57]VenezuelaPositive effect
Fezzani and Nartova (2011) [58]IraqPositive effect
Moshiri and Banihashem (2012) [59]Kuwait and Saudi ArabiaNegative effect
Ito (2012) [60]RussiaNegative effect
Alkhathlan (2013) [61]Saudi ArabiaNegative effect
Nwani and Orie (2016) [62]NigeriaPositive effect
Nusair (2016) [63]Gulf Cooperation Council (GCC) countriesPositive effect
Benramdane (2017) [64]AlgeriaPositive effect
Sadeghi (2017) [65]28 oil-exporting countriesPositive effect
Vohra (2017) [66]Gulf Cooperation Council (GCC) countriesPositive effect
Foudeh (2017) [67]Saudi ArabiaPositive effect
Alekhina and Yoshino (2018) [68]Non-OPEC countriesPositive effect
Taghizadeh-Hesary et al. (2019) [69]oil exporting CountriesPositive effect
Balashova, and Serletis (2020) [70]RussiaPositive effect
Abdelsalam (2020) [71]MENA countriesPositive effect
Table 2. The Results of Descriptive Statistics for Crude Oil Price on GDP and Exchange Rate (USD/INR) during the period from 1990 to 2020.
VariablesGDP
(USD)
Exchange Rate (USD/INR)Sample Crude Oils
Descriptive
Statistics
Dubai Crude (USD)WTI (USD)
Mean−0.0546880.007888−0.0015790.05494
Max.0.2128360.2003510.8867890.581721
Mini.−0.215476−0.170664−0.345377−0.476589
Std. Dev.0.0802180.0891520.2767790.237845
Skew.0.8822290.1092261.352391−0.071378
Kurt.5.613162.6961744.9750492.812809
Jarque-Bera12.42748.17503914.020839.069275
Prob.0.0020020.0062010.0009020.005956
Sources: Compiled from https://www.imf.org/en/Data, https://databank.worldbank.org/home.aspx, https://fred.stlouisfed.org/categoriesa and computed using E. Views-10. Note: WTI—West Texas Intermediate; GDP—Gross domestic product; USD—US Dollar; INR—Indian Rupee.
Table 3. The Results of Unit Root Test for Crude Oil Price on GDP and Exchange Rate in India during the period from 1990 to 2020.
ADFPP
GDP (USD)t-StatisticProb.t-StatisticProb.
−6.2814440−6.3751430
Test critical values:1% level−3.679322−3.679322
5% level−2.967767−2.967767
10% level−2.622989−2.622989
Exchange rate (USD/INR)t-StatisticProb.t-StatisticProb.
−3.9212060.0056−3.9563640.0051
Test critical values:1% level−3.679322−3.679322
5% level−2.967767−2.967767
10% level−2.622989−2.622989
WTI (USD)t-StatisticProb.t-StatisticProb.
−4.8089280.0006−4.7758080.0006
Test critical values:1% level−3.679322−3.679322
5% level−2.967767−2.967767
10% level−2.622989−2.622989
Dubai Crude (USD)t-StatisticProb.t-StatisticProb.
−4.7999450.0006−4.7931860.0006
Test critical values:1% level−3.679322−3.679322
5% level−2.967767−2.967767
10% level−2.622989−2.622989
Source: Compiled from https://www.imf.org/en/Data, https://databank.worldbank.org/home.aspx and https://fred.stlouisfed.org/categoriesa and computed using E. Views-10. Note: Critical Value at 1%, 5% and 10% levels of significance.
Table 4. Lag Order Selection Criteria for Crude Oil Price Shocks on GDP per Capita, and Exchange Rate in India during the period from 1990 to 2020.
LagLogLLRFPEAICSCHQ
070.64681NA5.68 × 10−8−5.331745−5.136725−5.277655
1106.395457.197781.20 × 10−8−6.911634−5.936533−6.641183
2117.630414.380801.96 × 10−8−6.530434−4.775253−6.043622
3134.080515.792092.59 × 10−8−6.566442−4.031180−5.863268
4154.421413.018143.85 × 10−8−6.913709−3.598367−5.994174
5225.738022.821322.95 × 10−9−11.33904−7.243617−10.20314
Sources: Compiled from https://www.imf.org/en/Data, https://databank.worldbank.org/home.aspx, and https://fred.stlouisfed.org/categoriesa, and computed using E. Views-10.
Table 5. Results of Granger Causality for the Returns of Crude Oil Price Shocks on GDP per Capita, and Exchange Rate in India during the period from 1990 to 2020.
Null Hypothesis (H0)F-StatisticProb.Decision
Exchanges does not Granger Cause Dubai Crude2.184170.1354Don’t Reject H0
Dubai Crude does not Granger Cause Exchanges4.935530.0165Reject H0
GDP does not Granger Cause Dubai Crude2.254330.1276Don’t Reject H0
Dubai Crude does not Granger Cause GDP1.086340.3541Don’t Reject H0
WTI does not Granger Cause Dubai Crude0.202260.8183Don’t Reject H0
Dubai Crude does not Granger Cause WTI68.77682.0010Don’t Reject H0
GDP does not Granger Cause EXCHANGES0.37510.6913Don’t Reject H0
Exchanges does not Granger Cause GDP0.171720.8433Don’t Reject H0
WTI does not Granger Cause Exchanges1.629210.2179Don’t Reject H0
Exchanges does not Granger Cause WTI6.799220.0048Reject H0
WTI does not Granger Cause GDP1.037750.3703Don’t Reject H0
GDP does not Granger Cause WTI3.603390.0435Reject H0
Sources: Compiled from https://www.imf.org/en/Data, https://databank.worldbank.org/home.aspx, and https://fred.stlouisfed.org/categoriesa, and computed using E. Views-10.
Table 6. The Results of OLS Regression Analysis for Analyzing the Impact of Dubai Crude Oil Price and National Income during the period from 1990 to 2020.
VariablesCoefficientStd. ErrortSig.
(Constant)0.09780.0932−3.7560.000
GDP per capita0.00120.00480.00250.954
Exchange rate0.00030.00020.00050.006
R-squared0.7909F-statistic1.0669
Durbin–Watson stat2.1255Prob (F-statistic)0.3743
Dependent Variable: Dubai crude oil price
Sources: Compiled from https://www.imf.org/en/Data, https://databank.worldbank.org/home.aspx, and https://fred.stlouisfed.org/categoriesa, and computed using E. Views-10.
Table 7. The Results of OLS Regression Analysis for Analyzing the Impact of WTI Crude Oil Price and National Income during from 1990 to 2020.
VariablesCoefficientStd. ErrortSig.
(Constant)0.007850.000492.05440.01701
GDP per capita−0.006010.020042.622090.0600
Exchange rate0.001090.018052.093050.0120
R-squared0.6926F-statistic1.0563
Durbin–Watson stat2.2255Prob (F-statistic)0.6474
Dependent Variable: WTI crude oil price
Sources: Compiled from https://www.imf.org/en/Data, https://databank.worldbank.org/home.aspx, and https://fred.stlouisfed.org/categoriesa, and computed using E. Views-10.
Disclaimer/Publisher’s Note: The statements, opinions and data contained in all publications are solely those of the individual author(s) and contributor(s) and not of MDPI and/or the editor(s). MDPI and/or the editor(s) disclaim responsibility for any injury to people or property resulting from any ideas, methods, instructions or products referred to in the content.

