
Development and Research of a Promising Pumpless Liquid Cooling System for Reciprocating Compressors

Abstract
:1. Introduction
- The first group of pumpless liquid cooling systems, using a pressure surge on the discharge, is more efficient, because two goals are achieved at once. The first goal is to eliminate the pressure surge and, accordingly, reduce the loss of work in the discharge process, which leads to an increase in indicator efficiency. The second goal is the movement of the coolant, i.e., movement of the coolant due to an unnecessary pressure surge in the discharge line;
- However, it should be noted that with a properly designed discharge line in a reciprocating compressor, the pressure surge is small and there is no large flow rate of liquid in the compressor cooling system;
- The second pumpless liquid cooling system increases the coolant flow rate due to the suction pressure drop, which is very important when the compressor operates at high crankshaft speed and pressure ratios.
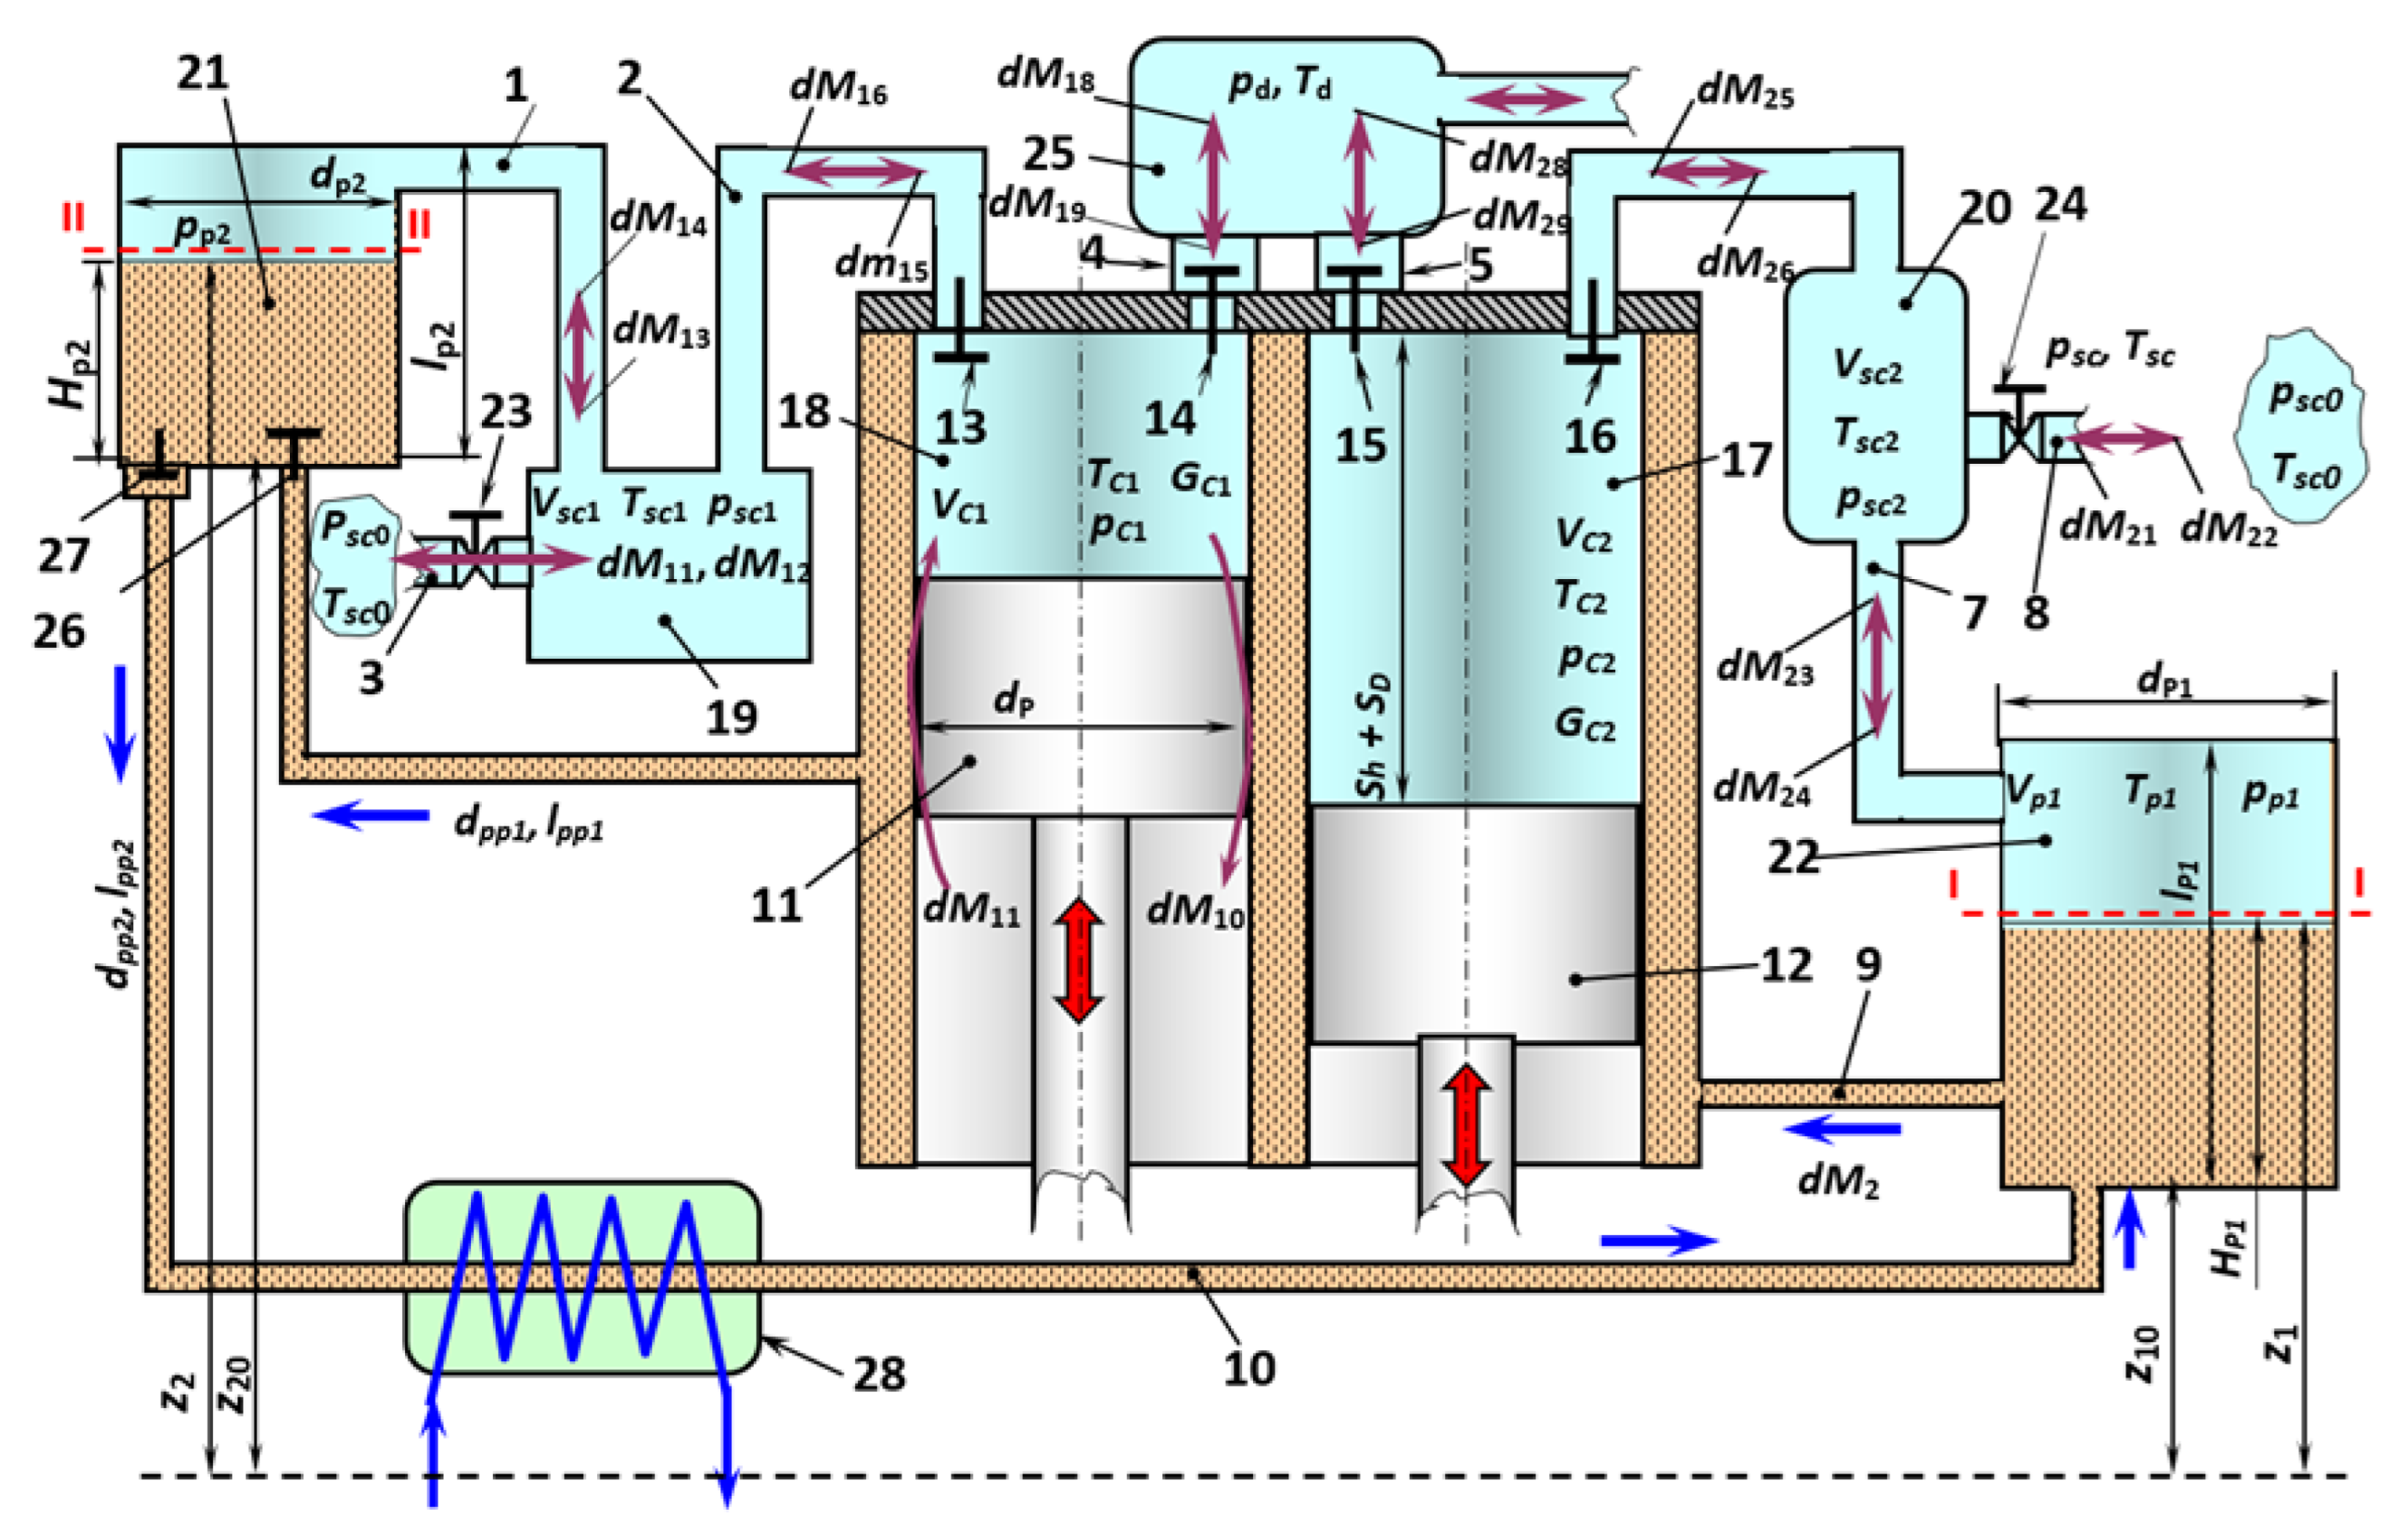
2. Conceptual Model of Work Processes
3. Materials and Methods
- Cavities of alternating and constant volume without liquid (19, 18, 17, 25, 20);
- Cavities of constant volume, partially filled with fluid (21, 22);
- Gas pipes (1, 2, 3, 4, 5, 6, 7, 8), connecting cavities;
- Liquid pipes (9, 10).
3.1. Mathematical Model of Compressor Section Work Processes
- Equation of conservation of energy in the form of the first law of thermodynamics of a body of variable mass;
- Equation of conservation of mass;
- Equation of change in the volume of the working cavity;
- Specific gas equation;
- Equation of dynamics of movement of the blocking element of a self-acting valve.
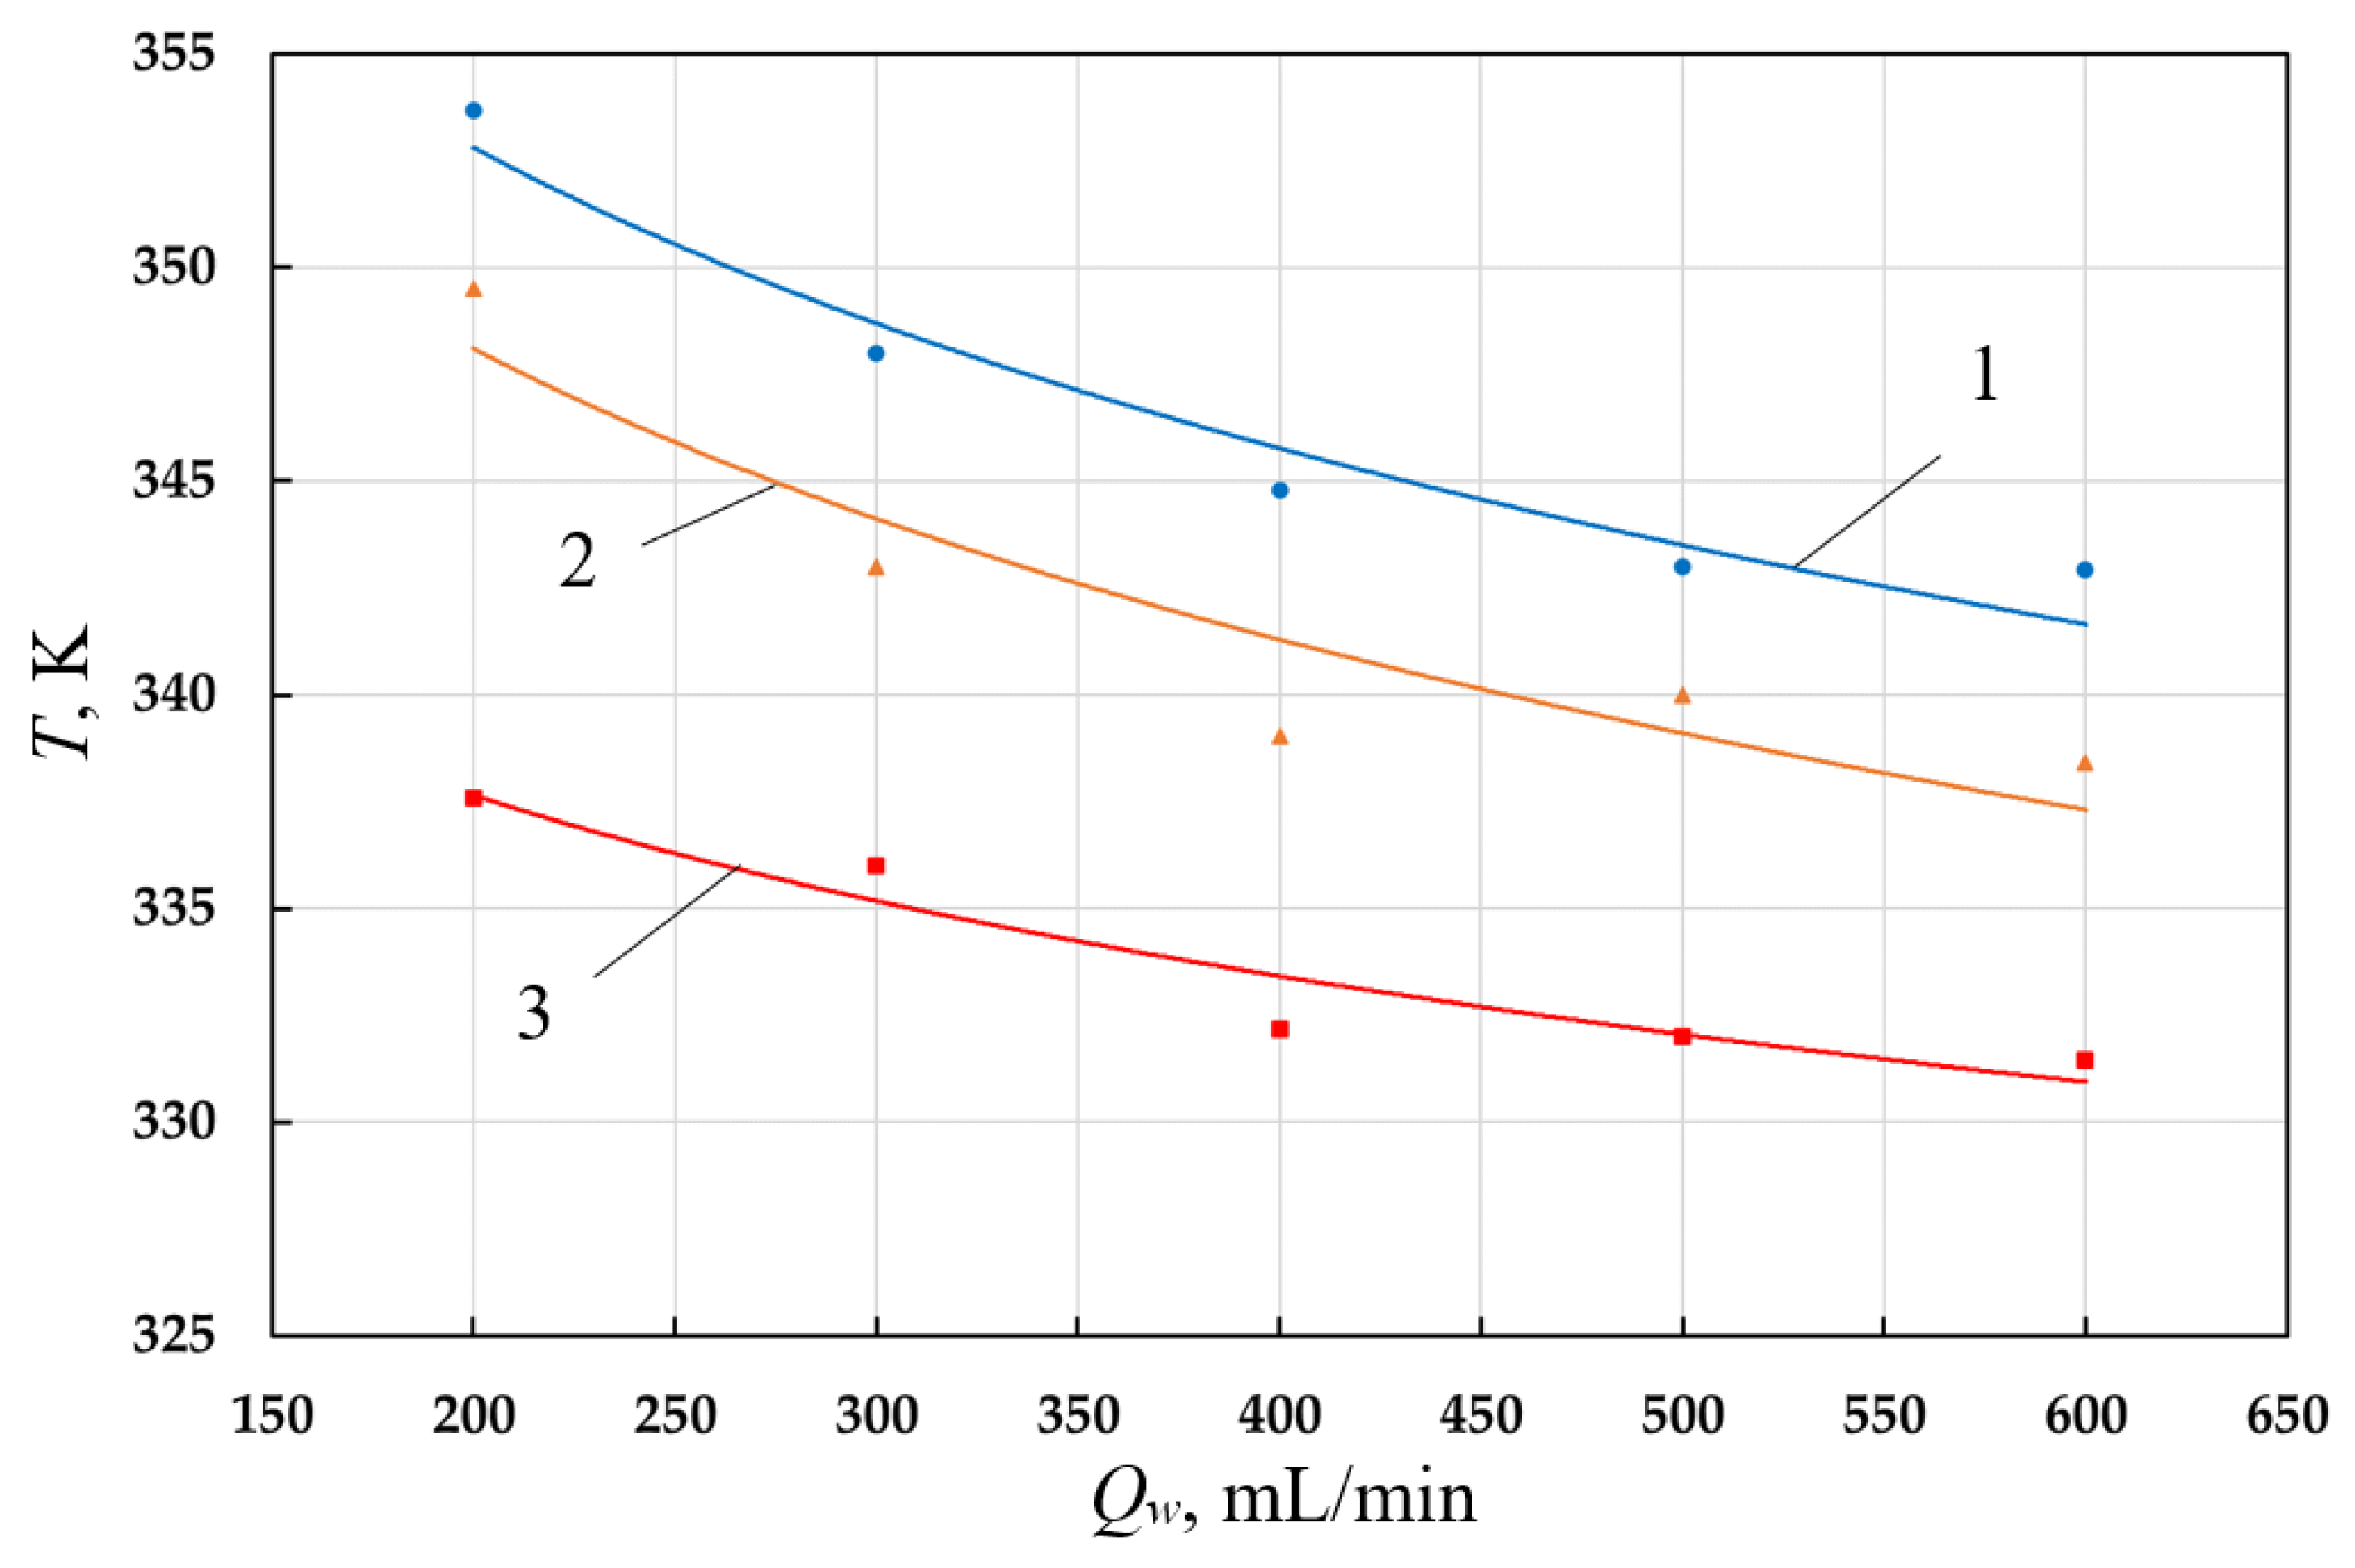
- water
- oil
- antifreeze
3.2. Mathematical Model of Fluid Flow in a Gas Pipe
- for the left border, x = 0
- for the right border, x = lpp
- gas flow is isothermal and quasi-stationary;
- inertial forces are negligible.
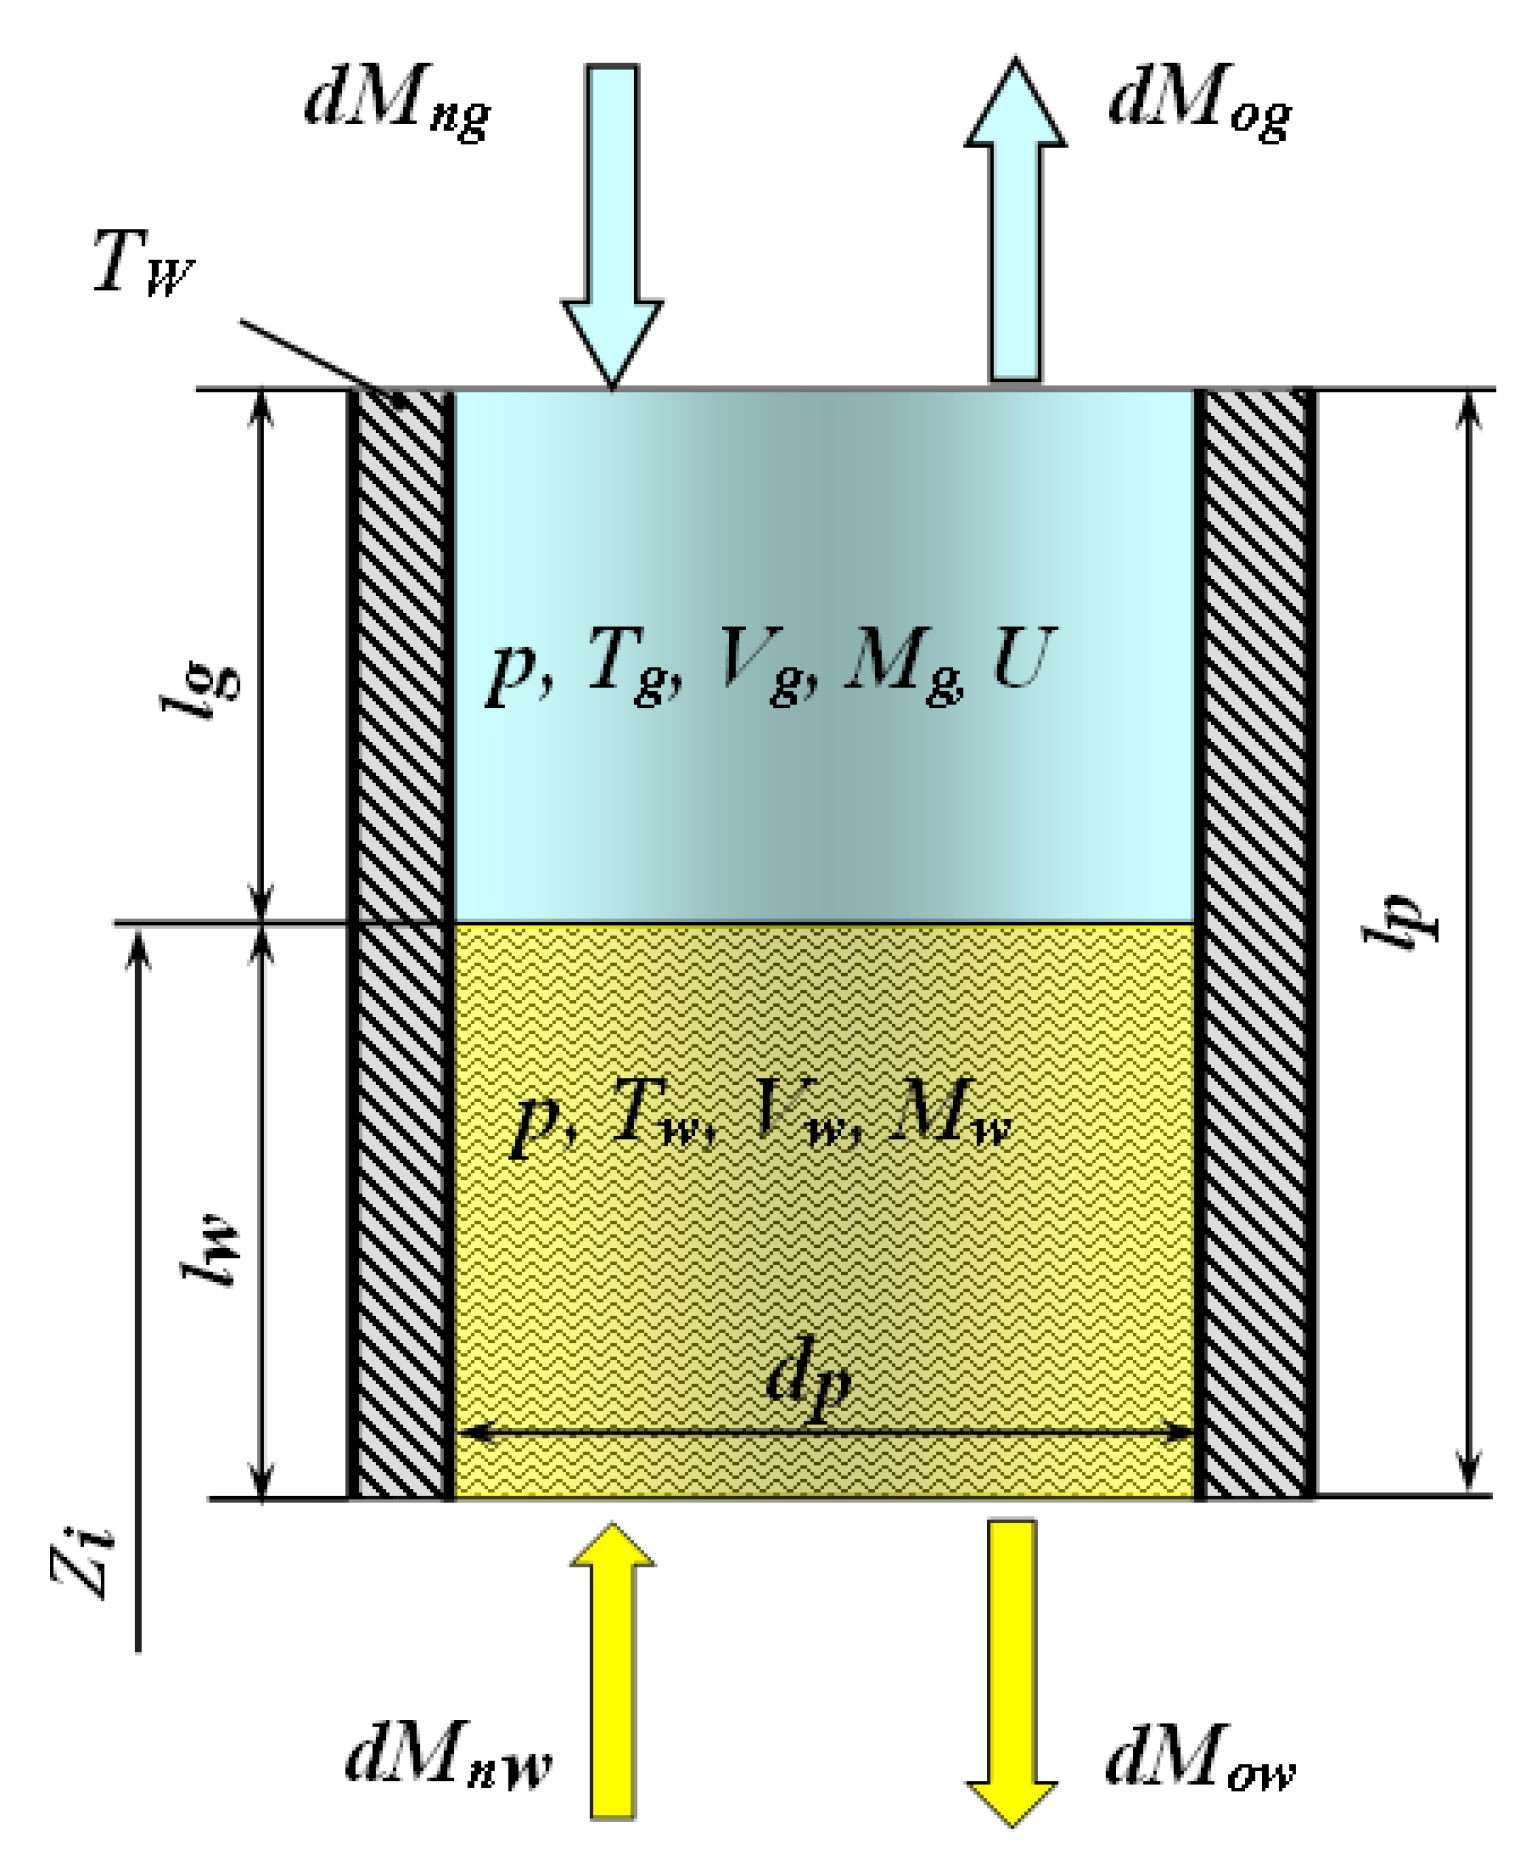
3.3. Mathematical Model of Work Processes in a Constant Pressure Cavity Partially Filled with Liquid
3.4. Mathematical Model of Fluid Flow in Connecting Pipes
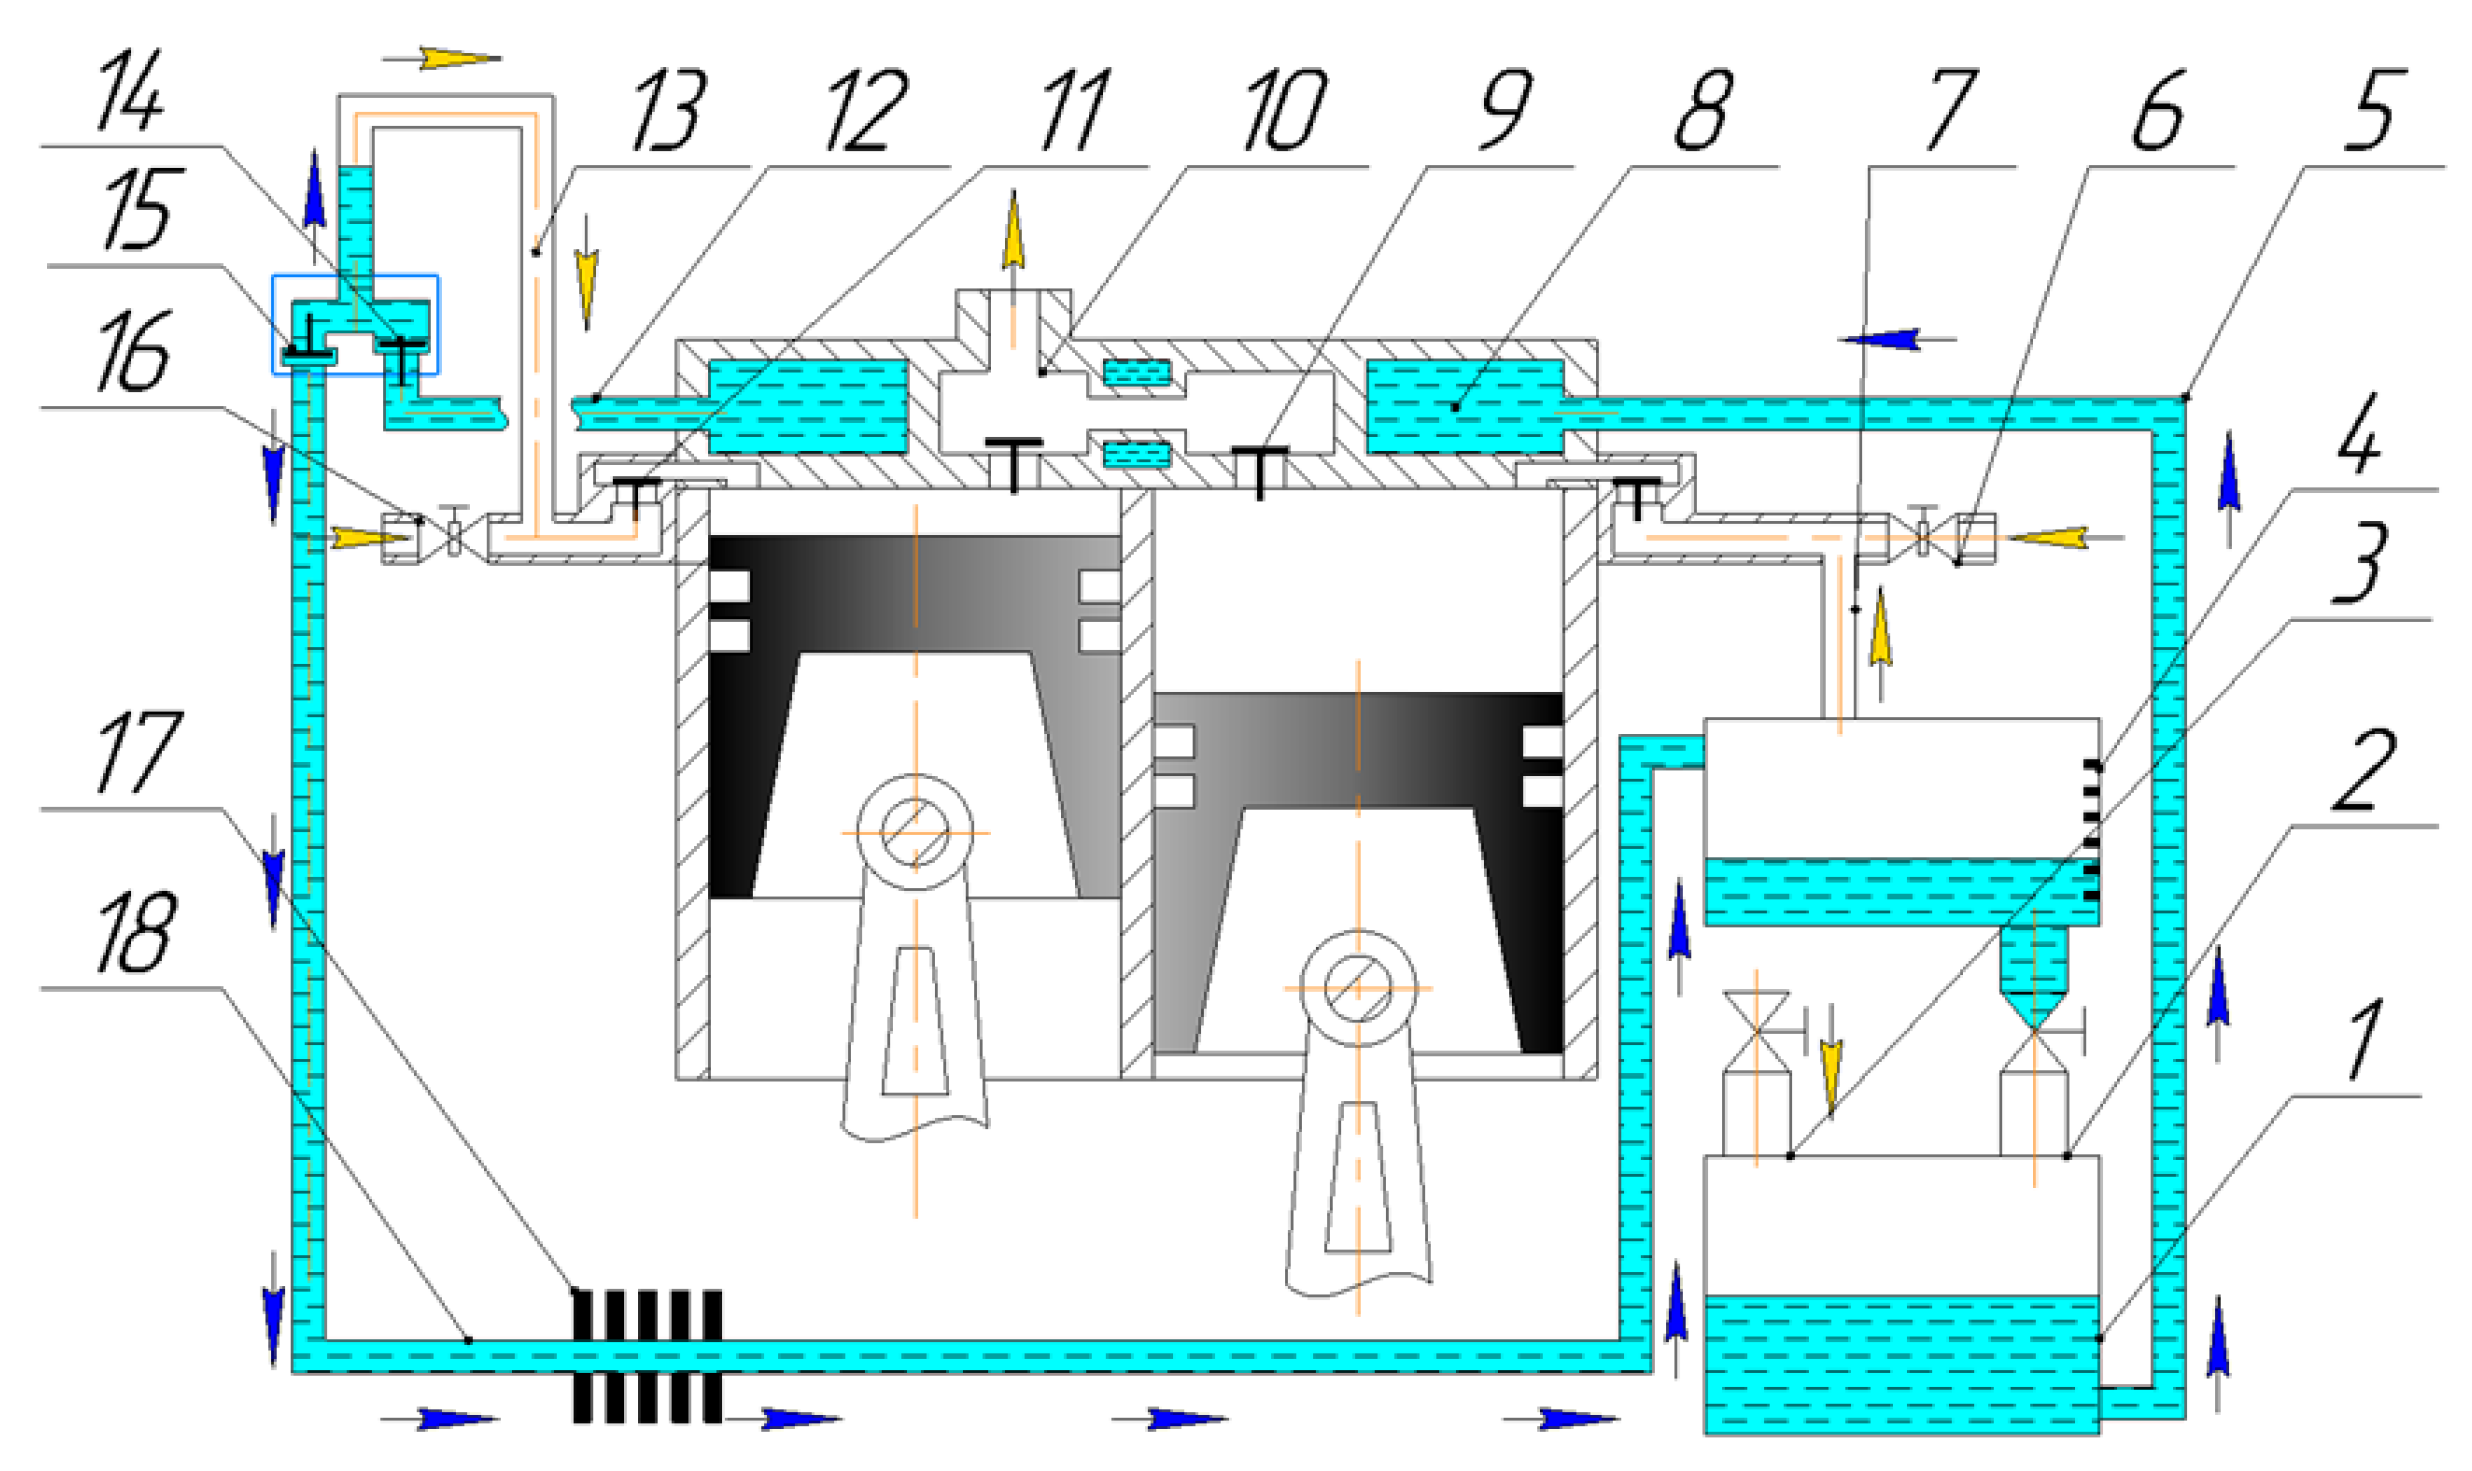
4. Experimental Studies
4.1. Description of the Experimental Stand for Its Research
4.2. Main Results of Experiments
4.3. Validation of the Mathematical Model of Work Processes
5. Results of the Numerical Experiment and Discussion
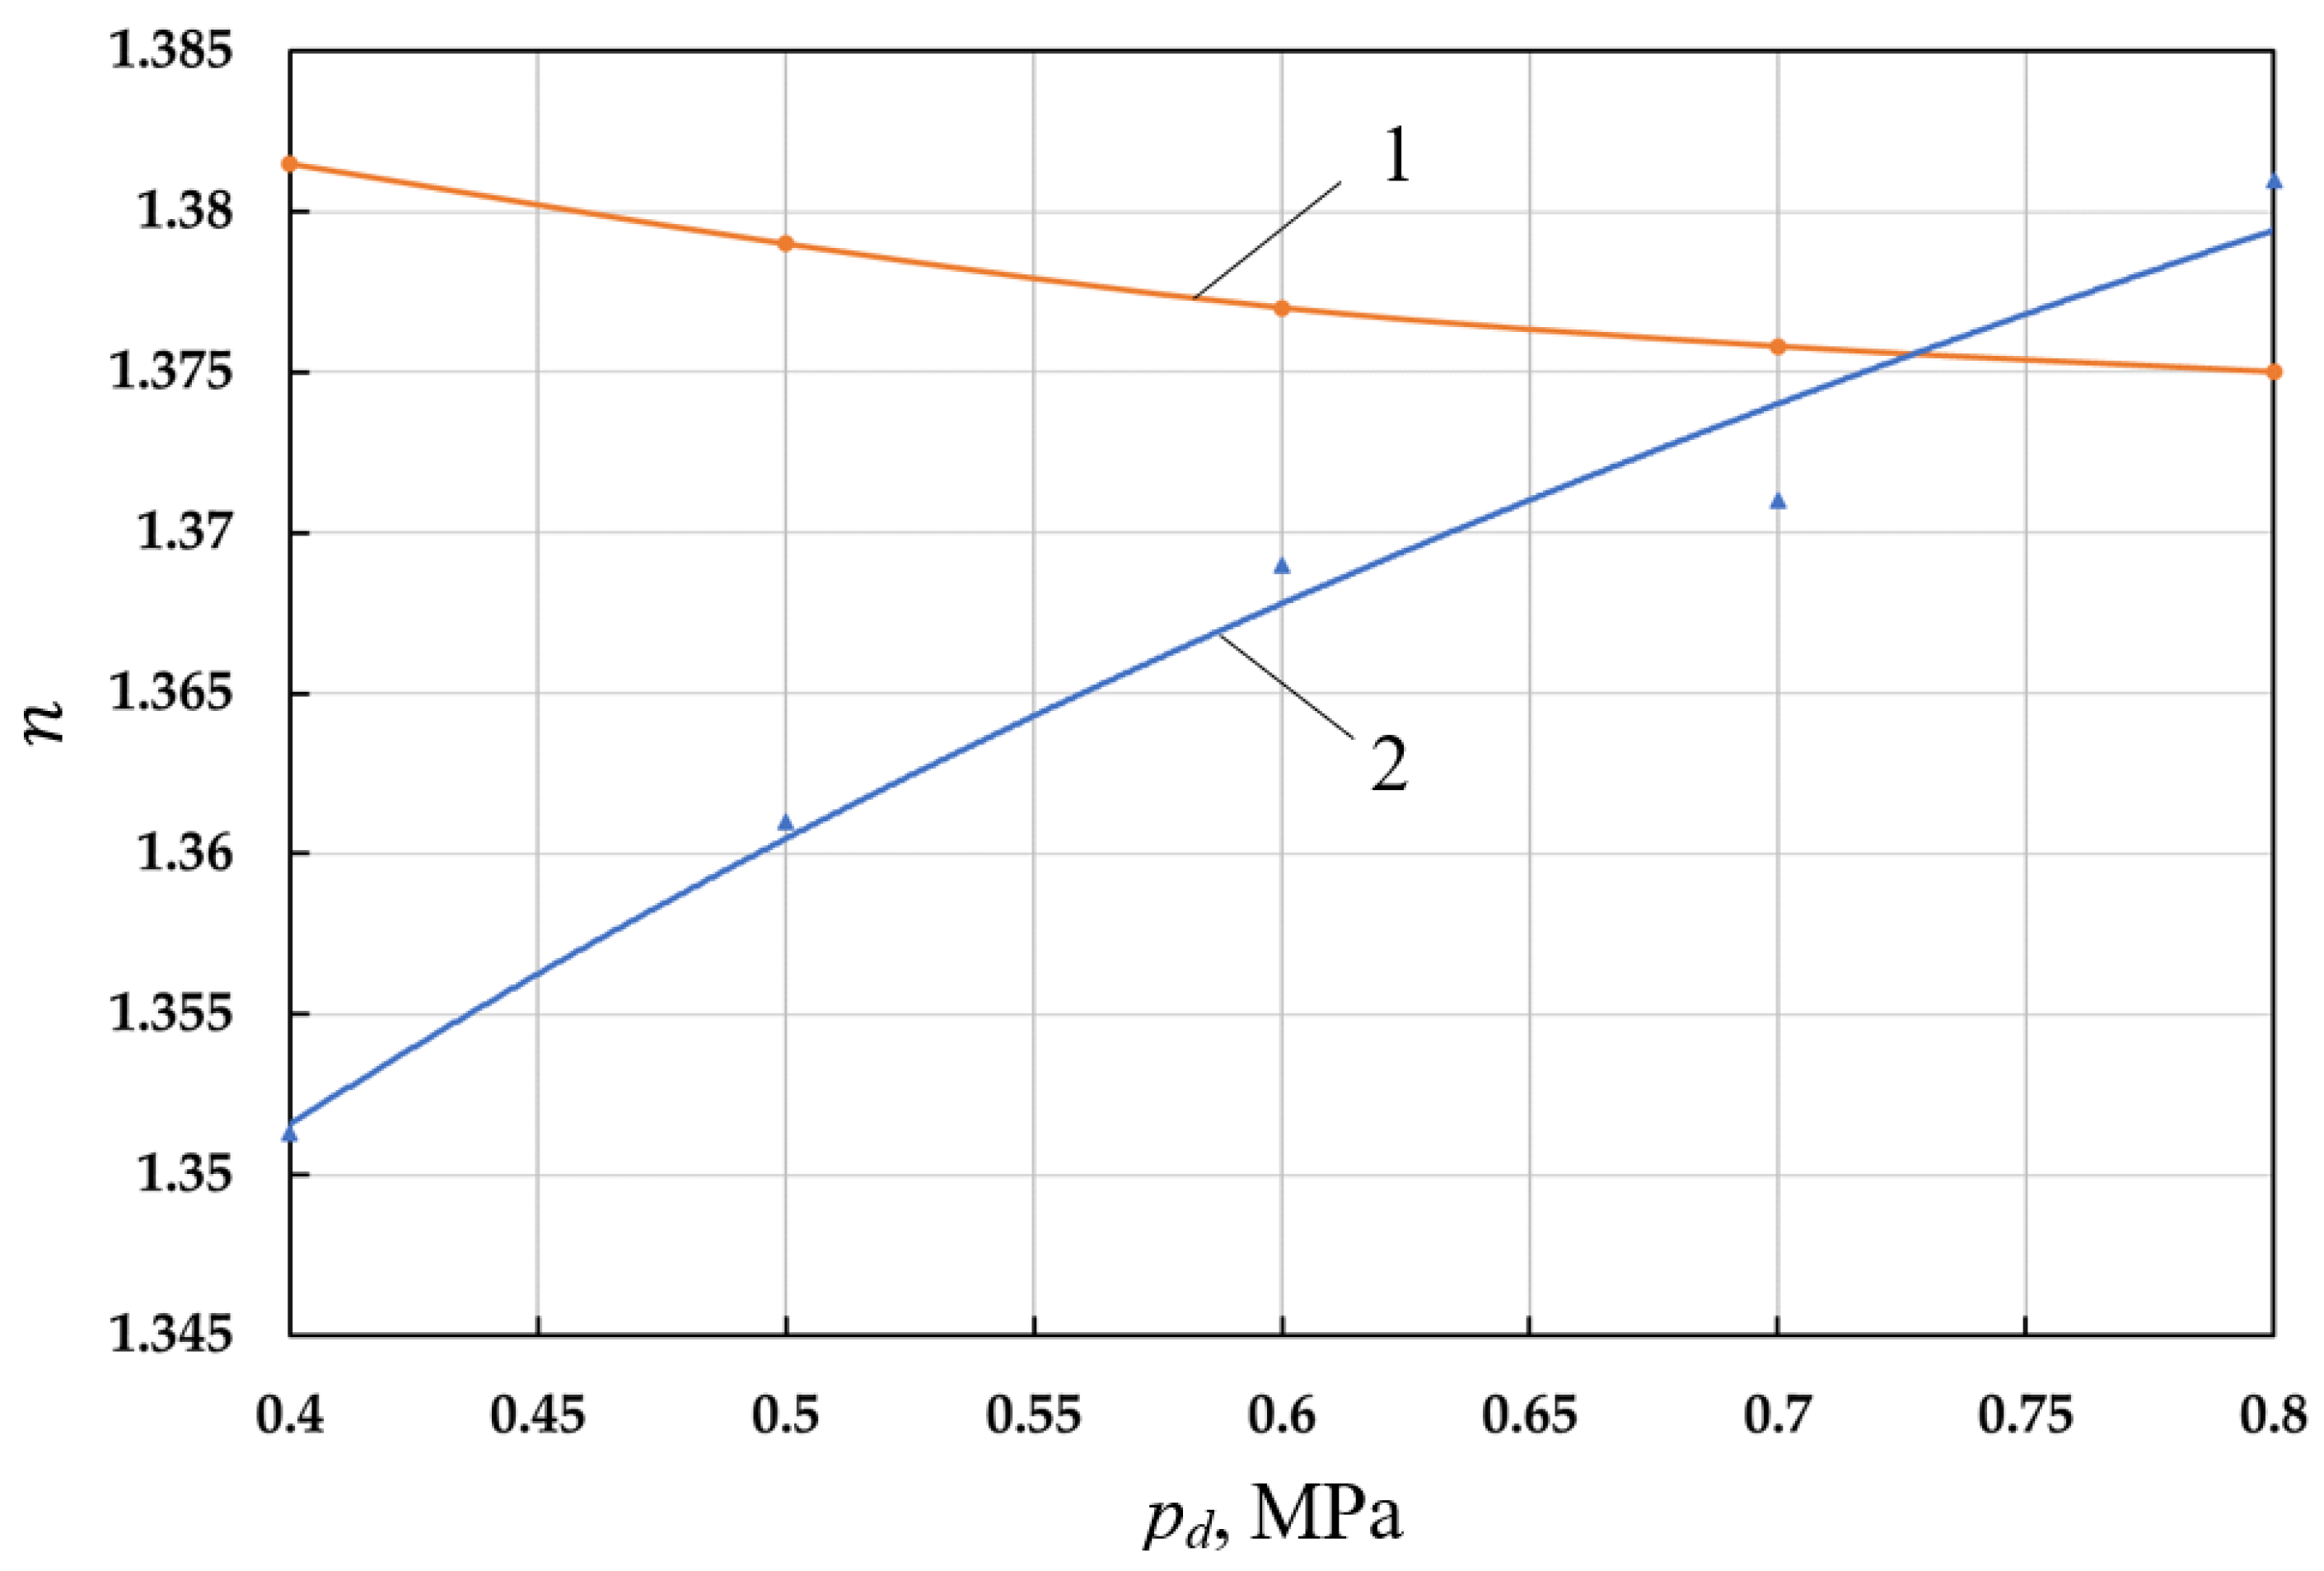
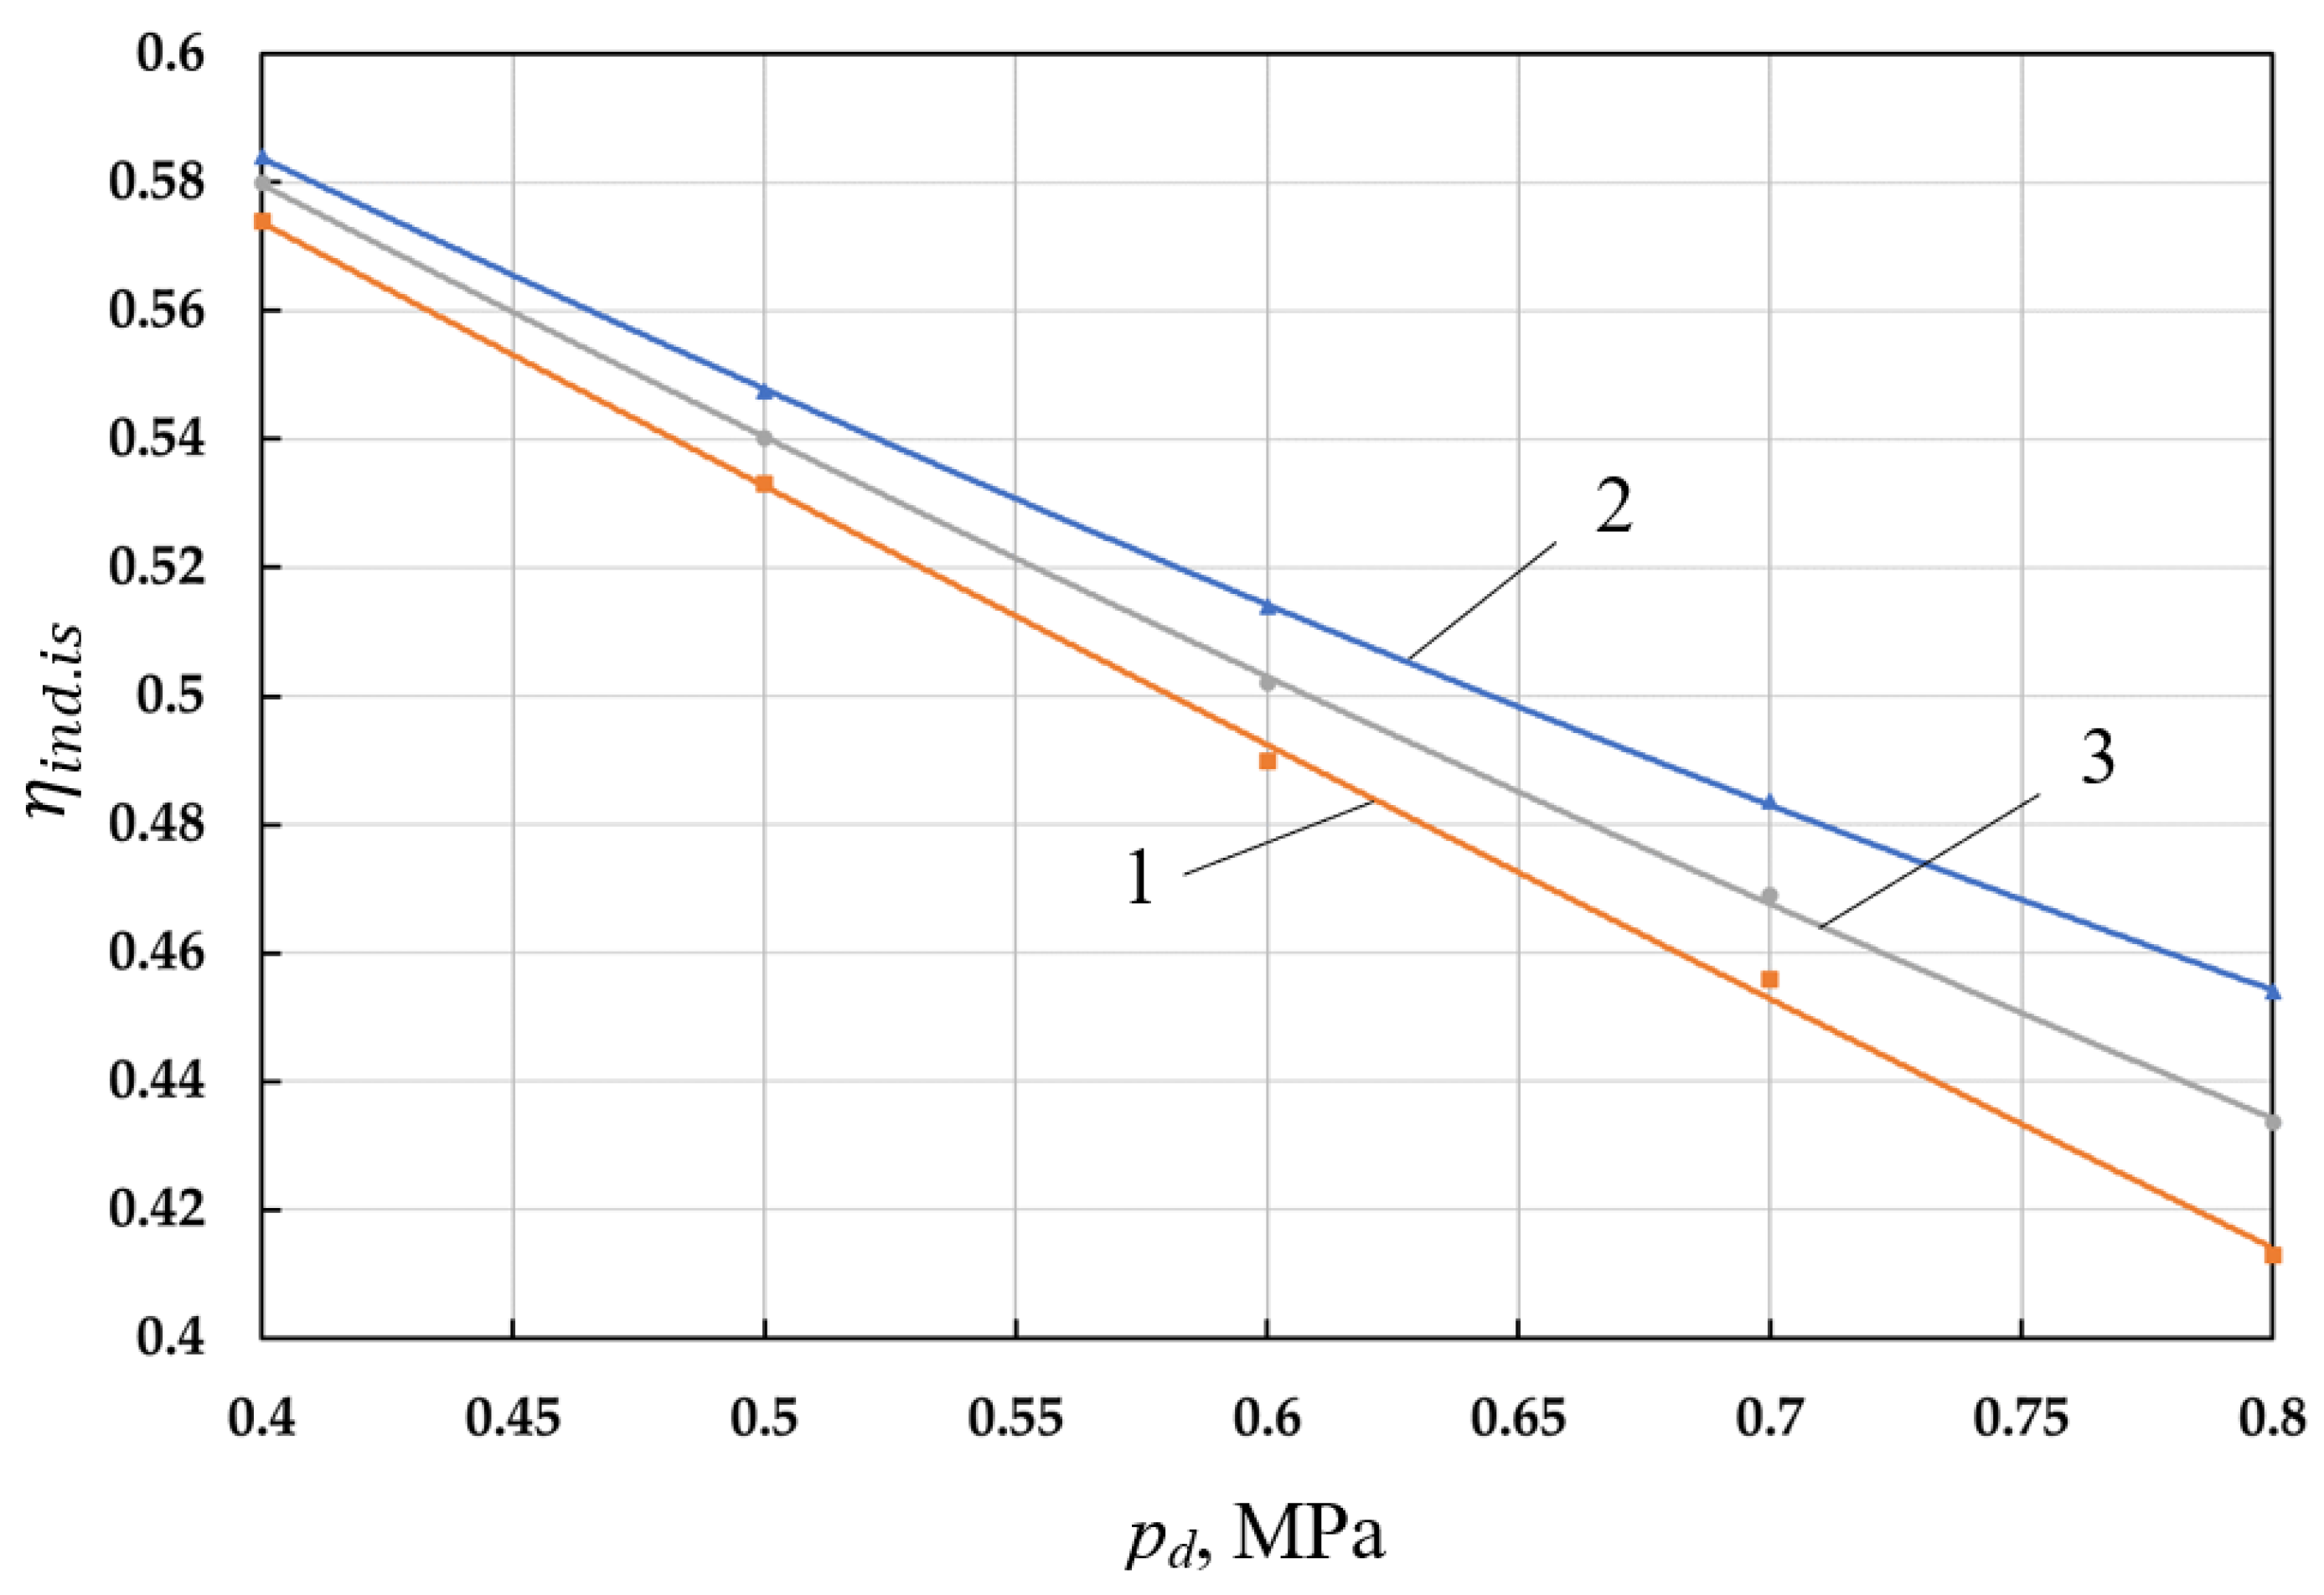
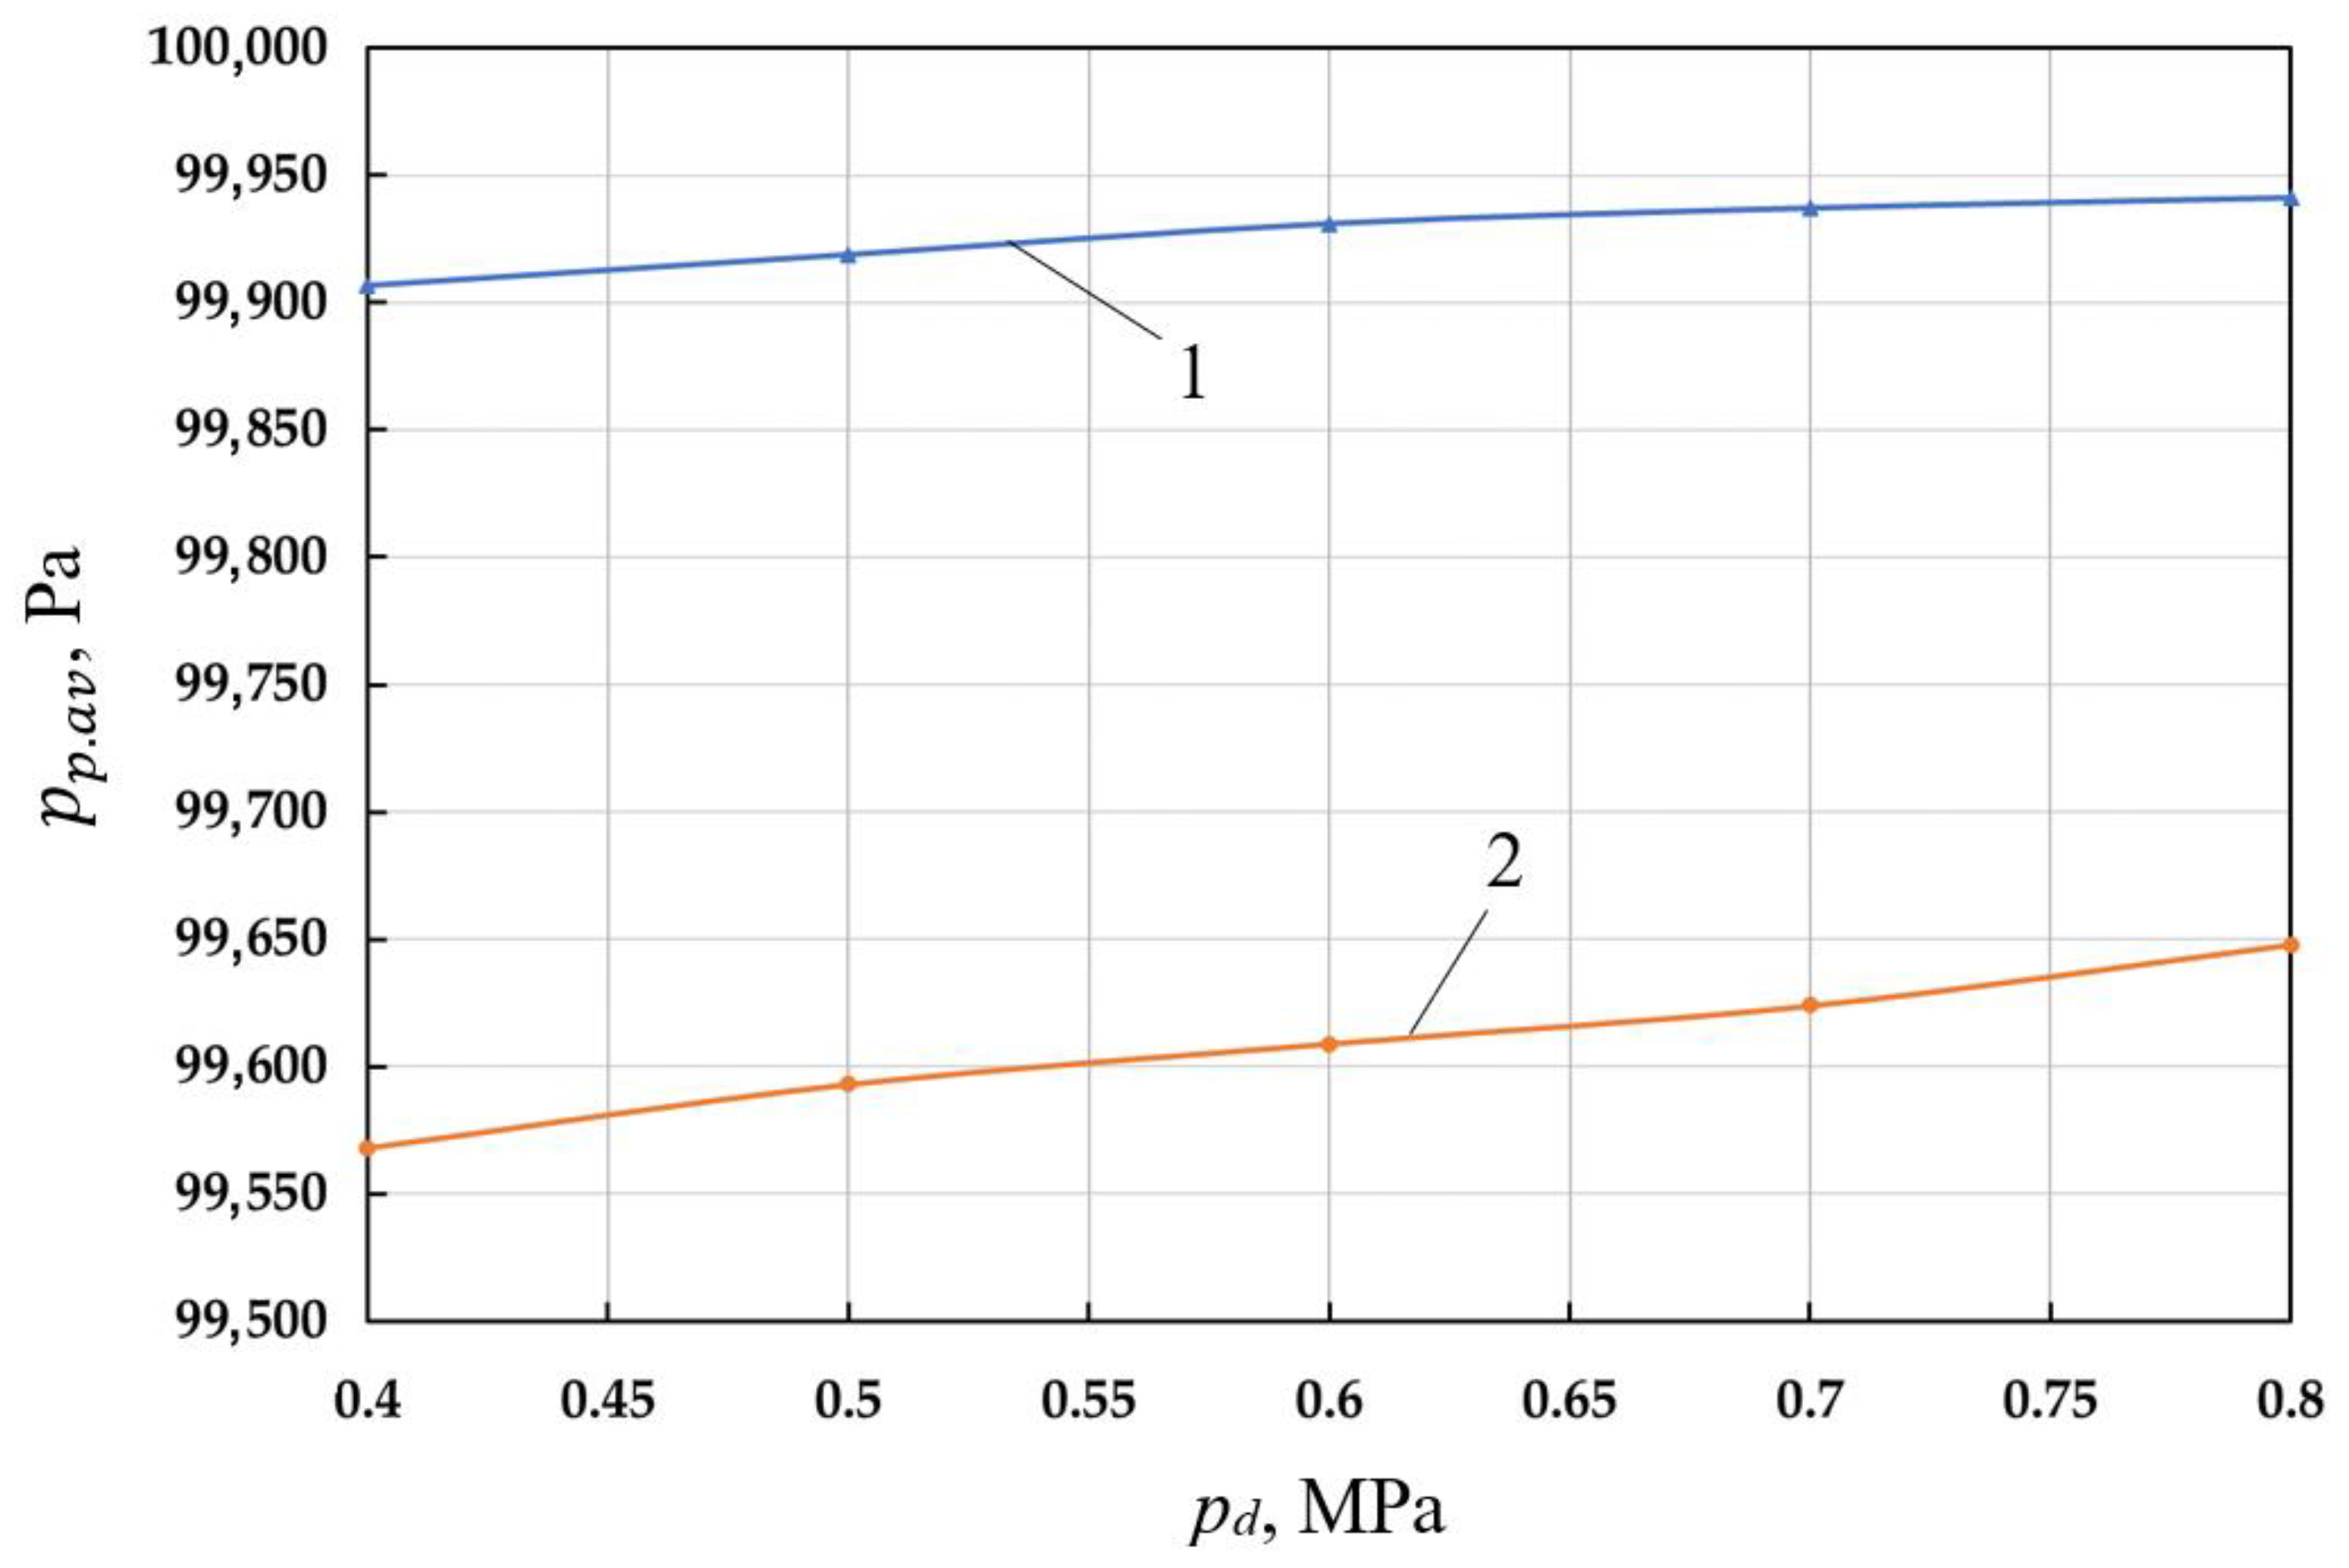
- Discharge pressure pd at constant suction pressure is (0.4–0.8) MPa;
- Crankshaft speed is nrev = (800–1500) rpm.
6. Conclusions
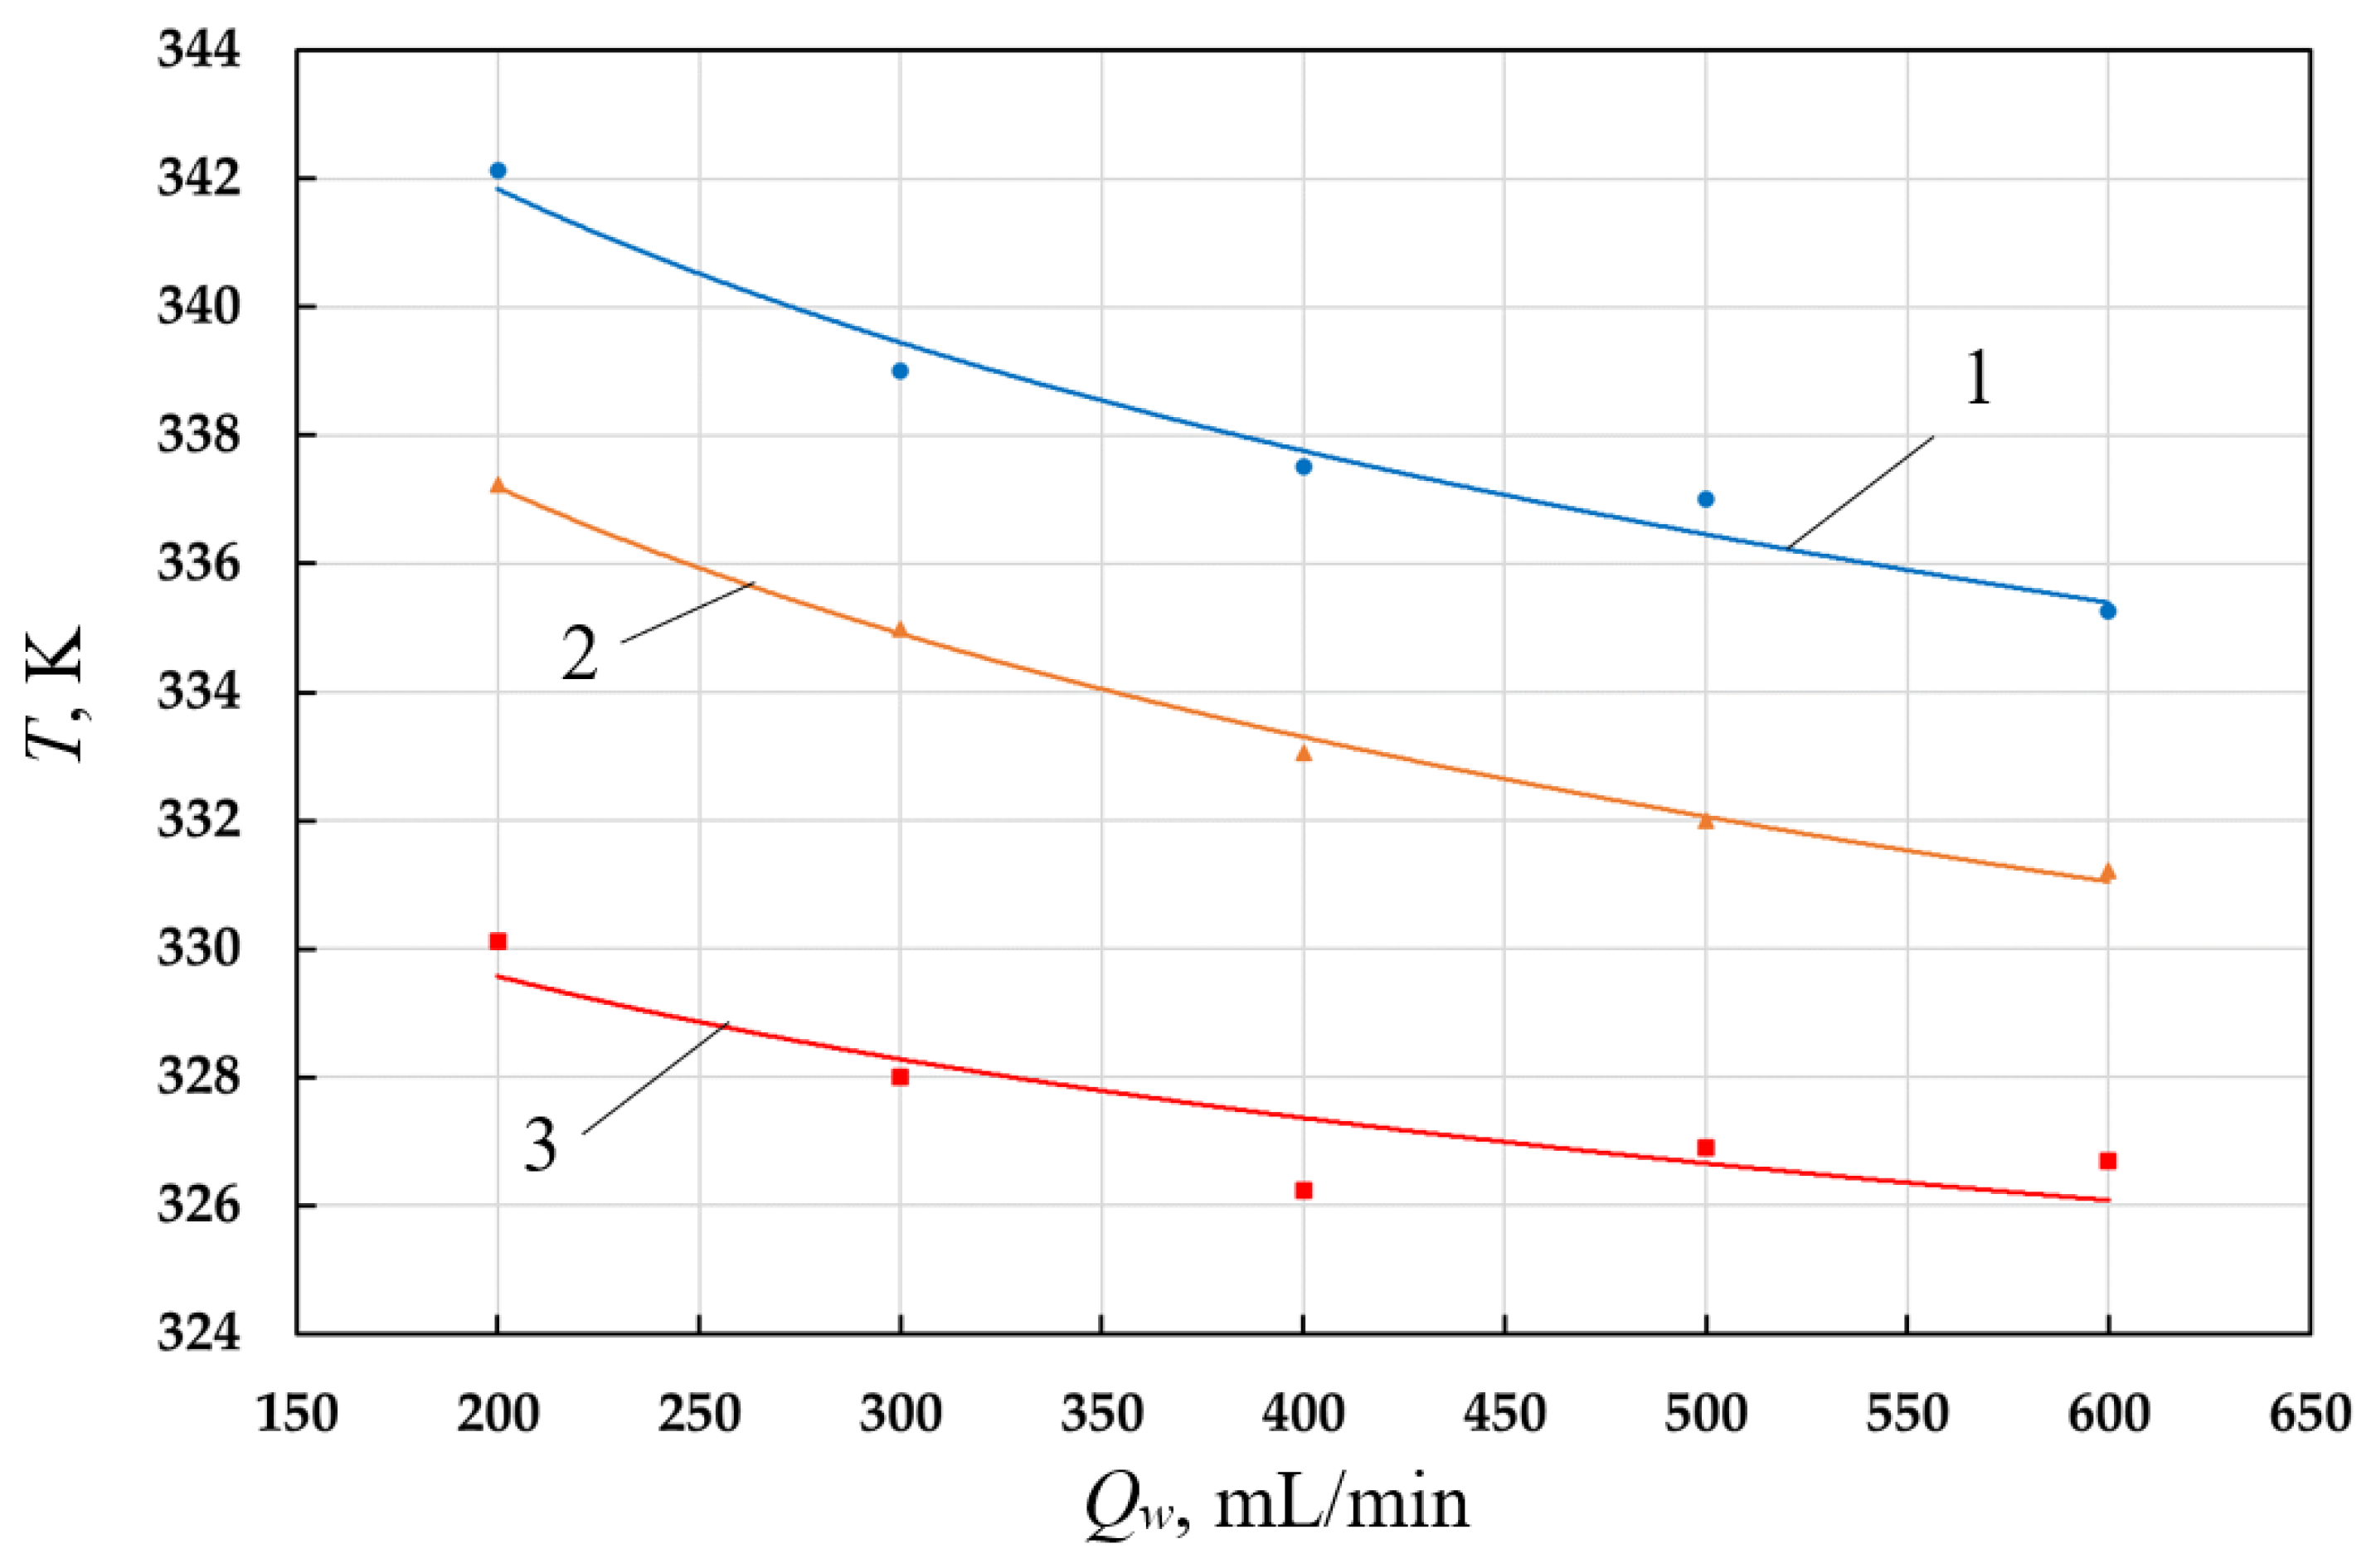
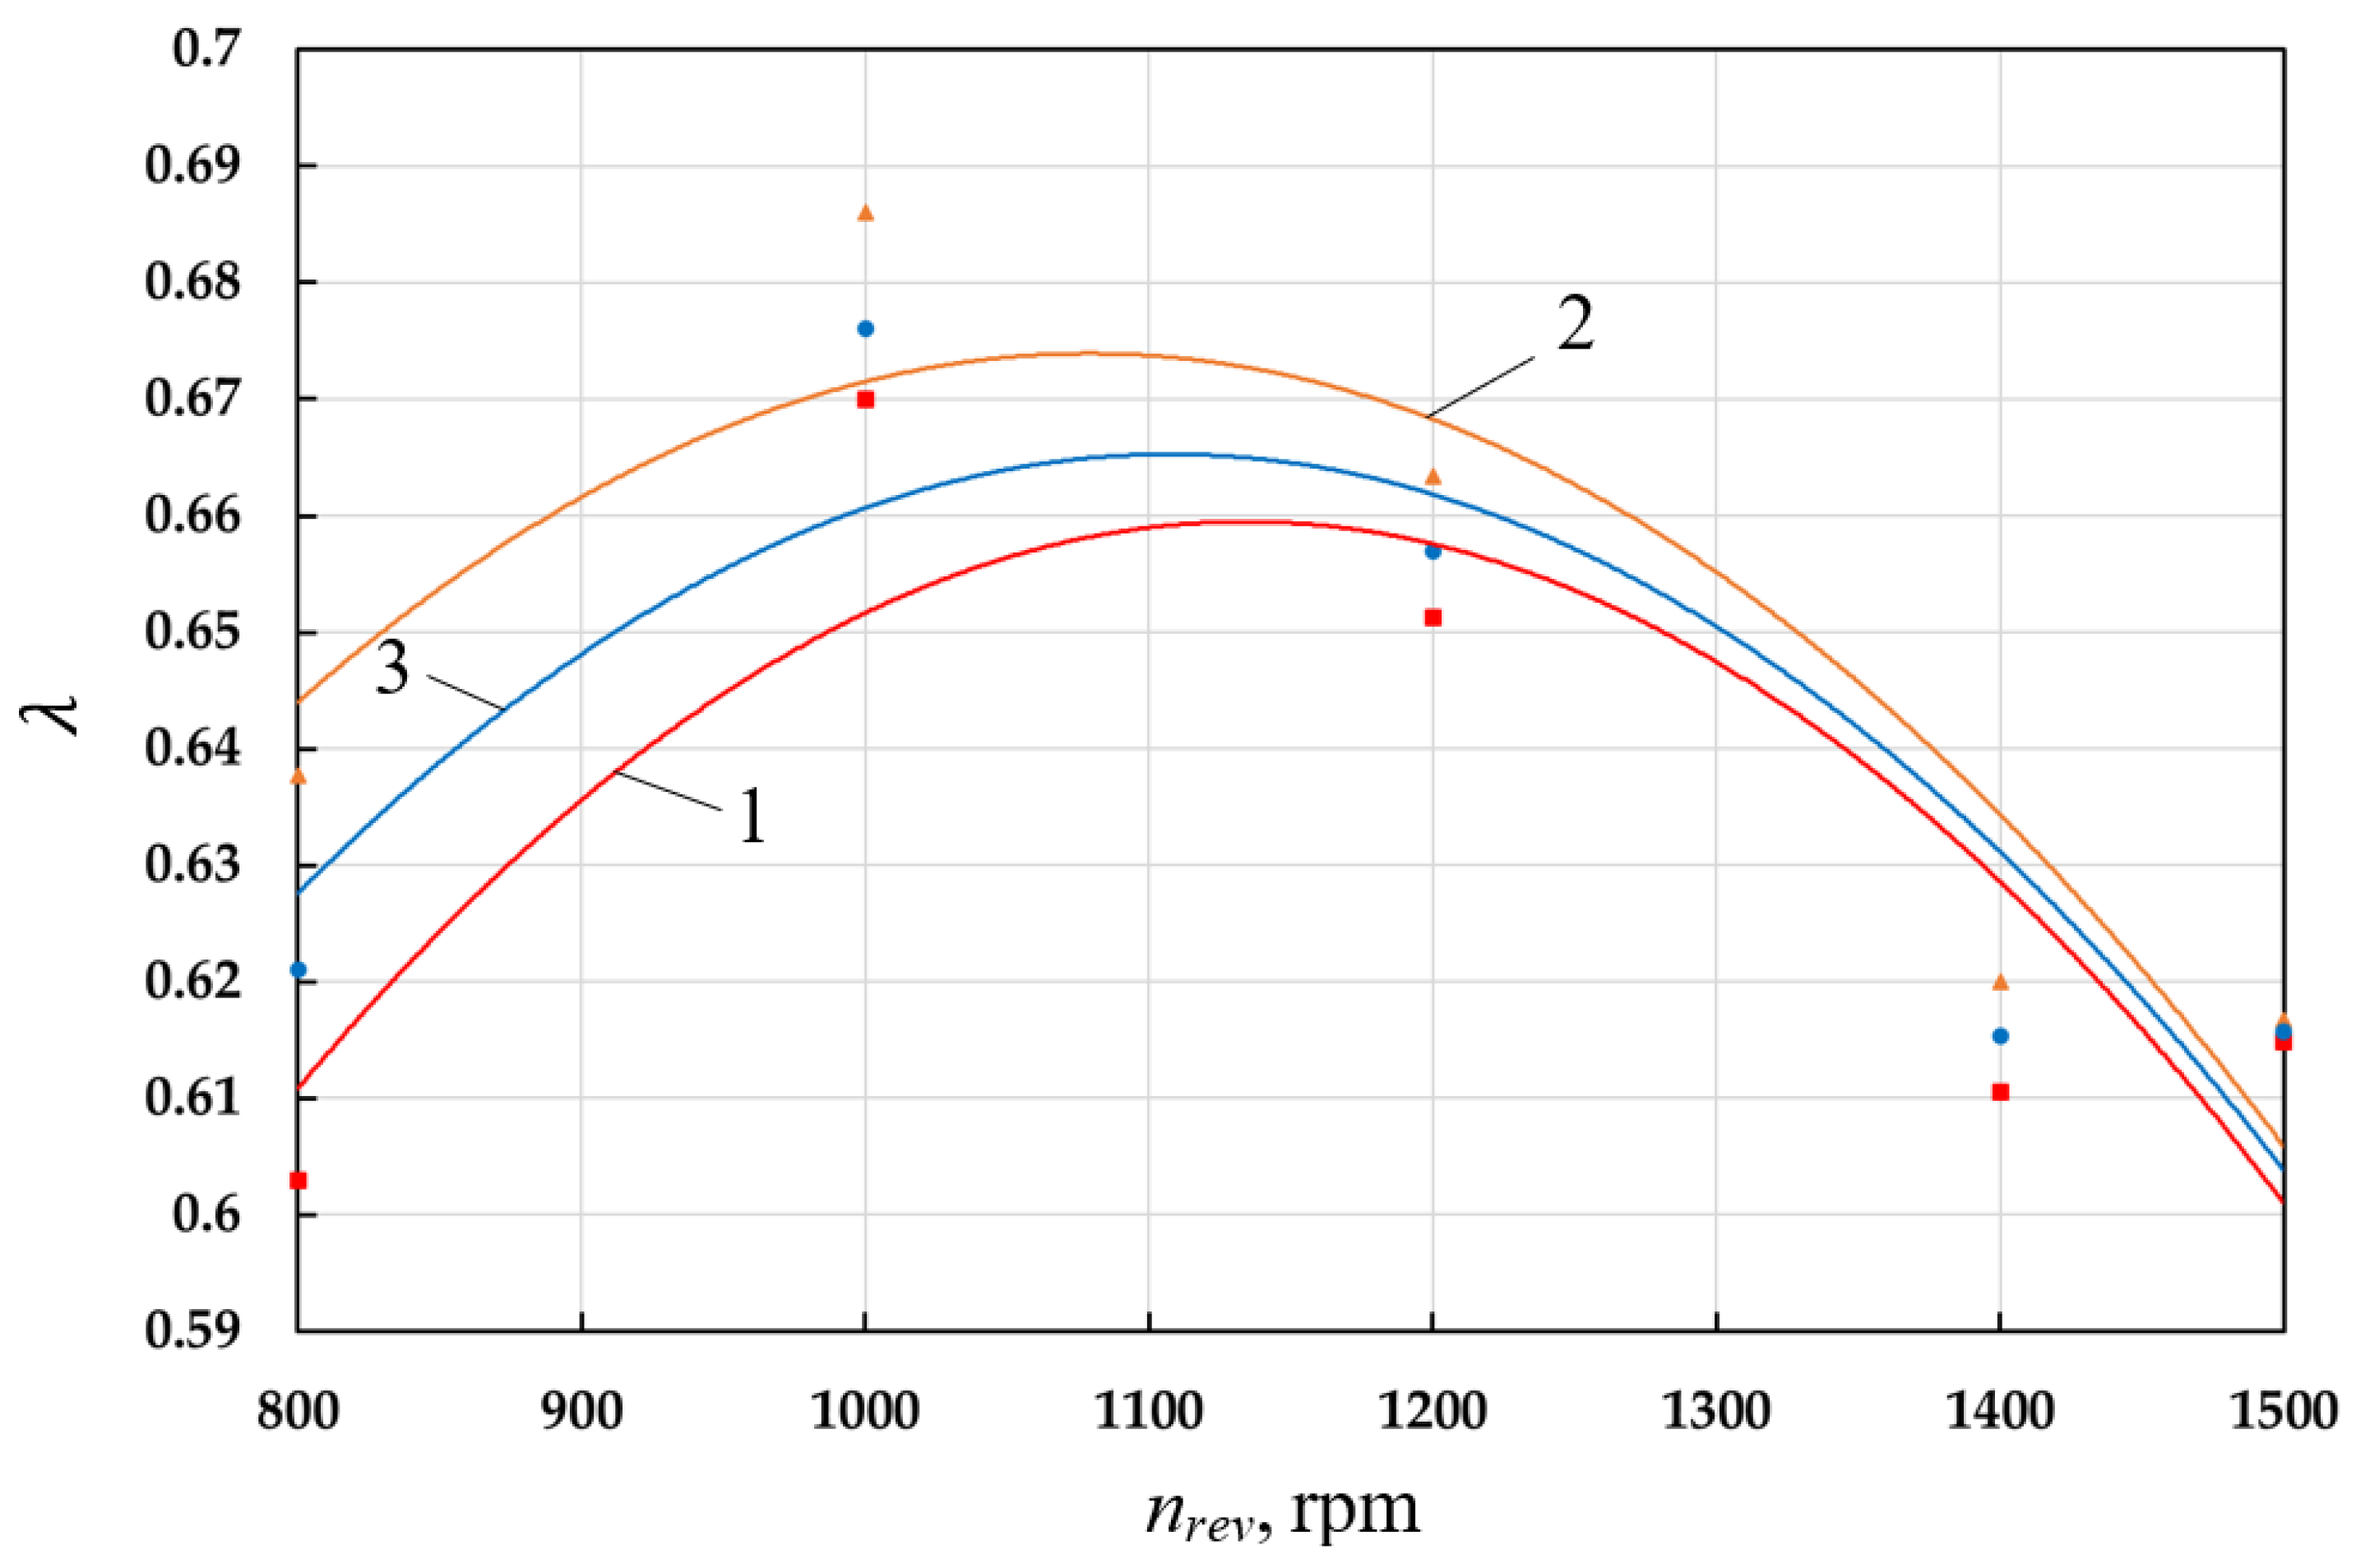
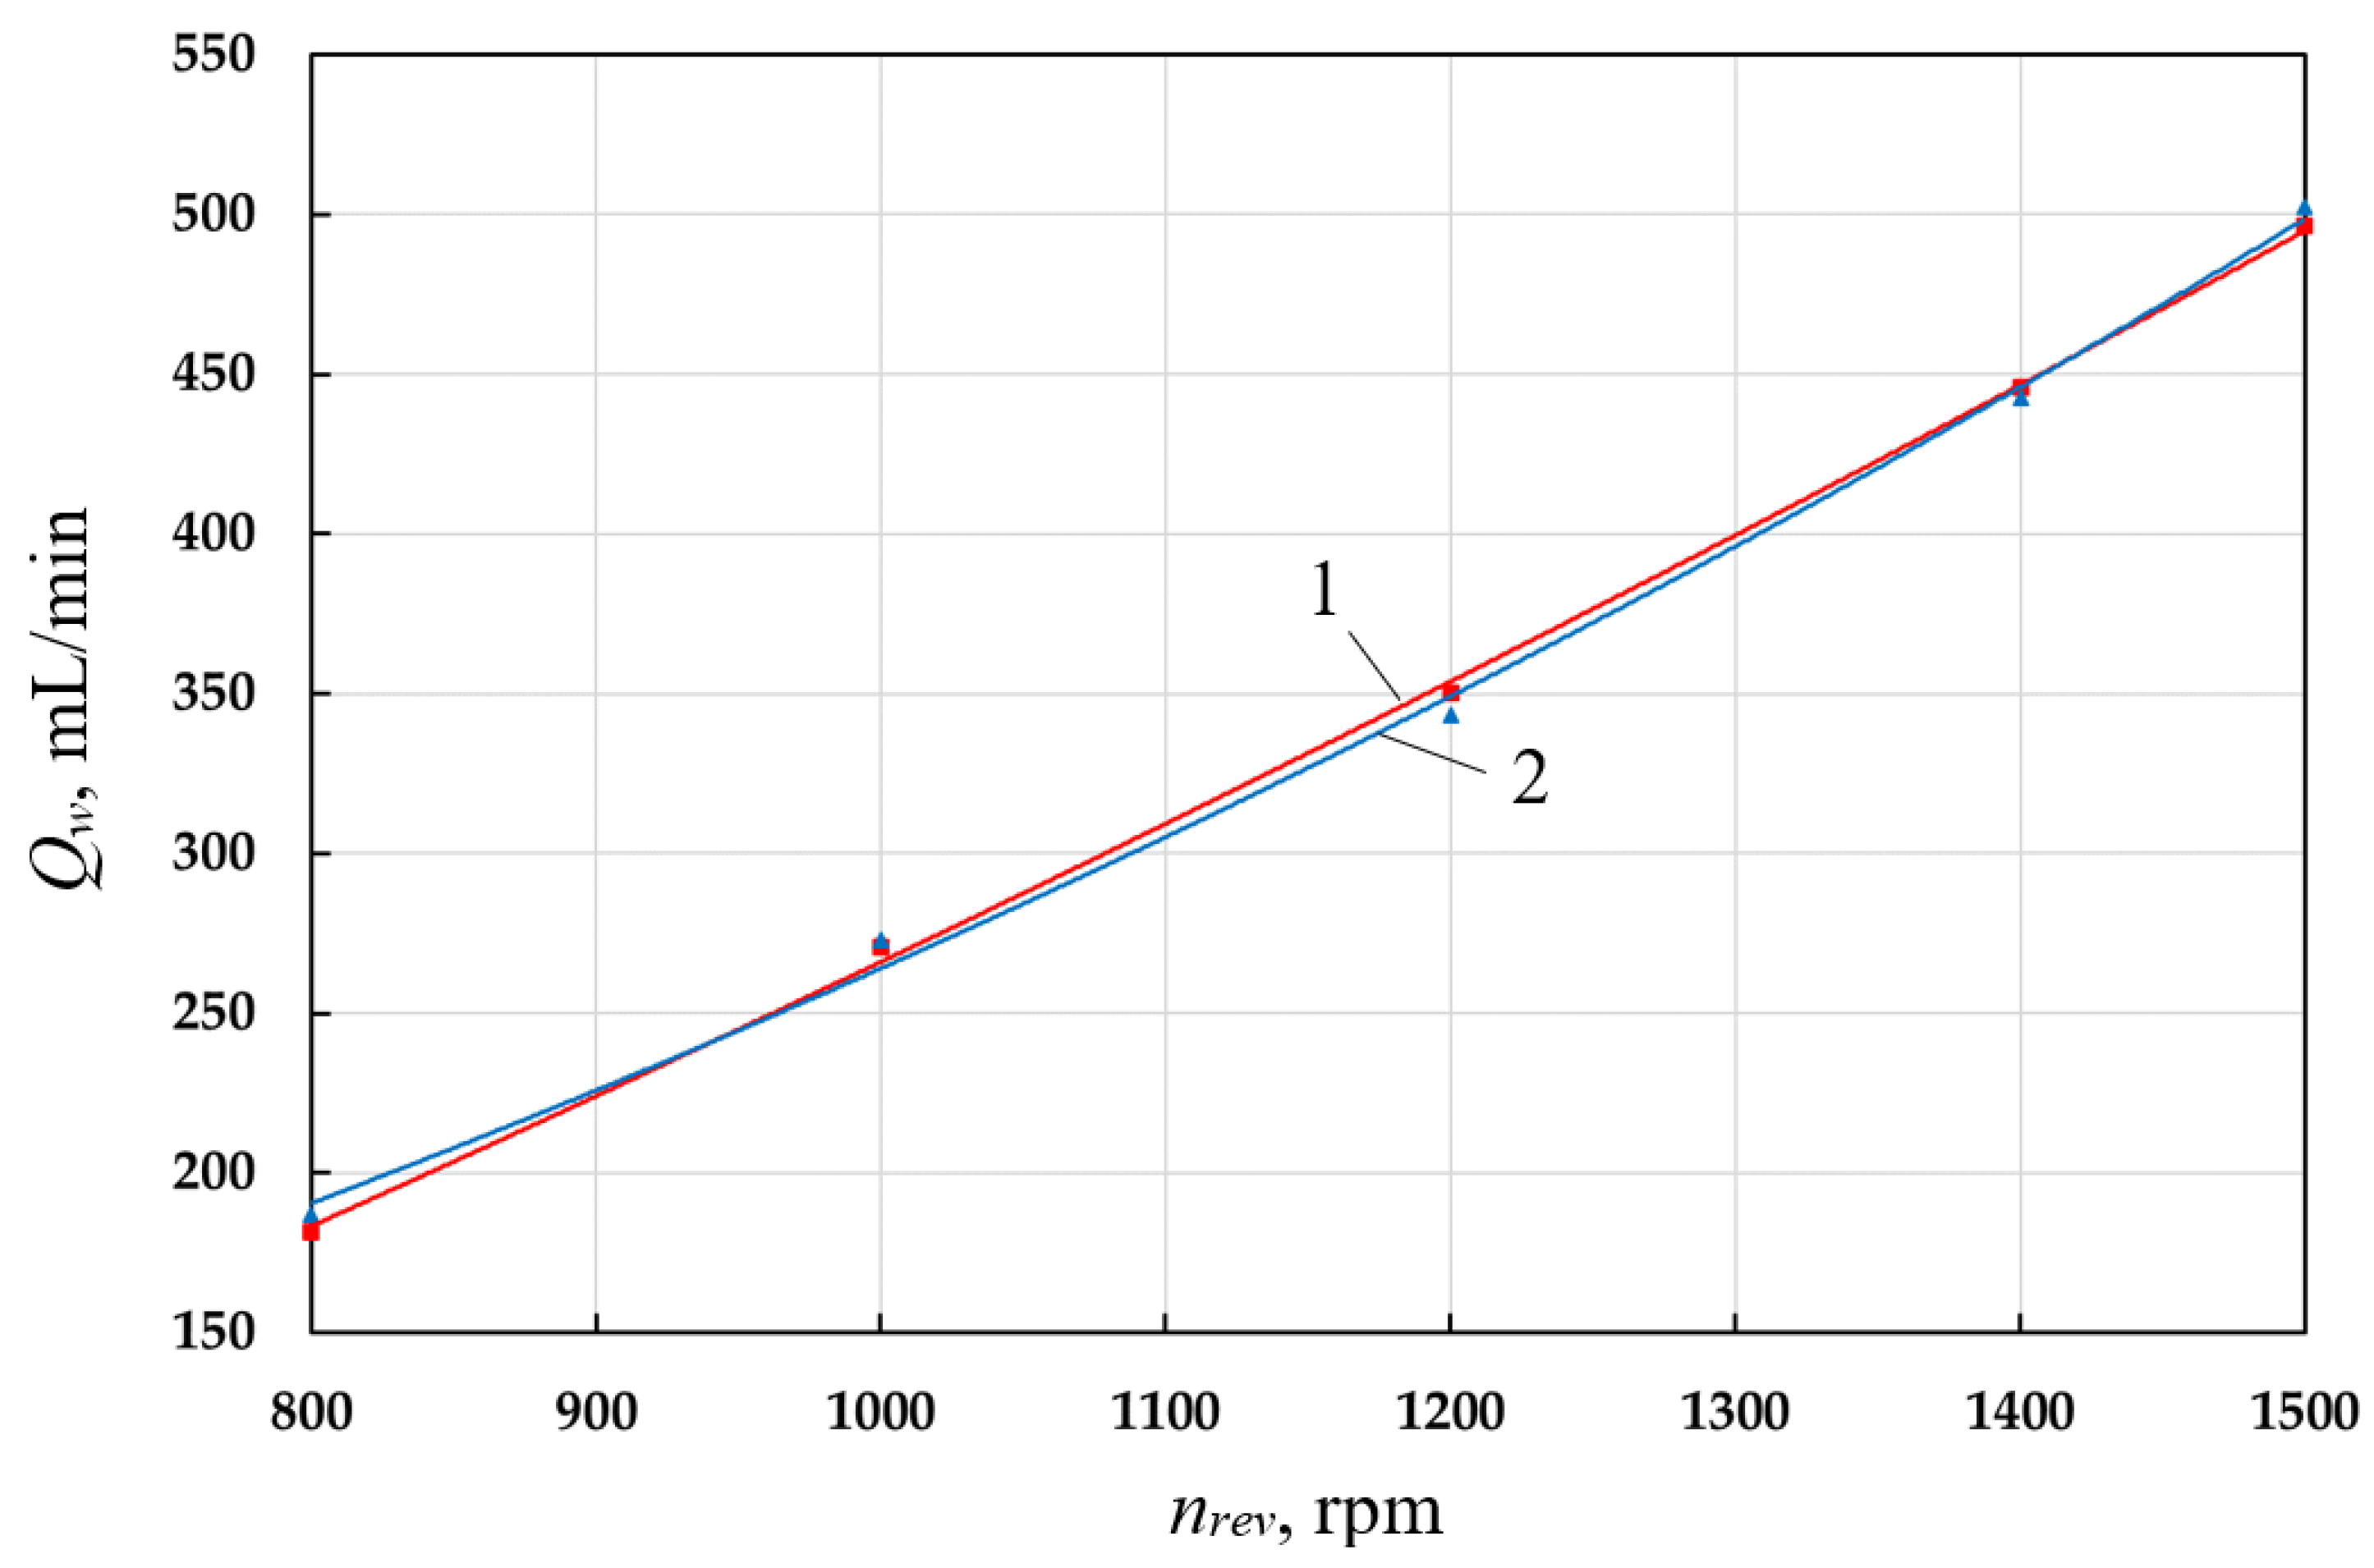
- the coolant flow rate decreases with an increase in discharge pressure and increases with an increase in the crankshaft speed;
- in the range from 1000 to 1200 rpm, a maximum of indicator isothermal efficiency and compressor feed rate has been observed;
- maximum indicator isothermal efficiency and feed rate is observed at coolant flow rate in the range from 800 mL/min to 900 mL/min.
Author Contributions
Funding
Conflicts of Interest
Abbreviations
| specific isobaric heat capacity of a liquid, J/(kg*K); | |
| total internal energy, J; | |
| dp | diameter of a constant volume cavity partially filled with liquid, m; |
| dpp | inner diameter of the gas pipe, m; |
| elementary deformation work, J; | |
| elementary mass change, kg; | |
| elementary amount of fluid entering a constant-volume cavity partially filled with fluid, kg; | |
| i-th | inlet mass flow, kg; |
| i-th | outlet mass flow, kg; |
| elementary amount of fluid separated from a cavity of constant volume partially filled with fluid, kg; | |
| elementary amount of gas entering a constant-volume cavity partially filled with fluid, kg; | |
| elementary amount of gas separated from a constant volume cavity partially filled with fluid, kg; | |
| elementary external heat exchange between the compressed gas and the surface of the working chamber, J; | |
| elementary external heat transfer between the liquid and the walls of the cavity, J; | |
| heat exchange surface, m2; | |
| gas force acting on the valve plate, N; | |
| elastic force of the self-acting valve spring, N; | |
| force of friction when self-acting valve plate moving, N; | |
| side of the cylinder surface, m2; | |
| heat exchange surface of the valve body, m2; | |
| heat exchange surface of the piston head, m2; | |
| free surface area of a liquid in a constant-volume cavity partially filled with liquid, m2; | |
| the heat exchange surface in the gas part of the constant volume cavity partially filled with liquid, m2; | |
| side surface area of the constant volume cavity partially filled with liquid, m2; | |
| the area of the cover of the cavity partially filled with liquid, m2; | |
| self-acting valve weight force, N; | |
| acceleration of gravity, m/s2; | |
| the mass of gas in the working chamber of the left compressor, kg; | |
| the mass of gas in the working chamber of the right compressor, kg; | |
| current lift height of the valve, m; | |
| height of the liquid column in the cavity 22, m; | |
| height of the liquid column in the cavity 21, m; | |
| io | specific enthalpy of the detachable mass of the working fluid, H; |
| in | specific enthalpy of the attached mass of the working fluid, H; |
| specific enthalpies of the added gas masses, H; | |
| specific enthalpies of the separated gas masses, H; | |
| adiabatic exponent of a compressible gas; | |
| the height of the fluid in the cavity, m; | |
| lpp, | length of the gas pipe, m; |
| cavity height 21, m; | |
| lg | height of gas in a constant volume cavity partially filled with liquid, m; |
| M | mass of compressed gas, kg; |
| reduced mass of the valve plate, kg; | |
| mass of a gas in a constant-volume cavity partially filled with liquid, kg; | |
| number of local resistances in the connecting liquid pipe; | |
| number of in-flows; | |
| number of out-flows; | |
| P | pressure of compressed gas, Pa; |
| gas pressure in the working chamber of the left compressor, Pa; | |
| gas pressure in the working chamber of the right compressor, Pa; | |
| pressure in the cavity 25, Pa; | |
| pressure in a liquid at the gas–liquid interface, Pa; | |
| pressure in sections I-I, Pa; | |
| pressure in sections II-II, Pa; | |
| atmospheric pressure, Pa; | |
| pressure in the cavity 19, Pa; | |
| pressure in the cavity 20, Pa; | |
| P1 | pressure values in sections I-I, Pa; |
| P2 | pressure values in sections II-II, Pa; |
| current flow rate in the connecting pipe, m3/s. | |
| gas constant, J/(kg*K); | |
| T | temperature of compressed gas, K; |
| gas temperature in the working chamber of the left compressor, K; | |
| gas temperature in the working chamber of the right compressor, K; | |
| gas temperature in the cavity 25, K; | |
| temperature of a gas in a constant-volume cavity, K; | |
| gas temperature in the cavity 22, K; | |
| average temperature of working chamber walls surface, K; | |
| atmospheric gas temperature, K; | |
| gas temperature in the cavity 19, K; | |
| gas temperature in the cavity 20, K; | |
| function of cylinder surface temperature distribution; | |
| function of valve temperature distribution; | |
| function of the valve body temperature distribution; | |
| average temperature of the walls of the sides of the cavity partially filled with liquid, K; | |
| average temperature of the surface of the cover of the cavity partially filled with liquid, K; | |
| temperature of the fluid entering the cavity, K; | |
| ux | gas velocity along the pipe axis, m/s; |
| total internal energy of the compressible gas, J; | |
| V | volume of compressed gas, m3; |
| gas velocities in sections II-II, m/s; | |
| the current volume of the working chamber of the left compressor, m3; | |
| the current volume of the working chamber of the right compressor, m3; | |
| dead volume in the working cavity, m3; | |
| cylinder displacement, m3; | |
| volume of a gas in a constant-volume cavity, m3; | |
| fluid velocity in a constant volume cavity partially filled with fluid, m/s; | |
| the current volume of gas in the cavity 22, m3; | |
| velocity of the liquid in the connecting liquid pipe, m/s; | |
| cavity volume 19, m3; | |
| cavity volume 20, m3; | |
| geometric height in sections I-I, m; | |
| geometric height in sections II-II, m; | |
| geometric height of sections I-I in cavities 22, m; | |
| geometric height of sections II-II in cavities 21, m; | |
| angle of rotation of the crankshaft; | |
| Coriolis coefficients in selected sections I-I; | |
| Coriolis coefficients in selected sections II-II; | |
| heat transfer coefficient averaged over the surface of the working chamber, W/(m2*K); | |
| head losses along the length due to local resistances and inertial losses in cavities of constant volume, m; | |
| head losses along the length due to local resistances and inertial losses in cavities of constant volume, m; | |
| head loss along the length due to local resistances and inertial losses in the connecting liquid pipe, m; | |
| head loss along the length due to local resistances and inertial losses in the connecting liquid pipe, m; | |
| head loss along the length due to local resistances and inertial losses in the connecting liquid pipe, m; | |
| head loss along the length, m; | |
| loss of pressure on local resistance, m; | |
| Δx | elementary increment along pipe coordinate, m; |
| Δτ | elementary time interval, s; |
| ratio of piston stroke to twice the connecting rod length; | |
| λpp | friction ration along gas pipe; |
| values of local resistance coefficients at the inlet of the pipeline; | |
| values of local resistance coefficients at the outlet of the pipeline; | |
| i-th | local resistance in the connecting liquid pipe; |
| gas density, kg/m3; | |
| liquid density, kg/m3; | |
| τ | current time, s. |
References
- Kiliç, G.A.; Al, K.; Dağtekin, E.; Unver, U. Technical, economic and environmental investigation of grid-independent hybrid energy systems applicability: A case study. Energy Sources Part A Recovery Util. Environ. Eff. 2020, 1–16. [Google Scholar] [CrossRef]
- Unver, U.; Kara, O. Energy efficiency by determining the production process with the lowest energy consumption in a steel forging facility. J. Clean. Prod. 2019, 215, 1362–1370. [Google Scholar] [CrossRef]
- Talbott, E.M. Compressed Air Systems: A Guidebook on Energy and Cost; Savings Fairmont Press: Atlanta, GA, USA, 1993. [Google Scholar]
- Sapmaz, S.; Kaya, D. Investigation of energy efficiency and emission reduction opportunities in compressed air systems. Eng. Mach. 2017, 58, 23–36. [Google Scholar]
- Çağman, S.; Soylu, E.; Ünver, Ü. A research on the easy-to-use energy efficiency performance indicators for energy audit and energy monitoring of industrial compressed air systems. J. Clean. Prod. 2022, 365, 132698. [Google Scholar] [CrossRef]
- Pérez-Segarra, C.; Rigola, J.; Sòria, M.; Oliva, A. Detailed thermodynamic characterization of hermetic reciprocating compressors. Int. J. Refrig. 2005, 28, 579–593. [Google Scholar] [CrossRef]
- Pavlyuchenko, E.A. Analysis of the Primary Means for Increasing the Efficiency of Positive Displacement Compressors. Chem. Pet. Eng. 2022, 58, 309–314. [Google Scholar] [CrossRef]
- Diniz, M.C.; Melo, C.; Deschamps, C.J. Experimental performance assessment of a hermetic reciprocating compressor operating in a household refrigerator under on–off cycling conditions. Int. J. Refrig. 2018, 88, 587–598. [Google Scholar] [CrossRef]
- Posch, S.; Hopfgartner, J.; Dür, L.; Eichinger, M.; Stangl, S.; Almbauer, R. Thermal loss analysis of hermetic compressors using numerical simulation. Appl. Therm. Eng. 2018, 130, 1580–1589. [Google Scholar] [CrossRef]
- Santos, C.J.; Dutra, T.; Deschamps, C.J. Scrutinizing the sources of inefficiencies in the piston-cylinder clearance of an oil-free linear compressor. Int. J. Refrig. 2019, 104, 513–520. [Google Scholar] [CrossRef]
- Silva, L.R.; Deschamps, C.J. Modeling of gas leakage through compressor valves. Int. J. Refrig. 2015, 53, 195–205. [Google Scholar] [CrossRef] [Green Version]
- Rezende, G.C.; Silva, E.; Deschamps, C.J. Edge gap as a geometric parameter to characterize the sealing performance of compressor valves. Int. J. Refrig. 2018, 90, 257–263. [Google Scholar] [CrossRef]
- Zhao, B.; Xiaohan, J.; Shukai, S.; Wen, J.; Peng, X. FSI model of valve motion and pressure pulsation for investigating thermodynamic process and internal flow inside a reciprocating compressor. Appl. Therm. Eng. 2018, 131, 998–1007. [Google Scholar] [CrossRef]
- Ooi, K.T. Heat transfer study of a hermetic refrigeration compressor. Appl. Therm. Eng. 2003, 23, 1931–1945. [Google Scholar] [CrossRef]
- Oliveira, M.; Diniz, M.; Deschamps, C. Predicting the temperature distribution and suction gas superheating of an oil-free linear compressor. Proc. Inst. Mech. Eng. Part E J. Process Mech. Eng. 2017, 231, 47–56. [Google Scholar] [CrossRef]
- Tuhovcak, J.; Hejcik, J.; Jicha, M. Comparison of heat transfer models for reciprocating compressor. Appl. Therm. Eng. 2016, 103, 607–615. [Google Scholar] [CrossRef]
- Pont, A.; López, J.; Rigola, J.; Pérez-Segarra, C. Numerical dynamic analysis of reciprocating compressor mechanism. Parametric studies for optimization purposes. Tribol. Int. 2017, 105, 1–14. [Google Scholar] [CrossRef] [Green Version]
- Dutra, T.; Deschamps, C.J. A simulation approach for hermetic reciprocating compressors including electrical motor modeling. Int. J. Refrig. 2015, 59, 168–181. [Google Scholar] [CrossRef]
- Berman, Y.A.; Mankovsky, O.N.; Marr, Y.N.; Rafalovich, A.P. Cooling Systems for Compressor Units. L.; Mechanical Engineering, Leningrad Department: Leningrad, Russia, 1984; 228p. [Google Scholar]
- Frenkel, M.I. Piston Compressors. L.; Mechanical Engineering: Moscow, Russia, 1969; 744p. [Google Scholar]
- Plastinin, P.I. Reciprocating Compressors; Tom 1: Moscow, Russia, 2006; 456p. [Google Scholar]
- Van de Ven, J.; Li, P. Liquid piston gas compression. Appl. Energy 2009, 86, 2183–2191. [Google Scholar] [CrossRef]
- Qin, C.; Loth, E. Liquid piston compression efficiency with droplet heat transfer. Appl. Energy 2014, 114, 539–550. [Google Scholar] [CrossRef]
- Shcherba, V.E.; Bolshtyansky, A.P.; Lobov, I.E.; Grigoriev, A.V. Russian Federation, IPC F 04 B 39/06 (2006.01), Piston hybrid stage: No. 2015116962/06. Patent No. 2600212, 20 October 2016. [Google Scholar]
- Lobov, I.E.; Shcherba, V.E. Development and calculation of a liquid cooling system for a piston compressor using pressure fluctuations during gas discharge. Chem. Pet. Eng. 2016, 52, 251–259. [Google Scholar] [CrossRef]
- Lobov, I.; Shcherba, V.; Grigoriev, A. Analysis of the work processes in a piston hybrid power machine using fluctuations in gas pressure in the injection line. Omsk. Sci. Bull. 2016, 146, 40–44. [Google Scholar]
- Shcherba, V.E.; Bolshtyansky, A.P.; Kuzeeva (Trukhanova), D.A.; Nosov, E.Y.; Kaygorodov, S.Y. Russian Federation, IPC F 04 B 39/06, The Method of Operation of a Volumetric Machine and a Device for Its Implementation: No. 2015112262/06. Patent No. 2578776, 27 March 2016. [Google Scholar]
- Shcherba, V.; Kuzeeva (Trukhanova), D.A.; Nosov, E.Y. Mathematical modeling of working processes of a piston pump-compressor with a gas volume on suction. Vestn. Mashinostroeniya 2016, 4, 3–8. [Google Scholar]
- Shcherba, V.; Nosov, E.; Pavlyuchenko, E.; Kuzeeva, D.; Lobov, I. Analysis of the motion dynamics of liquid in a hybrid energy-converting piston machine with gas plenum in the intake. Chem. Pet. Eng. 2016, 52, 244–250. [Google Scholar] [CrossRef]
- Shcherba, V.E.; Ovsyannikov, A.Y.; Bolshtyansky, A.P.; Nosov, E.Y.; Tegzhanov, A.S. Russian Federation, IPC F04B 39/06 (2006.01), F04B 39/064 (2021/05), Two-Cylinder Reciprocating Compressor with Independent Liquid Cooling: No. 2020138070. Patent No. 2755967, 23 September 2021. [Google Scholar]
- Shcherba, V.E. Working Processes of Volumetric Compressors; M. Science: Moscow, Russia, 2008; 319p. [Google Scholar]
- Kotkas, L.; Zhurkin, N.; Donskoy, A.; Zharkovskij, A. Design and Mathematical Modeling of a Pneumatic Artificial Muscle-Actuated System for Industrial Manipulators. Machines 2022, 10, 885. [Google Scholar] [CrossRef]
- Belotserkovsky, O.M.; Davydov, Y.M. Method of Large Particles in Gas Dynamics; Main edition of physical and mathematical literature; M. Science: Moscow, Russia, 1982; 392p. [Google Scholar]
- Voronkov, S.S.; Prilutsky, M.K.; Fotin, B.S. Mathematical Model of a High-Speed Piston Two-Stage Compressor; Tr.VNIIKholodmash: Moscow, Russia, 1982; pp. 42–53. [Google Scholar]
- Isachenko, V.P.; Osipova, V.A.; Sukomel, A.S. Heat Transfer/Textbook for Universities, 3rd ed.; M. “Energy”: Moscow, Russia, 1975; 488p. [Google Scholar]
- Gimadiev, A.G.; Bystrov, N.D. Dynamics and Regulation of Hydraulic and Pneumatic Systems, Samara, Russia, 2010; 178p.
- Gavrilov, V.S.; Denisova, N.A. Method of Characteristics for One-Dimensional Wave Control, Nizhny Novgorod, Russia, 2014; 72p.
- Alam, M.K.; Bibi, K.; Khan, A.; Fernandez-Gamiz, U.; Noeiaghdam, S. The Effect of Variable Magnetic Field on Viscous Fluid between 3-D Rotatory Vertical Squeezing Plates: A Computational Investigation. Energies 2022, 15, 2473. [Google Scholar] [CrossRef]
- Basok, B.; Kremnev, V.; Pavlenko, A.; Timoshchenko, A. Aerodynamics and Complicated Heat Transfer with the Mixed Motion of Air in the Flat Duct of a High-Temperature Heat Exchanger. Energies 2022, 15, 865. [Google Scholar] [CrossRef]
- Shenk, H. Theory of Engineering Experiment; Mir M.: Moscow, Russia, 1972; 381p. [Google Scholar]


| Designation | Units |
|---|---|
| Main parameters | |
| Working fluid | air-antifreeze G-12 |
| Antifreeze G-12 has the following basic thermophysical properties | kg/m3, Cw = 3151 J/kgK; = 3.3·10 −6 m2/s at t = 20 °C |
| piston diameter | 0.06 m |
| piston stroke | 0.038 m |
| dead volume in the left and right cylinders | 3.96·10−6 m3 |
| length of pipe 1 | lpp1 = 0.32 m |
| diameter of pipe 1 | dpp1 = 0.006 m |
| length of pipe 2 | lpp2 = 0.22 m |
| diameter of pipe 2 | dpp2 = 0.017 m |
| length of pipe 3 | lpp3 = 0.1 m |
| length of pipe 4 | lpp4 = 0.05 m |
| diameter of pipe 4 | dpp4 = 0.02 m |
| length of pipe 5 | lpp51 = 0.05 m |
| diameter of pipe 5 | dpp5 = 0.02 m |
| length of pipe 6 | lpp6 = 0.48 m |
| diameter of pipe 6 | dpp6 = 0.017 m |
| length of pipe 7 | lpp7 = 0.3 m |
| diameter of pipe 7 | dpp7 = 0.006 m |
| length of pipe 8 | lpp8 = 0.009 m |
| The main parameters of suction valves are | |
| reduced mass of the closing element | mred = 2.15 gr |
| maximum lifting height | hmax = 2.4 mm |
| spring rate | cstrsc = 300 N/m |
| diameter of the passage in the saddle | dvl = 13.7 mm |
| The main parameters of the discharge valves are | |
| reduced mass of the closing element | mred = 7 gr |
| maximum lifting height | hmax = 1.3 mm |
| spring rate | cstrd =599 N/m |
| diameter of the passage in the saddle | dvl = 16.13 mm |
| Qw = 200 mL/min | |||||||||
|---|---|---|---|---|---|---|---|---|---|
| pd | Theory | Theory | Theory | Experim. | Theory | Theory | Theory | Experim. | Experim. |
| 0.6 MPa | 0.584 | 0.644 | 0.614 | 0.6 | 0.472 | 0.514 | 0.4928 | 0.48 | 0.52 |
| 0.8 MPa | 0.472 | 0.5845 | 0.528 | 0.55 | 0.3905 | 0.46 | 0.426 | 0.42 | 0.45 |
| Lengths | Diameters | Local Resistance Coefficients |
|---|---|---|
| l1 = 0.32 m | d1 = 0.006 m | = 1 |
| l2 = 0.22 m | d2 = 0.017 m | = 1 |
| l4 = 0.05 m | d4 = 0.02 m | = 1 |
| l5 = 0.05 m | d5 = 0.02 m | = 1 |
| l6 = 0.48 m | d6 = 0.017 m | = 1 |
| l7 = 0.3 m | d7 = 0.06 m | = 1 |
| Lengths | Diameters | Local Resistance Coefficients |
|---|---|---|
| lpp1 = 6.0 m | dpp1 = 0.008 m | = 2.0 (pipe 9); |
| lpp2 = 6.5 m | dpp2 = 0.008 m | = 2.0 (pipe 10); |
| Designations | Units |
|---|---|
| Diameters of the pistons of the left and right cylinders | dp = 0.06 m |
| Full stroke of pistons | Sh = 0.038 m |
| Value of linear dead space | SD = 0.0014 m |
| Diameter of the right cavity partially filled with liquid | dp1 = 0.08 m |
| Height of the right cavity partially filled with liquid | lp1 = 0.3 m |
| Diameter of the left cavity partially filled with liquid | dp2 = 0.3 m |
| Height of the left cavity partially filled with liquid | lp2 = (0.3 ÷ 0.1) m |
| Geometric dimensions of the suction cavity of the left cylinder, diameter | 0.02 m |
| Geometric dimensions of the suction cavity of the left cylinder, volume | 0.000048 m3 |
| The main parameters of the suction valves are: | |
| Maximum lifting height | hmax = 2.4 mm |
| Spring rate | csprsc = 300 N/m |
| Diameter of the passage in the saddle | dvl = 13.7 mm |
| The main geometric parameters of the discharge valves are: | |
| Reduced mass of the valve plate | mred = 7 gr |
| Maximum lifting height | hmax = 1.3 mm |
| Spring rate | csprd = 599 N/m |
| Diameter of the passage in the saddle | dvl = 16.13 mm |
| Diameter and length of the suction gas pipe of the left cylinder (pipe 3) | = 2 |
| Diameter and length of the suction gas pipe of the right cylinder (pipe 8) | = 230 |
| Intake air pressure | pa = 0.1 MPa |
| Intake air temperature | Ta = 293 K |
| Initial values of fluid levels in cavities 21 | Hp1 = lp1/2 |
| Initial values of fluid levels in cavities 22 | Hp2 = lp2/2 |
| Initial values of the coordinates of the cross-section centers in cavities 22 | z1 = (0.9 ÷ 1.1) m |
| Initial values of the coordinates of the cross-section centers in cavities 23 | z2 = (0.9 ÷ 1.1) m |
| Radial clearances in the slot seal of the pistons | δ1 = δ2 = 20 μm |
| Piston length | lp = 0.05 m |
Disclaimer/Publisher’s Note: The statements, opinions and data contained in all publications are solely those of the individual author(s) and contributor(s) and not of MDPI and/or the editor(s). MDPI and/or the editor(s) disclaim responsibility for any injury to people or property resulting from any ideas, methods, instructions or products referred to in the content. |
© 2023 by the authors. Licensee MDPI, Basel, Switzerland. This article is an open access article distributed under the terms and conditions of the Creative Commons Attribution (CC BY) license (https://creativecommons.org/licenses/by/4.0/).
Share and Cite
Shcherba, V.E.; Khait, A.; Pavlyuchenko, E.A.; Bulgakova, I.Y. Development and Research of a Promising Pumpless Liquid Cooling System for Reciprocating Compressors. Energies 2023, 16, 1191. https://doi.org/10.3390/en16031191
Shcherba VE, Khait A, Pavlyuchenko EA, Bulgakova IY. Development and Research of a Promising Pumpless Liquid Cooling System for Reciprocating Compressors. Energies. 2023; 16(3):1191. https://doi.org/10.3390/en16031191
Chicago/Turabian StyleShcherba, V. E., A. Khait, E. A. Pavlyuchenko, and I. Yu. Bulgakova. 2023. "Development and Research of a Promising Pumpless Liquid Cooling System for Reciprocating Compressors" Energies 16, no. 3: 1191. https://doi.org/10.3390/en16031191