
Experimental Analysis of Hysteresis in the Motion of a Two-Input Piezoelectric Bimorph Actuator

Faculty of Mechanical Engineering and Robotics, AGH University of Science and Technology, al. Mickiewicza 30, 30-059 Kraków, Poland
Energies 2023, 16(3), 1198; https://doi.org/10.3390/en16031198
Submission received: 3 November 2022
/
Revised: 19 January 2023
/
Accepted: 19 January 2023
/
Published: 21 January 2023
(This article belongs to the Special Issue Energy Problems in Control and Robotics Systems)
Abstract
:This article presents a comparison of hysteresis courses in the motion of a two-input actuator (bimorph) and hysteresis in the motion of a single-input actuator (unimorph). The comparison was based on the results of laboratory and numerical experiments, the subject of which was an actuator built of three layers: a carrier layer from a glass-reinforced epoxy laminate and two piezoelectric layers from Macro Fiber Composite. The layers were glued together, and electrodes in the Macro Fiber Composite layers were connected to a system that included an analogue/digital board and a voltage amplifier. The main purpose of this research was to compare the characteristic points of the hysteresis curves of the displacement of the bimorph actuator with the characteristic points of the hysteresis curves of the unimorph actuator. Based on the research results, it was noticed that, in the bimorph, the maximum hysteresis and mean hysteresis values increase faster than the maximum displacement of a beam tip. However, values of characteristic input voltages for hysteresis loops—voltage corresponding to a maximum displacement of the actuator beam tip and voltage corresponding to maximum hysteresis—are almost the same for the bimorph and unimorph. From a practical point of view, it was noticed that the unimorph is a better choice compared to the bimorph in applications in which high changes in frequencies of input voltages appear.
1. Introduction
A piezoelectric bimorph actuator is a device that consists of a beam and a supply system. The beam may contain three or two layers. In the case of three layers, these are two of piezoelectric material and one carrier layer [1], and in the case of two layers, these are two piezoelectric layers [2]. The piezoelectric layers convert electrical energy into mechanical energy. The supply system, which consists of a voltage amplifier and electric wires, generates an electrical voltage applied to these piezoelectric layers. The location of the piezoelectric layers on the carrier layer significantly influences the movement of the beam, which can be bent or twisted under the impact of an applied electric voltage on the piezoelectric layers [3]. Adhesive bonding is used to bond the layers [4].
The piezoelectric layers in the actuator beam are made up of material from three main groups: (1) ceramics, (2) composites, or (3) polymers. A commonly used ceramic is lead zirconate titanate (PZT), as reported in [5]; the most commonly used composite is Macro Fiber Composite (MFC) type P1, as reported in [6]; and the most commonly used polymer is polyvinylidene fluoride (PVDF), as reported in [7]. In the case of using PZT and PVDF, the direction of polarization of the piezoelectric material is perpendicular to the longitudinal axis of the whole beam, and in the case of using MFC type P1, the direction of polarization is parallel to the longitudinal axis of the beam. Therefore, the conversion of electrical energy to mechanical energy in actuators containing PZT or PVDF is described using the piezoelectric coefficient d31, while in actuators containing MFC type P1, d33 is used. Donoso et al. [8] noticed that PZT is better suited for use in actuators, while PVDF is better for sensing applications. The carrier layer in the actuator beam is composed of material from two main groups: (1) metals or (2) composites. Commonly used metals are aluminum alloys [9], copper alloys such as brass [10], beryllium [11], and steel [12]. Wang et al. [13], who compared carrier layers made of steel, aluminum, and brass, noticed that the use of a stiffer metal as the carrier layer leads to a sharp reduction in the displacement of the actuator beam tip. Wang [14] noted, based on a comparison of carrier layers made of steel, copper, and aluminum, that the static displacement of an actuator containing aluminum is larger compared to actuators containing steel or copper, but this difference decreases as the thickness of the carrier layer decreases. Thus, obtaining larger displacements of the beam tip is possible by using materials with stiffness values lower than those of the above-mentioned metals. Instead of metal, the carrier layer may be made of a composite; the most commonly used are glass-reinforced epoxy laminate [15] and carbon fiber composite [16].
A hysteresis phenomenon occurs in the actuator control system, regardless of the materials used in the piezoelectric and carrier layers. The hysteresis phenomenon is a non-smooth nonlinearity with multivalued mapping between the electric field and the displacement or force [17]. Ru et al. [18] noticed that an output variable in a control system with hysteresis depends on both a present value of control voltage, the extremum of the control voltage, and the extremum of the output variable, but does not depend on the rate of change of the control voltage or the past output variables. Xiaomin et al. [19] noticed that control voltages with higher frequencies lead to hysteretic loops which have a fuller appearance and lower average slope in comparison to loops caused by control voltages with lower frequencies. In this area, Jajn et al. [20] observed that a decrease in control voltage frequency causes a decrease in the displacement hysteresis of the bimorph. Hu et al. [21] found that displacement hysteresis increases with an axial compression force that acts on a bimorph carrier layer.
Gan et al. [22] presented, in detail, a review of hysteresis modeling methods in piezoelectric actuators, in which they distinguished ten hysteresis models. Hysteresis reduction is usually accomplished by using (1) an open loop control [23], or (2) a closed loop control [24], with or without feedforward [25], whose task is to generate the appropriate course of the voltage control signal. In addition to the control voltage waveform generated by the control system, other factors related to the control signal also have a significant influence on the phenomenon of hysteresis. Fleming [26] noticed that the current control of a piezoelectric actuator reduces hysteresis more than the voltage control. Bashash et al. [27] described turning points in the hysteresis course of a triangular input voltage signal. Rios et al. [28], who compared three electric connections of two piezoceramic layers in a bimorph (parallel, biased unipolar, and biased bipolar), stated that the type of electrical connection of the piezoelectric layers also influences the course of hysteresis.
It should be noted that, presented in the literature, research results conducted in the field of the phenomenon of hysteresis in the bimorph actuator almost always concern modeling the phenomenon of hysteresis and/or designing the actuator control to minimize the effects of this phenomenon. Few studies focused on other factors, such as ways to connect the piezoelectric layers, e.g., [28], in which in all publications of this type—piezoceramic layers polarized perpendicular to the longitudinal axis of the carrier layer—were analyzed. Currently, Macro Fiber Composite (MFC), whose operation is significantly different from that of piezoceramics, is used in an increasing number of actuator designs. Two differences are particularly important: (1) the polarization of a piezoelectric layer made of MFC is parallel to the longitudinal axis of the carrier layer in the bimorph actuator, and (2) the voltage values applied to the MFC layers are asymmetrically limited from −500 V to +1500 V. The first of these differences means that, in the process of converting electrical energy into mechanical energy, the piezoelectric coefficient d33 is used instead of d31, as in the case of piezoceramics. The second of these differences shows that, as presented in the literature, electrical connections of two piezoelectric layers can be used for MFC layers only when the input voltage is in the range of −500 V to +500 V. The application of asymmetric control voltages requires the generation of two control signals which are independent of each other, as in the case in the control of two piezoelectric stacks [29]. In the case of a bimorph, there are two control signals that simultaneously influence the hysteresis phenomenon. The scientific aim of this article is a comparative analysis of the hysteresis curves that occur in the motion of a two-input actuator (bimorph) and the hysteresis curves that occur in the motion of a single-input actuator (unimorph), with particular emphasis on the characteristic points of these curves: maximum hysteresis, maximum beam tip displacement, and beam tip displacement at maximum and minimum input voltage.
A piezoelectric actuator is a device that converts electrical energy into mechanical energy [30]. The main problem in the use of these types of devices is the need to apply voltage, which is much higher than that commonly used in technical devices. This problem is particularly important in the case of actuators built using macro fiber composite (MFC), because the dedicated control voltage of such an actuator ranges from −500 V to +1500 V. Amplifiers, which generate voltage in a range above a thousand volts, are expensive, because they are not available as Integrated Circuits (IC) and must be designed individually [31]. The cost of manufacturing such amplifiers is much higher than the cost of manufacturing amplifiers used to control actuators built based on piezoelectric ceramic (PZT), which require a control voltage of approximately −30 to +180 V [32]. Therefore, research is needed to reduce the voltage of electrical energy that is converted into mechanical energy. The results of the research presented in this article answer the following question: whether the use of two control signals, which reduce the control voltage of the MFC-based actuator from +1500 V to +500 V, leads to a comparable mechanical effect.
2. Research Methods
Laboratory experiments were carried out on a laboratory stand which contained three main parts: a bimorph, an input voltage generation system, and a measurement system.
The bimorph was built from a glass-reinforced epoxy laminate, which was a carrier layer, and two layers of Macro Fiber Composite (MFC), type P1, which were piezoelectric layers. MFC patches were glued symmetrically on both sides of the carrier layer. The glued connection of MFC patches to the carrier layer was achieved with the use of Epoxy Adhesive DP490, produced by the 3M company. The structure of the bimorph is shown in Figure 1.
The geometric parameters of the manufactured bimorph are presented in Table 1.
The schema of the laboratory stand is presented in Figure 2a, and a picture of the manufactured bimorph and its localization in the laboratory stand in Figure 2b.
The input voltage generation system consisted of an RT_DAC/Zynq A/D board, a TD250-INV voltage amplifier, and the MATLAB Simulink program. The RT_DAC/Zynq A/D board, manufactured by INTECO, was used for real-time data acquisition and input voltage generation. A prototyping of input voltage courses was carried out in the MATLAB Simulink program, from which they were sent to the RT_DAC/Zynq A/D board using a special toolbox described in [35]. Then, the RT_DAC/Zynq A/D board generated input voltages to the TD250-INV voltage amplifier, which amplified these input signals. The amplifier was operated in a bridge load configuration, as described in [36].
The measurement system consisted of an LG5B65PI laser sensor of displacement and the RT_DAC/Zynq A/D board described in the previous paragraph. The LG5B65PI laser sensor, produced by the BANNER company, had a measurement resolution equal to 40 microns for measurement at a frequency equal to 450 Hz [37]. The analog linearity of the sensor used was ±10 microns, which mainly affected the accuracy of the measurement.
3. Results
3.1. Laboratory Research Program
The research included 40 experiments. In the first 10 experiments, the input voltage u was applied only to the upper MFC patch (unimorph). In the next 10 experiments (from 11 to 20), the input voltage u1 was applied to the upper MFC patch, and input voltage u2 to the bottom MFC patch (bimorph). The courses of input signals in experiments 1 to 20 are presented in Figure 3, and their maximum and minimum values in Table 2.
In the next 10 experiments (21 to 30), the input voltage u was applied only to the upper MFC patch (unimorph), but with different frequencies: 1 Hz, 2 Hz, 4 Hz, 8 Hz, and 16 Hz. In the last 10 experiments (31 to 40), the input voltage u1 was applied to the upper MFC patch, and input voltage u2 to the lower MFC patch (bimorph), with the same frequencies as the unimorph. The courses of input voltages in experiments 21 to 40 are presented in Figure 4, and their maximum and minimum values in Table 3.
3.2. Impact of the Input Voltage Value on Hysteresis Waveforms
Table 4 shows the maximum values of hysteresis determined in all experiments, together with the corresponding values of input voltages.
Figure 5 shows the displacements of the cantilever beam tip, which were obtained both from numerical simulations and from measurements of the displacement of the manufactured actuator tip.
A comparison of maximums of actuator beam tip displacement and maximums hysteresis is presented in Figure 6.
In each of the laboratory experiments, the actuator displacement approximation, with the fourth-order polynomial, was performed. This order of the polynomial was proposed in [38]. These approximations were taken as the expected mathematical values. Comparison of the approximation of displacements with the measured displacements is shown in Figure 7.
Table 5 shows the mean displacement of the beam tip, the standard deviation, and the variance.
The measurement accuracy was estimated on the basis of the average standard deviation. The average standard deviation of the displacement measurement of the unimorph was 0.003 mm; therefore, it can be assumed that the measurement was made with an accuracy of ±0.003 mm. The average standard deviation of the displacement measurement of the bimorph was 0.004 mm; therefore, the precision was ±0.004 mm.
3.3. Impact of Frequency Changes of the Application of Input Voltage on Hysteresis Waveforms
Figure 8 shows the displacements of the tip of the manufactured cantilever beam for five application frequencies of input voltage both in the unimorph and the bimorph.
Comparisons of maximum hystereses for frequencies: 1 Hz, 2 Hz, 4 Hz, 8 Hz, and 16 Hz are presented in Figure 9.
4. Discussion
Firstly, note that the hysteresis curves presented in Figure 5 reach their maximum value at an input voltage lower than their maximum value. This is because the actuator output displacement exhibits phase lag to the driving voltage [39]. Wang et al. [40] noticed that the width of the hysteresis loop gradually widens as the input frequency increases. This causes the maximum displacement to be achieved at lower and lower values of input voltage. Obtaining the maximum displacement value for lower and lower values of input voltage with increasing input voltage frequency is visible in the diagrams shown in Figure 8.
To answer the research question posed in the introduction, in each experiment the percentage ratio of maximum hysteresis and maximum displacement of the actuator beam tip was calculated. Fu et al. [41] proposed the same measure of error caused by the hysteresis phenomenon for a unimorph based on MFC. The calculated ratios are presented in Figure 10a.
It can be seen in Figure 10a that maximum hystereses represented a greater percentage of the maximum displacement of the actuator beam tip in the motion of the bimorph in comparison to the motion of the unimorph. This percentage averaged 32.92% in the motion of the unimorph (experiments 1 to 10) and 37.17% in the motion of the bimorph (experiments 11 to 20). Considering that the hysteresis courses in all experiments were strongly nonlinear, which can be seen in Figure 5, a ratio, expressed as a percentage, of the mean value of hysteresis and the maximum displacement of the actuator beam tip was calculated for each experiment. Calculated ratios are presented in Figure 10b. The mean value of hysteresis represented a greater percentage of the maximum displacement of the actuator beam tip in the motion of the bimorph in comparison to the motion of the unimorph. This percentage averaged 21.43% in the motion of the unimorph and 27.62% in the motion of the bimorph. Generally, larger hystereses were generated in a two-input system than in a one-input system, by 4.25% (maximum hysteresis in relation to maximums of actuator tip displacement) and by 6.19% (mean values of hysteresis in relation to maximums of actuator tip displacement). Figure 11 shows the courses of these maximum displacements and mean values of hysteresis.
Increases in maximum displacements of the actuator beam tip, maximum hystereses, and mean values of hysteresis were determined for the unimorph and bimorph. Comparison of these increases, expressed as a percentage, is shown in Figure 12.
The use of the two-input system led to an increase in actuator tip displacement by an average of 55.5% compared to the single-input system, with maximum hystereses increasing by an average of 78.2% and mean hystereses increasing by 101%.
The last element of the analysis was to compare the hystereses of the bimorph and unimorph in the range of characteristic input voltages for these hystereses. According to Figure 5, there are two characteristic input voltages corresponding to the value of the maximum displacement of the actuator beam tip (voltage no. 1) and the occurrence of maximum hysteresis (voltage no. 2), respectively. Figure 13 shows a comparison of these input voltage values between the bimorph and the unimorph.
It should be noted that the measured input, voltage no. 1, is consistent with the results of other researchers. Fujii et al. [39] noticed that an output displacement takes its maximum value when the input voltage starts decreasing. Considering both characteristic input voltages, it can be concluded that the hysteresis shape changed only slightly in the bimorph motion compared to the hysteresis shape in the unimorph motion. The average input, voltage no. 1, was 259 V for the unimorph and 256 V for the bimorph, which was a decrease of 1.15%. The average input, voltage no. 2, was 93 V for unimorph and 98 V for bimorph, which was an increase of 5.37%.
The percentage ratios of maximum hysteresis and maximum displacement of the actuator beam tip were also calculated for five frequencies of input signal: 1 Hz, 2 Hz, 4 Hz, 8 Hz, and 16 Hz. The courses of these ratios are presented in Figure 14, separately, for the unimorph and the bimorph.
It can be seen in Figure 15 that the maximum hystereses represented a similar percentage of maximum displacement of the actuator beam tip in the motion of both bimorph and unimorph. This percentage averaged 69.11% in the motion of the unimorph (experiments 21 to 30) and 70.40% in the motion of the bimorph (experiments 31 to 40).
To generalize the experimental results obtained, a regression analysis of the hysteresis error courses was carried out. Hysteresis errors were calculated as the differences between the tip beam position when the input voltage was reduced and its position when the input voltage was increased. The regression analysis was carried out in MS Excel. The courses of hysteresis errors were approximated with the use of a fourth-order polynomial of known general formula:
where: eh is a hysteresis error, a, b, c, d, e are the estimated coefficients, and u is an input voltage, u = u1 = u2. Values of squared correlation coefficients for individual experiments are presented in Table 6. Figure 15 shows the selected results of the regression analysis.
The use of polynomials greater than four orders did not significantly improve the mapping of hysteresis errors. As the maximum value of the input voltage decreased, the square correlation coefficient R2 decreased for both the unimorph and bimorph.
The graphic presentation of the polynomials of the maximum input voltage u (unimorph), as well as the maximum input voltage u1 and minimum input voltage u2 (bimorph), is presented in Figure 16.
Based on polynomials, which are shown in Figure 16, a mean polynomial was determined for unimorph:
and for bimorph:
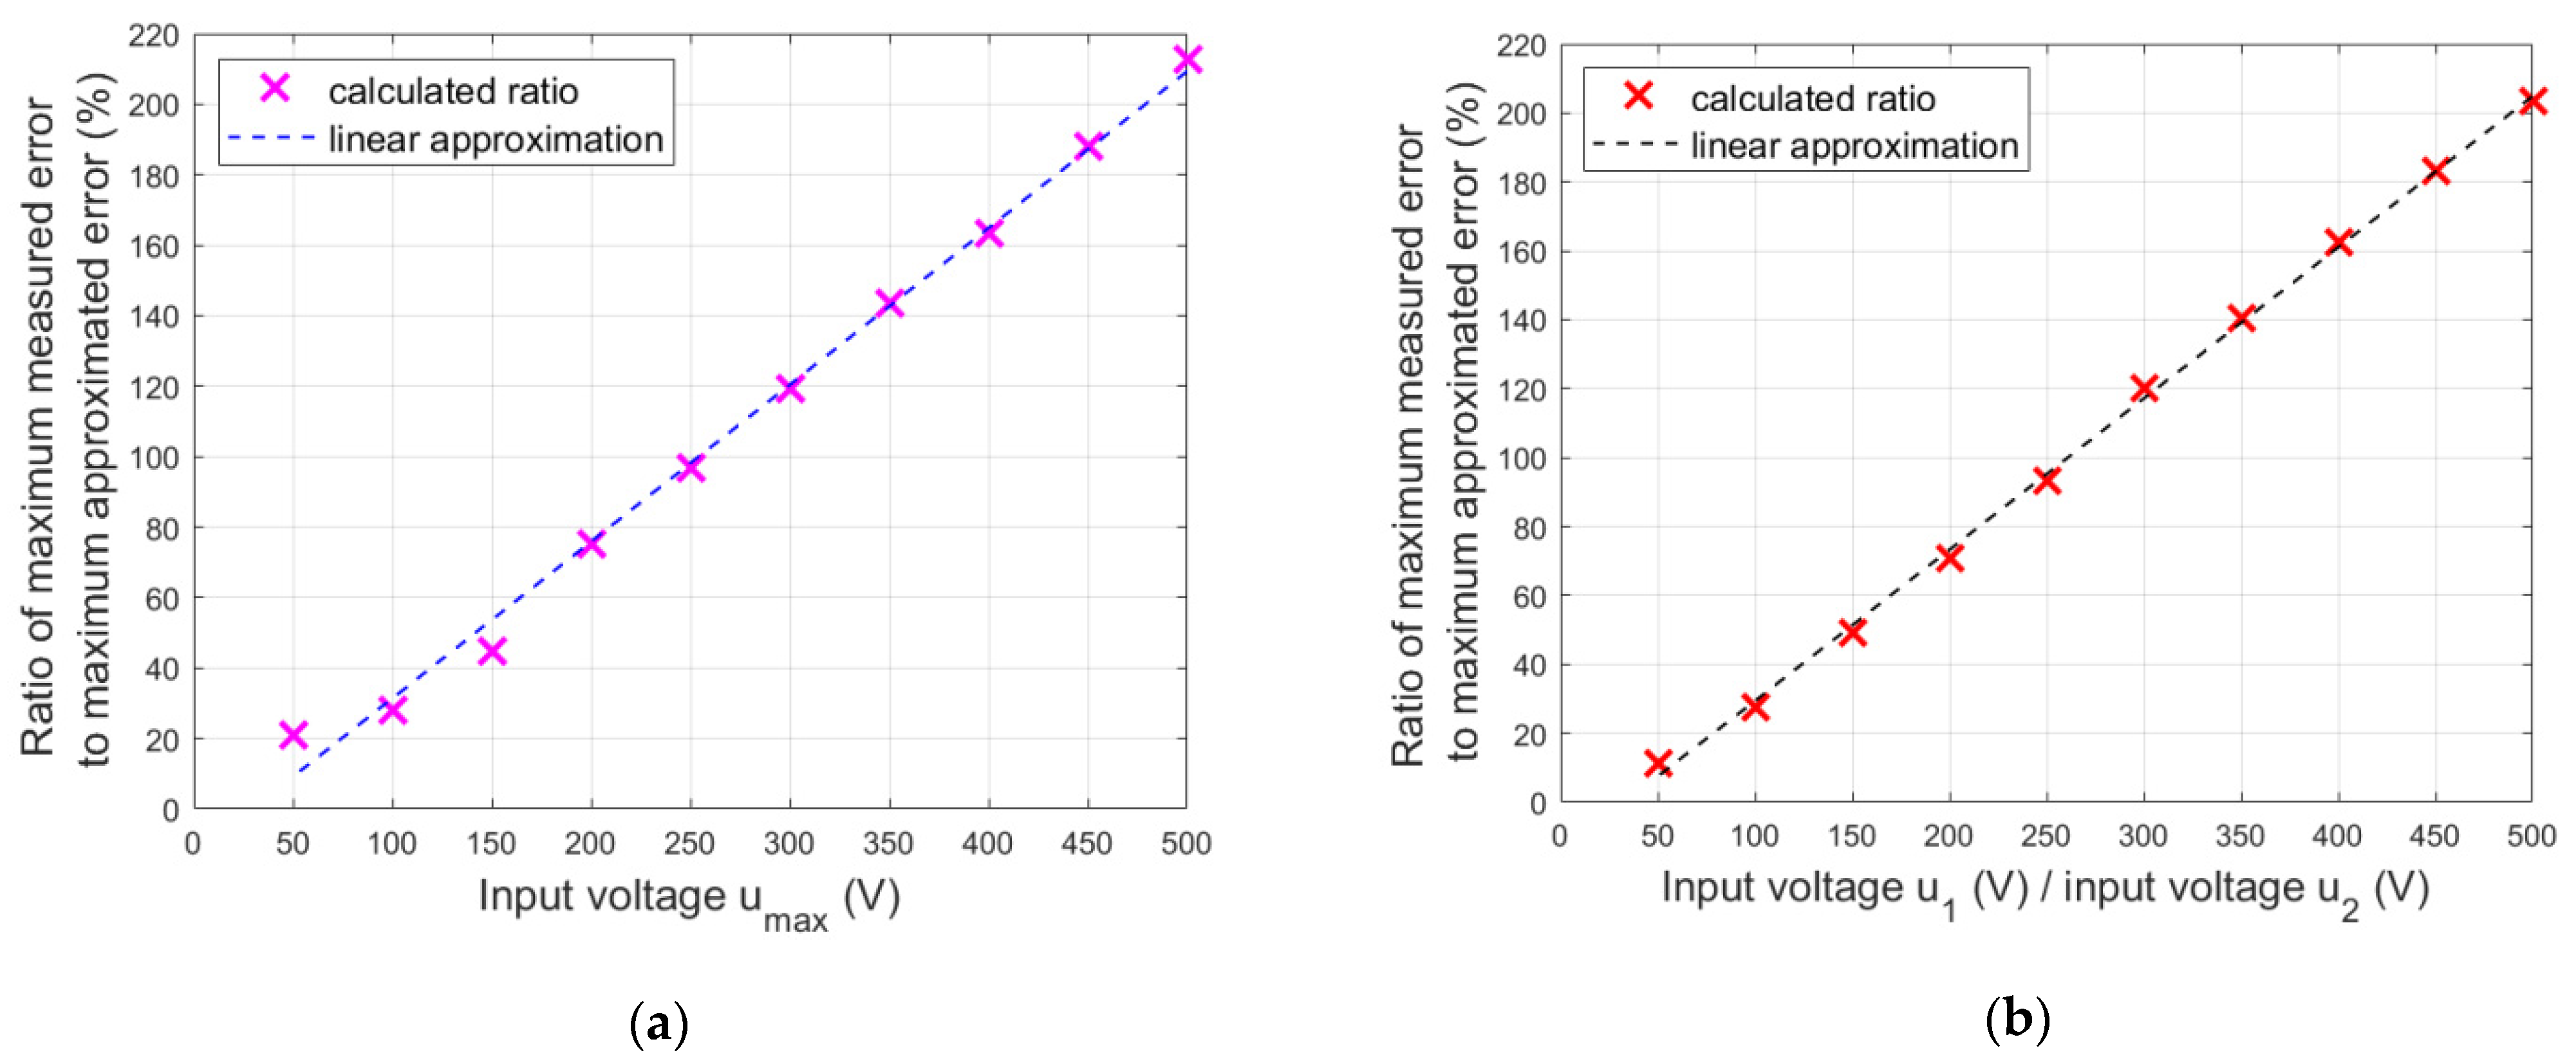
A maximum of the polynomial (3) for the bimorph is approximately linearly dependent on the maximum hysteresis error for each maximum value of the input voltages (Figure 17b). However, it can be seen that a maximum of the polynomial (2) for the unimorph is approximately linear only for limited range of maximum values of the input voltage, from 200 V to 500 V (Figure 17a). Yang et al. [42] noted a similar nonlinear region of the relationship between input voltage amplitude and disturbance amplitude caused by hysteresis.
From a practical point of view, the results presented can be used in the design of micro gripper control systems. For example, Ghos et al. [43] presented the use of a bimorph actuator in the micro gripper structure of a robot. It should be noted that, in the bimorph compared to the unimorph, with an increase in the frequency of input voltage changes, the maximum hysteresis increases much faster than the displacement, which corresponds to the maximum input voltage (Figure 8). Therefore, for high frequencies of input voltage changes, unimorph is a better choice.
5. Conclusions
A comparison of hysteresis courses in the motion of a two-input bimorph actuator and the motion of a unimorph actuator was a subject of this article. The scientific aim of this article was a comparative analysis of the hysteresis curves that occur in bimorph motion and the hysteresis curves that occur in unimorph motion, with particular emphasis on the characteristic points of these curves: maximum hystereses and maximum beam tip displacement.
It was noticed that the maximum hysteresis value increases faster than the beam tip displacement in bimorph motion in comparison to unimorph motion. The relationship between these two variables is not linear between unimorph and bimorph. The same is true for a mean value of hysteresis. With an average increase of 55.5% beam tip displacements between unimorph and bimorph, the average increase of maximum hystereses was 78.2%, and mean values of hystereses changed by 101%.
Based on changes of characteristic input voltages, corresponding to maximum displacement of the actuator beam tip and maximum hysteresis, it can be concluded that the hysteresis shape changed only slightly in the bimorph motion compared to the hysteresis shape in the unimorph motion. First characteristic voltage decreased by an average of 1.15%, and second characteristic voltage increased by an average of 5.37%, in bimorph motion compared to unimorph motion.
From a practical point of view, the unimorph is a better choice compared to the bimorph in applications in which high changes in frequency of input voltages appear.
Funding
This research was funded by the AGH University of Science and Technology within the scope of the Research Program No. 16.16.130.942.
Data Availability Statement
Data is contained within the article.
Conflicts of Interest
The authors declare no conflict of interest.
References
- Yang, C.; Youcef-Toumi, K. Principle, implementation, and applications of charge control for piezo-actuated nanopositioners: A comprehensive review. Mech. Syst. Signal Process. 2022, 171, 108885. [Google Scholar] [CrossRef]
- Chilibon, I.; Dias, C.; Inacio, P.; Marat-Mendes, J. PZT and PVDF bimorph actuators. J. Optoelectron. Adv. Mater. 2007, 9, 1939–1943. [Google Scholar]
- Wang, X.; Zhou, W.; Wu, Z.; Wu, W. Optimal unimorph and bimorph configurations of piezocomposite actuators for bending and twisting vibration control of plate structures. J. Intell. Mater. Syst. Struct. 2018, 29, 1685–1696. [Google Scholar] [CrossRef]
- Takagi, K.; Li, J.F.; Yokoyama, S.; Watanabe, R.; Almajid, A.; Taya, M. Design and fabrication of functionally graded PZT/Pt piezoelectric bimorph actuator. Sci. Technol. Adv. Mater. 2002, 3, 217. [Google Scholar] [CrossRef]
- Sumit; Kane, S.R.; Sinha, A.K.; Shukla, R. Electric field-induced nonlinear behavior of lead zirconate titanate piezoceramic actuators in bending mode. Mech. Adv. Mater. Struct. 2022, 1–10. [Google Scholar] [CrossRef]
- Hu, D.; Lou, J.; Chen, T.; Yang, Y.; Xu, C.; Chen, H.; Cui, Y. Micro thrust measurement experiment and pressure field evolution of bionic robotic fish with harmonic actuation of macro fiber composites. Mech. Syst. Signal Process. 2021, 153, 107538. [Google Scholar] [CrossRef]
- Mallek, H.; Jrad, H.; Wali, M.; Dammak, F. Piezoelastic response of smart functionally graded structure with integrated piezoelectric layers using discrete double directors shell element. Compos. Struct. 2019, 210, 354–366. [Google Scholar] [CrossRef]
- Donoso, A.; Sigmund, O. Optimization of piezoelectric bimorph actuators with active damping for static and dynamic loads. Struct. Multidiscip. Optim. 2009, 38, 171–183. [Google Scholar] [CrossRef] [Green Version]
- Wang, H.; Xie, X.; Zhang, M.; Wang, B. Analysis of the nonlinear hysteresis of the bimorph beam piezoelectric bending actuator for the deformable mirror systems. J. Astron. Telesc. Instrum. Syst. 2020, 6, 029002. [Google Scholar] [CrossRef]
- Mansour, S.Z.; Seethaler, R.J.; Teo, Y.R.; Yong, Y.K.; Fleming, A.J. Piezoelectric bimorph actuator with integrated strain sensing electrodes. IEEE Sens. J. 2018, 18, 5812–5817. [Google Scholar] [CrossRef]
- Shen, D.; Wen, J.; Ma, J.; Hu, Y.; Wang, R.; Li, J. A novel linear inertial piezoelectric actuator based on asymmetric clamping materials. Sens. Actuators A Phys. 2020, 303, 111746. [Google Scholar] [CrossRef]
- Davis, C.L.; Calkins, F.T.; Butler, G.W. High-frequency jet nozzle actuators for noise reduction. In Smart Structures and Materials 2003: Industrial and Commercial Applications of Smart Structures Technologies; Anderson, E.H., Ed.; SPIE: San Diego, CA, USA, 2003; Volume 5054, pp. 34–44. [Google Scholar]
- Wang, Q.M.; Cross, L.E. Performance analysis of piezoelectric cantilever bending actuators. Ferroelectrics 1998, 215, 187–213. [Google Scholar] [CrossRef]
- Wang, H. Analytical analysis of a beam flexural-mode piezoelectric actuator for deformable mirrors. J. Astron. Telesc. Instrum. Syst. 2015, 1, 049001. [Google Scholar] [CrossRef]
- Chopra, S.; Gravish, N. Piezoelectric actuators with on-board sensing for micro-robotic applications. Smart Mater. Struct. 2019, 28, 115036. [Google Scholar] [CrossRef]
- Wood, R.J.; Steltz, E.; Fearing, R.S. Optimal energy density piezoelectric bending actuators. Sens. Actuators A Phys. 2005, 119, 476–488. [Google Scholar] [CrossRef]
- Zhang, X.; Tan, Y. A hybrid model for rate-dependent hysteresis in piezoelectric actuators. Sens. Actuators A Phys. 2010, 157, 54–60. [Google Scholar] [CrossRef]
- Ru, C.; Chen, L.; Shao, B.; Rong, W.; Sun, L. A hysteresis compensation method of piezoelectric actuator: Model, identification and control. Control Eng. Pract. 2009, 17, 1107–1114. [Google Scholar] [CrossRef]
- Xiaomin, X.; Luqi, C.; Xiaohong, W.; Qing, S. Study on electric–mechanical hysteretic model of Macro-Fiber Composite actuator. Journal Intell. Mater. Syst. Struct. 2014, 25, 1469–1483. [Google Scholar] [CrossRef]
- Jain, R.K.; Majumder, S.; Ghosh, B. Design and analysis of piezoelectric actuator for micro gripper. Int. J. Mech. Mater. Des. 2015, 11, 253–276. [Google Scholar] [CrossRef]
- Hu, K.M.; Li, H.; Wen, L.H. Experimental study of axial-compressed macro-fiber composite bimorph with multi-layer parallel actuators for large deformation actuation. J. Intell. Mater. Syst. Struct. 2020, 31, 1101–1110. [Google Scholar] [CrossRef]
- Gan, J.; Zhang, X. A review of nonlinear hysteresis modeling and control of piezoelectric actuators. AIP Adv. 2019, 9, 040702. [Google Scholar] [CrossRef]
- Rakotondrabe, M.; Clévy, C.; Lutz, P. Complete open loop control of hysteretic, creeped, and oscillating piezoelectric cantilevers. IEEE Trans. Autom. Sci. Eng. 2009, 7, 440–450. [Google Scholar] [CrossRef] [Green Version]
- Zhang, J.; Yang, Y.; Lou, J.; Wei, Y.; Fu, L. Development and hybrid position/force control of a dual-drive macro-fiber-composite microgripper. Sensors 2018, 18, 1301. [Google Scholar] [CrossRef] [PubMed] [Green Version]
- Hu, K.; Ge, H.; Li, H.; Xie, S.; Xu, S. Rate-Dependent Hysteresis Modeling and Displacement Tracking Control Based on Least-Squares SVM for Axially Pre-Compressed Macro-Fiber Composite Bimorph. Materials 2022, 15, 6480. [Google Scholar] [CrossRef]
- Fleming, A.J. Charge drive with active DC stabilization for linearization of piezoelectric hysteresis. IEEE Trans. Ultrason. Ferroelectr. Freq. Control 2013, 60, 1630–1637. [Google Scholar] [CrossRef]
- Bashash, S.; Jalili, N. Underlying memory-dominant nature of hysteresis in piezoelectric materials. J. Appl. Phys. 2006, 100, 014103. [Google Scholar] [CrossRef]
- Rios, S.A.; Fleming, A.J. A new electrical configuration for improving the range of piezoelectric bimorph benders. Sens. Actuators A Phys. 2015, 224, 106–110. [Google Scholar] [CrossRef]
- Grzybek, D. LQG Control of the Smart Truss with the Piezoelectric Active Members. In Solid State Phenomena; Kot, A., Ed.; Trans Tech Publications Ltd.: Durnten-Zurich, Switzerland, 2014; Volume 208, pp. 125–133. [Google Scholar]
- Tamburrano, P.; Sciatti, F.; Plummer, A.R.; Distaso, E.; De Palma, P.; Amirante, R. A Review of Novel Architectures of Servovalves Driven by Piezoelectric Actuators. Energies 2021, 14, 4858. [Google Scholar] [CrossRef]
- Milecki, A.; Regulski, R. Investigations of electronic amplifiers supplying a piezobimorph actuator. Mech. Syst. Signal Process. 2016, 78, 43–54. [Google Scholar] [CrossRef]
- Chouza, A.; Barambones, O.; Calvo, I.; Velasco, J. Sliding mode-based robust control for piezoelectric actuators with inverse dynamics estimation. Energies 2019, 12, 943. [Google Scholar] [CrossRef] [Green Version]
- Smart Material—Home of the MFC. Available online: https://www.smart-material.com/MFC-product-mainV2.html (accessed on 30 August 2021).
- Grzybek, D. Control System for Multi-Input and Simple-Output Piezoelectric Beam Actuator Based on Macro Fiber Composite. Energies 2022, 15, 2042. [Google Scholar] [CrossRef]
- RT-DAC/Zynq User’s Manual. Available online: http://www.inteco.com.pl/Docs/Rtdac_Zynq.pdf (accessed on 30 August 2022).
- TD250 V9 Six Channel +/-250V Amplifier. Manual and Specifications. Available online: https://www.piezodrive.com/wp-content/uploads/2022/04/TD250-V9-R1.pdf (accessed on 30 August 2022).
- L-GAGE® LG Laser Gauging Sensors. Available online: https://info.bannerengineering.com/cs/groups/public/documents/literature/59786.pdf (accessed on 30 August 2022).
- Hung, S.K.; Hwu, E.T.; Hwang, S.; Fu, L.C. Postfitting control scheme for periodic piezoscanner driving. Jpn. J. Appl. Phys. 2006, 45, 1917. [Google Scholar] [CrossRef] [Green Version]
- Fujii, F.; Tatebatake, K.I.; Morita, K.; Shiinoki, T. A Bouc–Wen model-based compensation of the frequency-dependent hysteresis of a piezoelectric actuator exhibiting odd harmonic oscillation. Actuators 2018, 7, 37. [Google Scholar] [CrossRef] [Green Version]
- Wang, X.; Zhou, W.; Zhang, Z.; Jiang, J.; Wu, Z. Theoretical and experimental investigations on modified LQ terminal control scheme of piezo-actuated compliant structures in finite time. J. Sound Vib. 2021, 491, 115762. [Google Scholar] [CrossRef]
- Fu, Z.; Shen, Y.; Wang, S.; Jiang, W.; Li, J.; Bin, G.; Hu, B. Asymmetric Bouc-Wen hysteresis modeling for MFC actuator via hybrid APSO-TRR identification algorithm. Sens. Actuators A Phys. 2022, 346, 113830. [Google Scholar] [CrossRef]
- Yang, C.; Verbeek, N.; Xia, F.; Wang, Y.; Youcef-Toumi, K. Modeling and control of piezoelectric hysteresis: A polynomial-based fractional order disturbance compensation approach. IEEE Trans. Ind. Electron. 2020, 68, 3348–3358. [Google Scholar] [CrossRef]
- Ghosh, B.; Jain, R.K.; Majumder, S.; Roy, S.S.; Mukhopadhyay, S. Experimental characterizations of bimorph piezoelectric actuator for robotic assembly. J. Intell. Mater. Syst. Struct. 2017, 28, 2095–2109. [Google Scholar] [CrossRef]
Figure 1.
Main parts of a cross section of the bimorph: a, active parts of MFC patches; b, passive parts of MFC patches; c, a carrier layer; la, lengths of areas no a; lb, lengths of areas no b; lc, lengths of area no c; ld, distance between bimorph clamping assembly and displacement measurement point; 1, a perpendicular axis to the longitudinal axis of the carrier layer; 2, a parallel axis to the longitudinal axis of the carrier layer.

Figure 2.
Laboratory stand [34]: (a) connection diagram of the main parts; (b) view of the actuator manufactured during research.
Figure 2.
Laboratory stand [34]: (a) connection diagram of the main parts; (b) view of the actuator manufactured during research.
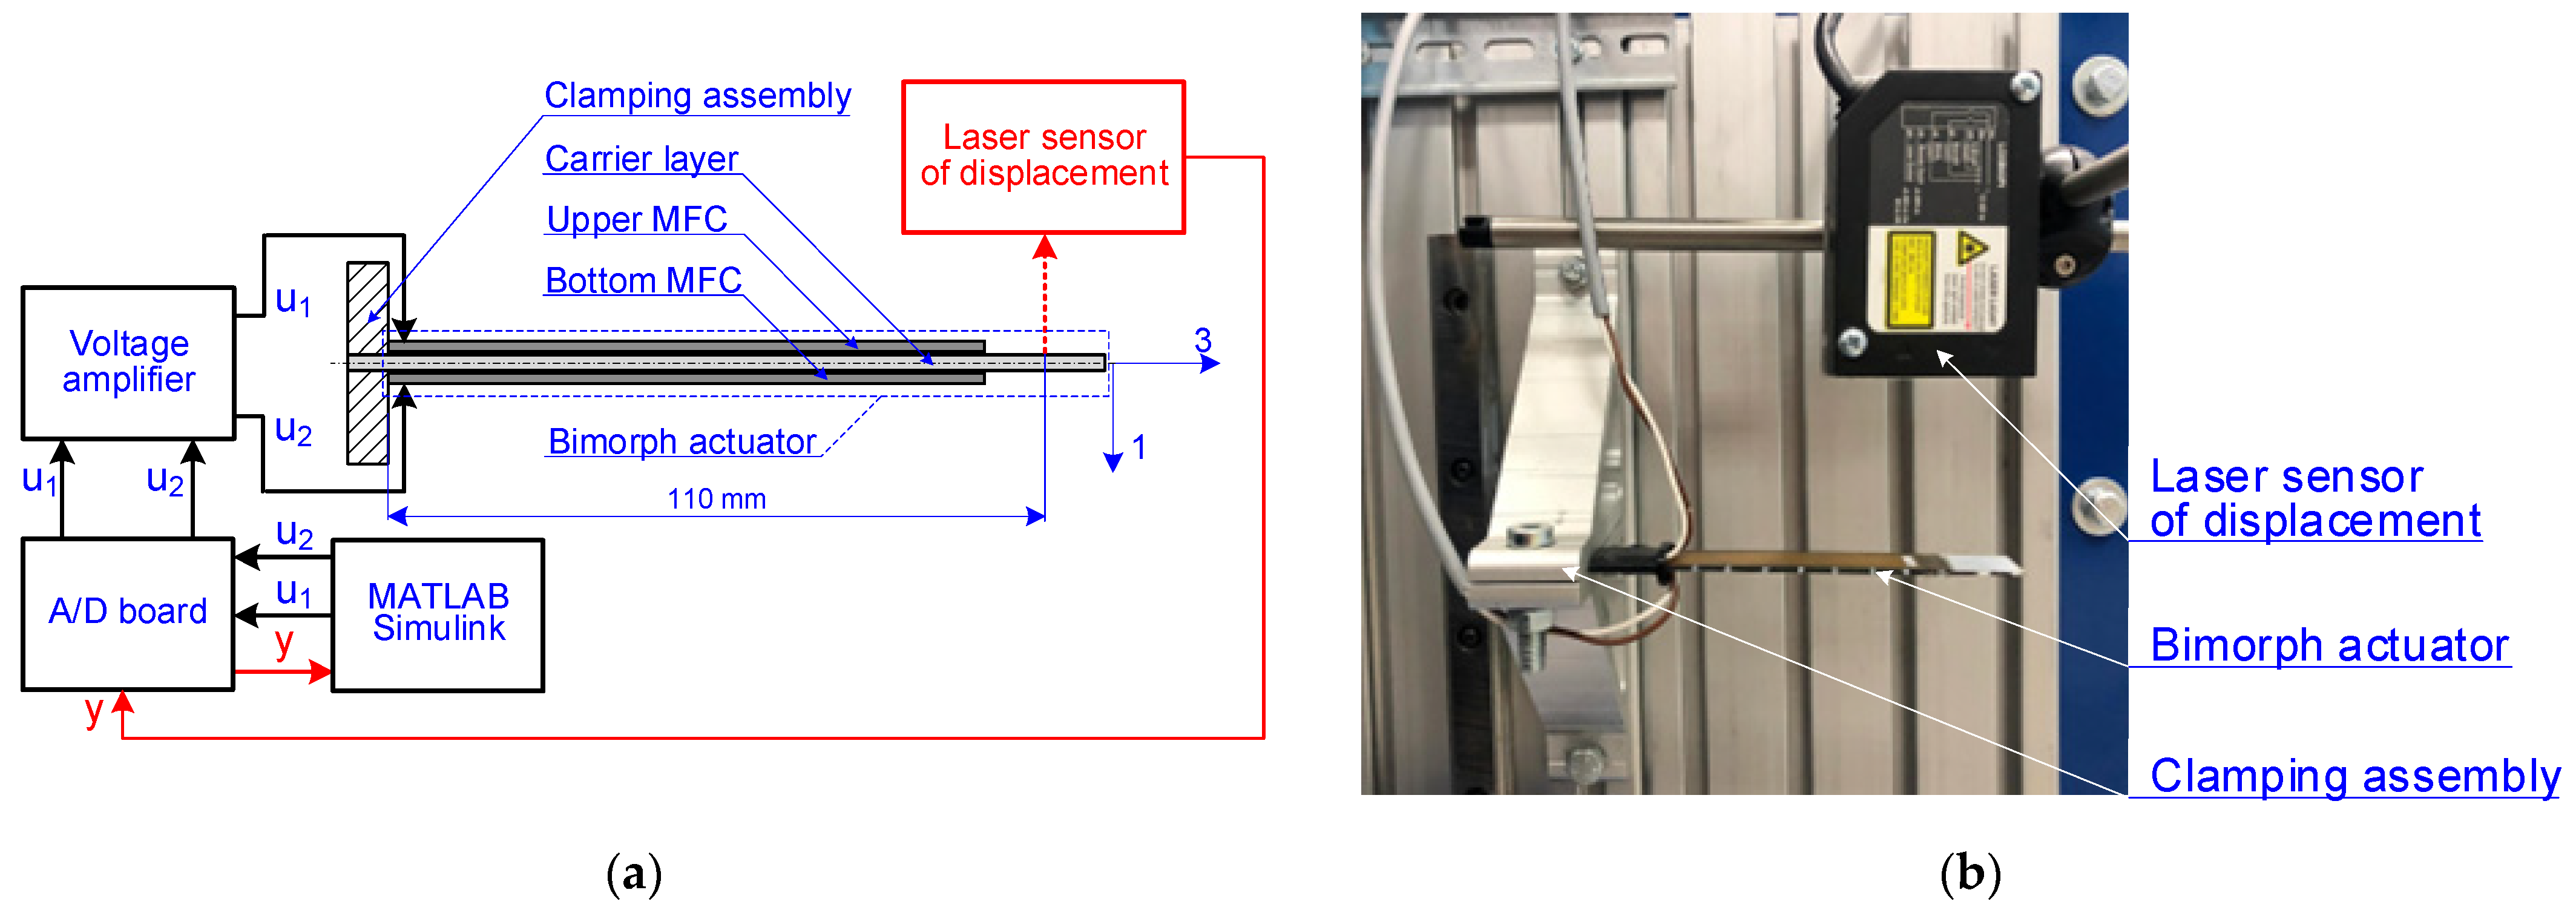
Figure 3.
Courses of input voltages (a) in experiments 1–10 and (b) in experiments 11–20.
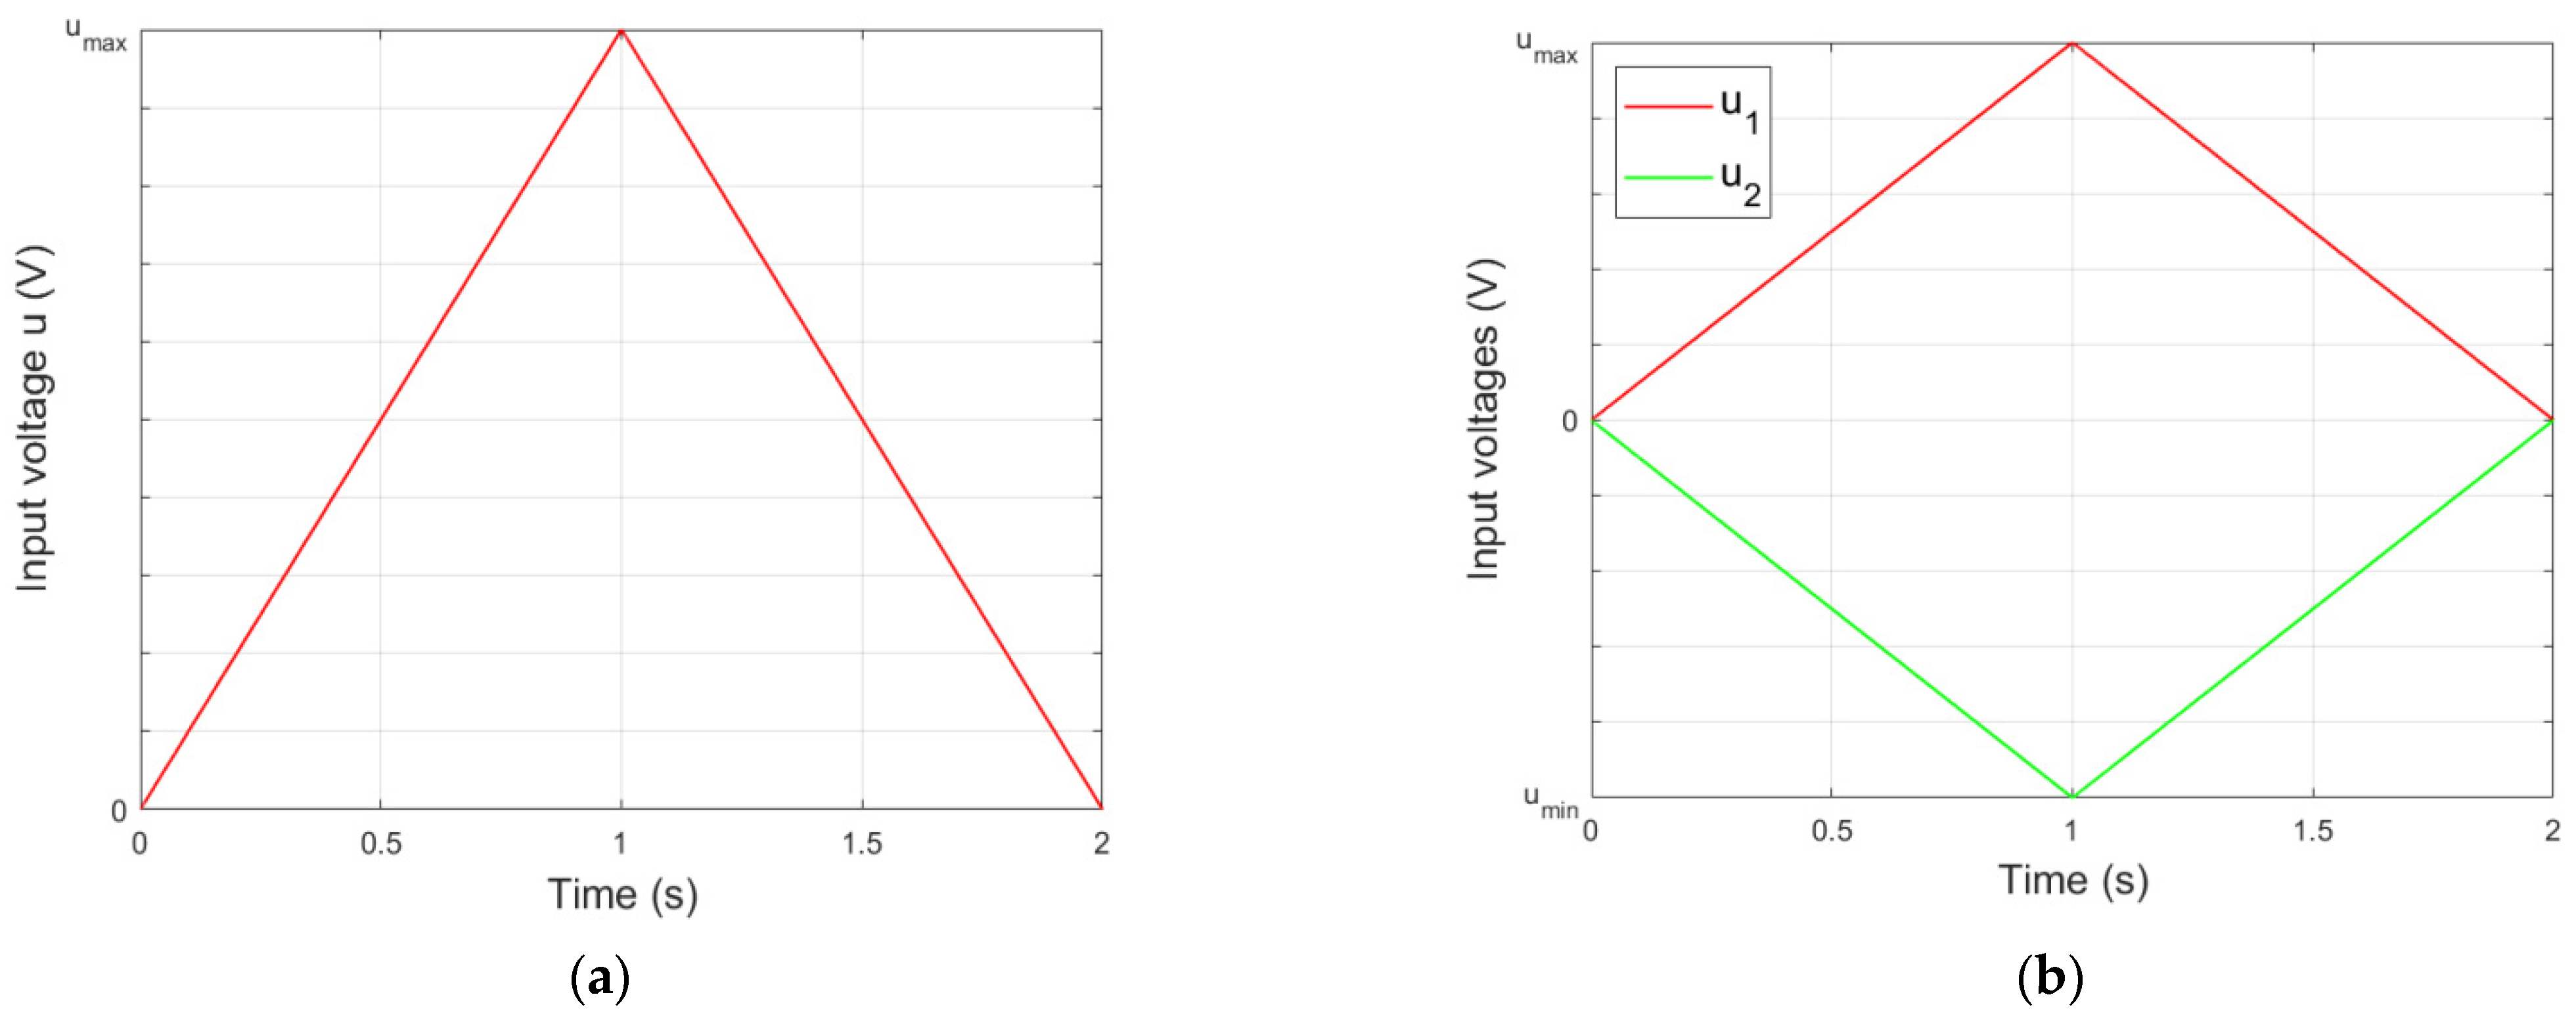
Figure 4.
Courses of input voltages (a) in experiments 21–70 and (b) in experiments 71–120.
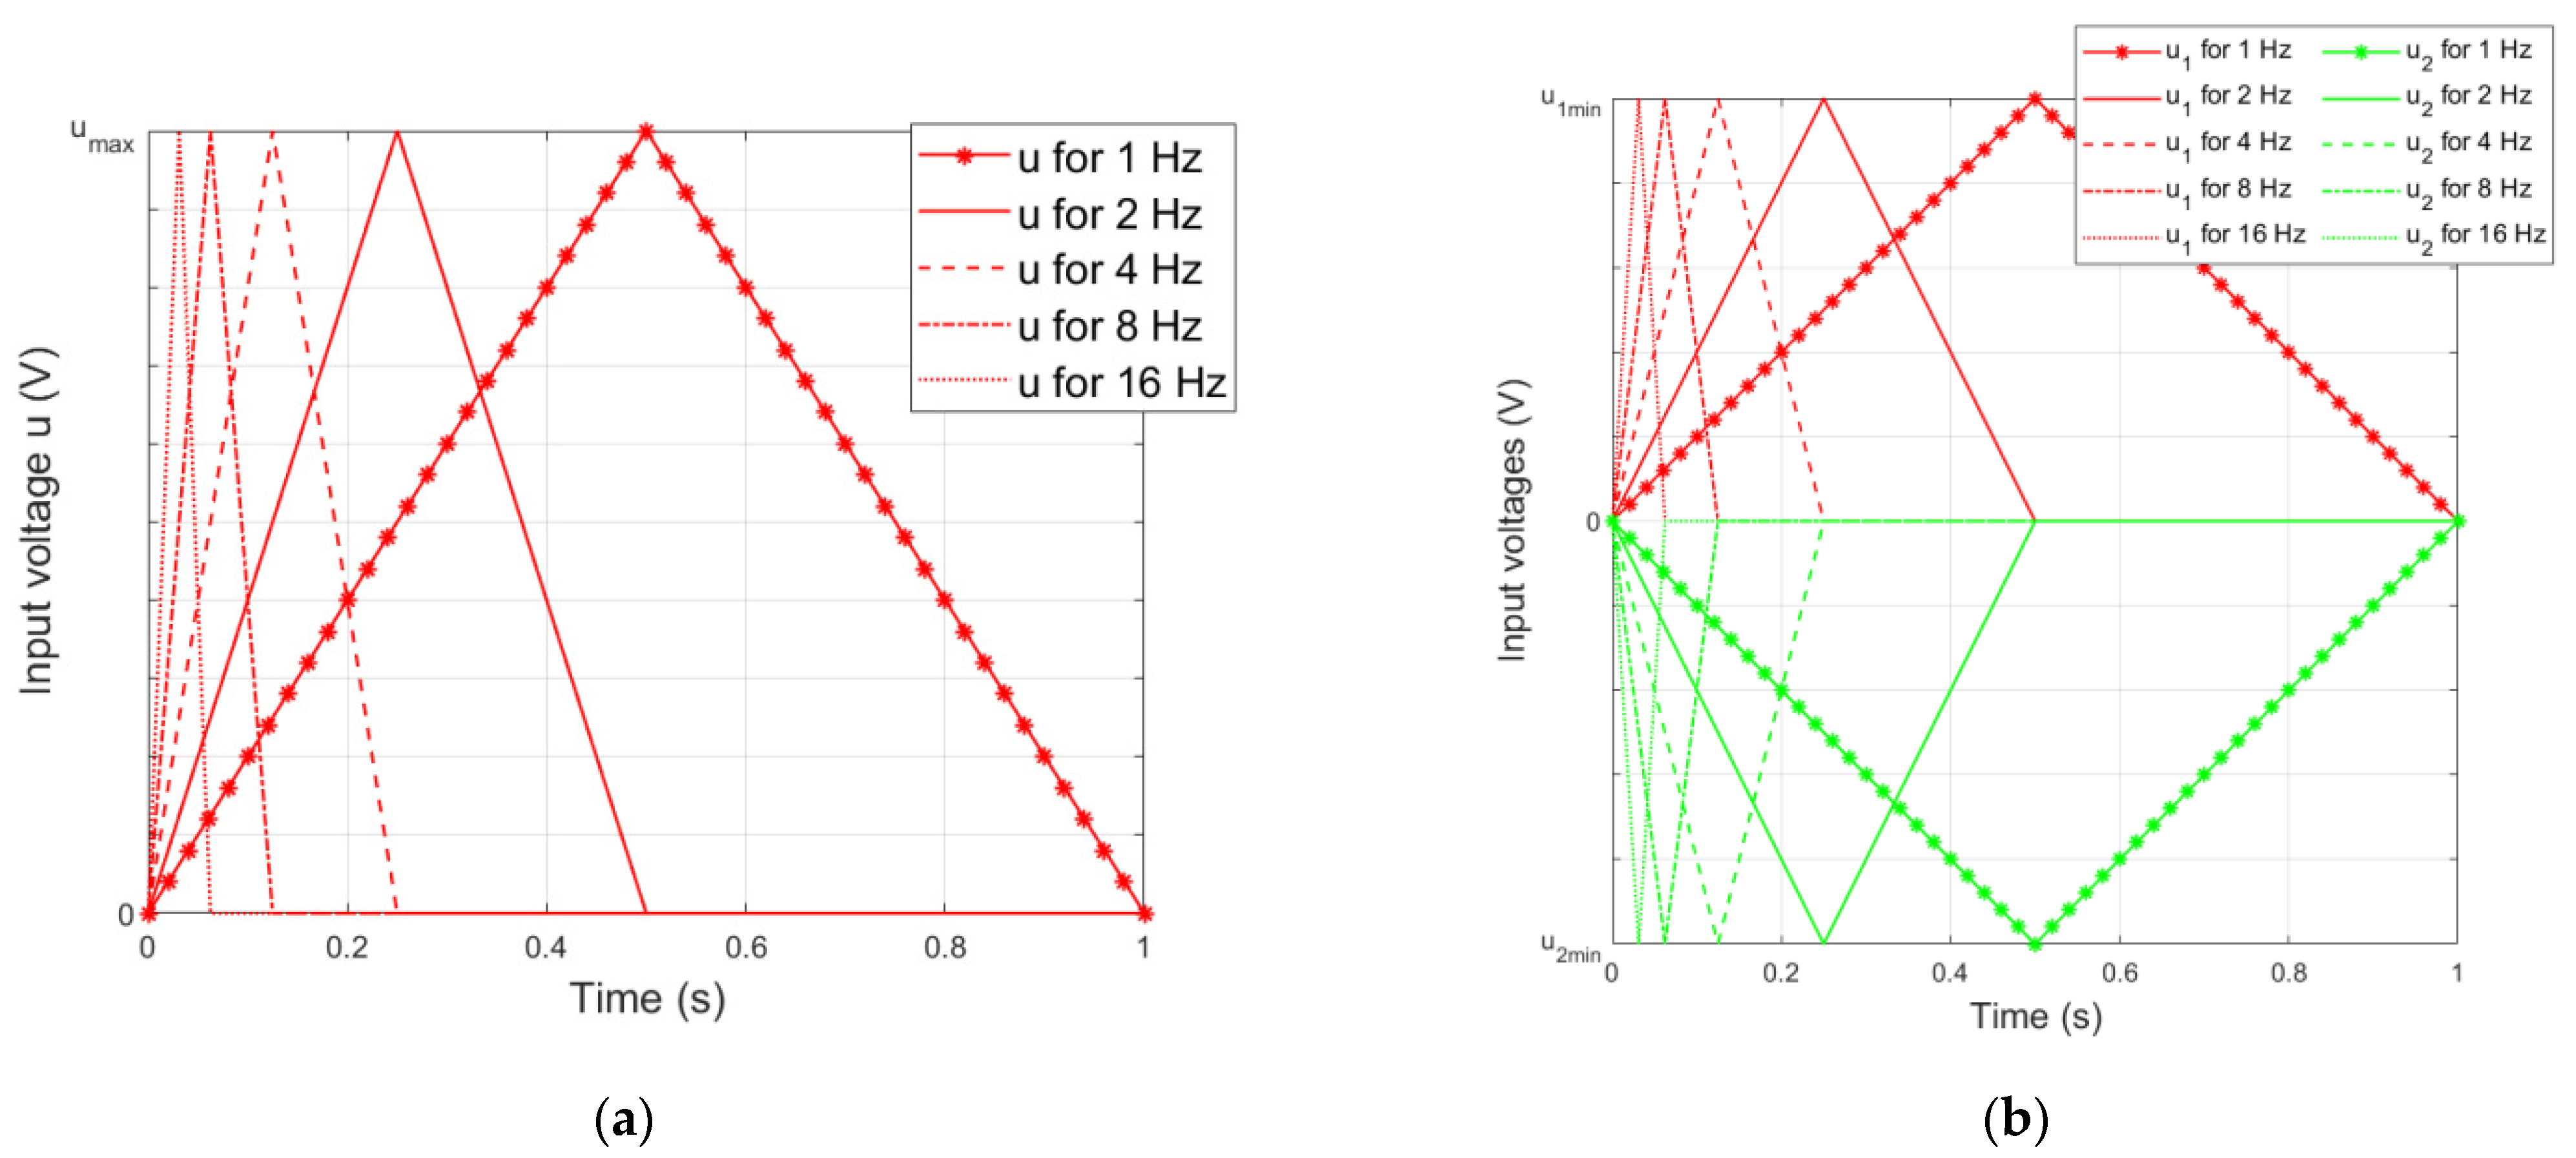
Figure 5.
Hysteresis loops: (a) displacement of a unimorph for umax = +250 V, (b) displacement of a bimorph for u1max = +250 V and u2max = –250 V, (c) displacement of a unimorph for umax = +500 V, (d) displacement of a bimorph for u1max = +500 V and u2max = −500 V.
Figure 5.
Hysteresis loops: (a) displacement of a unimorph for umax = +250 V, (b) displacement of a bimorph for u1max = +250 V and u2max = –250 V, (c) displacement of a unimorph for umax = +500 V, (d) displacement of a bimorph for u1max = +500 V and u2max = −500 V.

Figure 6.
Comparison of the maximum displacement of the actuator beam tip and maximum hystereses.
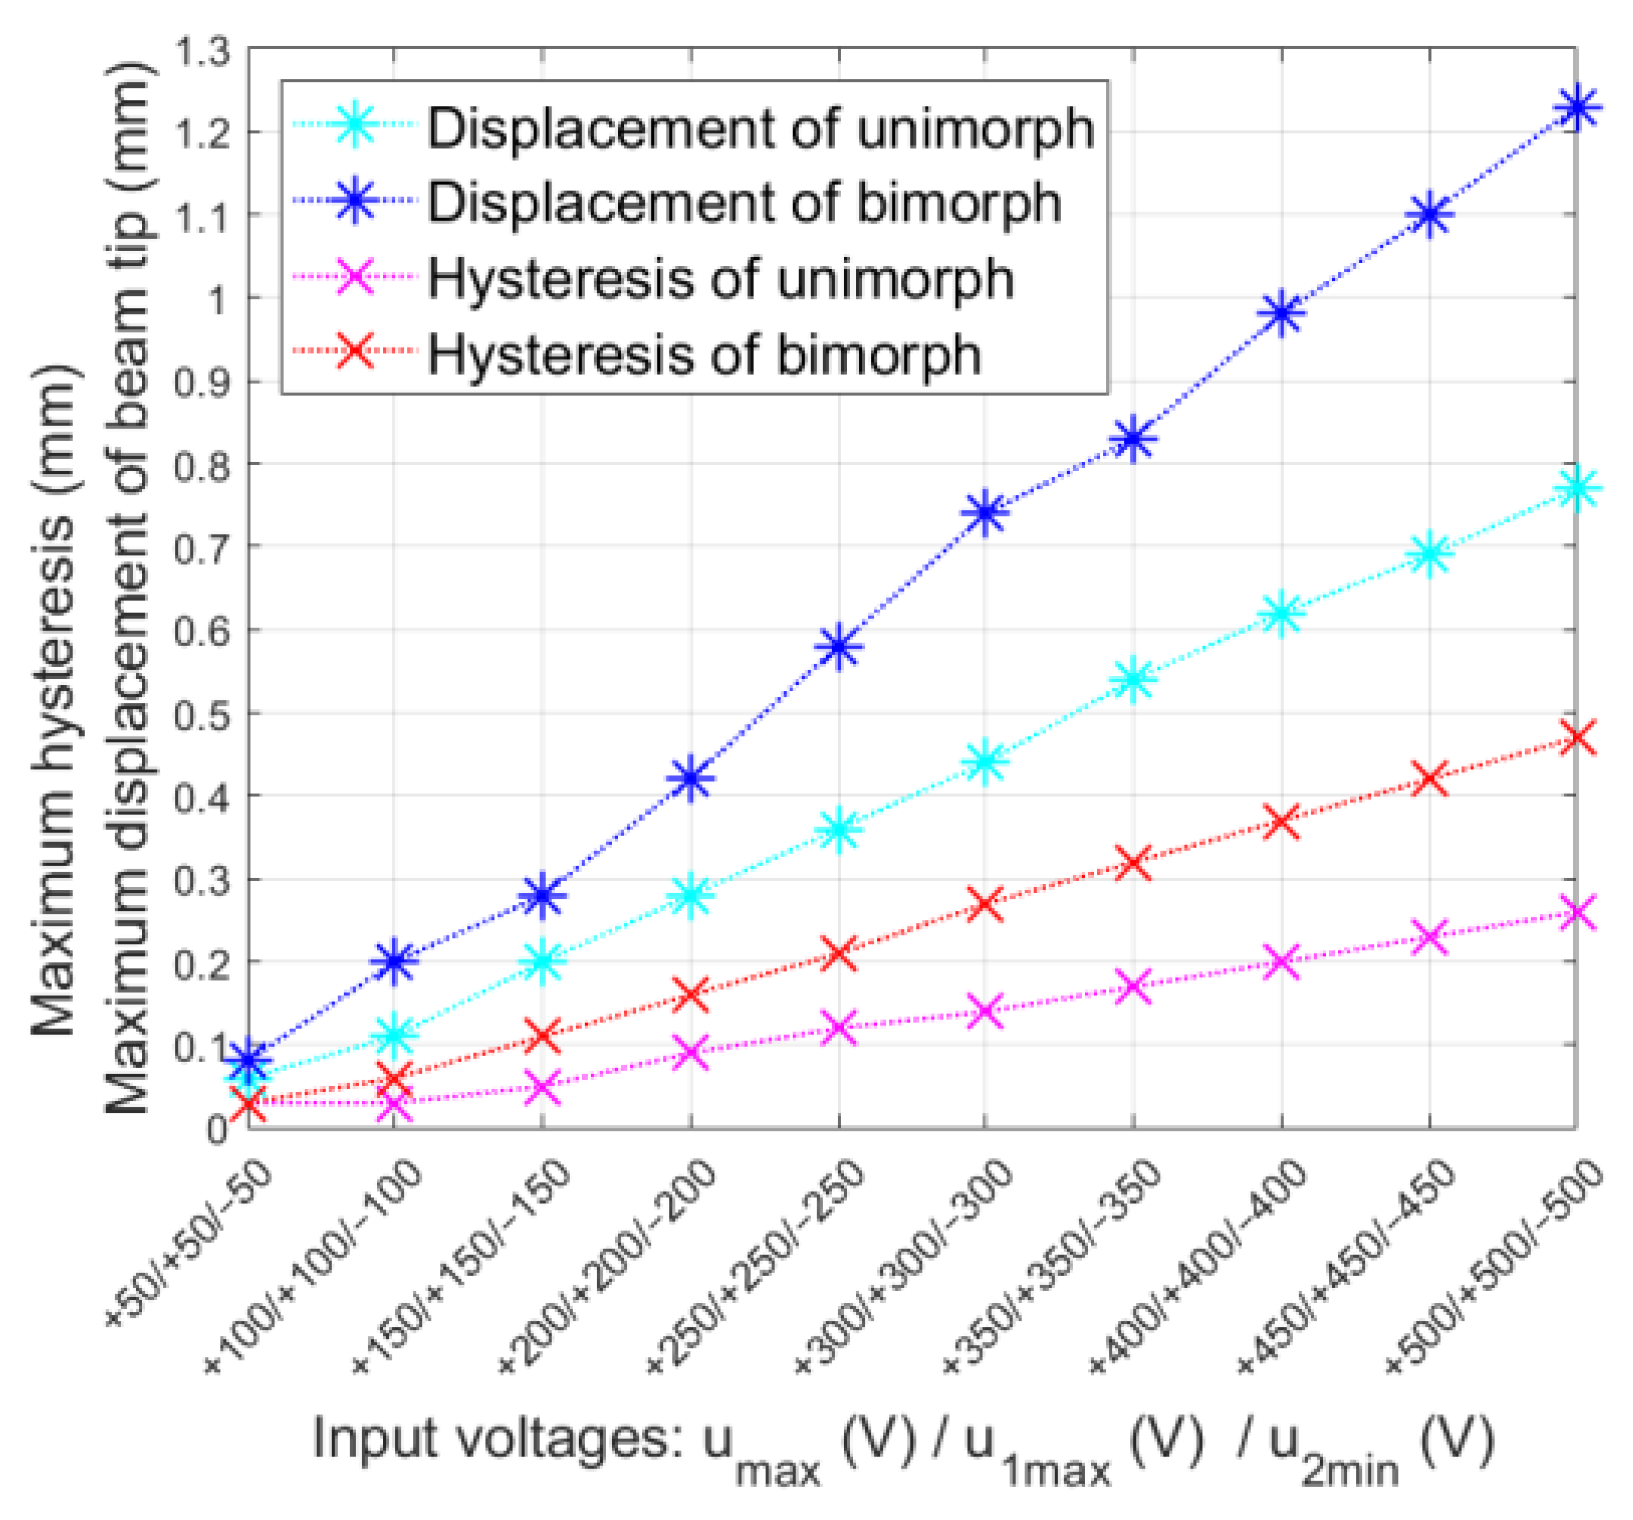
Figure 7.
Comparison of measured and approximated displacements: (a) unimorph motion, (b) bimorph motion.
Figure 7.
Comparison of measured and approximated displacements: (a) unimorph motion, (b) bimorph motion.
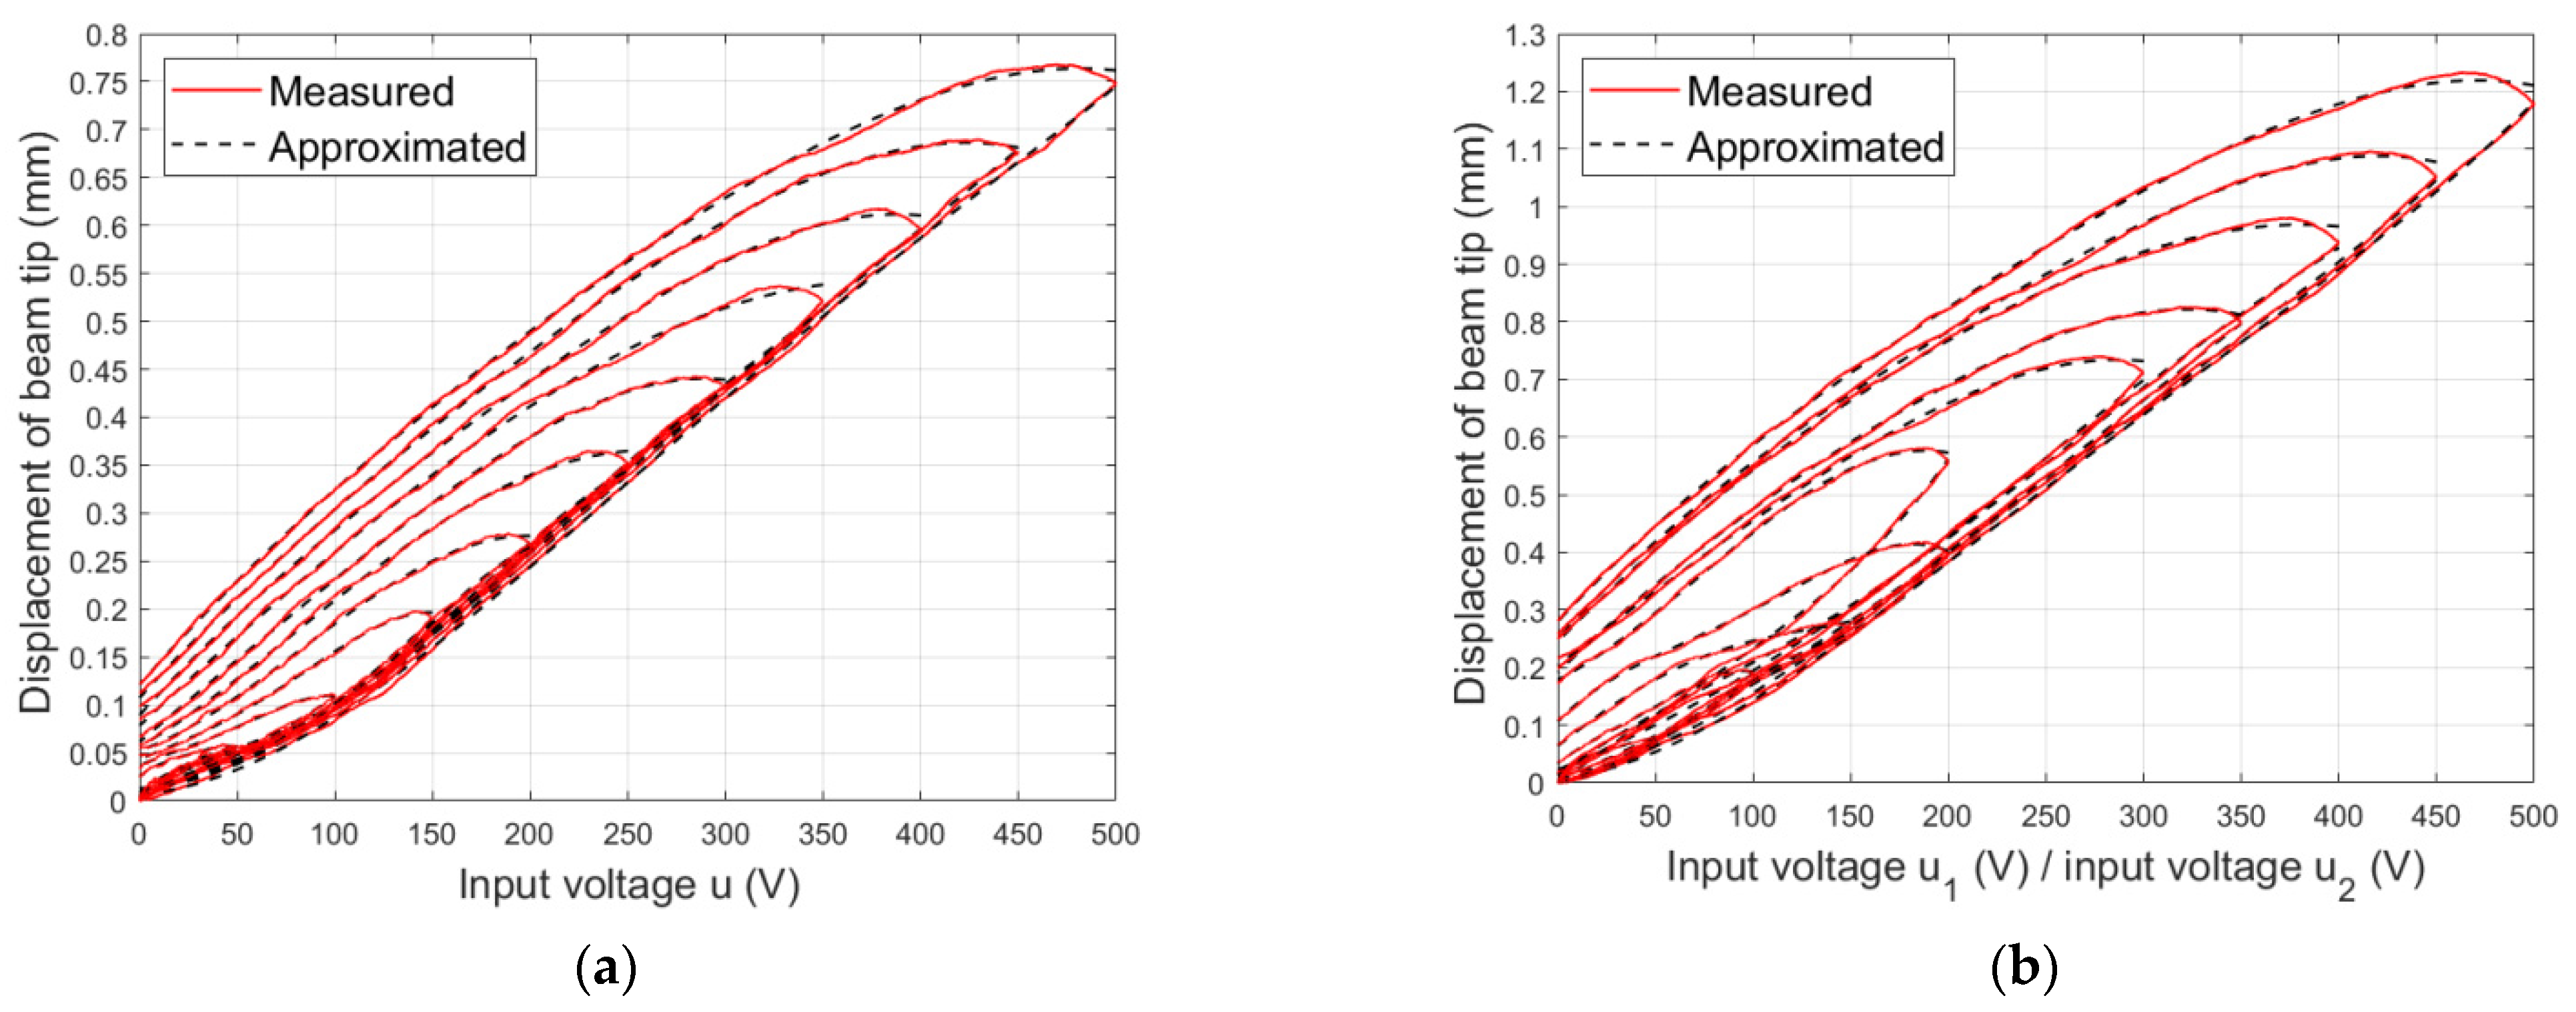
Figure 8.
Hysteresis loops in a unimorph and bimorph for umax = +500 V and u1max = +500 V, u2max = −500 V: (a) frequency equal to 1 Hz, (b) frequency equal to 2 Hz, (c) frequency equal to 4 Hz, (d) frequency equal to 8 Hz, (e) frequency equal to 16 Hz.
Figure 8.
Hysteresis loops in a unimorph and bimorph for umax = +500 V and u1max = +500 V, u2max = −500 V: (a) frequency equal to 1 Hz, (b) frequency equal to 2 Hz, (c) frequency equal to 4 Hz, (d) frequency equal to 8 Hz, (e) frequency equal to 16 Hz.
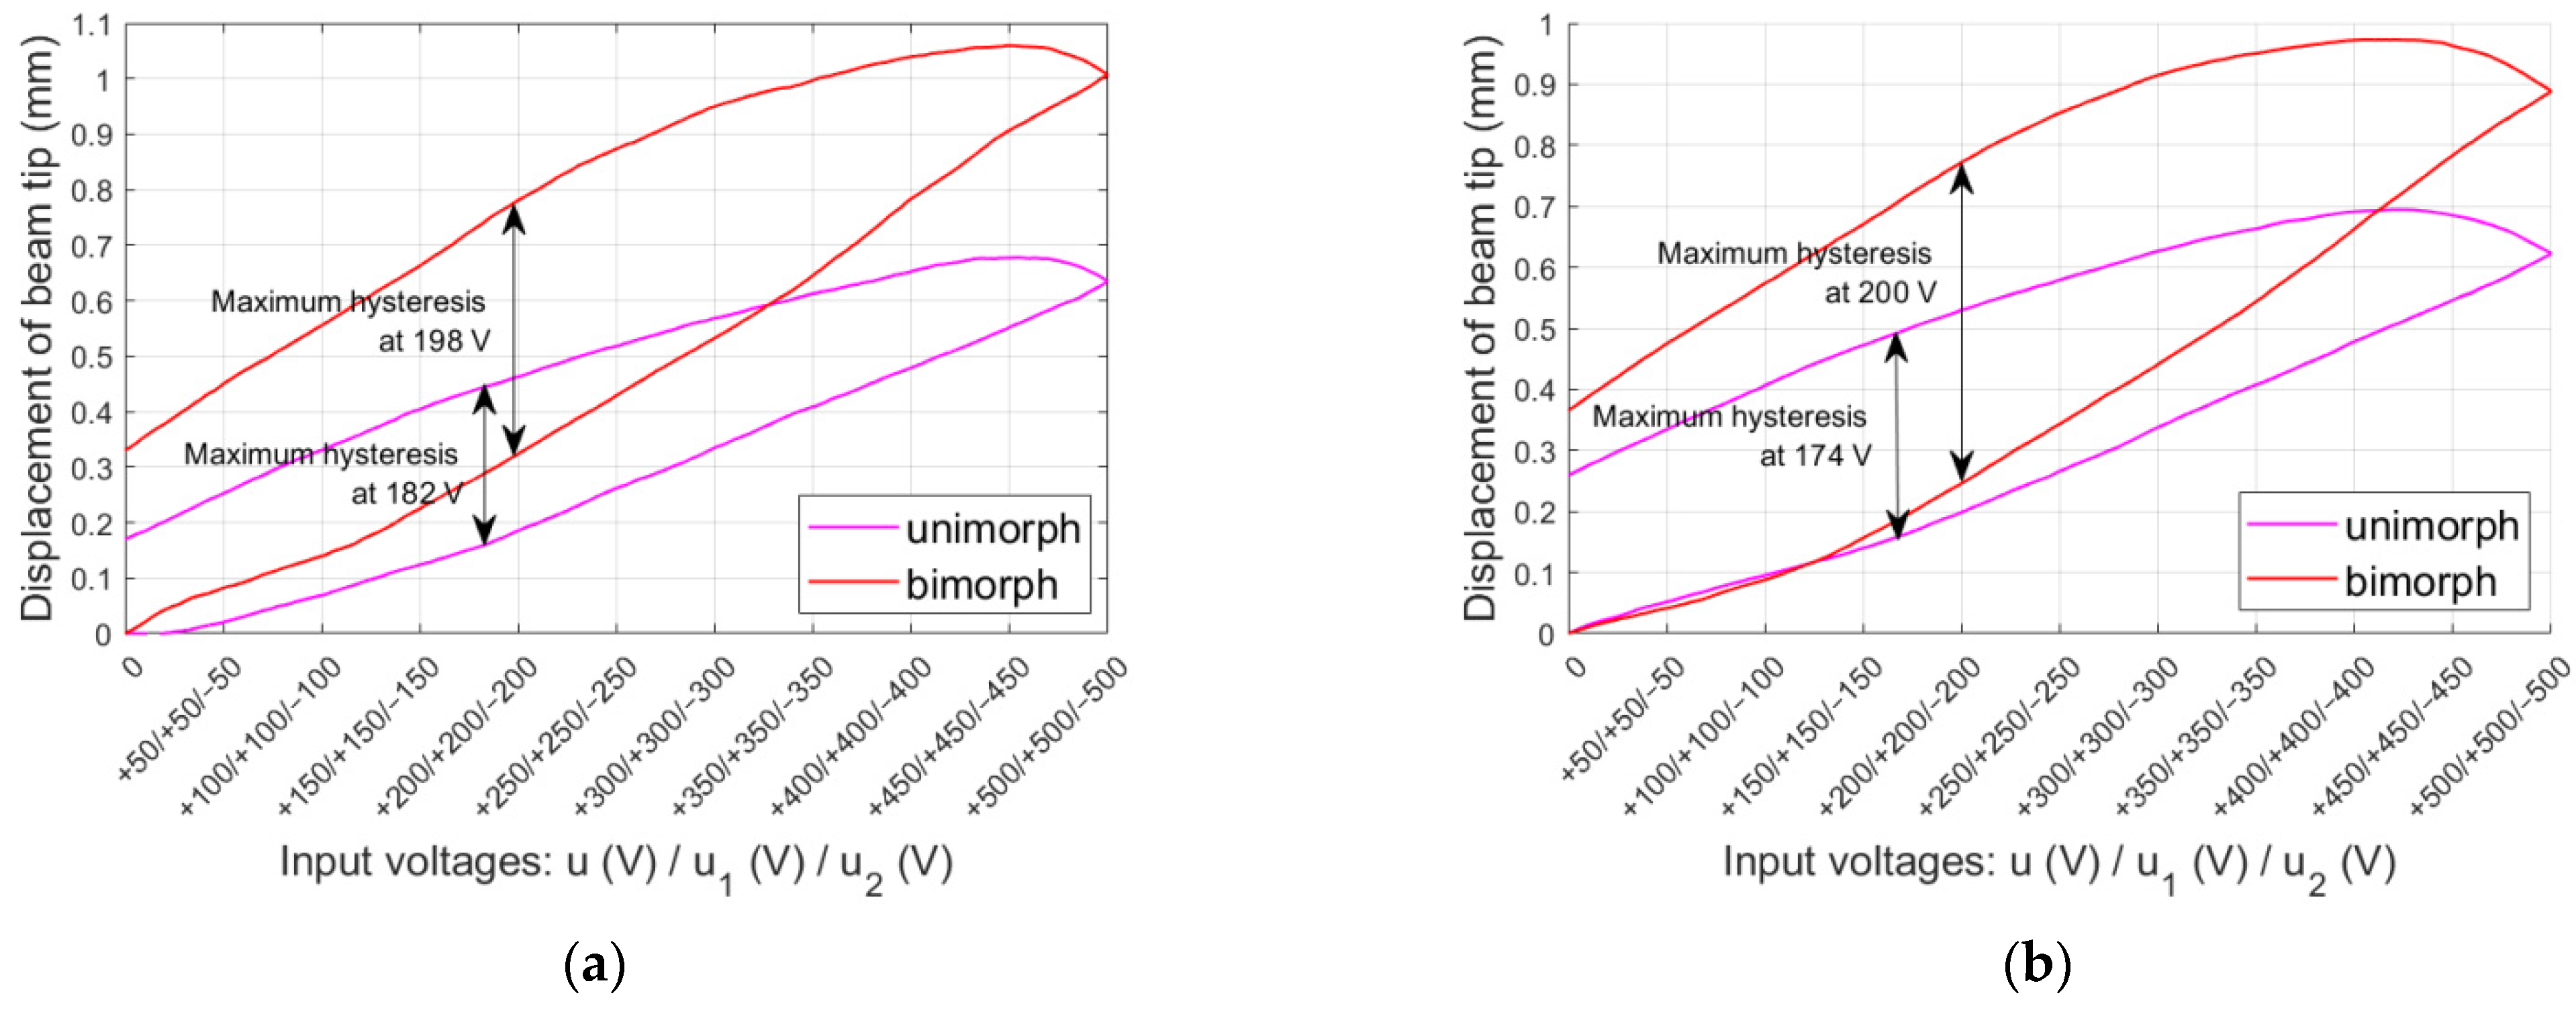

Figure 9.
Comparison of the maximum hystereses (a) for the unimorph, and (b) for the bimorph.
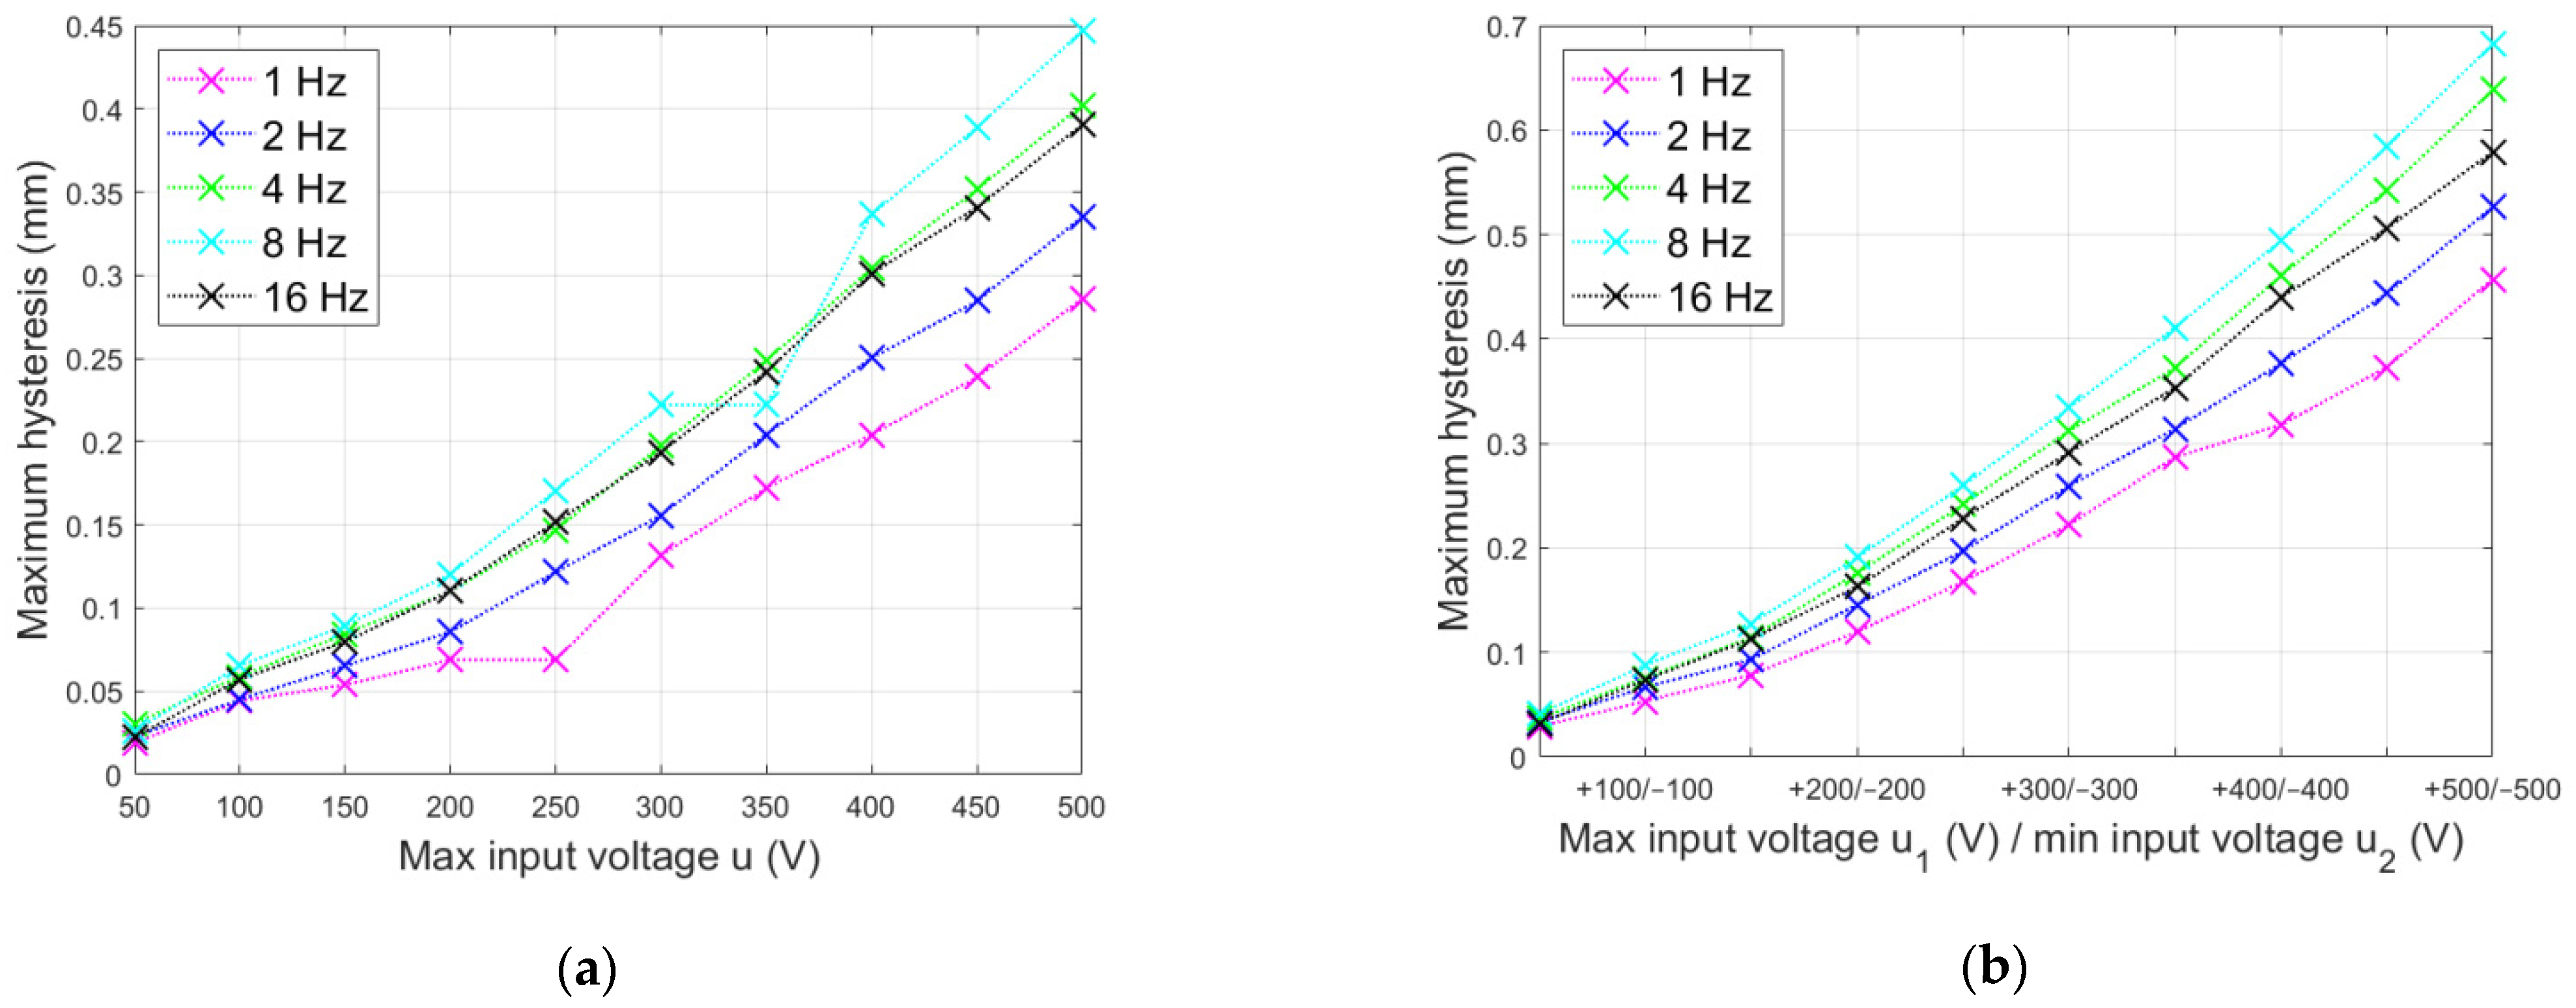
Figure 10.
Ratio: (a) maximum hysteresis to maximum displacement of actuator beam tip, (b) mean value of hysteresis to maximum displacement of actuator.
Figure 10.
Ratio: (a) maximum hysteresis to maximum displacement of actuator beam tip, (b) mean value of hysteresis to maximum displacement of actuator.
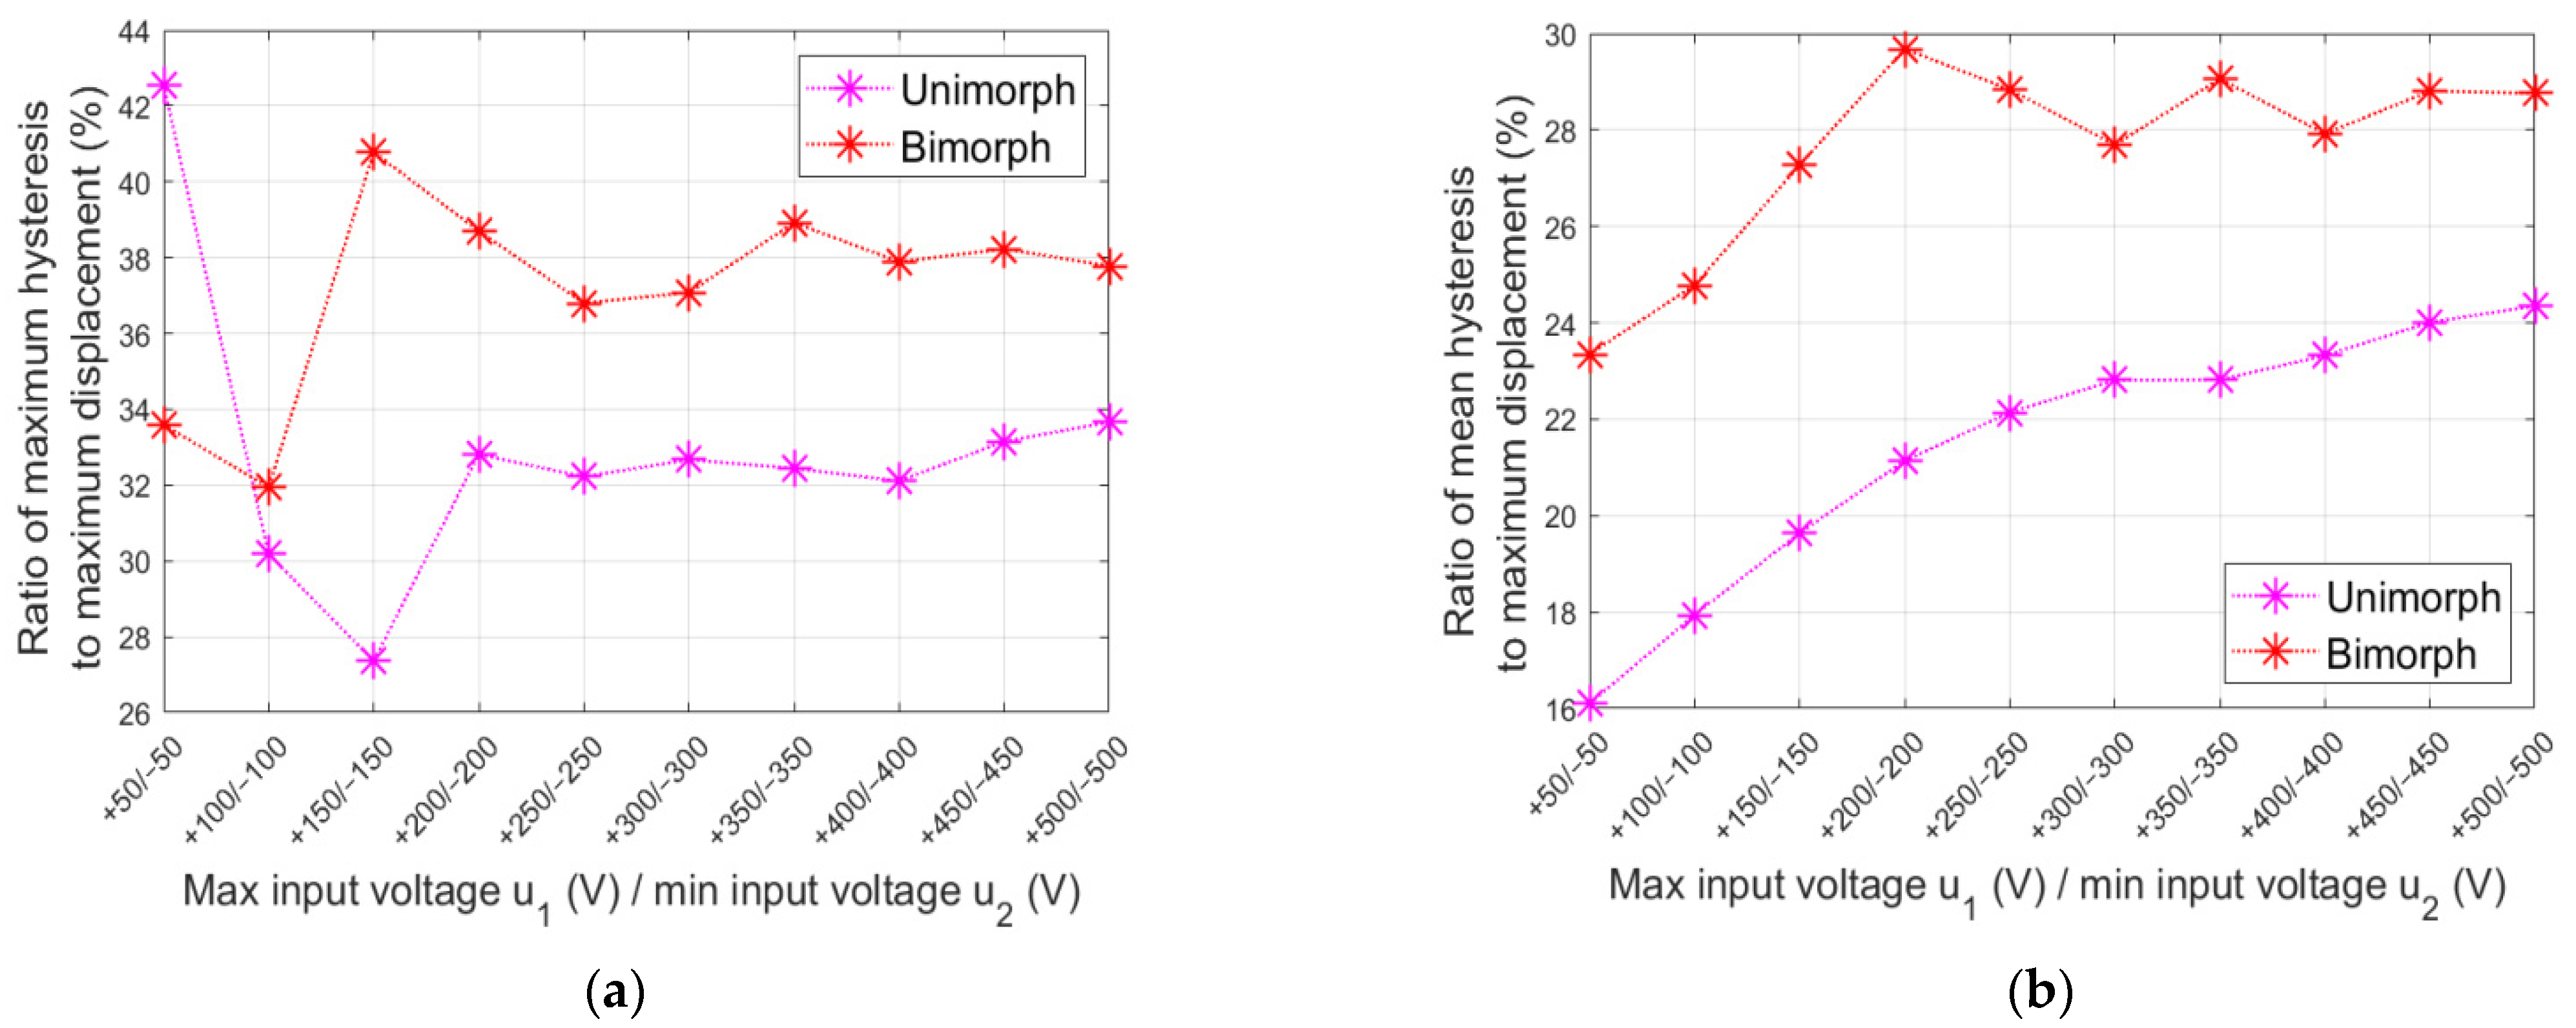
Figure 11.
Maximum displacements of the actuator beam tip and mean hysteresis values.

Figure 12.
Comparison of increases of maximum displacements of the actuator beam tip, maximum hystereses, and mean values of hysteresis between the bimorph and unimorph.
Figure 12.
Comparison of increases of maximum displacements of the actuator beam tip, maximum hystereses, and mean values of hysteresis between the bimorph and unimorph.
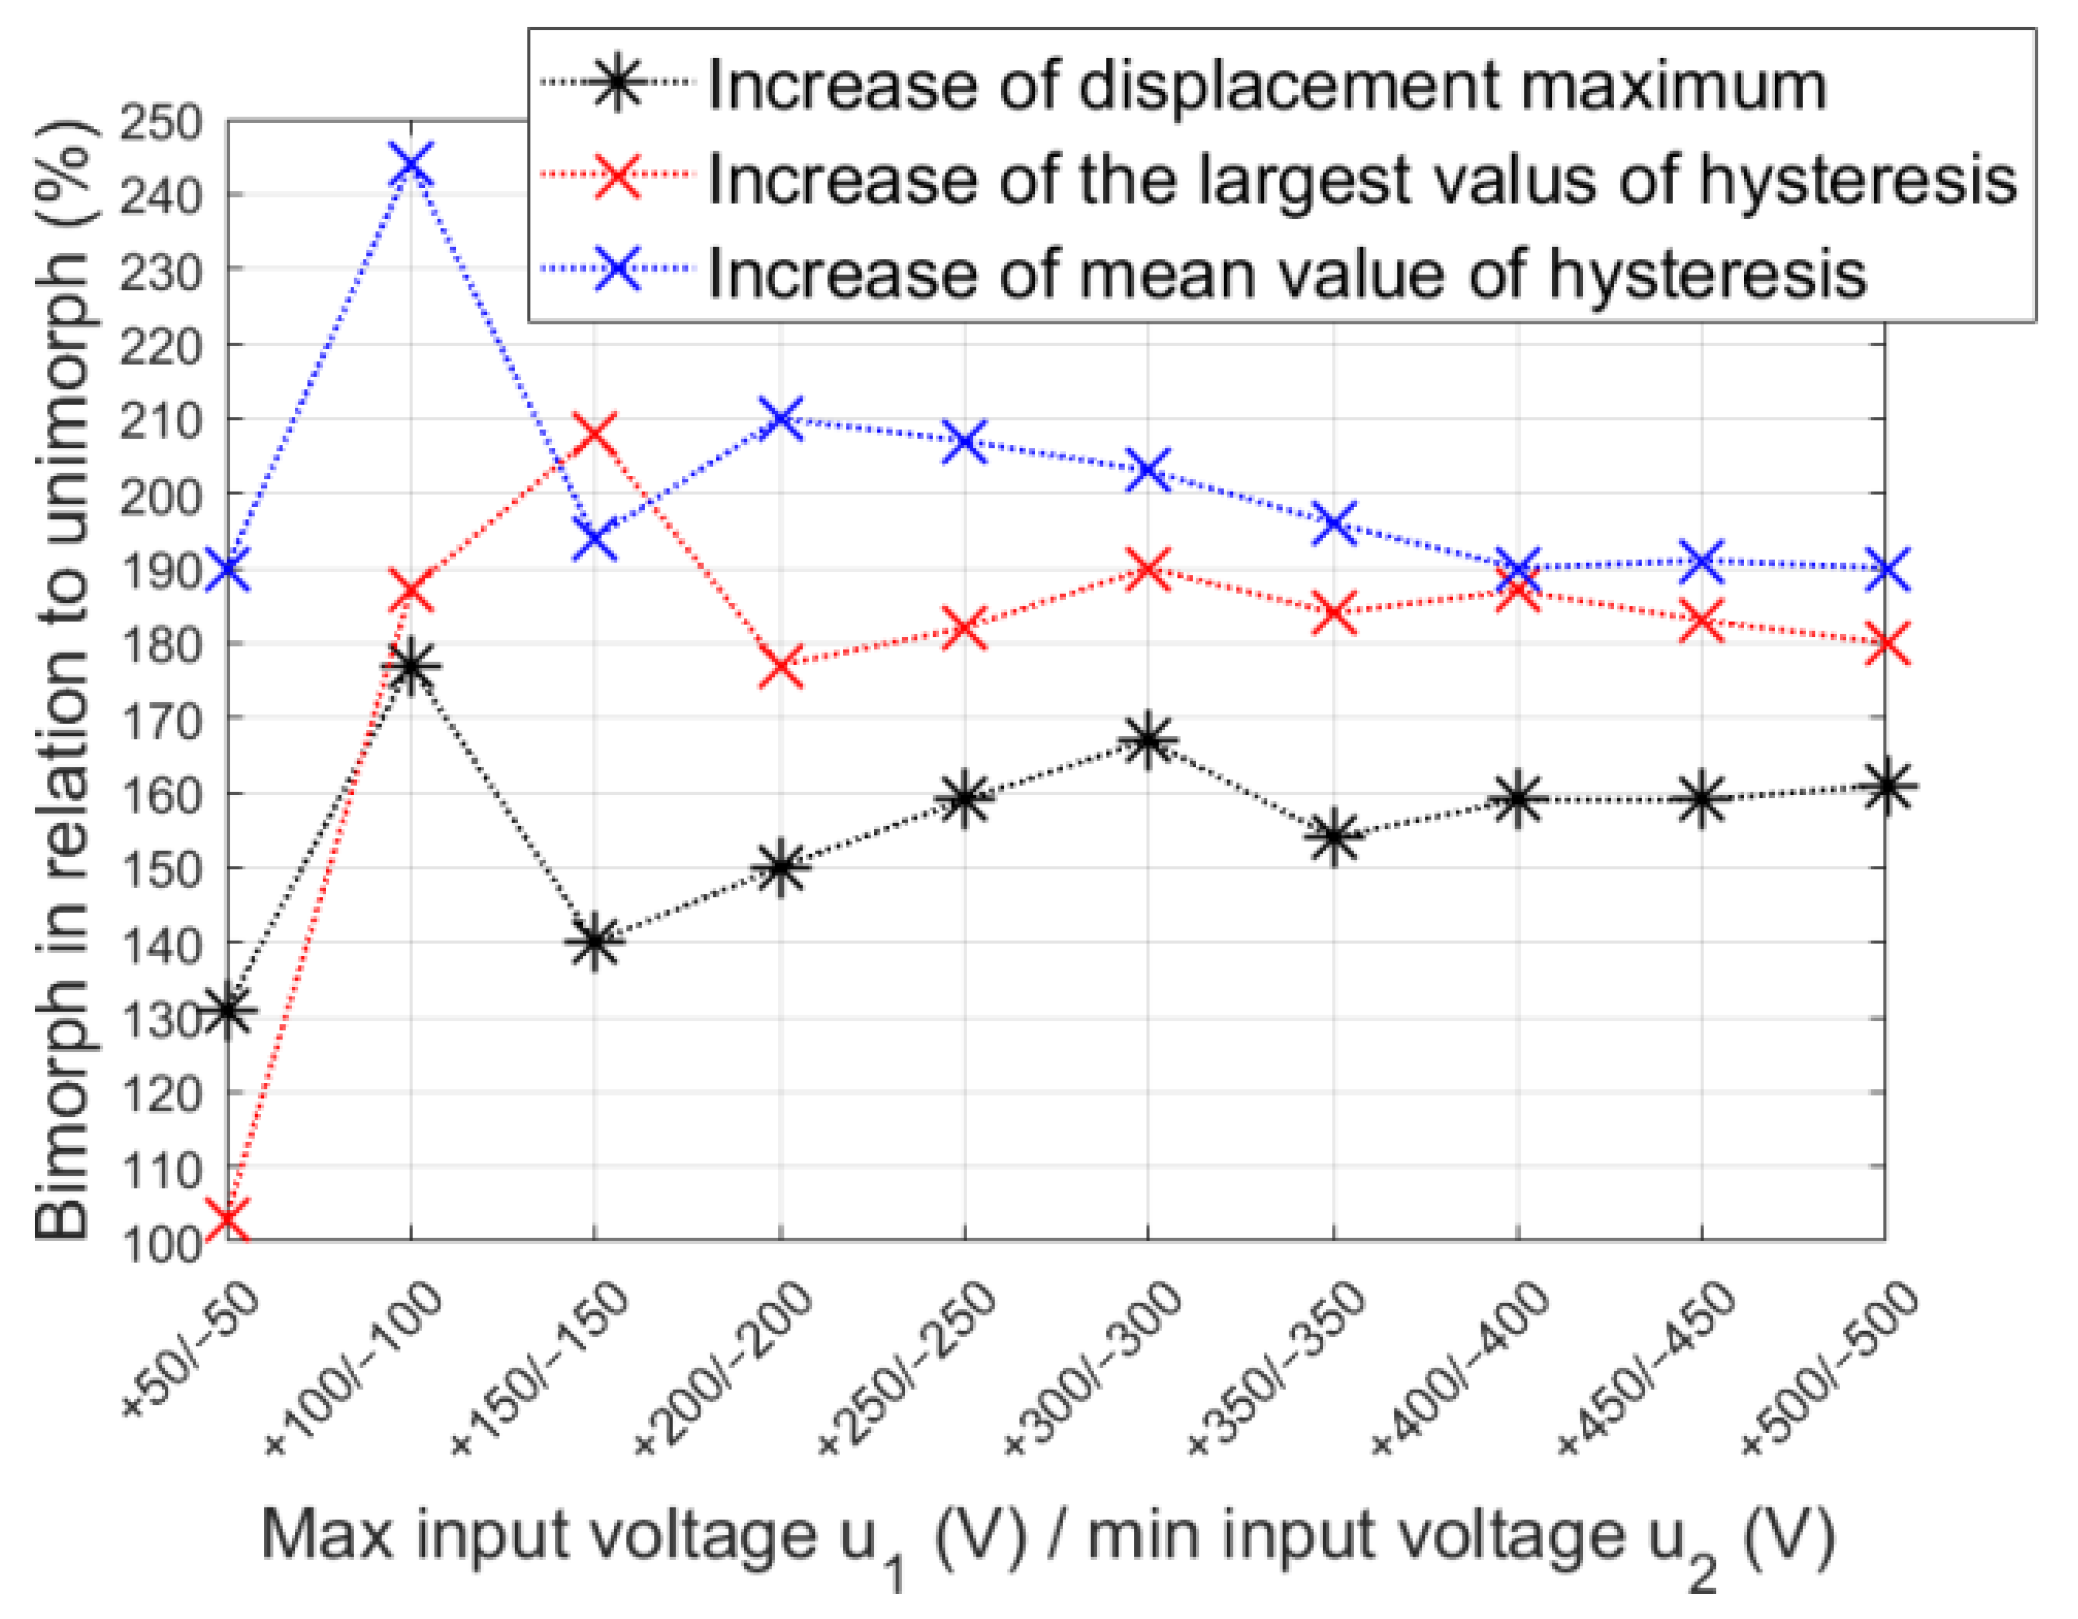
Figure 13.
Comparison of characteristic input voltages between unimorph and bimorph.
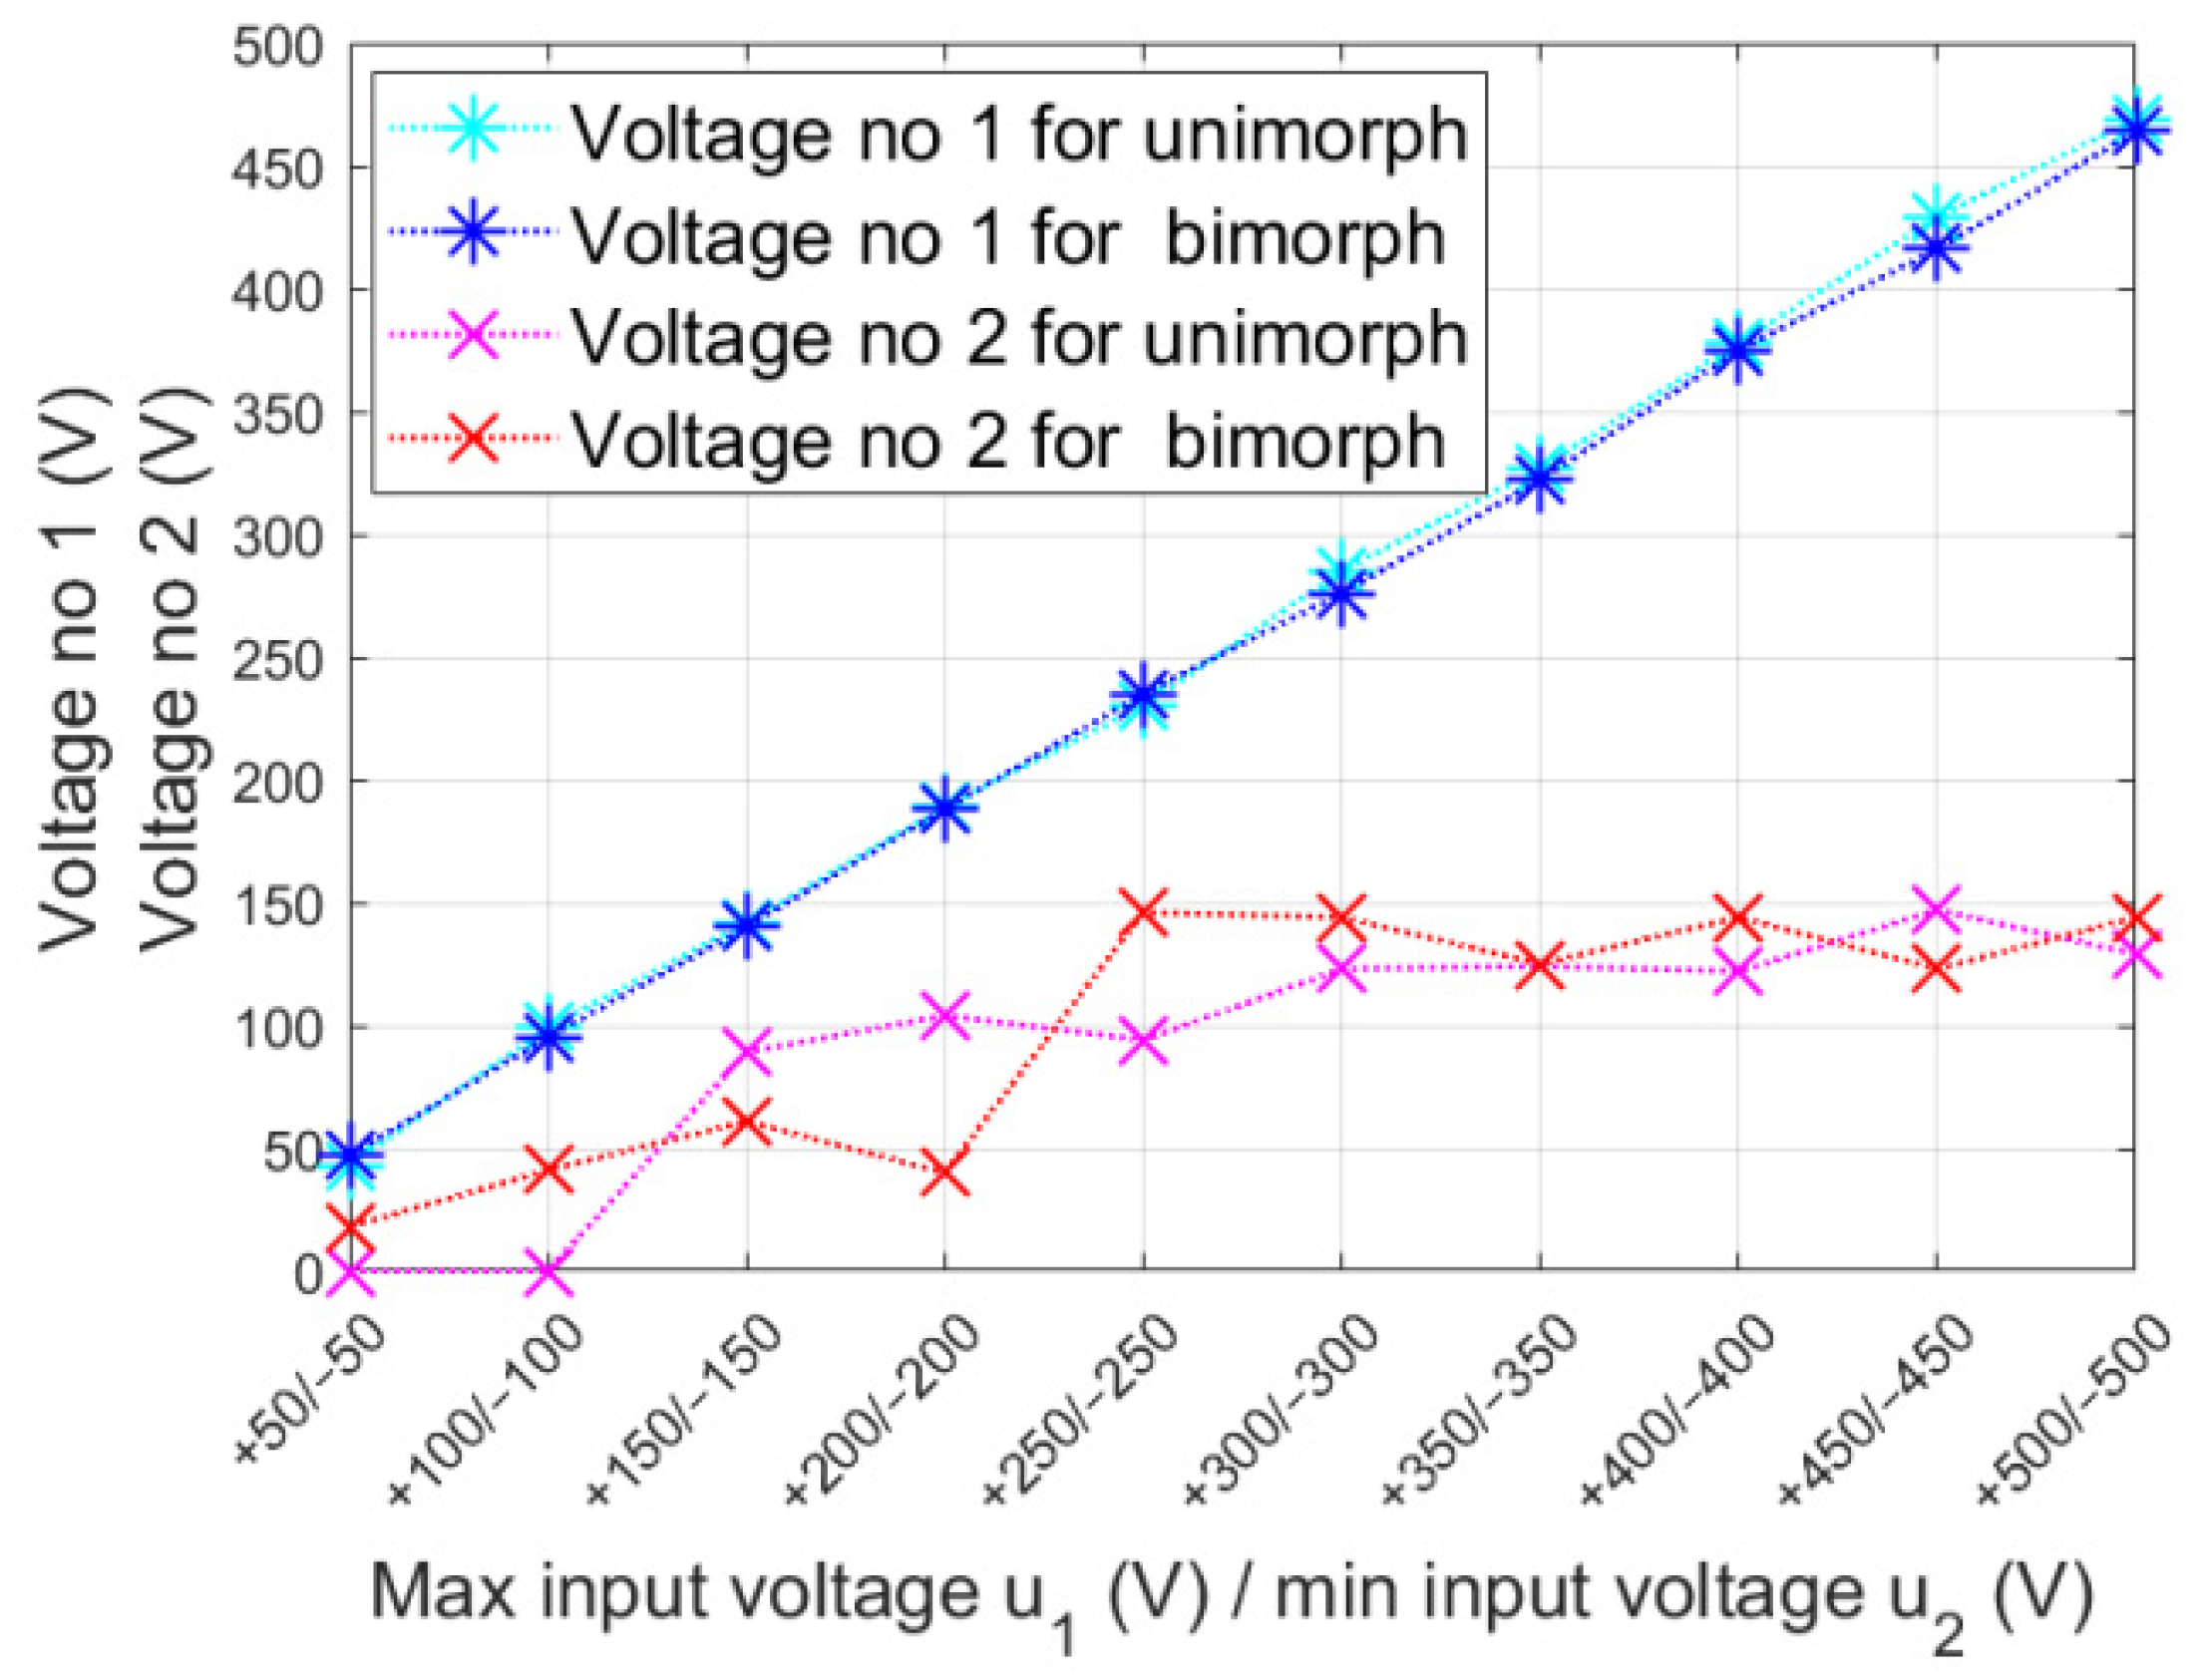
Figure 14.
Ratio of maximum hysteresis to maximum displacement of the actuator beam tip: (a) in the motion of the unimorph, (b) in the motion of the bimorph.
Figure 14.
Ratio of maximum hysteresis to maximum displacement of the actuator beam tip: (a) in the motion of the unimorph, (b) in the motion of the bimorph.
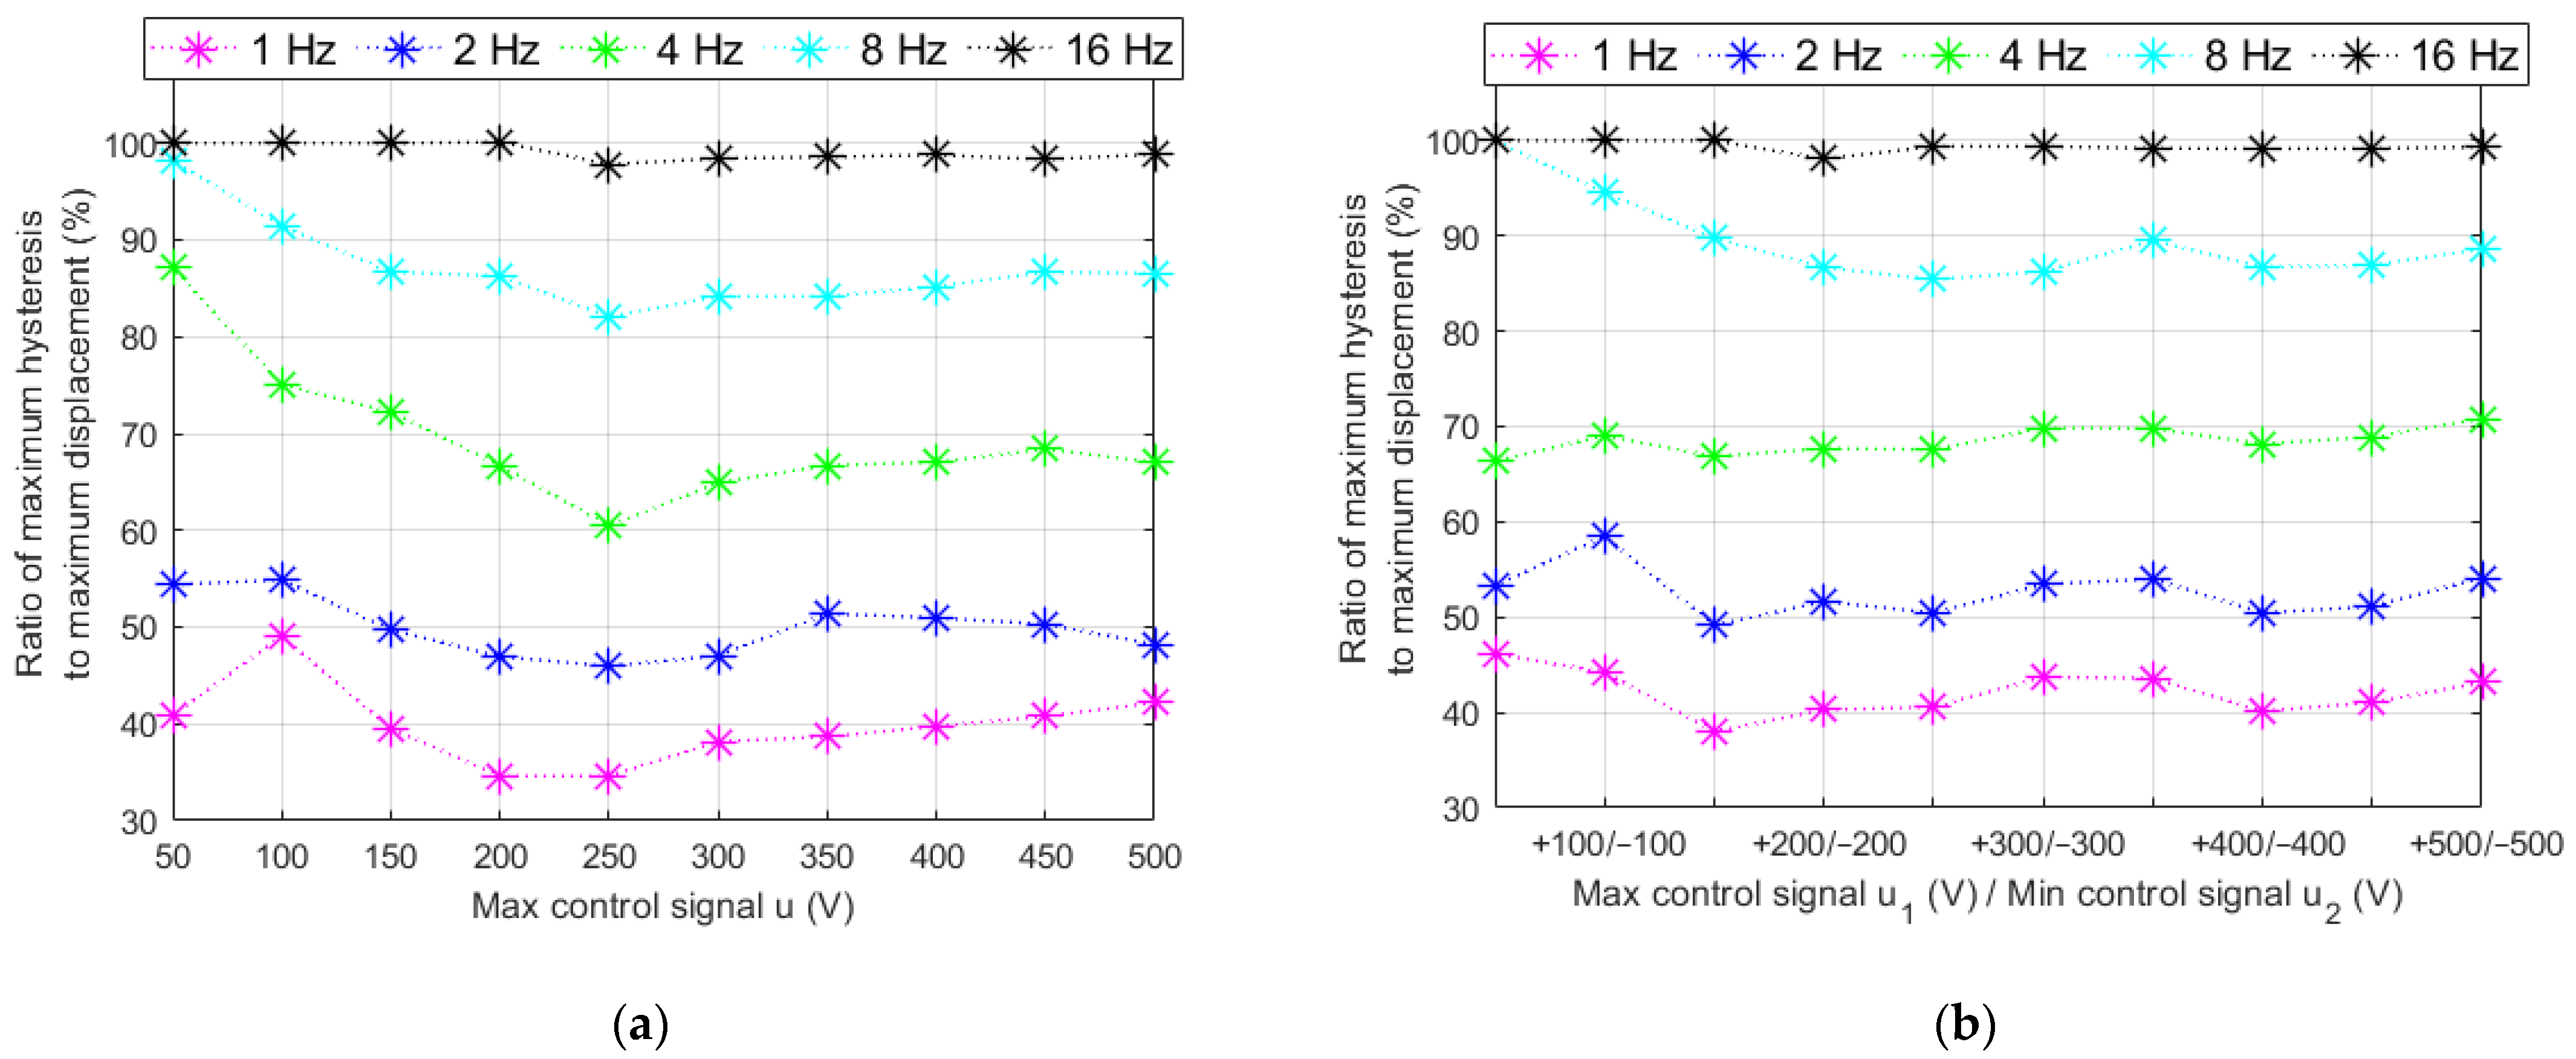
Figure 15.
Selected results of the regression analysis for bimorph, u1max = +500 V, u2max = −500 V; and for unimorph, umax = u1max = +500 V.
Figure 15.
Selected results of the regression analysis for bimorph, u1max = +500 V, u2max = −500 V; and for unimorph, umax = u1max = +500 V.

Figure 16.
Approximated hysteresis errors (a) in the unimorph movement, and (b) in the bimorph movement, for u2min = –u1max.
Figure 16.
Approximated hysteresis errors (a) in the unimorph movement, and (b) in the bimorph movement, for u2min = –u1max.
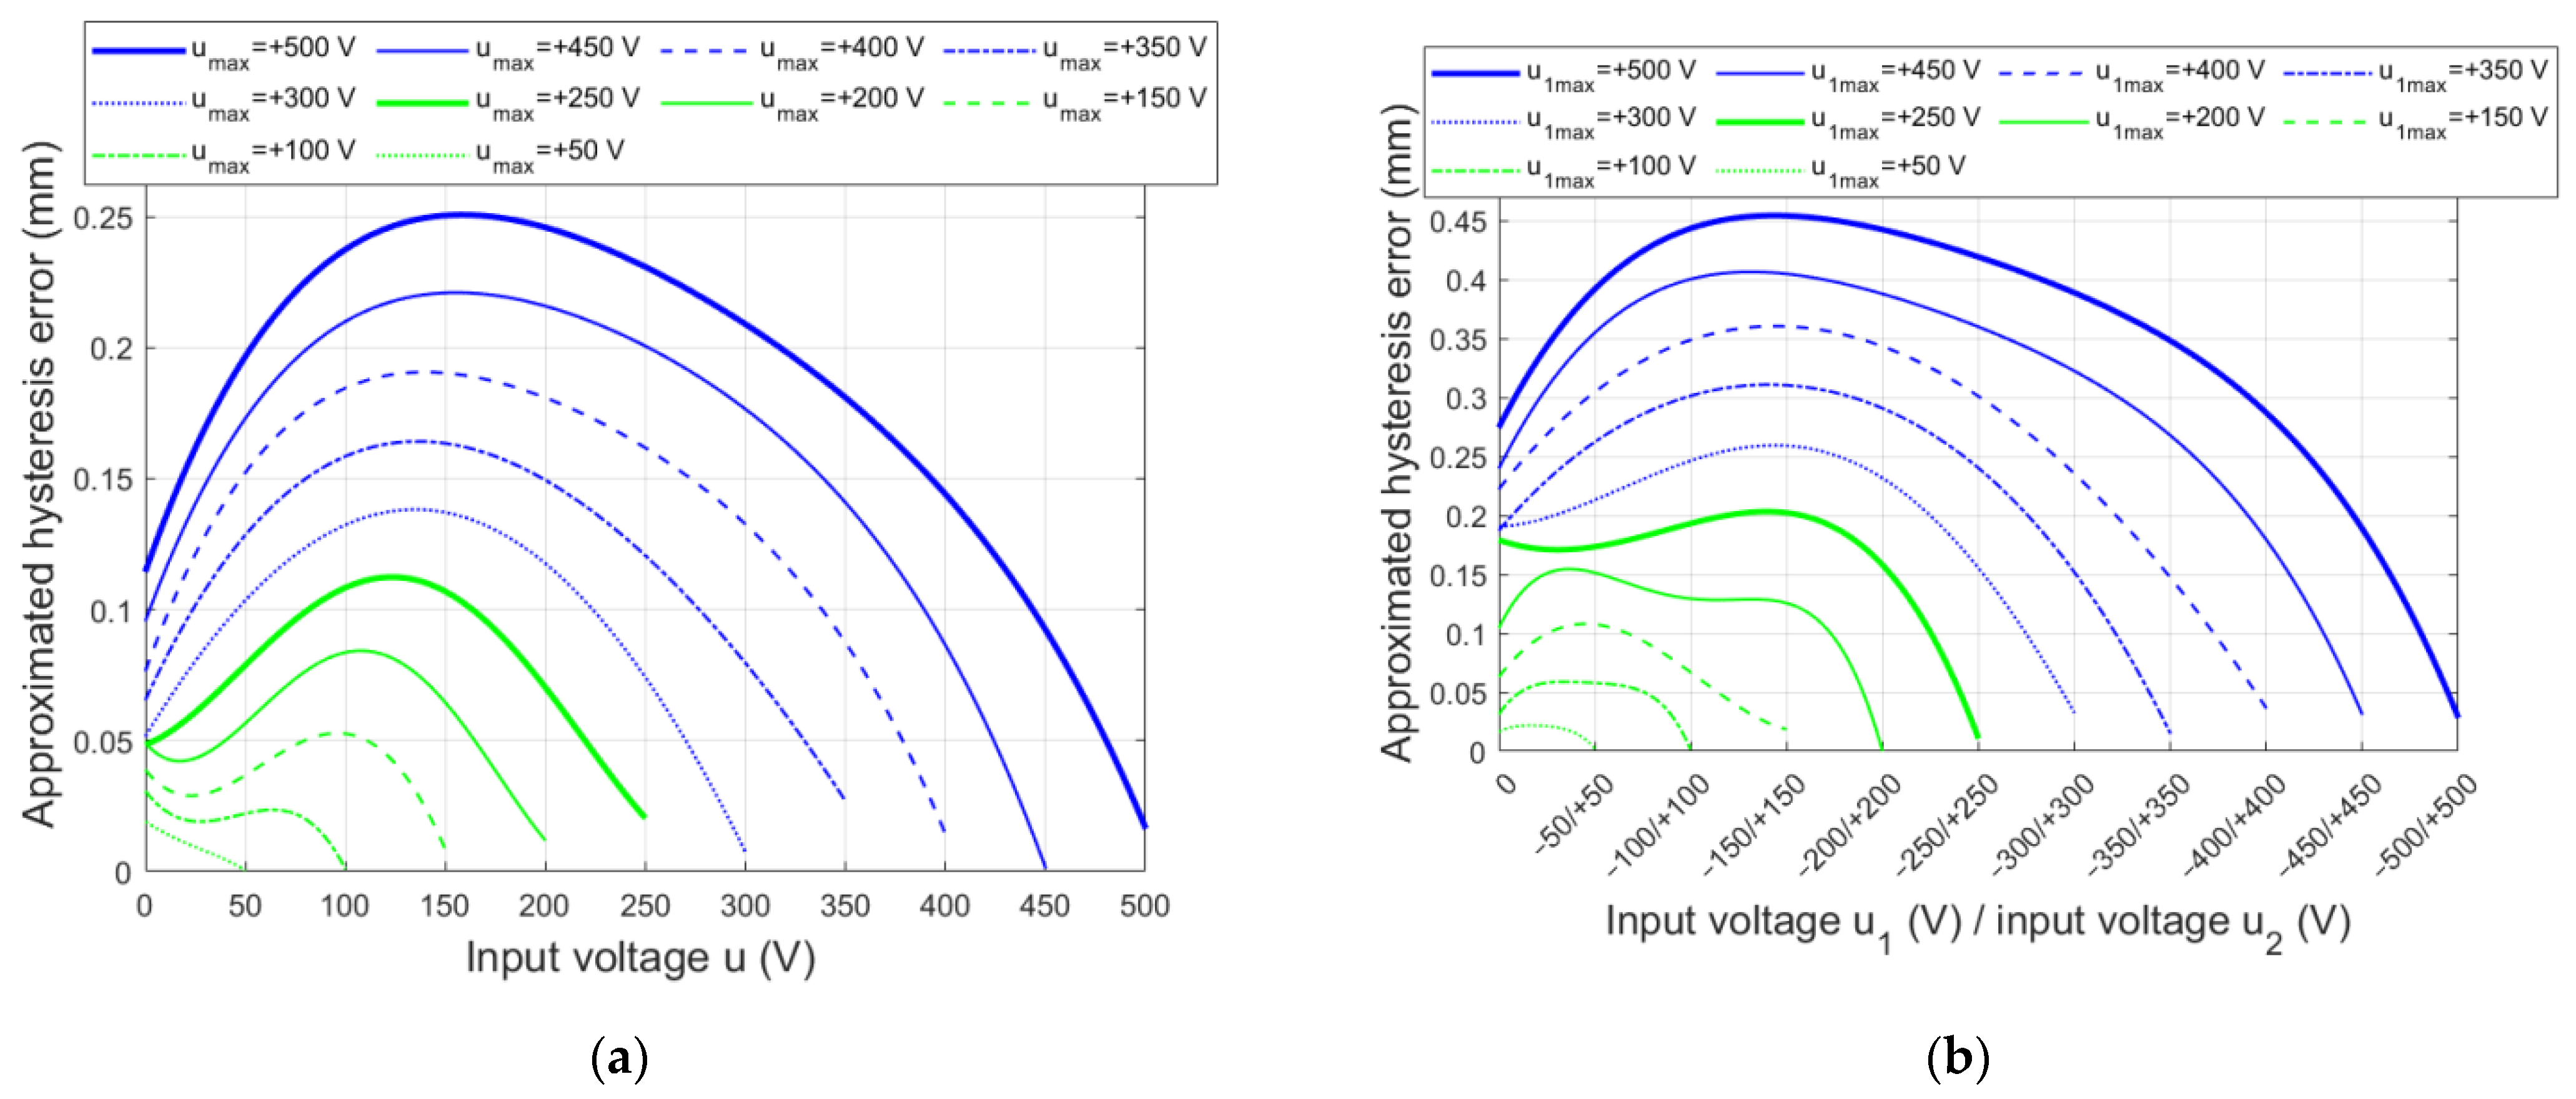
Figure 17.
Ratios of the maximum measured error to the maximum approximated error vs. the maximum input voltages: (a) in the motion of the unimorph, (b) in the motion of the bimorph.
Figure 17.
Ratios of the maximum measured error to the maximum approximated error vs. the maximum input voltages: (a) in the motion of the unimorph, (b) in the motion of the bimorph.

Table 1.
Geometrical properties of the manufactured bimorph.
| Parameters | Symbol | Value | Unit |
|---|---|---|---|
| Length of an active part in MFC patch [33] | la | 85 | mm |
| Length of a passive part in MFC patch [33] | lb | 7.5 | mm |
| Length of a carrier layer | lc | 120 | mm |
| Width of a carrier layer | wc | 20 | mm |
| Width of an active area in MFC patch [33] | wa | 14 | mm |
| Width of MFC patch | wMFC | 20 | mm |
| Thickness of a carrier layer [33] | tc | 1 | mm |
| Thickness of MFC patch | tMFC | 0.3 | mm |
| Distance between bimorph and clamping | ld | 110 | mm |
Table 2.
Maximum and minimum values of input voltages in laboratory experiments 1 to 20.
| Experiment Number (Unimorph) | |||||||||||
|---|---|---|---|---|---|---|---|---|---|---|---|
| 1 | 2 | 3 | 4 | 5 | 6 | 7 | 8 | 9 | 10 | ||
| Value Name | Unit | Set Values in Experiment | |||||||||
| Maximum of u | V | +500 | +450 | +400 | +350 | +300 | +250 | +200 | +150 | +100 | +50 |
| Experiment number (bimorph) | |||||||||||
| 11 | 12 | 13 | 14 | 15 | 16 | 17 | 18 | 19 | 20 | ||
| Set values in experiment | |||||||||||
| Maximum of u1 | V | +500 | +450 | +400 | +350 | +300 | +250 | +200 | +150 | +100 | +50 |
| Minimum of u2 | V | −500 | −450 | −400 | −350 | −300 | –250 | −200 | −150 | −100 | −50 |
Table 3.
Maximum and minimum values of input voltages in laboratory experiments 21 to 40.
| Experiment Number (Unimorph) | |||||||||||
|---|---|---|---|---|---|---|---|---|---|---|---|
| 21 | 22 | 23 | 24 | 25 | 26 | 27 | 28 | 29 | 30 | ||
| Value Name | Unit | Set Values in Experiment | |||||||||
| Maximum of u | V | +500 | +450 | +400 | +350 | +300 | +250 | +200 | +150 | +100 | +50 |
| Experiment number (bimorph) | |||||||||||
| 31 | 32 | 33 | 34 | 35 | 36 | 37 | 38 | 39 | 40 | ||
| Set values in experiment | |||||||||||
| Maximum of u1 | V | +500 | +450 | +400 | +350 | +300 | +250 | +200 | +150 | +100 | +50 |
| Minimum of u2 | V | −500 | –450 | –400 | –350 | –300 | –250 | –200 | –150 | –100 | –50 |
Table 4.
Maximum values of hysteresis in relation to input voltages.
| Experiment Number (Unimorph) | |||||||||||
|---|---|---|---|---|---|---|---|---|---|---|---|
| 1 | 2 | 3 | 4 | 5 | 6 | 7 | 8 | 9 | 10 | ||
| Variable Name | Unit | ||||||||||
| Maximum hysteresis | mm | 0.26 | 0.23 | 0.20 | 0.17 | 0.14 | 0.12 | 0.09 | 0.05 | 0.03 | 0.03 |
| Input signal u | V | 129 | 147 | 122 | 124 | 123 | 94 | 104 | 89 | 0 | 0 |
| Experiment number (bimorph) | |||||||||||
| 11 | 12 | 13 | 14 | 15 | 16 | 17 | 18 | 19 | 20 | ||
| Maximum hysteresis | mm | 0.47 | 0.42 | 0.37 | 0.32 | 0.27 | 0.21 | 0.16 | 0.11 | 0.06 | 0.03 |
| Input signal u1 | V | +144 | +123 | +144 | +125 | +144 | +146 | +40 | +61 | +41 | +18 |
| Input signal u2 | V | –144 | –123 | –144 | –125 | –144 | –146 | –40 | –61 | –41 | –18 |
Table 5.
Experiment processing parameters.
| Experiment Number (Unimorph) | ||||||||||||
|---|---|---|---|---|---|---|---|---|---|---|---|---|
| 1 | 2 | 3 | 4 | 5 | 6 | 7 | 8 | 9 | 10 | |||
| Variable Name | Unit | |||||||||||
| Mean difference | mm | 0.012 | 0.023 | 0.005 | 0.048 | 0.001 | 0.038 | 0.014 | 0.012 | 0.006 | 0.003 | × 10−4 |
| Standard deviation | mm | 0.036 | 0.031 | 0.033 | 0.040 | 0.030 | 0.031 | 0.021 | 0.014 | 0.012 | 0.015 | × 10−1 |
| Variance | - | 0.131 | 0.099 | 0.111 | 0.157 | 0.092 | 0.099 | 0.046 | 0.021 | 0.015 | 0.021 | × 10−4 |
| Experiment number (bimorph) | ||||||||||||
| 11 | 12 | 13 | 14 | 15 | 16 | 17 | 18 | 19 | 20 | |||
| Mean difference | mm | 0.021 | 0.028 | 0.042 | 0.009 | 0.064 | 0.023 | 0.028 | 0.038 | 0.007 | 0.006 | × 10−4 |
| Standard deviation | mm | 0.053 | 0.055 | 0.053 | 0.039 | 0.052 | 0.042 | 0.031 | 0.034 | 0.017 | 0.012 | × 10−1 |
| Variance | - | 0.282 | 0.305 | 0.280 | 0.151 | 0.269 | 0.175 | 0.098 | 0.114 | 0.028 | 0.014 | × 10−4 |
Table 6.
Results of a regression analysis.
| Experiment Number (Unimorph) | |||||||||||
|---|---|---|---|---|---|---|---|---|---|---|---|
| 1 | 2 | 3 | 4 | 5 | 6 | 7 | 8 | 9 | 10 | ||
| Variable Name | Symbol | ||||||||||
| Squared correlation coefficient | R2 | 0.992 | 0.993 | 0.989 | 0.971 | 0.978 | 0.959 | 0.971 | 0.948 | 0.878 | 0.863 |
| Experiment number (bimorph) | |||||||||||
| 11 | 12 | 13 | 14 | 15 | 16 | 17 | 18 | 19 | 20 | ||
| Squared correlation coefficient | R2 | 0.996 | 0.990 | 0.991 | 0.994 | 0.977 | 0.986 | 0.988 | 0.966 | 0.966 | 0.865 |
Disclaimer/Publisher’s Note: The statements, opinions and data contained in all publications are solely those of the individual author(s) and contributor(s) and not of MDPI and/or the editor(s). MDPI and/or the editor(s) disclaim responsibility for any injury to people or property resulting from any ideas, methods, instructions or products referred to in the content. |
© 2023 by the author. Licensee MDPI, Basel, Switzerland. This article is an open access article distributed under the terms and conditions of the Creative Commons Attribution (CC BY) license (https://creativecommons.org/licenses/by/4.0/).
Share and Cite
MDPI and ACS Style
Grzybek, D. Experimental Analysis of Hysteresis in the Motion of a Two-Input Piezoelectric Bimorph Actuator. Energies 2023, 16, 1198. https://doi.org/10.3390/en16031198
AMA Style
Grzybek D. Experimental Analysis of Hysteresis in the Motion of a Two-Input Piezoelectric Bimorph Actuator. Energies. 2023; 16(3):1198. https://doi.org/10.3390/en16031198
Chicago/Turabian StyleGrzybek, Dariusz. 2023. "Experimental Analysis of Hysteresis in the Motion of a Two-Input Piezoelectric Bimorph Actuator" Energies 16, no. 3: 1198. https://doi.org/10.3390/en16031198
Note that from the first issue of 2016, this journal uses article numbers instead of page numbers. See further details here.