Article

Preparation of Biomass Hydrochar and Application Analysis of Blast Furnace Injection

1
State Key Laboratory of Advanced Metallurgy, University of Science and Technology Beijing, Beijing 100083, China
2
Hunan Valin Xiangtan Iron and Steel Co, Ltd., Xiangtan 411101, China
3
Research Institute of Iron and Steel of Jiangsu Shasteel, Zhangjiagang 215625, China
4
Swerim AB, SE-971 25 Luleå, Sweden
5
Material Science and Engineering, KTH Royal Institute of Technology, SE-100 44 Stockholm, Sweden
*
Author to whom correspondence should be addressed.
Energies 2023, 16(3), 1216; https://doi.org/10.3390/en16031216
Submission received: 13 December 2022 / Revised: 6 January 2023 / Accepted: 17 January 2023 / Published: 22 January 2023
(This article belongs to the Section B3: Carbon Emission and Utilization)

Abstract

:
Hydrothermal carbonization (HTC) technology was used to carbonize and improve biomass raw material to obtain hydrochar. The effects of HTC temperature and holding time on the yield, composition, structure, combustion behavior, and safety of hydrochar were studied systematically. In addition, the results show that with the increase in HTC temperature and the prolongation of holding time, the yield of hydrochar gradually reduces, the fixed carbon content of hydrochar increases, the volatile content decreases, and a large number of ash and alkali metals enter the liquid phase and are removed. Further, the analysis of the combustion properties and the structure of hydrochar can be observed in that, as the HTC process promotes the occurrence of polymerization reactions, the specific surface area gradually reduces, the degree of carbon ordering increases, and the combustion curve moves toward the high-temperature zone and gradually approaches bituminous coal. Since biomass hydrochar has the characteristic of being carbon neutral, blast furnace injection hydrochar can reduce CO2 emissions, and every 1 kg/tHM of biomass hydrochar can reduce CO2 emissions by 1.95 kg/tHM.

1. Introduction

The steel industry is an important foundation for the rapid development of modern society. According to statistics, the world’s crude steel production in 2020 was 1878 million tons, and China accounted for about 56.5% [1]. As one of the manufacturing industries with the largest primary energy consumption, the steel industry accounts for about 6% of global anthropogenic CO2 emissions [2]. Under the severe situation of global warming, how to reduce carbon emissions has become a major problem that is faced by many iron and steel enterprises in green and sustainable development [3]. As a carbon-neutral and renewable energy source, the usage of biomass to partially replace coal and coke in the steel industry to lower the process’s carbon emissions is a promising trend [4].
China has rich reserves of biomass resources. According to statistics, 2 billion tons of biomass waste are generated in China every year, of which forestry waste is about 300 million tons [5]. The biomass grows naturally by adsorbing CO2, which is released when it is burned, but as a whole, the usage of biomass has zero effect on the total CO2 amount in the ecological system [6]. However, from this point of view, replacing fossil fuel with biomass could effectively reduce CO2 emissions. The blast furnace ironmaking process is a major contributor to CO2 emissions throughout the steel process [7]. Therefore, the use of biomass to replace part of the fossil energy in the blast furnace ironmaking process to reduce carbon emissions and fossil energy consumption, has become a research hotspot for many blast furnace ironmaking workers [8].
As the only renewable carbon source at present, woody biomass fuel has the characteristics of low nitrogen, low sulfur, and low ash content. From the perspective of blast furnace iron making, the usage of woody biomass concerns the following: (1) as a carbon source to produce carbon-containing pellets [9,10]; (2) as part of the fuel in the ore sintering process [11,12]; (3) as injection fuel to partially replace pulverized coal [13,14]; and (4) as a raw material for the coke production process [15]. The blast furnace injection solid fuels require good grindability, a low alkali metal content, a high calorific value, and so on. However, untreated woody biomass is difficult to use directly in blast furnace injection due to its high moisture, poor grindability, low calorific value, and other disadvantages [16]. At present, the widely used woody biomass carbonization method is mainly pyrolysis and carbonization. The products of pyrolysis and carbonization have the advantages of a higher calorific value, a high fixed carbon content, and easy breakage, but they also have the disadvantages of high energy consumption, high emissions, and high alkali metals. The high alkali metal content is a key factor limiting the application of pyrolysis carbon to blast furnace injection. Therefore, finding a biomass carbonization method that can effectively remove alkali metals is a key aspect of applying biomass to blast furnace injection. However, if processed using hydrothermal carbonization (HTC) technology, compared with pyrolysis, the carbonization method would have a lower energy consumption and result in fewer pollutant emissions. The HTC technology can also effectively remove harmful elements such as potassium, sodium, and chlorine [17].
The HTC technology involves mixing biomass and water in a certain proportion and performing a reaction at a certain temperature (180–350 °C) and pressure (2–16 MPa) under sealed conditions to generate gaseous, liquid, and carbon-rich solids (hydrochar) [18]. In the subcritical state, some properties of water are improved, such as its catalytic ability and solubility properties. As a result, water plays the roles of solvent and catalyst in the HTC process [19]. During the HTC process, the biomass is converted into high-quality fuel due to hydrolysis, decarboxylation, dehydration, polymerization, polycondensation, and aromatization [20,21]. The HTC technology has been used to treat various wastes in recent years due to its advantages of ecological environmental protection, low requirements for raw materials, and mild reaction conditions [22,23]. According to the research of Kim et al., through the HTC process, the fixed carbon and calorific value of anaerobic sludge could be increased, and the processed sludge could be used as clean solid fuel [21]. Lin et al. studied the hydrochar of several common components (paper, plastic, etc.) in municipal waste, and the study showed that the combustion characteristics of the product after HTC were significantly improved [24]. In the study of Ki et al. algal biomass and sludge were treated by HTC, and the products’ properties were close to those of coal [25].
China is rich in forest resources, and the remaining forest resources are also considerable. The biomass could be converted into clean fuel by HTC, and if the product could be widely used in blast furnace ironmaking to partially replace fossil coal and coke, the carbon dioxide emissions of the steel enterprises would be significantly lowered. In this paper, using woody biomass as a raw material, by changing different HTC process parameters, and by analyzing the obtained hydrochar, the optimal HTC process parameters were explored.

2. Experiment

2.1. Experimental Materials

The biomass used in this study is waste wood (WW), and the collected raw material is broken into pieces of 2 × 1 cm. The sheared samples were dried in an oven at 105 °C for 12 h and then packed in a sealed bag for subsequent experiments and analysis [26].

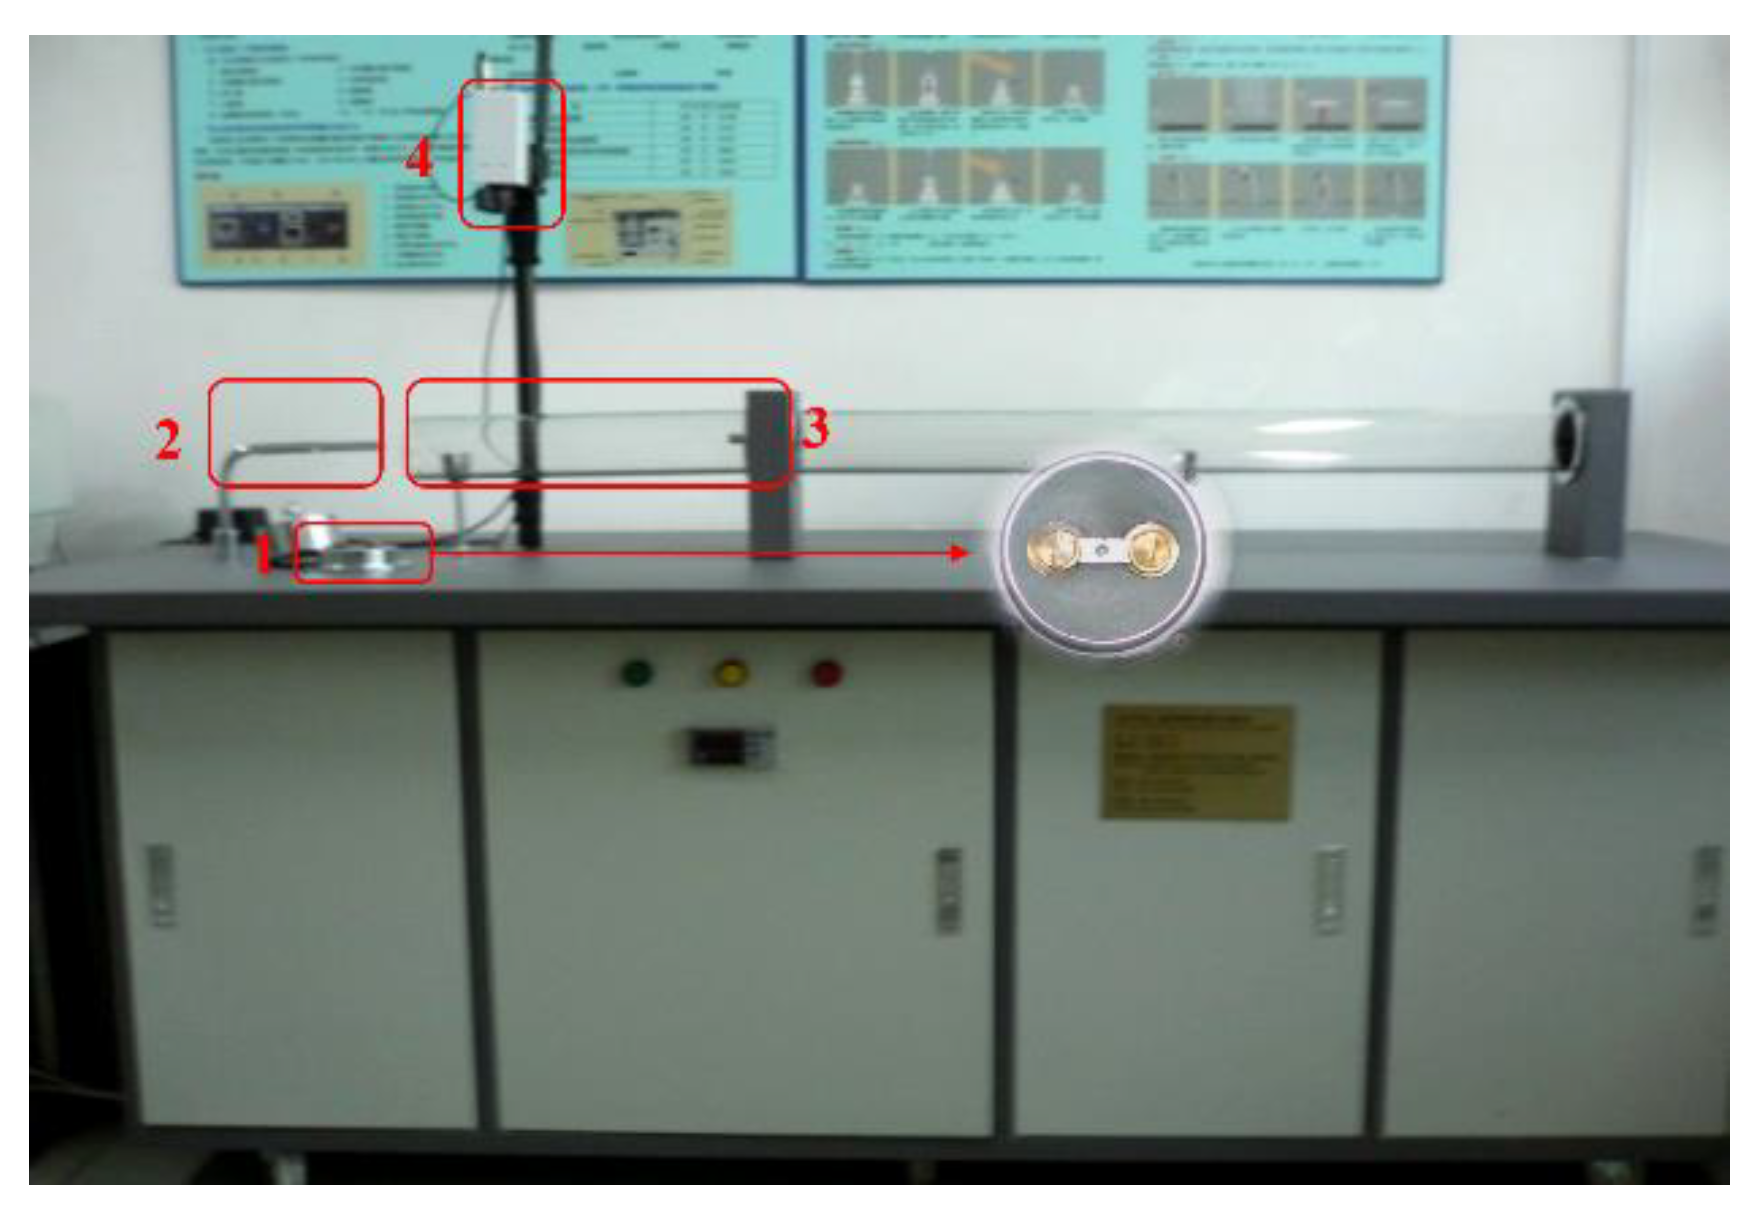
2.2. Experimental Method

The HTC experiments were performed in a 250 mL Hastelloy reactor by adding 20 g of WW and 60 mL of deionized water each time. Nitrogen gas was introduced into the reactor for 5 min before the start of the experiment to ensure an inert environment inside the reactor. After the experiment started, the experimental temperature was increased to the set temperature at a heating rate of 10 °C/min and then stopped. The experiment was finished after being held at the set temperature for a certain time.
During the HTC process, the stirring rate was set to 300 r/min to ensure that the biomass was fully contacted with deionized water. With the holding time as 60 min, different HTC temperatures of 200 °C, 220 °C, 240 °C, 260 °C, 280 °C, and 300 °C were selected to investigate the effects of the temperatures. With the temperature at 240 °C, different HTC holding times of 30 min, 60 min, 90 min, and 120 min were selected to investigate the effects of holding time. The hydrochar is named in the form HTC-X-Y, where X means temperature and Y means time.

2.3. Analytical Methods

The proximate and ultimate analyses of the samples were carried out according to GB/T212 and GB-T476, while the contents of fixed carbon and O-element were calculated using a differential method. The high heating value (HHV, MJ/Kg), mass yield (MY, %), energy yield (EY, %), and energy density (ED) of biomass and hydrochar are calculated using the following formula [27]:
H H V = 0.3491 C + 1.1783 H + 0.1005 S 0.1034 O 0.0151 N 0.0211 A
where C, H, O, N, S, and A represent carbon, hydrogen, oxygen, nitrogen, sulfur ash in ultimate analysis, and ash in proximate analysis, respectively.
M Y = M hydrochar M feedstock
E D = H H V hydrochar H H V feedstock
E Y = M Y × E D
where Mhydrochar is the mass of the hydrochar, g; Mfeedstock is the WW mass, g; HHVhydrochar is the higher heating value of the hydrochar, MJ/kg; and HHVfeedstock is the WW’s higher heating value.
The pore structure of the hydrochar was analyzed using a specific surface area and a pore size analyzer (ASAP2460). The samples were analyzed via Fourier transform infrared (FTIR) spectra (NEX-US 870), and the measured wavelength range was between 4000 cm−1 and 500 cm−1.
The combustion characteristics of the samples were analyzed on thermogravimetric equipment produced by Beijing Hengjiu Optical Instrument Co. (Beijing, China). During the thermogravimetric experiments, the atmosphere was air, and the gas flow rate was 60 mL/min. The sample was heated from room temperature to 800 °C with a heating rate of 20 °C/min [28]. In the analysis of combustion characteristics, the mass loss needs to be converted into a conversion rate for analysis, and the conversion rate formula is as follows [29]:
x = m 0 m t m 0 m
where m0 is the mass of the sample at the beginning of the reaction, g; mt is the mass of the sample at time t, g; m is the mass of the residue after the combustion ends, g. The reaction rate was calculated from the difference in conversion relative to reaction time, expressed as dx/dt.
The analysis of the ignition temperature and the explosive performance of hydrochar was carried out using the analysis method of Jin et al. [30]. The pulverized coal safety testing equipment is shown in Figure 1. The sample is placed on the heating equipment to start heating, and the system records the moment of ignition through the image detector 4 and records the ignition temperature. The sample is placed into injector 2 and injected into the glass tube containing the fire source at 1050 °C using the built-in air compressor. The return flame formed after the explosion of the coal powder is detected by the image detector, and the length of the return flame in the sample is analyzed using the computer. In the blast furnace injection pulverized coal usually requires the percentage of pulverized coal of less than 75 μm to be 80–90%. Therefore, in this study, we focus on the ignition point and the explosivity of the samples smaller than 75 μm.
The samples were charred at low temperatures according to GB/T 1574, the ash contents of the samples were detected by using an X-ray fluorescence spectrometer (XRF), and the harmful elements in the samples were analyzed according to GB/T 18512. The removal rate DE of alkali elements after HTC was calculated using the following equation:
D E K , Ca , Mg = ( 1 ω hydrochar K , Ca , Mg M hydrochar ω feedstock K , Ca , Mg M feedstock ) × 100 %
where DEK,Ca,Mg is the removal rate of alkali metals (such as K, Ca, and Mg), %, ω feedstock K , Ca , Mg is the content of alkali metals (K, Ca, and Mg) in the original sample, %, and ω hydrochar K , Ca , Mg is the content of alkali metals (K, Ca, and Mg) in the hydrochar, %.

3. Experimental Results and Discussion

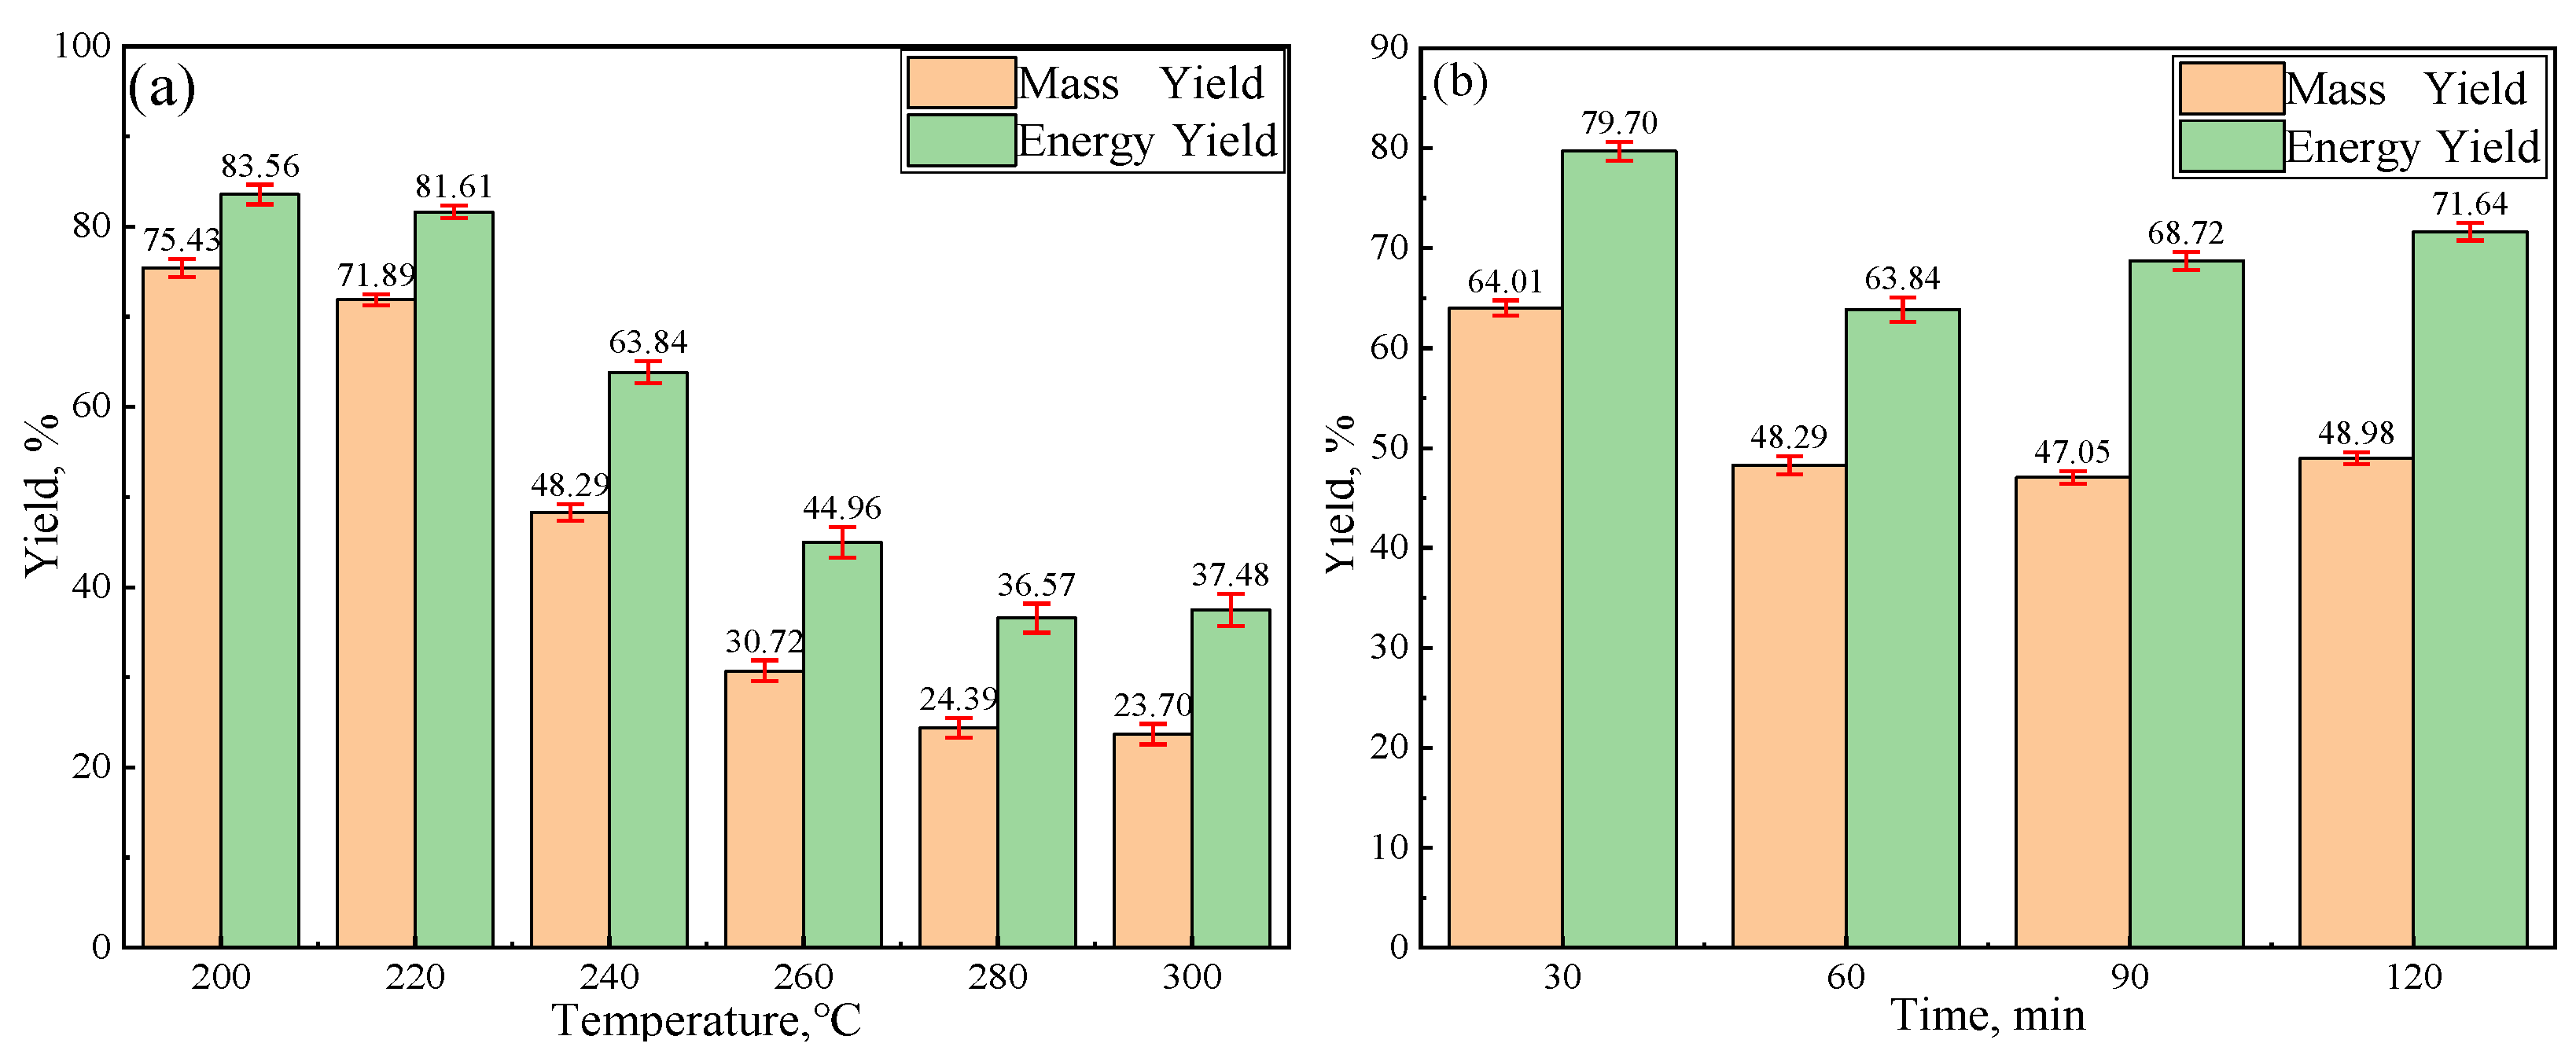
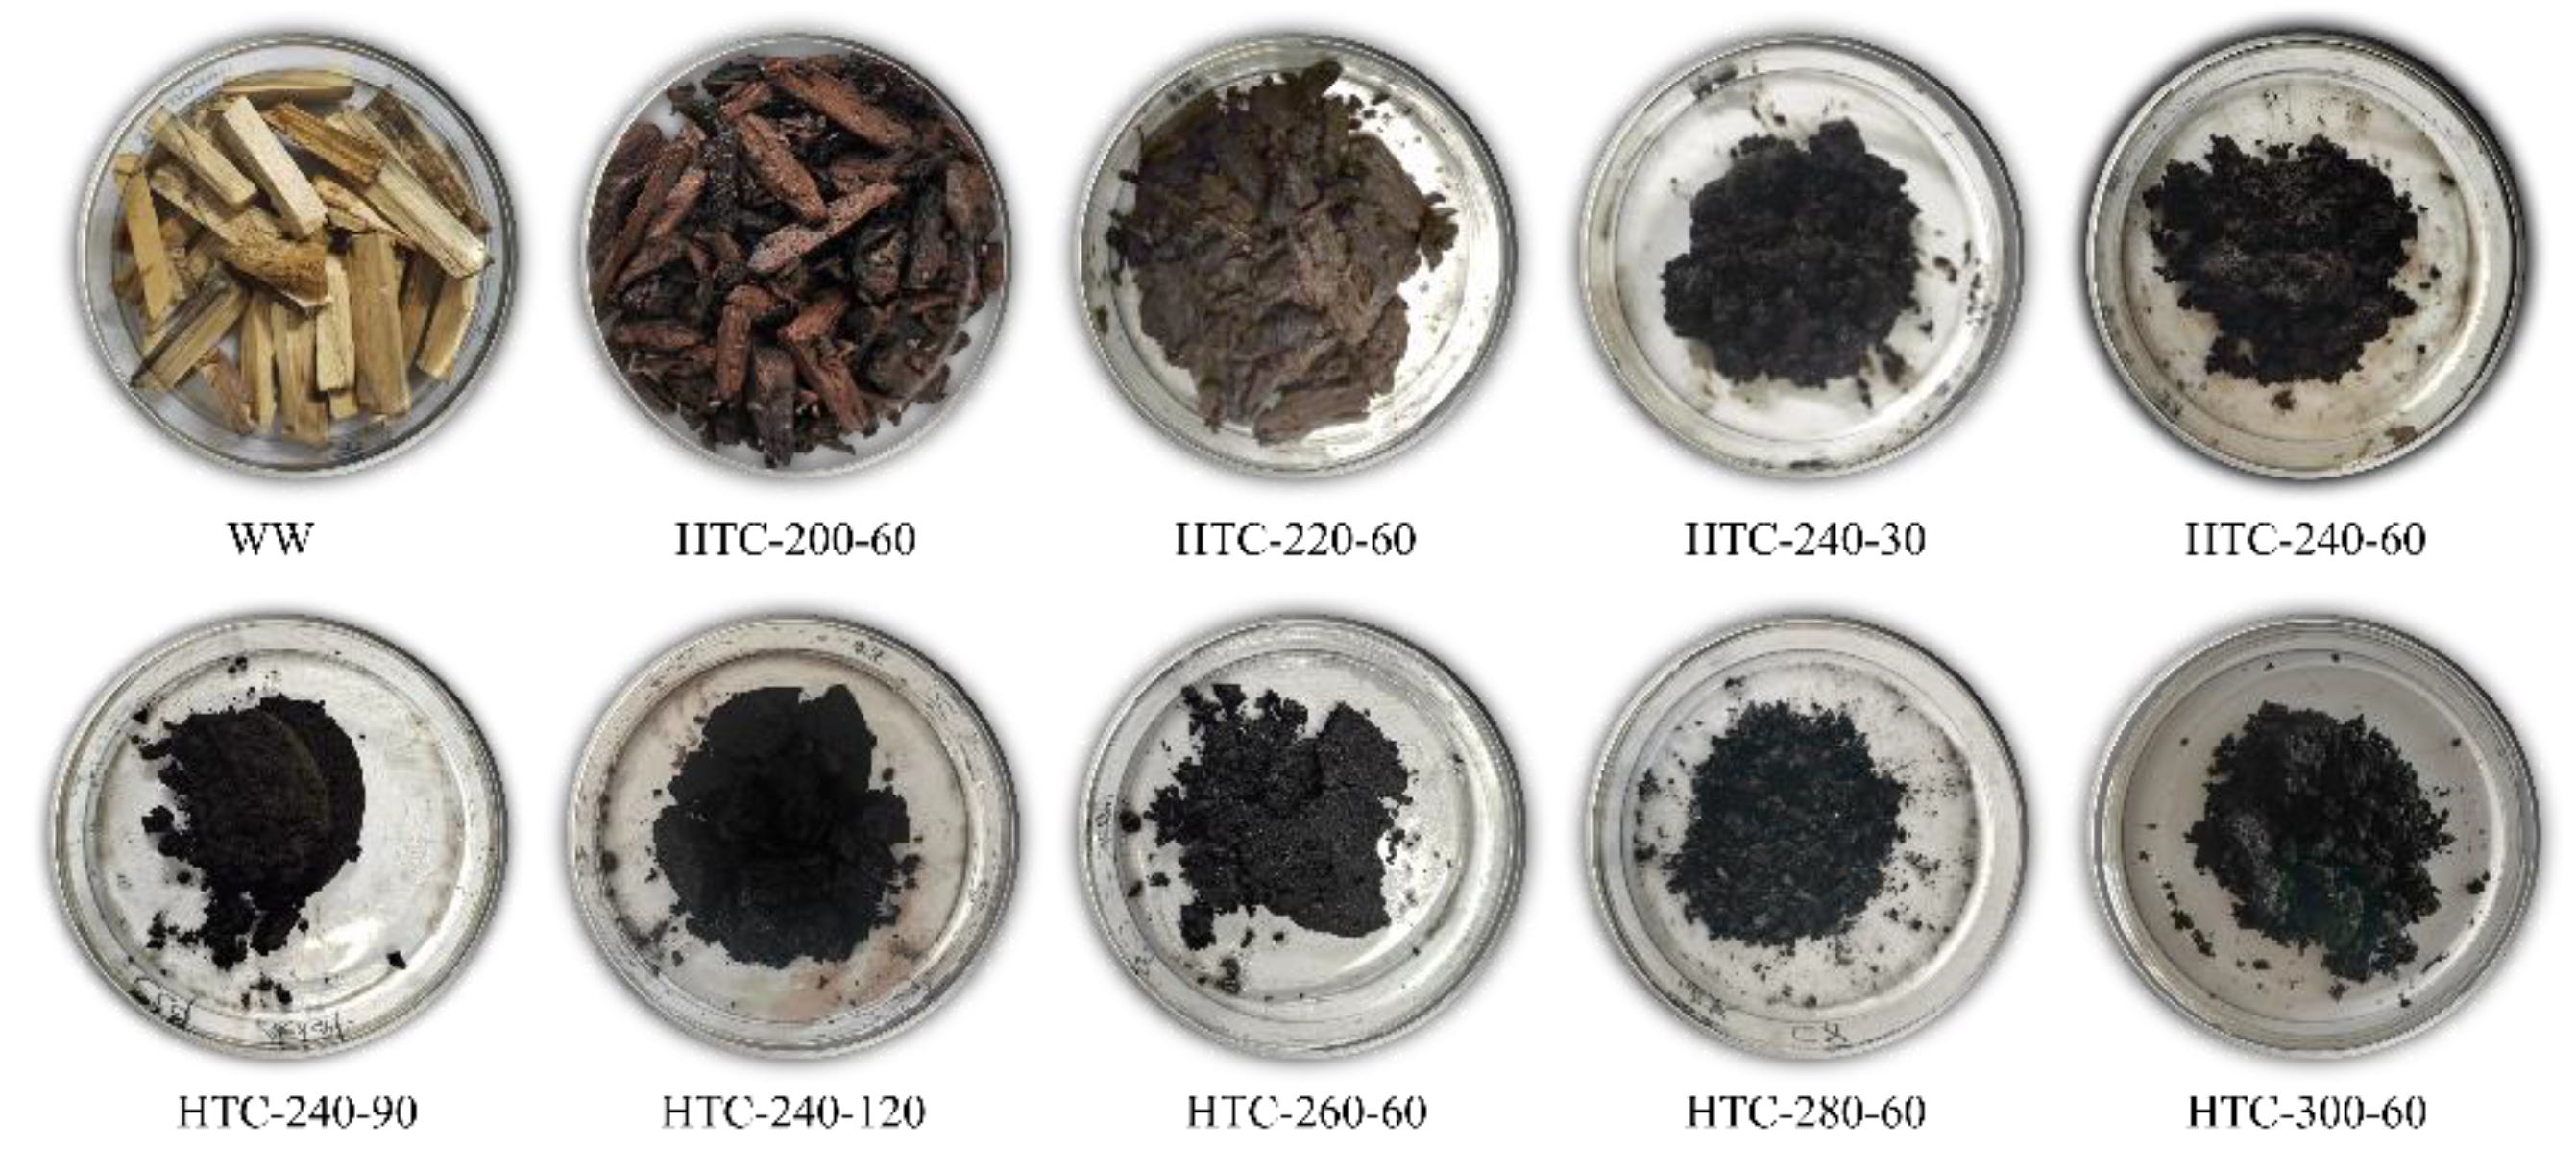
3.1. Yield and Morphology Analysis

Figure 2 shows the mass yield and energy yield of hydrochar at different HTC parameters. It can be seen from Figure 2a that the yield of hydrochar gradually decreases with the increase in HTC temperature. Below 260 °C, there was an obvious decreasing trend for the yield of hydrochar with increasing temperature and comparing it with the yield at 200 °C, the yield at 260 °C was decreased by 44.21%. This change is due to the difference in the degradation temperature range of the three components of biomass in the HTC process, in which the degradation temperature of cellulose and hemicellulose is lower than that of lignin [31,32]. However, most of the cellulose and hemicelluloses could be degraded into various organic acids and dissolved into the liquid phase below 260 °C, so the mass and energy yield of hydrochar would significantly decrease. Additionally, with the further increase in temperature, the change in yield would become lower. For example, the mass yield decreased by only 14.59% when increasing from 260 °C to 300 °C. Ekaterina et al. also found a similar rule in their study on the HTC of wood chips [33].
At 240 °C, experiments with different holding times were carried out. Additionally, from Figure 2b, it can be seen that with the holding time changed from 30 min to 60 min, the yield loss was great. The mass yield maintains at about 48% after 60 min. This is because, in the initial stage of the HTC reaction, some water-soluble substances react, and the degradation processes of cellulose, hemicellulose, and lignin proceed slowly. The dissolution of soluble substances, and the degradations of cellulose, hemicelluloses, and lignin were mostly completed within 60 min, so extending the holding time would lead to little change in the hydrochar yield.
Figure 3 shows the morphologies of WW and hydrochar prepared under different conditions. With low HTC temperatures, the hydrochar maintained the morphology of WW in the form of strips. With an increase in HTC temperature, the morphology gradually changed into fine fragments and finally into powder. By comparing the morphologies of the samples under different holding times, holding time has a slight effect on the product morphology.

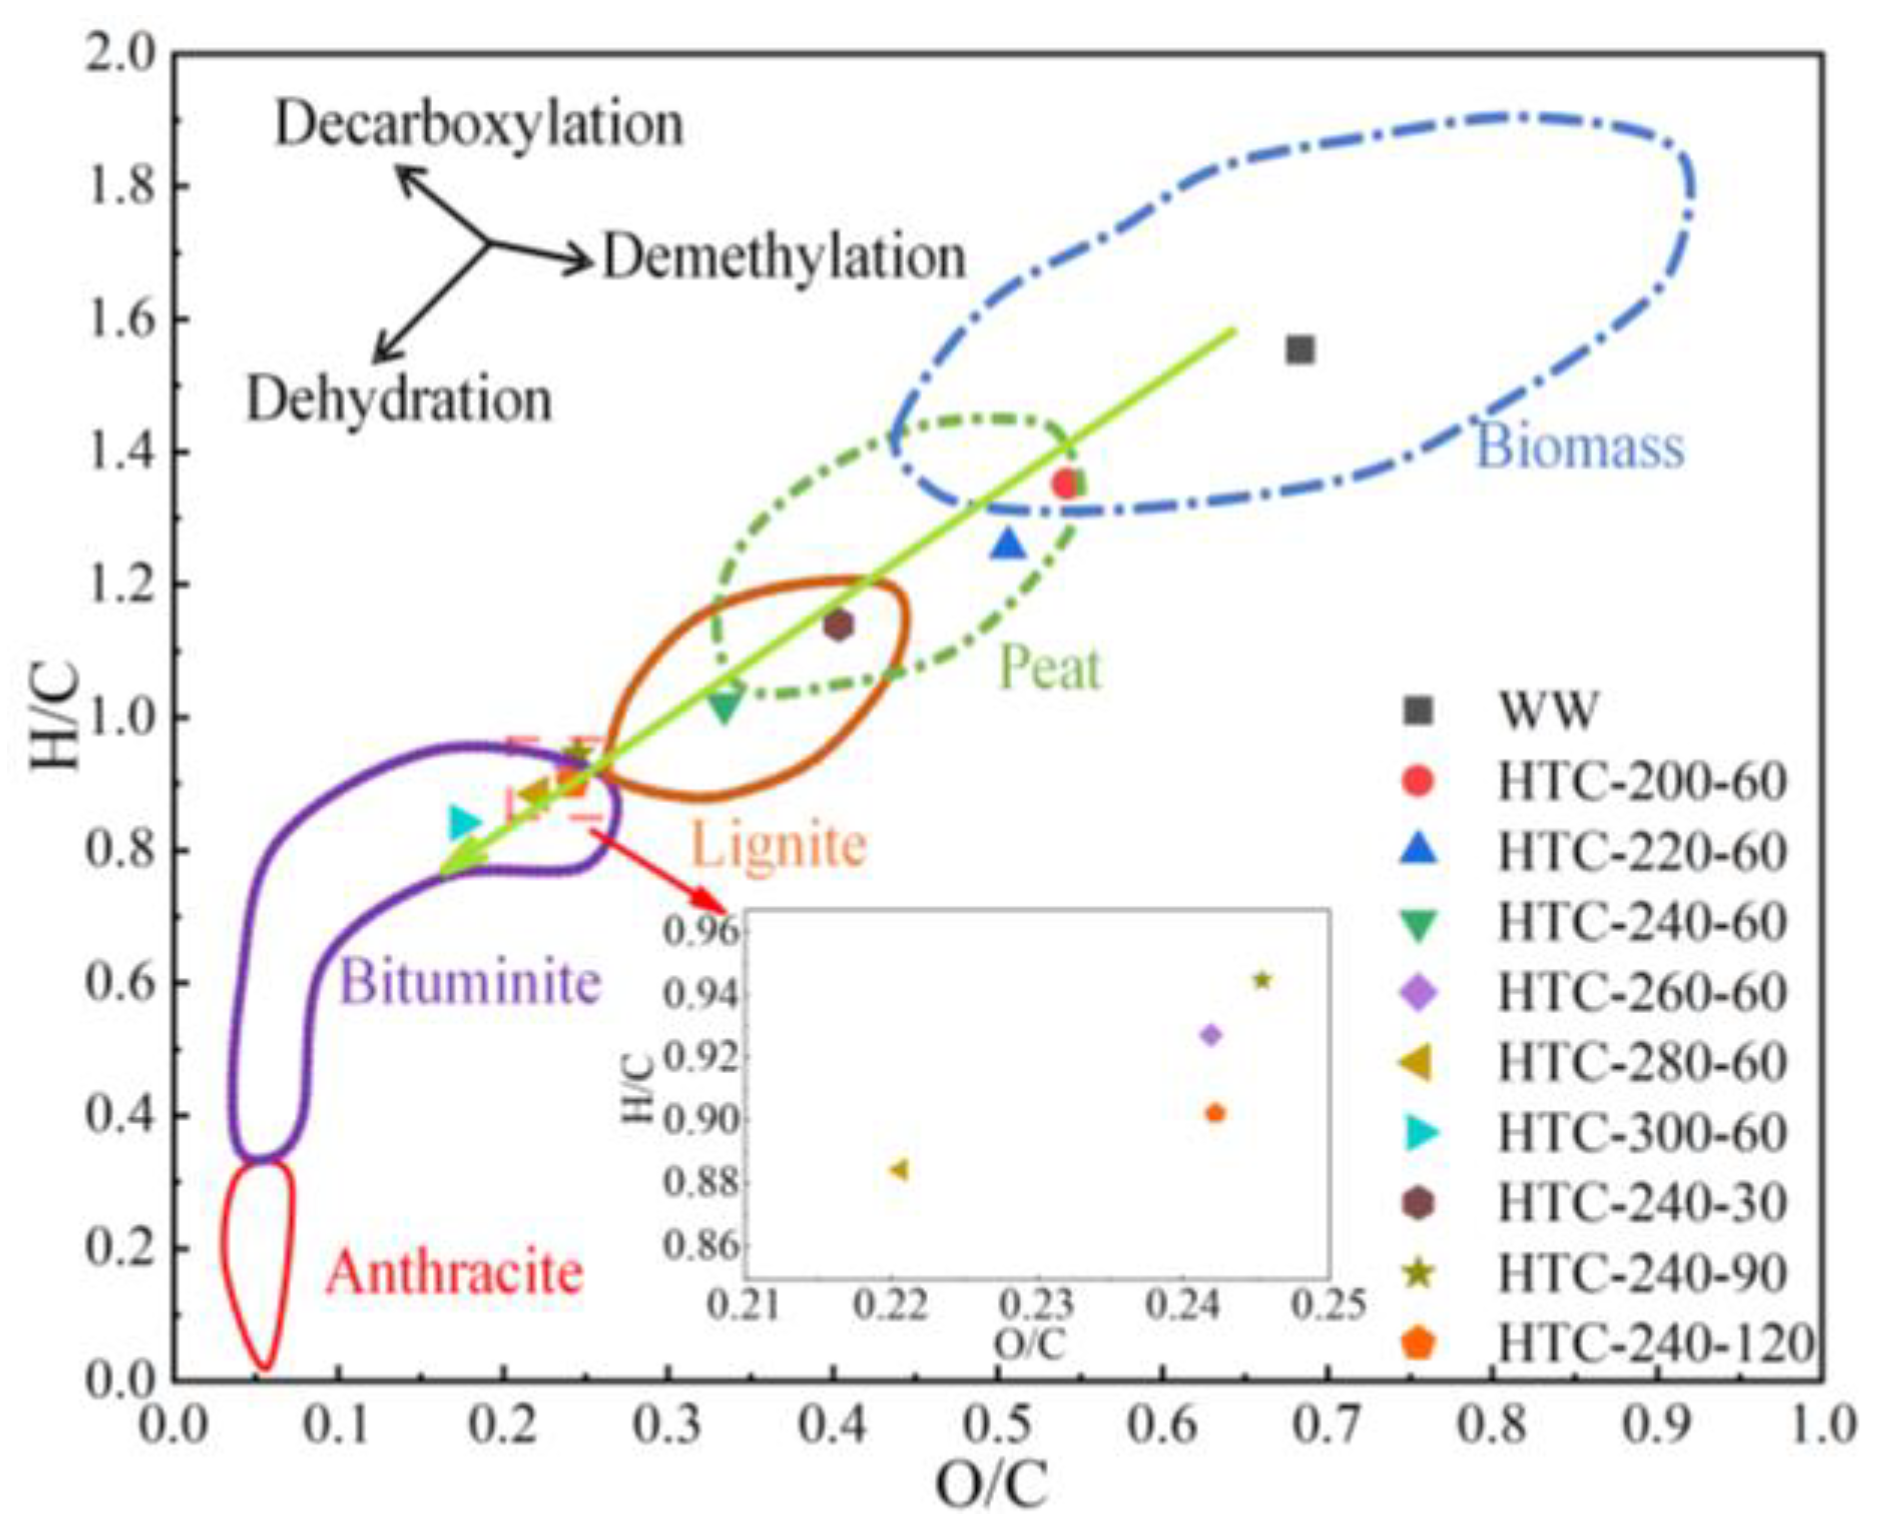
3.2. Proximate Analysis and Ultimate Analysis

Proximate analysis and ultimate analysis (Table 1) were carried out on different samples so as to study the upgrading process of WW in the HTC process. With an increase in the HTC temperature, the volatile content and ash content both decreased. The main reason for the reduction in volatile matter is that part of the volatile matter in the biomass is transferred to the liquid and gas phases through hydrolysis and decarboxylation during the HTC process to achieve “devolatilization” of the biomass. The ionization and dissolution characteristics of water in the subcritical state are improved, and the soluble metal salts (such as K, Na, Ca, etc.) in the biomass will dissolve into the liquid phase to avoid enrichment in the ash [34,35].
According to the proximate analysis, it could be found that the effect of HTC temperature on the fixed carbon content became weakened with a temperature over 240 °C, and when increased from 240 °C to 300 °C, only an 8.74% increase in carbon content could be obtained. Compared with the effect of temperature on the hydrochar, the effect of holding time on the hydrochar is weaker.
It can be observed from Table 1 that with an increase in HTC temperature, the C content increases and the O content decreases. The contents of C and O elements in the WW were 47.89 wt.% and 43.64 wt.%, respectively, while the C element content of HTC-300-60 increased to 75.59 wt.% and the O element content decreased to 17.60 wt.%. Comparing the ultimate analysis of the four groups of hydrochar with different holding times, it can be found that as the holding time increases, the C content of the hydrochar increases and the H and O content decreases. However, the changing trend of the content of each element slowed down when the holding time exceeded 60 min.
The HHVs of different samples were calculated using the formula (1), and these are shown in Table 1. With an increase in the HTC temperature and holding time, the HHV value increased. For WW, the HHV is 19.47 MJ/kg, while for HTC-300-60, it is 30.79 MJ/kg, even reaching or exceeding that of bituminous coal for blast furnace injection. It can also be found that the increasing trend of HHV of hydrochar gradually slows down with the prolongation of HTC temperature and holding time. Among them, the HHV of HTC-240-60 is 25.74 MJ/kg, which is close to the standard for blast furnace injection bituminous coal.
Numerous scholars have evaluated the composition and quality of samples through their positions in the Van Krevelen diagram [36,37,38]. According to the Van Krevelen diagram (Figure 3), the dehydration reaction and the decarboxylation reaction happen in the HTC process, and the hydroxyl groups would be removed, leading to a decrease in H/C and O/C. Figure 4 also reflects on the upgrading process of biomass to high-rank coal through the HTC process. Further, with the increase in HTC temperature and holding time, the hydrochar gradually reaches the bituminous coal belt through the peat belt and lignite belt. According to Figure 3, the sample HTC-240-60 is in the lignite region, and the HTC-260-60, HTC-280-60, and HTC-300-60 are all in the bituminous coal region.

3.3. Structural Analysis of Hydrochar

The nitrogen adsorption method was used to quantitatively analyze the changes in the microstructure of biomass in the process of HTC, such as the total specific surface area of pores. The results are shown in Table 2. With an increase in the HTC holding time, the total specific surface area (St) and the total pore volume (Vt) first increased and then decreased. The change in the pore structure of biomass in the process of HTC is due to the degradation of biomass via decarboxylation and dehydration reactions in the initial stage, so that some of the pores in the hydrochar are evacuated by gas and the pore structure is obtained. Additionally, with the continuous development of HTC, the pores in the initial stage of the HTC reaction begin to shrink and collapse, so that St and Vt gradually decrease with the prolongation of the holding time. With sufficient holding time, St and Vt gradually decrease with the increase of temperature.
The hydrochar was analyzed for organic functional groups using FTIR. The FTIR results for WW and different hydrochars are shown in Figure 5. With an increase in HTC temperature and holding time, the C–O vibrational peaks (1060 cm−1) and –OH vibrational peaks (3200 cm−1~3500 cm−1) of the samples gradually weakened, while the C=C vibrational peak (1605 cm−1) gradually strengthened. The C–O bonds are present in the biomass as methoxy or ether groups [39,40], and during the HTC of the biomass, methoxy or ether genes are removed for decarboxylation, causing the C–O absorption peak in the sample to gradually weaken [31]. During the HTC process, cellulose and hemicellulose in biomass undergo dehydration, which weakens the –OH absorption peaks. Under subcritical conditions, some small molecule polymers after biomass decomposition are aromatized and polymerized together, and the C=C tensile vibration peak is gradually enhanced, so that the degree of carbonization of hydrochar is gradually enhanced, which is consistent with the trend of decreasing H/C and O/C of hydrochar.

3.4. Combustion Behavior Analysis

Thermogravimetric analysis was used to analyze the combustion performance of hydrochar under different conditions and WW. The combustion conversion (TG) curves and combustion conversion rate (DTG) curves of different samples are shown in Figure 6 and Figure 7. For the combustion transformation process, three stages could be clarified according to the TG-curve. In the first stage, at lower temperatures, it is mainly the evaporation of the moisture in the sample that makes it weightless, but the weight loss is negligible. In the second stage, when the temperature rises, the combustible substances in the sample (such as volatiles and fixed carbon) burn to cause the sample’s weightlessness, and the severe weight loss in this stage is also the main stage in the sample combustion process. In the third stage, as the temperature continues to rise, the combustible substances in the sample are consumed, and the sample no longer loses weight. This article focuses on the second stage of the sample combustion process.
The second stage of combustion contains two processes according to the corresponding DTG curves. The temperature range corresponding to the first process is 200 °C~320 °C, and the volatiles in the sample are mainly reacted in this area. The second process corresponds to a temperature range of 320 °C to 400 °C, during which the reaction of the fixed carbon in the sample is mainly carried out. In different samples, the TG and DTG curves at different temperatures were obviously different. The trends of the HTC-200-60 and HTC-220-60 curves are closer to the curve trends of WW, but the peaks corresponding to the two reaction processes are moving towards the high-temperature zone. The TG and DTG curves of the other hydrochars basically followed the same trend. In Figure 6, with an increase in the HTC temperature, the TG and DTG curves moved into the high-temperature zone, and two peaks in the DTG curves gradually became one peak. This is mainly because the volatile content of hydrochar decreases and the fixed carbon content increases when the HTC temperature increases.
The TG and DTG curves of hydrochar under different holding times are shown in Figure 7, and there is a great difference between the curves. The TG curve of HTC-240-30 is similar to the curve of WW in Figure 6, and the TG curve of hydrochar after the holding time exceeds 60 min is the same. It could be concluded that with an increase in HTC temperature and holding time, the TG and DTG curves would move into the high-temperature region. The first peak in the WW DTG curve gradually weakens until it disappears. The second peak gradually strengthens, and both peaks move toward the high-temperature zone.
The combustion characteristic parameters (Table 3) of the samples were extracted to further analyze the combustion characteristics of hydrochar [41]. With an increase in the HTC temperature and holding time, the Ti, Tf, TM1, and TM2 of hydrochar gradually increased, as shown in Table 3. When the HTC temperature exceeds 240 °C and the holding time exceeds 60 min, TM1 disappears; that is, the first combustion characteristic peak disappears. In comparing the RM1 and RM2 values of different samples, it can be observed that as the HTC temperature increases as the holding time increases, RM1 gradually decreases until it disappears, and the difference between RM1 and RM2 gradually decreases. Further, with the disappearance of RM1 and the first characteristic peak of combustion, the RM2 value gradually increases, which means that the start combustion temperature of the hydrochar increases, which is good for the storage and transportation of the product.

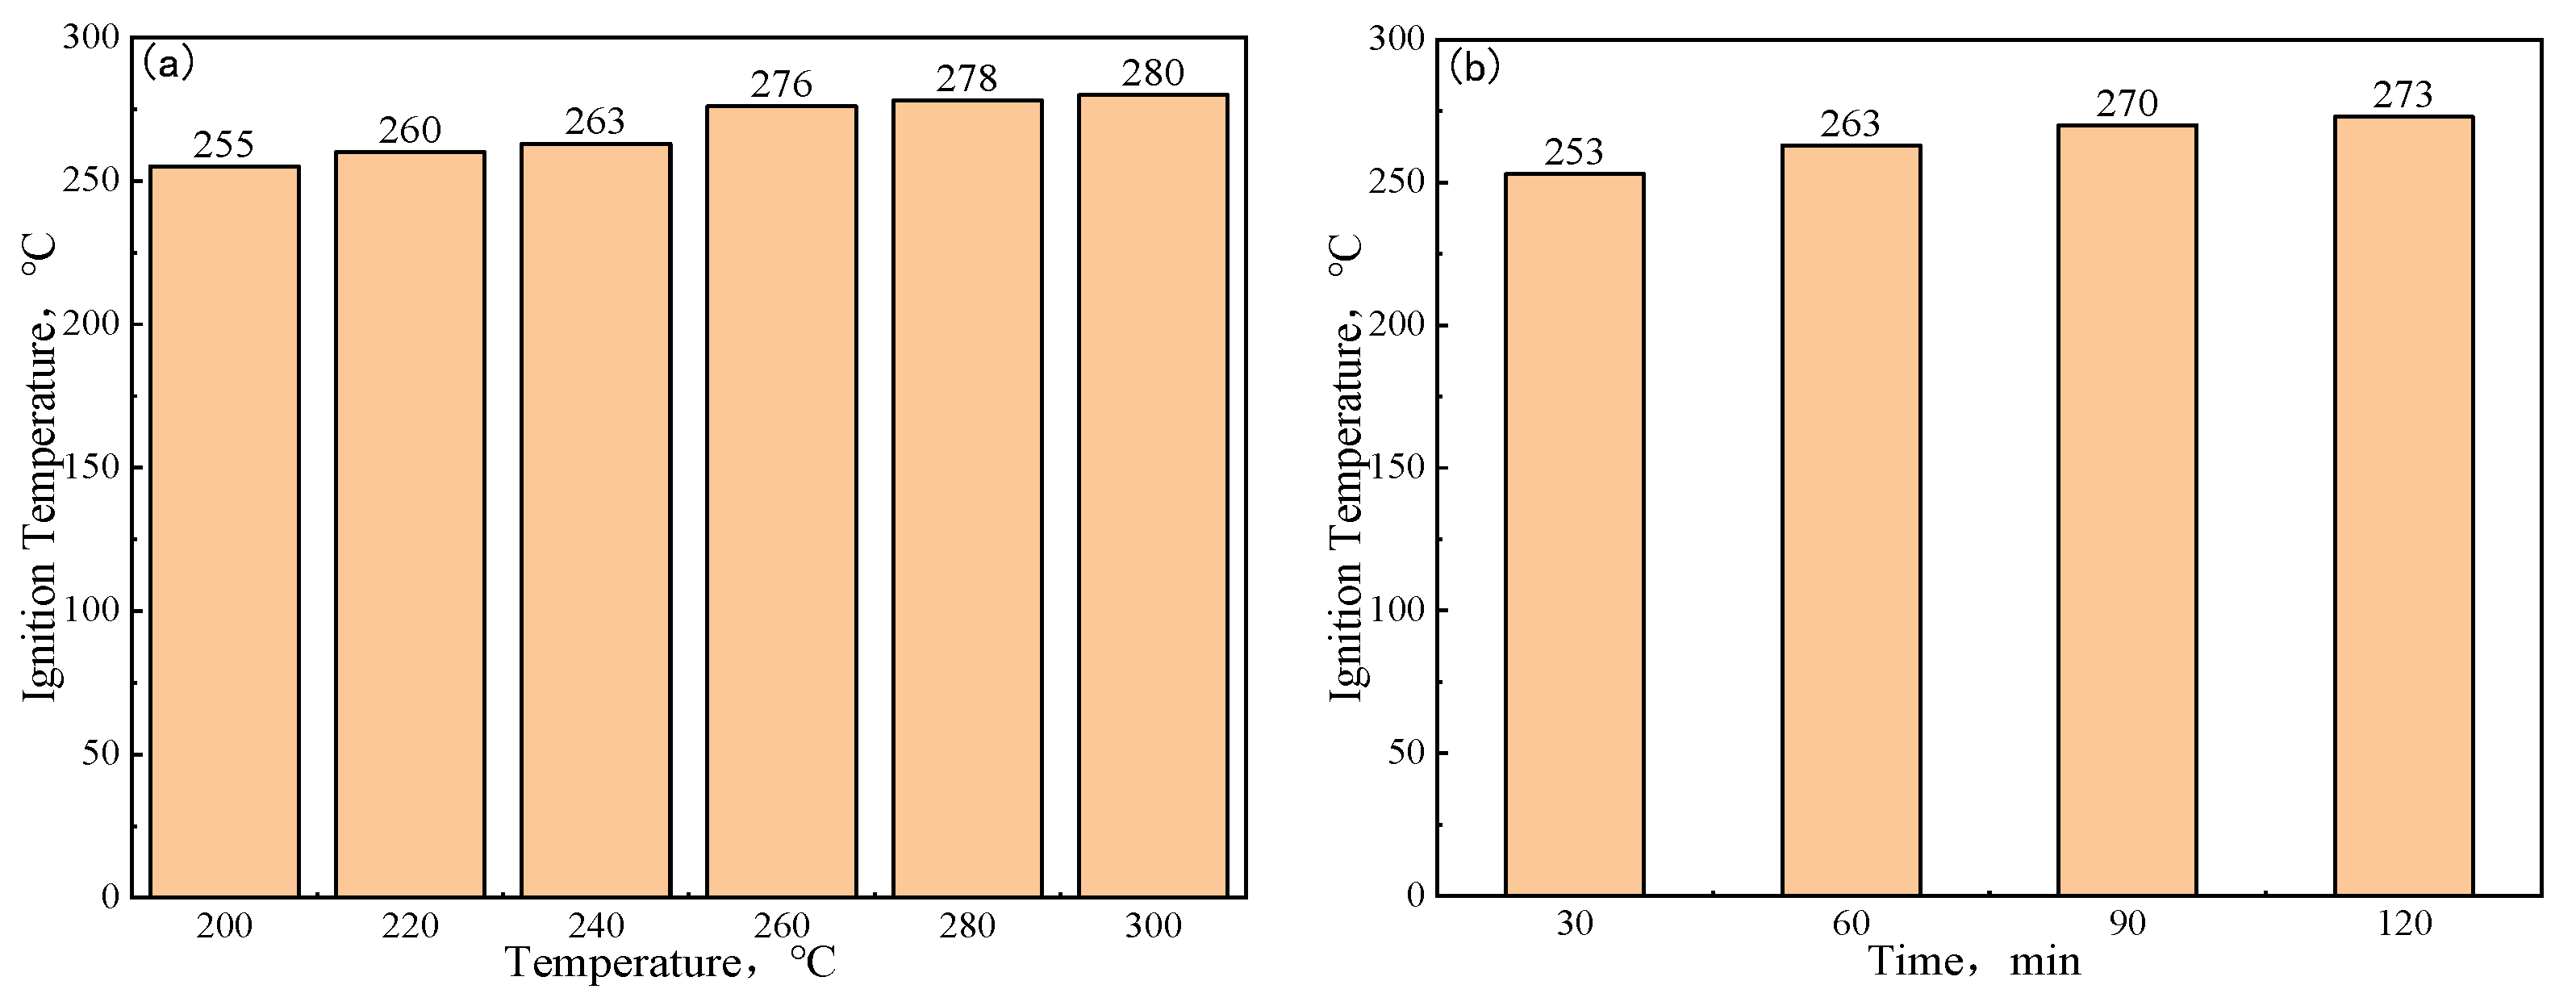
3.5. Ignition Temperature and Explosive Analysis

In addition to the composition and physicochemical properties of hydrochar, its safety during transportation, storage, and injection should be considered when applying it to blast furnace injection. The ignition temperature and explosivity of blast furnace pulverized coal are often employed to evaluate the safety performance of pulverized coal.
The ignition temperature of hydrochar, as shown in Figure 8, gradually increases with an increase in the HTC temperature and holding time. The ignition temperature is closely related to the content of volatile components in the sample. Several related studies have shown that the ignition temperature decreases when the contents of volatile components in the sample increase [16]. The variation of the ignition temperature of hydrochar under different HTC parameters is consistent with the change in volatile content in the sample. The ignition temperature of all hydrochar is between 250 °C and 280 °C, which is lower than that of bituminous coal. For the injection fuel of the blast furnace, a low ignition temperature is conducive to full combustion in the tuyere raceway, but it is no good for fuel storage or transportation.
The explosive property of pulverized coal is defined using the return flame length, and 0 mm to 400 mm is weak, 400 mm to 600 mm is medium, and over 600 mm is strong. The return flame length of all hydrochar samples is 800 mm, and this is similar to that of bituminous coal. In general, the explosiveness of the sample is closely related to the volatile content in the sample the more explosive the sample with a higher volatile content, but through the above proximate analysis of hydrochar, it is found that the volatile content of all hydrochar is more than 50%, so that the explosiveness of hydrochar is strongly explosive.
Additionally, through the ignition temperature and explosive analysis of hydrochar, it can be found that the sample has the characteristics of a low ignition temperature and strong explosiveness. Although the coal injection equipment in the modern blast furnace injection process can handle the injection of strong explosive fuel, when the hydrochar is applied to the blast furnace injection, it should be combined with the actual situation on the site, reasonably matched with anthracite coal, control its explosiveness, and ensure its safe production.

3.6. Alkali Metal Content Analysis

From the above analysis, it could be concluded that with an increase in the HTC temperature and holding time, the HHV and fixed carbon content could be obviously increased, but with a significant loss of yield. However, in industrial production, the elevated HTC temperature and holding time make the preparation of hydrochar more expensive. According to a previous study and the aforementioned analysis, with a 60 min HTC holding time and 240 °C, the HHV value could reach 25.74 MJ/kg and the yield ratio is 48.29%, and the HHV value is close to the bituminous coal injection standard of a blast furnace. The hydrochar under this parameter can not only ensure that the fuel performance meets the needs of blast furnace injection, but it can also save on preparation costs in the industrial production process.
The alkali metal content of fuel is a critical index for blast furnace injection, because too much alkali metal can not only cause damage to the furnace lining, leading to the shortening of furnace life, but it can also reduce coke strength, leading to a non-smooth operation of the furnace. The biomass contains a high level of alkali metals, which is one of the factors limiting its application in blast furnaces.
The comparison of the alkali metal content of WW and HTC-240-60 is shown in Table 4, and most of the alkali metal content could be removed using the HTC process. The highest removal rate of K was 88.09% at the HTC temperature of 240 °C and the holding time of 60 min. In the blast furnace production process, the most harmful alkali metal elements to the blast furnace are K, Na, and other elements. After HTC, the content of K in hydrochar is 0.042%, which belongs to the ultra-low alkaline coal level in the evaluation of blast furnace pulverized coal, which can replace part of the bituminous coal for injection.
The status of alkali metals in biomass can be divided into four kinds according to their solubility. The first is a water-soluble alkali metal; this part of the alkali metal mainly exists as alkaline oxides. The second is an ammonium acetate-soluble alkali metal; the alkali metal of this part is connected with nitrogen- or oxygen-containing functional groups in biomass. The third is hydrochloric acid-soluble alkali metal; this part of the alkali metal is directly connected with the organic carbon chain in the biomass. The last is an insoluble alkali metal, such as the silicon aluminum salt of the alkali metal [42].
First of all, due to the improved solubility performance of the subcritical system, the first water-soluble alkali metal in biomass is leached in large quantities during HTC. Secondly, during the removal of oxygen-containing functional groups in the HTC process, the alkali metal attached to them was also removed. Most of the remaining alkali metals belonging to the third and fourth alkali metals are difficult to remove, but their proportion is relatively small. The removal efficiency of different alkali metals in the HTC process follows the order of K > Ca > Mg.

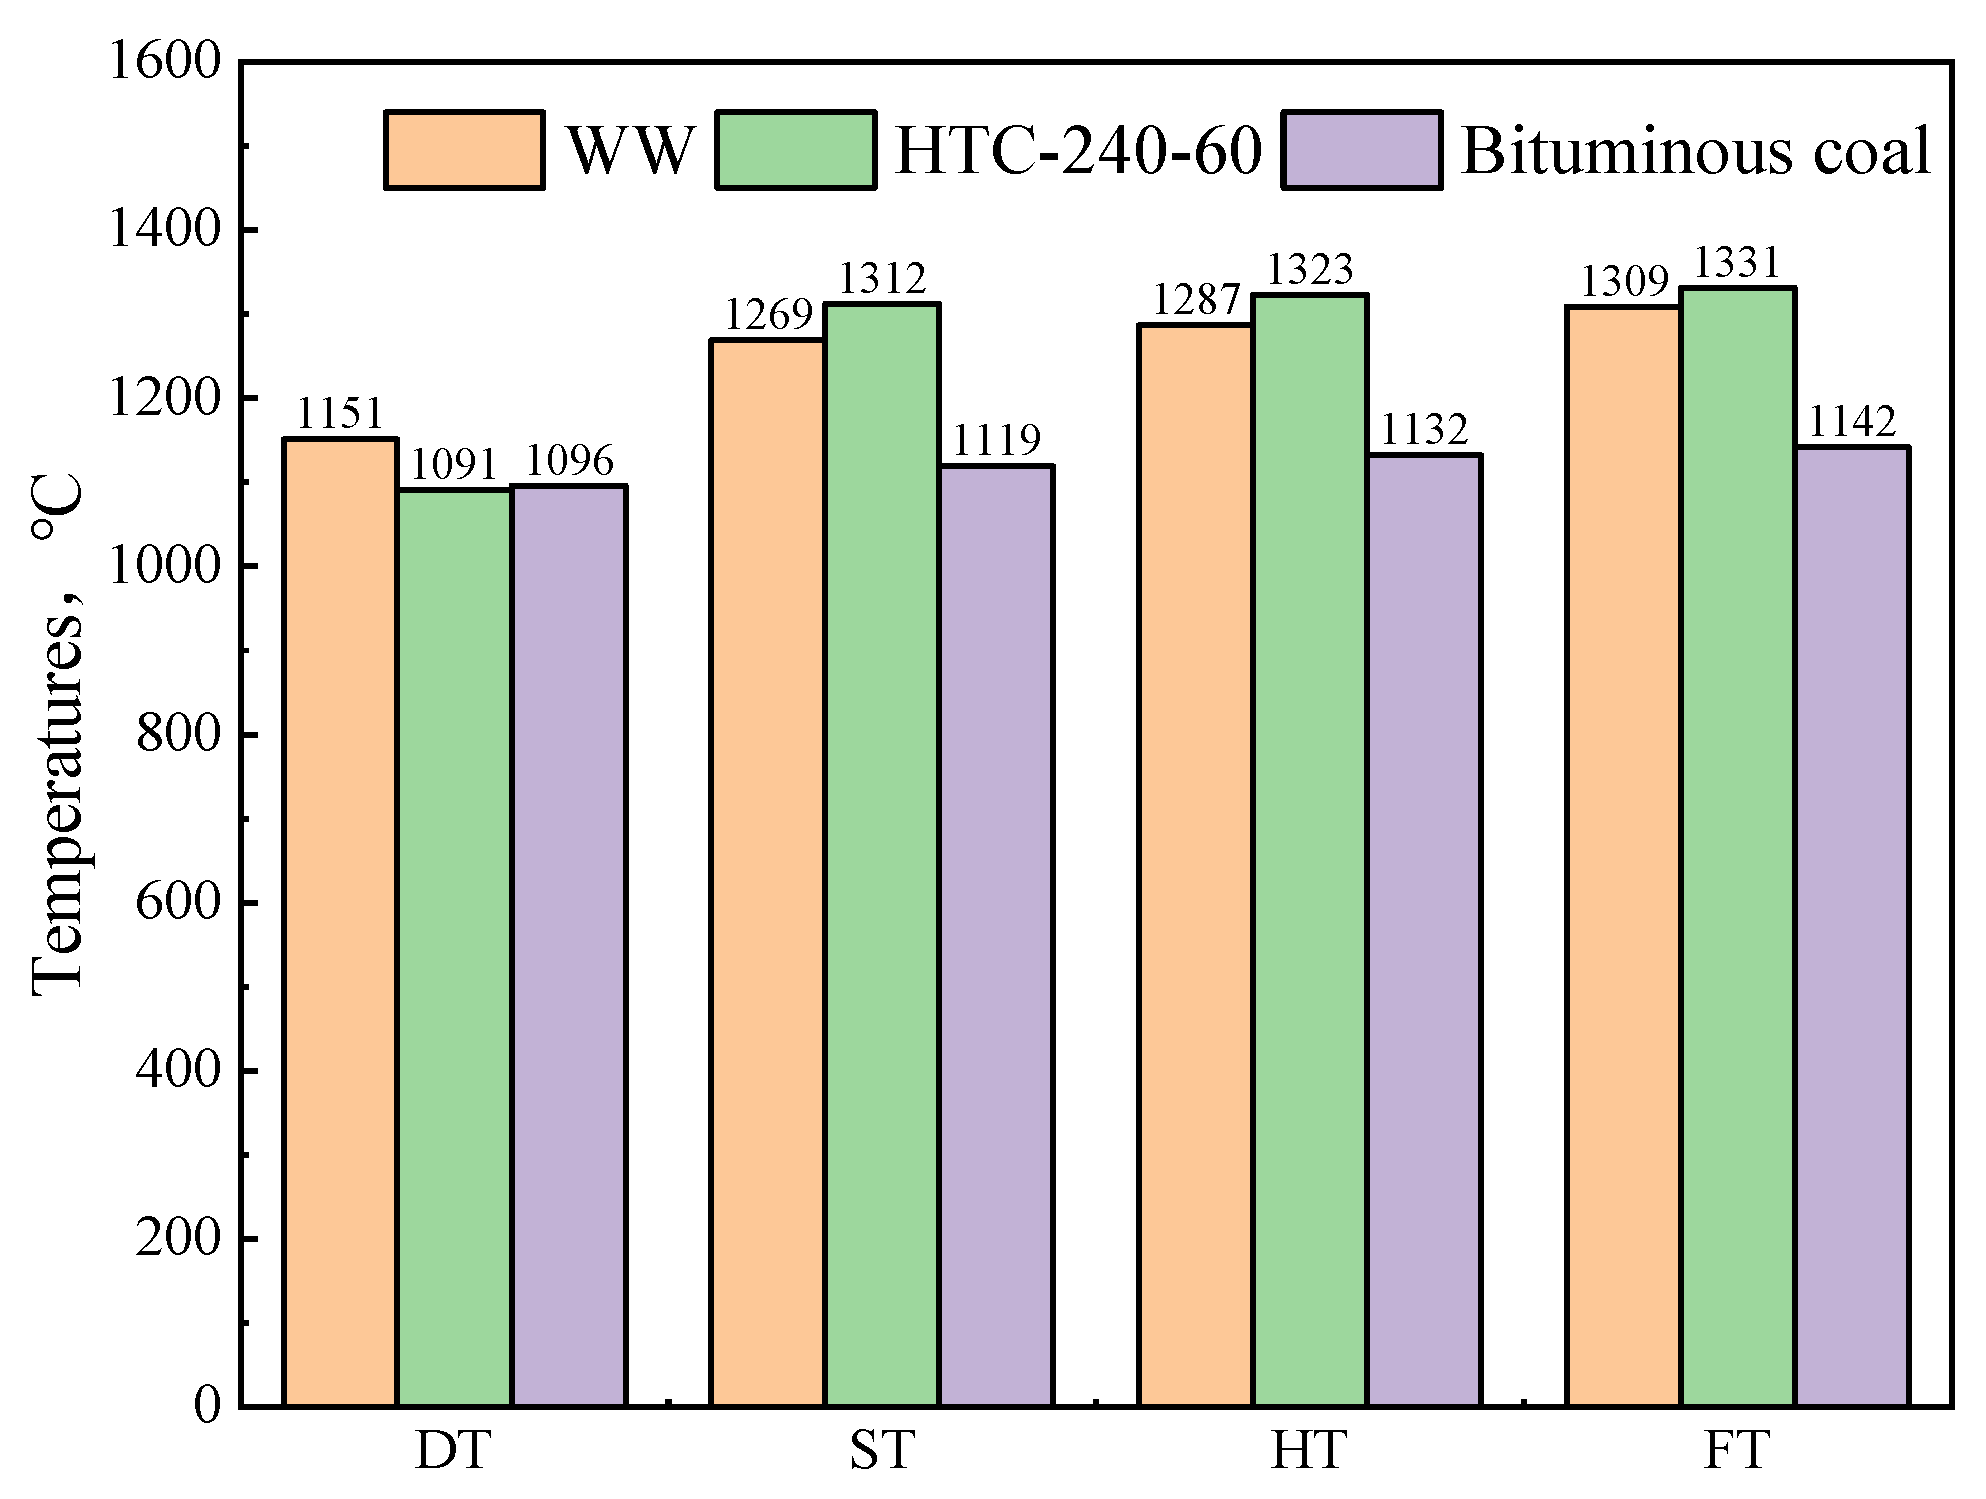
3.7. Analysis of Ash Composition and Ash Melt Characteristics

The composition and melting characteristics of ash are also important factors for the blast furnace’s injection of fuel. The difference in coal ash composition will affect the ash melting characteristics of the coal ash. When the melting point of pulverized coal ash is low, it will cause the blast furnace spray gun slag to affect the blast furnace injecting. The composition and melting point of ash for WW, HTC-240-60, and bituminous coal are shown in Table 5 and Figure 9. The alkali metal oxides in hydrochar are lower than those in WW, but the acidic oxides are higher, which is in accordance with the previous study. The ash composition of hydrochar has higher alkaline oxides than bituminous coal and lower acidic oxides than bituminous coal. However, from the analysis of the ash melting point, it can be observed that the ash melting point of hydrochar ash is slightly higher than the ash melting point of WW. Compared with blast furnace injection of bituminous coal, hydrochar has a higher ash melting point. The factors affecting the melting point of the ash are mainly the content of alkaline oxides and acidic oxides in the sample ash. The acidic oxides (such as SiO2 and Al2O3) in the melting of the sample ash play a skeleton role, and the higher the acid oxide content, the higher the ash melting point. In addition, alkaline oxides (such as CaO, MgO, Na2O, and K2O) play a “promotes melting” role in melting. The alkali metal oxides in the ash of hydrochar are higher than those of bituminous coal, but its ash melting point is higher. It could be explained by the fact that although CaO is a flux agent, when a certain degree of content is exceeded, the phase of CaO would exist, causing a sharp increase in melting. Due to the high melting point of hydrochar ash, the phenomenon of coal gun clogging and tuyere sticking when using hydrochar for injection into the blast furnace could be limited.

3.8. CO2 Emissions Reduction Analysis

In order to quantify the potential for CO2 emissions reduction after applying biochar to the blast furnace injection process, this paper calculates the reduction in blast furnace CO2 emissions after biomass hydrochar injection.
According to the industry standard [43,44], the total CO2 emissions of steel production enterprises are equal to the sum of all fossil fuel combustion emissions, process emissions, and CO2 emissions corresponding to the electricity and heat purchased by enterprises within the accounting boundary. At the same time, the deduction of CO2 emissions implied by carbon sequestration products and the CO2 emissions corresponding to the outputs of electricity and heat, are calculated according to the following formula:
E = E Combustion + E Process + E Input   electricity   + E Input   heat R Carbon   sequestration   products E Output   electricity E Output   heat
where E is the total amount of CO2 emissions, tCO2; E Combustion is the fuel combustion emissions, tCO2; E Process is the process emission, tCO2; E Input   electricity   is the emission corresponding to the purchased electricity consumption, tCO2; E Input   heat is the emission corresponding to the purchased heat consumption, tCO2; E Output   electricity is the emission corresponding to the output electricity, tCO2; E Output   heat is the corresponding emissions of the output heat, tCO2; and R Carbon   sequestration   products are the emissions implied by the company’s carbon sequestration products, tCO2.
In the calculation process, it is assumed that the operating parameters of the blast furnace do not change significantly after the blast furnace is injected with hydrochar, so it can be considered that E Process , E Input   electricity   , E Input   heat , R Carbon   sequestration   products , E Output   electricity and E Output   heat remain unchanged, and that the factor affecting the carbon emissions of the blast furnace smelting is E Combustion . In the calculation process, taking the existing coal injection structure of a steel plant as the base period, the ratio of the original coal-jet bituminous coal to anthracite coal is 40:60; and the coal ratio is 160 kg/tHM, and the proportions of 5%, 10%, 15%, and 20% in the process of injecting hydrochar are replaced by the bituminous coal in the original coal injection scheme. When a steel company blast furnace injects bituminous coal at a HHV of 30.05 MJ/kg, when hydrochar is used instead of bituminous coal for HHV, 1 kg of bituminous coal needs an equivalent replacement of 1.17 kg HTC-240-60.
The CO2 emissions from blast furnace smelting production combustion activities E Combustion are the sum of the CO2 emissions from the combustion of various fuels produced by blast furnaces, calculated according to the following formula:
E Combustion = i = 1 n A D i × E F i
where E Combustion is the amount of CO2 emitted by the fuel combustion process, kg/tHM; A D i are the activity data for the ith fuel, MJ; E F i is the CO2 emission factor of the i-th fossil fuel, kgCO2/MJ; and i is the type of fuel consumed. Among them, A D i and E F i can be calculated using the following formula:
A D i = N C V i × F C i
E F i = C C i × O F i × 44 12
where N C V i is the average low calorific value of the ith fossil fuel, MJ/kg; F C i is the consumption of the ith fossil fuel, kg; C C i is the carbon content per unit calorific value of the ith fuel, kgC/MJ; O F i is the carbon oxidation rate of the ith fuel, %; and 44 12 is the ratio of the relative molecular mass of CO2 to carbon.
Since biomass is a carbon-neutral material, the total amount of CO2 emissions is not counted in the process of accounting for the CO2 emissions of enterprises. In the process of calculating the reduced CO2 emissions, it is only necessary to calculate the CO2 emissions of the bituminous coal replaced by biomass.
In Formulas (8) and (9), the NCV of bituminous coal is 26.33 MJ/kg, the CC is 25.41 kgC/MJ, and the OF is 93%. When the proportion of hydrochar replacing bituminous coal was 5%, 10%, 15%, and 20%, the FCs were 8 kg/tHM, 16 kg/tHM, 24 kg/tHM, and 32 kg/tHM, respectively. In bringing the above data into Formulas (8)–(10) calculates the reduction in CO2 emissions under different proportions of hydrochar injection by blast furnaces, as shown in Figure 10.
As can be seen from Figure 10, with the increase in hydro-char ratio, the CO2 emission reduction gradually increases, and when the hydrochar ratio is 20% (that is, when the hydrochar injection volume is 37.44 kg/tHM), the CO2 emission reduction can be 73.02 kg/tHM compared with the base period. When 1 kg/tHM of hydrothermal carbon replaces the bituminous coal injection, it can reduce the CO2 emissions by 1.95 kg/tHM. Therefore, using biomass hydrochar as an injection fuel to partially replace the pulverized coal is an effective way to alleviate the dependence of blast furnace iron making on fossil energy, and it is also an effective way to reduce CO2 emissions. Considering the scale of CO2 emissions from blast furnace iron making, it is also of great significance to achieving the nation’s carbon peak and carbon neutrality goals.

4. Conclusions

The influences of HTC temperature and holding time on the physicochemical characteristics of hydrochar were investigated. The results show that after the biomass is treated with HTC, the fixed carbon, HHV, and combustion characteristics are greatly improved. In addition, the absorption peak of the oxygen-containing functional group in hydrochar is weakened, and the C=C tensile vibration is enhanced. Under the premise of a sufficient holding time, with the increase in HTC temperature, the St and Vt of hydrochar gradually decrease. Combined with the analysis of the yield and physicochemical characteristics of hydrochar under different HTC parameters, it is found that the HTC temperature is 240 °C, and the holding time is 60 min, which are the parameters that are suitable for industrial production. Further, the alkali metal content, ash composition, and ash melting characteristics of hydrochar under the optimal parameters were analyzed. The analysis shows that injecting this hydrochar did not adversely affect blast furnace production. The CO2 emission reduction for hydrochar blast furnace injection was calculated. The results show that with an increase in the proportion of hydrochar injection, the reduction in CO2 emissions gradually increases. When hydrochar is injected at 1 kg/tHM, it can reduce 1.95 kg/tHM of CO2 emissions.

Author Contributions

Conceptualisation, G.W., R.L., X.N. and C.W.; Data curation, R.L. and K.X.; Formal analysis, G.W.; Methodology, G.W. and R.L.; Supervision, G.W. and R.L.; Validation, G.W. and R.L.; Visualisation, G.W.; Writing—original draft, G.W., R.L. and J.L.; Writing—review and editing, R.L., J.D., X.Y., J.S. and T.L.; All authors have read and agreed to the published version of the manuscript.

Funding

This work was supported by the National Natural Science Foundation of China (No. 52174295, 52074029). Chuan Wang would like to acknowledge the financial support from the OSMET 3.0 Project (DNR: 2020-04140) funded by Sweden’s Innovation Agency (VINNOVA).

Data Availability Statement

Not applicable.

Conflicts of Interest

The authors declare no conflict of interest.

References

  1. National Bureau of Statistics of China. Statistical Communiqué of the People’s Republic of China on National Economic and Social Development in 2020. China Stat. 2021, 3, 8–22. [Google Scholar]
  2. Quader, M.A.; Ahmed, S.; Dawal, S.Z.; Nukman, Y. Present needs, recent progress and future trends of energy-efficient Ultra-Low Carbon Dioxide (CO2) Steelmaking (ULCOS) program. Renew. Sustain. Energ. Rev. 2016, 55, 537–549. [Google Scholar] [CrossRef]
  3. Zhao, J.; Zuo, H.B.; Wang, Y.J.; Wang, J.S.; Xue, Q.G. Review of green and low-carbon ironmaking technology. Ironmak. Steelmak. 2020, 47, 296–306. [Google Scholar] [CrossRef]
  4. Suopajärvi, H.; Kemppainen, A.; Haapakangas, J.; Fabritius, T. Extensive review of the opportunities to use biomass-based fuels in iron and steelmaking processes. J. Clean. Prod. 2017, 148, 709–734. [Google Scholar] [CrossRef]
  5. Cao, L.C.; Zhang, C.; Chen, H.H.; Tsang, D.C.W.; Luo, G.; Zhang, S.C.; Chen, J. Hydrothermal liquefaction of agricultural and forestry wastes: State-of-the-art review and future prospects. Bioresour. Technol. 2017, 245, 1184–1193. [Google Scholar] [CrossRef] [PubMed]
  6. Abbasi T, Abbasi S A. Biomass energy and the environmental impacts associated with its production and utilization. Renew. Sustain. Energy Rev. 2010, 14, 919–937. [Google Scholar] [CrossRef]
  7. Mousa, E.; Wang, C.; Riesbeck, J.; Larsson, M. Biomass applications in iron and steel industry: An overview of challenges and opportunities. Renew. Sustain. Energy Rev. 2016, 65, 1247–1266. [Google Scholar] [CrossRef]
  8. Orre, J.; Ökvist, L.S.; Bodén, A.; Björkman, B. Understanding of Blast Furnace Performance with Biomass Introduction. Minerals 2021, 11, 157. [Google Scholar] [CrossRef]
  9. Zhang, Q.; Sun, Y.S.; Han, Y.J.; Li, Y.J.; Gao, P. Review on coal-based reduction and magnetic separation for refractory iron-bearing resources. Int. J. Miner. Metall. Mater. 2022, 29, 2087–2105. [Google Scholar] [CrossRef]
  10. Cholico, G.D.; Lara, N.O.; Miranda, M.A.S.; Estrella, R.M.; García, R.E.; Patiño, C.A.L. Efficient metallization of magnetite concentrate by reduction with agave bagasse as a source of reducing agents. Int. J. Miner. Metall. Mater. 2021, 28, 603–611. [Google Scholar] [CrossRef]
  11. Zandi, M.; Martinez-Pacheco, M.; Fray, T.A.T. Biomass for iron ore sintering. Miner. Eng. 2010, 23, 1139–1145. [Google Scholar] [CrossRef]
  12. Ooi, T.C.; Aries, E.; Bruce, C.R.E.; Dennis, T.; David, R.A.; Ray, F.; Fray, T.; Tognarelli, D. The study of sunflower seed husks as a fuel in the iron ore sintering process. Miner. Eng. 2008, 21, 167–177. [Google Scholar] [CrossRef]
  13. Zhou, D.; Wei, R.; Long, H.; Li, J.X.; Qi, L.Y.; Xu, C.C. Combustion characteristics and kinetics of different food solid wastes treatment by blast furnace. Renew. Energy 2020, 145, 530–541. [Google Scholar] [CrossRef]
  14. Ye, L.; Zhang, J.; Wang, G.; Wang, C.; Mao, X.; Ning, X.; Zhang, N.; Teng, H.; Li, J.; Wang, C. Feasibility analysis of plastic and biomass hydrochar for blast furnace injection. Energy 2023, 263, 125903. [Google Scholar] [CrossRef]
  15. Zhu, X.; Li, X.; Xiao, L.; Zhang, X.Y.; Tong, S.; Wu, C.; Ashida, R.; Liu, W.; Miura, K.; Yao, H. Novel carbon-rich additives preparation by degradative solvent extraction of biomass wastes for coke-making. Bioresour. Technol. 2016, 207, 85–91. [Google Scholar] [CrossRef] [PubMed]
  16. Wang, K.; Zhang, J.L.; Wu, S.L.; Wu, J.L.; Xu, J.Y.; Ning, X.J.; Wang, G. Feasibility Analysis of Biomass Hydrochar Blended Coal Injection for Blast Furnace. Sustainability 2022, 14, 10885. [Google Scholar] [CrossRef]
  17. Zhang, J.L.; Fu, H.Y.; Liu, Y.X.; Dang, H.; Ye, L.; Alberto, N.C.; Xu, R.S. Review on biomass metallurgy: Pretreatment technology, metallurgical mechanism and process design. Int. J. Miner. Metall. Mater. 2022, 29, 1133–1149. [Google Scholar] [CrossRef]
  18. Khan, T.A.; Saud, A.S.; Jamari, S.S.; Rahim, M.H.A.; Park, J.W.; Kim, H.J. Hydrothermal carbonization of lignocellulosic biomass for carbon rich material preparation: A review. Biomass. Bioenergy 2019, 130, 105384. [Google Scholar] [CrossRef]
  19. Azzaz, A.A.; Khiari, B.; Jellali, S.; Ghimbeu, C.M.; Jeguirim, M. Hydrochars production, characterization and application for wastewater treatment: A review. Renew. Sustain. Energy Rev. 2020, 127, 109882. [Google Scholar] [CrossRef]
  20. Sharma, H.B.; Sarmah, A.K.; Dubey, B. Hydrothermal carbonization of renewable waste biomass for solid biofuel production: A discussion on process mechanism, the influence of process parameters, environmental performance and fuel properties of hydrochar. Renew. Sustain. Energy Rev. 2020, 123, 109761. [Google Scholar] [CrossRef]
  21. Kim, D.; Lee, K.; Park, K.Y. Hydrothermal carbonization of anaerobically digested sludge for solid fuel production and energy recovery. Fuel 2014, 130, 120–125. [Google Scholar] [CrossRef]
  22. Yang, G.Y.; Liu, H.; Li, Y.; Zhou, Q.Y.; Jin, M.H.; Xiao, H.; Yao, H. Kinetics of hydrothermal carbonization of kitchen waste based on multi-component reaction mechanism. Fuel 2022, 324, 124693. [Google Scholar] [CrossRef]
  23. He, Q.; Cheng, C.; Abdul, R.; Ding, L.; Lam, S.A.; Yu, G.S. Effect of hydrothermal carbonization on woody biomass: From structure to reactivity. Fuel 2022, 330, 125586. [Google Scholar] [CrossRef]
  24. Lin, Y.; Ma, X.; Peng, X.; Yu, Z.S. Hydrothermal carbonization of typical components of municipal solid waste for deriving hydrochars and their combustion behavior. Bioresour. Technol. 2017, 243, 539–547. [Google Scholar] [CrossRef] [PubMed]
  25. Park, K.Y.; Lee, K.; Kim, D. Characterized hydrochar of algal biomass for producing solid fuel through hydrothermal carbonization. Bioresour. Technol. 2018, 258, 119–124. [Google Scholar] [CrossRef]
  26. Ning, X.J.; Liang, W.; Zhang, J.L.; Wang, G.W.; Li, Y.J.; Jiang, C.H. Effect of ash on coal structure and combustibility. Int. J. Miner. Metall. Mater. 2019, 26, 973–982. [Google Scholar] [CrossRef]
  27. Zhu, G.; Yang, L.; Gao, Y.; Xu, J.Y.; Chen, H.J.; Zhu, Y.Z.; Wang, Y.; Liao, C.; Lu, C.; Zhu, C. Characterization and pelletization of cotton stalk hydrochar from HTC and combustion kinetics of hydrochar pellets by TGA. Fuel 2019, 244, 479–491. [Google Scholar] [CrossRef]
  28. Yan, K.; Liu, C.; Liu, L.; Xiong, M.; Chen, J.T.; Zhang, Z.T.; Zhong, S.; Xu, Z.; Huang, J. Pyrolysis behaviour and combustion kinetics of waste printed circuit boards. Int. J. Miner. Metall. Mater. 2022, 29, 1722–1732. [Google Scholar] [CrossRef]
  29. Yu, C.M.; Ren, S.; Wang, G.W.; Xu, J.J.; Teng, H.P.; Li, T.; Huang, C.; Wang, C. Kinetic analysis and modeling of maize straw hydrochar combustion using a multi-Gaussian-distributed activation energy model. Int. J. Miner. Metall. Mater. 2022, 29, 464–472. [Google Scholar] [CrossRef]
  30. Jin, L.Z.; Niu, X.M. Micromorphology and safety properties of meager and meager-lean coal for blast furnace injection. Int. J. Miner. Metall. Mater. 2021, 28, 774–781. [Google Scholar] [CrossRef]
  31. Kim, D.; Lee, K.; Park, K.Y. Upgrading the characteristics of biochar from cellulose, lignin, and xylan for solid biofuel production from biomass by hydrothermal carbonization. J. Ind. Eng. Chem. 2016, 42, 95–100. [Google Scholar] [CrossRef]
  32. Funke, A.; Ziegler, F. Hydrothermal carbonization of biomass: A summary and discussion of chemical mechanisms for process engineering. Biofuel Bioprod. Bioresour. 2010, 4, 160–177. [Google Scholar] [CrossRef]
  33. Sermyagina, E.; Saari, J.; Kaikko, J.; Vakkilainen, E. Hydrothermal carbonization of coniferous biomass: Effect of process parameters on mass and energy yields. J. Anal. Appl. Pyrol. 2015, 113, 551–556. [Google Scholar] [CrossRef]
  34. Zhang, D.L.; Wang, F.; Shen, X.L.; Yi, W.M.; Li, Z.H.; Li, Y.J.; Tian, C. Comparison study on fuel properties of hydrochars produced from corn stalk and corn stalk digestate. Energy 2018, 165, 527–536. [Google Scholar] [CrossRef]
  35. Zhang, Y.; Jiang, Q.; Xie, W.L.; Wang, Y.F.; Kang, J.M. Effects of temperature, time and acidity of hydrothermal carbonization on the hydrochar properties and nitrogen recovery from corn stover. Biomass Bioenergy 2019, 122, 175–182. [Google Scholar] [CrossRef]
  36. Liang, W.; Wang, G.W.; Jiao, K.X.; Ning, X.J.; Zhang, J.L.; Guo, X.M.; Li, J.; Wang, C. Conversion mechanism and gasification kinetics of biomass char during hydrothermal carbonization. Renew. Energy 2021, 173, 318–328. [Google Scholar] [CrossRef]
  37. Ning, X.J.; Liang, W.; Wang, G.W.; Xu, R.S.; Wang, P.; Zhang, J.L.; Guo, X.; Jiang, C.; Li, J.; Wang, C. Effect of pyrolysis temperature on blast furnace injection performance of biochar. Fuel 2022, 313, 122648. [Google Scholar] [CrossRef]
  38. Wang, C.; Mellin, P.; Lövgren, J.; Nilsson, L.; Yang, W.H.; Salman, H.; Hultgren, A.; Larsson, M. Biomass as blast furnace injectant–Considering availability, pretreatment and deployment in the Swedish steel industry. Energy Convers. Manag. 2015, 102, 217–226. [Google Scholar] [CrossRef] [Green Version]
  39. Keiluweit, M.; Nico, P.S.; Johnson, M.G.; Kleber, M. Dynamic molecular structure of plant biomass-derived black carbon (biochar). Environ. Sci. Technol. 2010, 44, 1247–1253. [Google Scholar] [CrossRef] [Green Version]
  40. Román, S.; Nabais JM, V.; Laginhas, C.; Ledesma, B.; González, J.F. Hydrothermal carbonization as an effective way of densifying the energy content of biomass. Fuel Process. Technol. 2012, 103, 78–83. [Google Scholar] [CrossRef]
  41. Xu, Y.; Zhang, C.; Xia, J.; Yang, S. Experimental study on the comprehensive behavior of combustion for blended coals. Asia-Pac. J. Chem. Eng. 2010, 5, 435–440. [Google Scholar] [CrossRef]
  42. Cai, J.J.; Wang, S.Z.; Kuang, C.; Tang, X.Y. Insight into the kinetic analysis of catalytic combustion for biomass after alkaline metals loaded pretreatment. Fuel 2017, 203, 501–513. [Google Scholar] [CrossRef]
  43. GB/T 32151.5-2015; Greenhouse Gas Emissions Accounting and Reporting Requirements Part 5: Steel Producers. National Standards of People’s Republic of China: Beijing, China, 2015.
  44. GB/T 32150-2015; General Guideline of the Green House Gas Emissions Accounting and Reporting for Industrial Enterprises. National Standards of People’s Republic of China: Beijing, China, 2015.
Figure 1. Pulverized coal safety measurement equipment, 1: Pulverized coal heating unit; 2: pulverizer coal injector; 3: glass tube; 4: image detector.
Energies 16 01216 g001
Figure 2. Effect of different HTC parameters on yield; (a) different temperatures; (b) different holding times.
Energies 16 01216 g002
Figure 3. Morphology of different samples.
Energies 16 01216 g003
Figure 4. Van Krevelen diagram of WW and different hydrochar.
Energies 16 01216 g004
Figure 5. FTIR patterns of different samples, (a) different temperatures; (b) different holding times.
Energies 16 01216 g005
Figure 6. TG and DTG curves of WW and hydrochar under different HTC temperatures: (a) TG curves; (b) DTG curves.
Energies 16 01216 g006
Figure 7. TG and DTG curves of hydrochar under different holding times: (a) TG curves; (b) DTG curves.
Energies 16 01216 g007
Figure 8. Ignition temperatures of different hydrochar: (a) different temperatures; (b) different holding times.
Energies 16 01216 g008
Figure 9. Ash melting point of WW and hydrochar.
Energies 16 01216 g009
Figure 10. Effect of blast furnace injection of hydrochar on CO2 emission reduction.
Energies 16 01216 g010
Table 1. Proximate analysis and ultimate analysis of WW and hydrochar.
SampleProximate Analysis (wt.%)Ultimate Analysis (wt.%)H/CO/CHHV (MJ/kg)
AdVdFCd *CdHdOd *NdSd
WW1.9881.8516.1747.896.2043.640.250.041.550.6819.47
HTC-200-602.2373.0124.7653.105.9838.380.270.041.350.5421.57
HTC-220-601.9270.7527.3354.985.7637.110.200.031.260.5122.10
HTC-240-302.0265.0132.9759.895.6932.220.140.041.140.4024.24
HTC-240-601.8458.2139.9563.955.4328.480.280.021.020.3325.74
HTC-240-901.7256.4441.8469.785.4922.830.160.020.940.2528.44
HTC-240-1201.2155.3243.4770.505.3022.770.210.010.900.2428.48
HTC-260-601.5952.7045.7170.135.4222.620.210.030.930.2428.50
HTC-280-601.2152.3046.4972.055.3121.200.200.030.880.2229.19
HTC-300-601.2050.0148.7975.595.3017.600.280.030.840.1730.79
Note: d is dry basis; *, calculated used the difference method.
Table 2. Pore structure parameters of hydrochar under different hydrothermal parameters.
SampleSt (m2/g)Vt (cm3/g)Da (nm)
HTC-200-603.090.012215.81
HTC-220-602.510.010316.48
HTC-240-301.030.003814.64
HTC-240-601.360.005115.05
HTC-240-900.980.003112.55
HTC-240-1200.750.002111.05
HTC-260-601.180.004113.84
HTC-280-601.150.004013.78
HTC-300-600.790.002412.01
Note: St, total surface area; Vt, total pore volume; Da, average pore diameter
Table 3. Combustion characteristic parameters of different samples.
SampleTi/°CTf/°CTM1/°CTM2/°CRM1/s−1RM2/s−1
WW2353782723620.01210.0061
HTC-200-602674953223630.00930.0061
HTC-220-602684843293930.00520.0061
HTC-240-302674983414150.00470.0056
HTC-240-602785083484490.00350.0056
HTC-240-902875284980.0061
HTC-240-1203215405040.0062
HTC-260-603125204810.0057
HTC-280-603235424870.0059
HTC-300-603555424990.0068
Note: Ti, starting combustion temperature; Tf, burndown temperature; TM1, the temperature corresponding to the peak of the first combustion conversion rate peak; TM2, the temperature corresponding to the peak of the second combustion conversion rate peak; RM1, the peak of the first combustion conversion rate peak; RM2, the peak of the second combustion conversion rate peak.
Table 4. Alkali metal analysis of WW and hydrochar.
SampleK, wt.%Ca, wt.%Mg, wt.%
WW0.1711.0990.058
HTC-240-600.0420.9680.036
DE88.0957.4570.18
Table 5. Ash composition of WW and hydrochar, wt.%.
SampleCaOK2OMgOSiO2P2O5SO3Al2O3Fe2O3Na2O
WW77.6010.404.831.931.441.410.470.410.29
HTC-240-6073.572.763.215.705.522.531.593.780.56
Bituminous coal24.480.371.5332.0813.0414.818.673.04
Disclaimer/Publisher’s Note: The statements, opinions and data contained in all publications are solely those of the individual author(s) and contributor(s) and not of MDPI and/or the editor(s). MDPI and/or the editor(s) disclaim responsibility for any injury to people or property resulting from any ideas, methods, instructions or products referred to in the content.

