Article

A Model Predictive Control Based Optimal Task Allocation among Multiple Energy Storage Systems for Secondary Frequency Regulation Service Provision

1
School of Electric Power, Civil Engineering and Architecture, Shanxi University, Taiyuan 030031, China
2
Guodian Nanjing Automation Co., Ltd., Nanjing 210032, China
3
School of Electrical Engineering, Zhejiang University, Hangzhou 310027, China
*
Author to whom correspondence should be addressed.
Energies 2023, 16(3), 1228; https://doi.org/10.3390/en16031228
Submission received: 9 September 2022 / Revised: 5 October 2022 / Accepted: 10 October 2022 / Published: 23 January 2023
(This article belongs to the Special Issue Power System Dynamics and Renewable Energy Integration)

Abstract

:
Power system stability has been suffering increasing threats with the ever-growing penetration of intermittent renewable generation such as wind power and solar power. Battery energy storage systems (BESSs) could mitigate frequency fluctuation of the power system because of their accurate regulation capability and rapid response. By dividing the Area Control Error (ACE) signal and the State of Charge (SOC) of battery energy storage systems into different intervals, the frequency control task of BESSs could be determined by considering the frequency control demand of the power grid in each interval and SOC self-recovery. The well-developed model predictive control can be employed to attain the optimal control variable sequence of BESSs in the following time, which can determine the output depths of BESSs and action timing at different intervals. The simulation platform MATLAB/Simulink is used to build two secondary frequency control scenarios of BESSs for providing frequency regulation service. The feasibility of the presented strategy is demonstrated by simulation results of a sample system.

1. Introduction

Extensive integration of renewable energy sources has become one of the key measures to address global resource shortage and climate change [1]. However, the widely employed renewable energy based generators, such as wind power and solar power, do not have the inertia and damping characteristics of traditional thermal power units. In addition, the intermittent and uncertain generation outputs impose challenges for power system security and stability, and frequency control/regulation is becoming more difficult [2,3]. Traditional frequency control no longer meets the ever-increasing requirement for frequency control. Hence, more efficient frequency control is highly demanding.
In recent years, electrochemical energy storage technology has developed rapidly, with material and production costs greatly reduced. Battery energy storage technology has been widely applied in power grid frequency control. The Battery Energy Storage System (BESS) has the advantages of large capacity, fast response, and bidirectional regulation; therefore, it has good prospects in power grid frequency control [4,5]. Energy storage-assisted thermal power unit frequency control is more suitable for the current power grid frequency control, considering the capacity and cost of energy storage. For example, Shanxi Jingyu Power Plant added a 9 MW lithium battery energy storage system to assist the frequency control of thermal power units [6]. This BESS improved the power plant’s frequency quality and frequency control income. The Beijing Shijingshan Thermal Power Plant implemented a 2 WM demonstration project, which uses a BESS to improve frequency control performance in the context of high renewable energy integration [7]. The successful operation of the above projects demonstrate the feasibility of BESSs in secondary frequency regulation provision.
Much research work has been done on the employment of BESSs in providing secondary frequency control/regulation. In reference [8], frequency control signals were allocated according to the rated power of the BESS, without considering the SOC state of the battery, and it was easy to reach the capacity limit of the battery. Some recent literature considers the state of SOC, such as reference [9]: the coefficients of virtual droop control and virtual inertia control are adaptively controlled and the output power of the BESS is controlled according to SOC state so as to improve the economy of the whole unit operation. The authors in [10,11] discussed the energy storage battery’s smooth output according to SOC state based on the fuzzy control theory, effectively reducing the system’s demand for energy storage capacity. In order to avoid the phenomenon of over-limit in the actual working process of the energy storage system, the control strategy of switching state between charging, discharging mode, and Frequency regulation mode for battery energy storage was proposed in [12]. The literature [13] has proposed using the logistic regression function to construct the control law of energy storage adaptive frequency control and self-recovery state of charge, ensuring good SOC while adjusting the frequency. In [14], based on the Area Control Error (ACE) signal mode, the ACE high-frequency signal obtained through the low-pass filter is allocated to the BESS, reducing its frequency control pressure.
Most of the above studies focus on the coordination strategy between the power grid frequency control demand and SOC self-recovery without considering the loss caused by frequent unit operations. They also failed to acknowledge that BESS can accurately respond to high-frequency signals. For example, in [14], high-frequency components were allocated to energy storage, which reduced the operation times of the unit to a certain extent but could not change the magnitude of high-frequency components borne by the BESS in real time according to the SOC. Moreover, most of these strategies followed the traditional PI control method, which cannot achieve satisfactory frequency control effects in the current complex frequency control scene.
Considering the above problems, we propose a control strategy based on the Model Predictive Control (MPC) for energy storage systems to help thermal power units participate in secondary frequency control, which studies and formulates the output and self-recovery strategies of the energy storage battery. In this strategy, Empirical Mode Decomposition (EMD) partitions the frequency control signal ACE into high- and low-frequency components. According to the different output characteristics of the thermal power unit and the BESS, the high-frequency components are assigned to the BESS, and the unit bears the low-frequency components. In each ACE interval, the SOC recovery demands of the BESS and power grid frequency control are considered to dynamically change the high-frequency component size of the energy storage system and determine the optimal model predictive control output weighting matrix, the output target, and output depth of the traditional unit and energy storage system. The simulation results showed that our proposed method maintains good SOC, improves frequency control performance, and reduces unit wear.

2. Dynamic Model of Secondary Frequency Control with Energy Storage

2.1. Frequency Control Model of Two Area Interconnection Systems

We studied the frequency control dynamic model for two interconnected areas and established a power grid equivalent model for two interconnected area systems with BESS. The AGC control mode is set to Tie-Line Bias Control Mode. Figure 1 shows the energy storage system configured for area 2.
In Figure 1, G g i ( s ) is the simplified model of the generator set comprising the governor model G gov ( s ) and reheat turbine model G T ( s ) in series, and i = 1, 2 represents the two regions. Δ P L i , Δ P t i , Δ P r i , Δ X g i , Δ P t i e , and Δ f i are the load disturbance, turbine output power increment, reheater output power increment, governor position increment, tie-line power deviation, and frequency deviation, respectively. β i and R i are the power system deviation coefficient and unit adjustment coefficient, respectively. M i and D i are the regional inertia coefficient and regional damping coefficient, respectively. T 12 is the synchronization coefficient of the tie line; A c e i is the regional control deviation; C n is the rated capacity of energy storage; S oc 0 and S o c represent the initial SOC and real-time SOC for BESSs.
The transfer function of the governor model for traditional thermal power units:
G gov ( s ) = 1 1 + s T g
where T g represents the governor model’s time constant for the thermal power unit.
The transfer function of the conventional reheat turbine model:
G T ( s ) = 1 + s F HP T RH ( 1 + s T CH ) ( 1 + s T RH )
where F HP , T RH , and T CH are the reheater gain, reheater time constant, and turbine time constant, respectively.
The transfer function of the traditional thermal power unit model is:
G g i ( s ) = G gov ( s ) G T ( s )
ACE can be attained by
A c e 1 = Δ P 12 + β 1 Δ f 1 A c e 2 = Δ P 21 + β 2 Δ f 2
where A c e 1 and A c e 2 are respectively the ACE signals of area 1 and area 2.

2.2. Equivalent Model of Battery Energy Storage Systems in Power Grid Frequency Control

Electrochemical energy storage usually comprises a battery body and a corresponding energy conversion system. The general model for electrochemical energy storage is greatly simplified compared to the entity [15]. The energy conversion system determines the main output characteristics of the BESS. The first-order inertia link usually replaces the delay characteristics of the energy storage system, and the battery gain replaces the relationship between power and frequency change. The product model of the first-order inertia link and the battery gain is used as the equivalent model for the BESS. This method is widely used in current research on BESSs participating in power grid frequency control. The author of [16] verifies that this model can be applied to frequency control research under appropriate circumstances.
The equivalent transfer function model of BESSs:
G b ( s ) = K B 1 + s T b
where T b and K B are the time constant and battery gain of the BESS, respectively.
The SOC of BESS cannot be measured directly; therefore, it is difficult to determine high-precision monitoring. Currently, there are two indirect methods to monitor the SOC of a BESS. The first method is to measure the terminal voltage of the battery and then transfer the voltage to the SOC. The second method directly integrates the BESS output and obtains the SOC. We adopted the second method to measure the SOC of BESS.

3. Dynamic Model of Secondary Frequency Control with Energy Storage

3.1. Model Predictive Control

MPC has been used in the control field since the 1990s. Compared to the traditional PI controller, the MPC controller has superior performance and satisfies all operational constraints by minimizing the value of the objective function to determine the control variables [17]. Different operation objectives can be achieved by setting the appropriate weight factor value in the MPC controller’s objective function. The MPC algorithm includes three parts: system prediction model, rolling optimization, and feedback correction, which have obvious advantages in dealing with constraints.

3.2. Application of MPC in Secondary Frequency Control

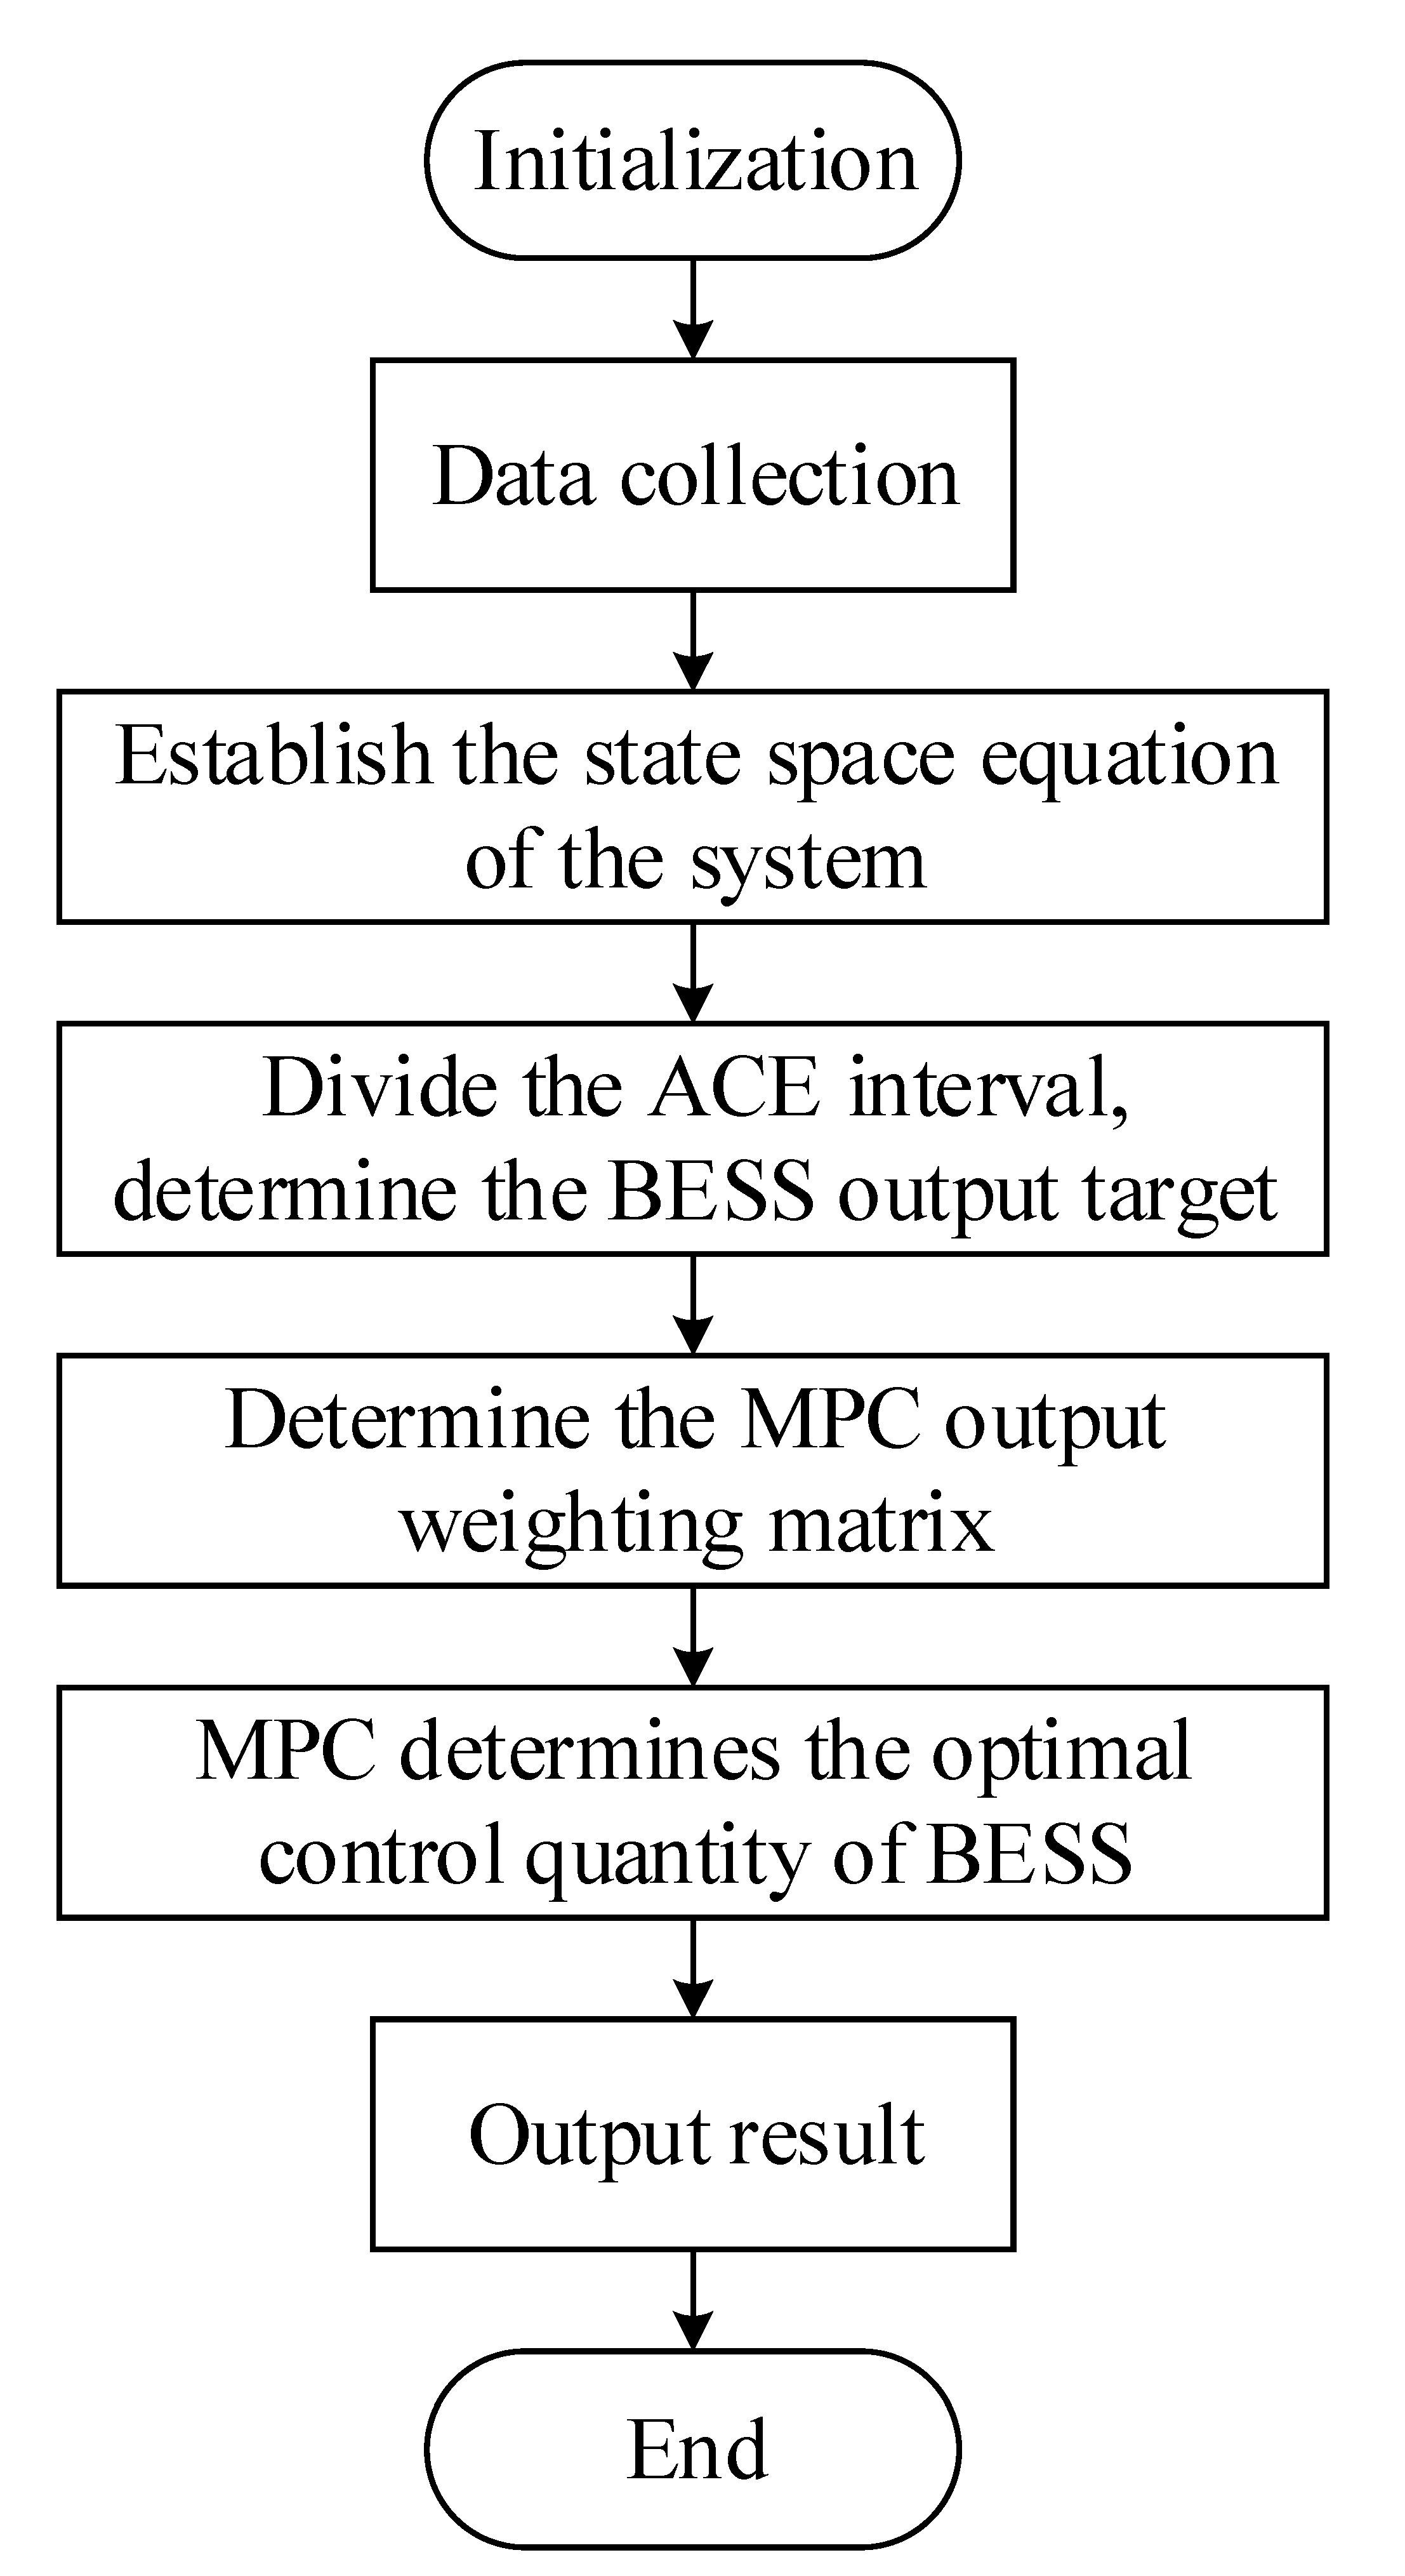
Firstly, we need to collect model data of AGC system in grid, model data of the BESS and load disturbance data before we use MPC. Secondly the state space expression of the system is established according to the model data of the BESS and load disturbance data. Finally, the optimal control variables of BESS are obtained through the prediction model, rolling optimization, and feedback correction, which can balance the SOC recovery demand of BESS and the demand of frequency control to grid.

3.2.1. System Prediction Model

The prediction model predicts the system’s future state according to historical information on the system’s state parameters and control variables, which determine the future control input information. Therefore, a model describing the system’s dynamic behavior is needed as a prediction model. This model has no strict requirements on the system’s expression form as long as the model can predict the system’s future state value according to the input information.
The state equation of the two-area power frequency control system with energy storage is:
X · = A X + B U + R W Y = C X
where X , U , W , and Y represent the state variable, input variable, disturbance quantity, and output variable, respectively. A , B , R , and C represent corresponding matrices determined by the parameters of the system and controller. The specific elements are as follows:
X = R e g 1 Δ P t i e R e g 2 P b S o c T
where R e g 1 is the state variable of the regional generator set in area i , which is expressed as follows:
R e g 1 = Δ f i Δ P t i Δ P r i Δ X g i Δ P c i T i = 1 , 2
U = u b
W = Δ P L 1 Δ P L 2 T
Y = A c e i Δ f i S o c T
Equation (5) uses T s as the sampling period for discretization, and the system’s discrete state-space model is obtained, as shown in Equation (7):
X ( k + 1 ) = A ¯ X ( k ) + B ¯ U ( k ) + R ¯ W ( k ) Y ( k ) = C X ( k )
where A ¯ = e A T s , B ¯ = 0 T s e A t B d t , R ¯ = 0 T s e A t R d t .

3.2.2. Rolling Optimization

Rolling optimization determines future control effects through the optimum of a certain performance index. According to the discrete state space model (7), the frequency deviation of the system, ACE signal, and SOC change of the BESS starting from time K can be predicted, and a quadratic performance index function satisfying certain constraints can be constructed, which is expressed as:
min J k = j = 1 p Y k + j | k Y r k + j T Q Y k + j | k Y r k + j + i = 1 m U T k + i 1 | k R U k + i 1 | k
s . t . U min U k U max
Y min Y k Y max
In Equation (8), Q and R are the output weighting matrix and control weighting matrix of the model predictive control, respectively; Y k + j | k represents the output state at time k + j predicted by the system at time k ; Y r k + j represents the output reference value of the system at k + j time in the future, where j 1 , p , p is the prediction time domain. In this system, the frequency deviation and ACE signal’s reference values are set to 0, and the SOC reference value of the BESS is 0.5. U k + i 1 | k is the prediction of system control variables at time k at time k + i 1 in the future, where i 1 , m . m is the control time domain. In Equation (9), U min and U max represent the lower and upper limits of system control variables and refer to the power constraint of the BESS. In Equation (10), Y min and Y max represent the lower and upper limits of the system output variables and refer to the SOC constraints of the BESS.
The future optimal control sequence U k + i 1 starting from time k is obtained by calculating the optimal value of the objective function at the specified time. The first control variable U k in the obtained control sequence is applied to the BESS. The process above is repeated at the next sampling time. The optimization problem is refreshed and solved after the new measurement value is obtained, and the cycle is repeated for online optimization.

3.2.3. Feedback Correction

The above prediction model and rolling optimization process belong to open-loop control. When the model predictive control is used to predict the future output, the deviation between the predicted value and the actual value is caused by interference factors, so the control fails. To establish closed-loop control, the deviation between the predicted value and the actual value is introduced as feedback in MPC for feedback correction:
Y P k + 1 + j = Y k + 1 + j | k + 1 + h k + 1
where Y P is the predicted value of the output after correction; h is the weighting coefficient matrix.
The idea of applying MPC in frequency control of BESS is as shown in Figure 2.

4. Control Strategy of Battery Energy Storage System

By formulating a reasonable output control strategy for BESSs, the frequency control effect of the system improves, and the SOC maintains a healthy state. The ACE signal’s size is closely related to the output size of the BESS. According to the absolute value of ACE, it can be divided into several control intervals, including dead zone ( 0 A C E ce , d ) , normal state zone ( A C E ce , d A C E ce , n ) , sub-emergency state zone ( A C E ce , n A C E ce , e ) , and emergency state zone (> A C E ce , e ). Combined with the capacity limit and SOC of the battery, the output and self-recovery strategies of the BESS can be determined based on meeting the demands of frequency control while using the coordinated operation of thermal power units and BESSs.

4.1. Output Strategy of Battery Energy Storage System

4.1.1. Dead Zone

When the ACE signal is in the dead zone, the load disturbance to the system is minor, and the thermal power unit and BESS do not temporarily participate in the secondary frequency control. Moreover, in this case, we can induce the energy storage battery self-recovery condition. Keeping the SOC within the normal operating range provides more frequency control capacity in subsequent frequency control phases. In this state, the output weighting matrix of MPC is set to:
Q = d i a g ( 0 , 0 , 1 )

4.1.2. Normal State Zone

The power grid is slightly disturbed when the ACE signal is in the normal state area and the system frequency control demand is minor. The battery energy storage system has sufficient capacity and can independently undertake the system frequency control demand. In this state, the advantages of fast response speed and accurate output of the BESS are exploited, and the priority output target of the BESS is set to eliminate frequency deviation. At the same time, when the SOC of the BESS is poor, the self-recovery action of energy storage begins under the power grid constraints. In this state, the output weighting matrix of MPC is set to:
Q = d i a g ( 1 , 1 , 0.2 )
If the battery SOC enters the emergency recovery interval, it begins self-recovery, and the traditional unit undertakes the frequency control task.

4.1.3. Sub-Emergency State Zone

The grid system is greatly disturbed when the ACE signal reaches the sub-emergency state range. At this time, the frequency control demand on the system is significant, and the frequency control capacity of the BESS is relatively small and cannot undertake all the frequency control tasks alone. Therefore, the ACE signal is divided into high and low frequencies through EMD. The traditional unit assumes the ACE signal’s low-frequency part, and the BESS assumes the ACE signal’s high-frequency part. In addition, the recovery of the SOC of the BESS can be stopped in this state area to be in the safe operating range. In this state, the output weighting matrix of MPC is set as:
Q = d i a g ( 1 , 1 , 0 )

4.1.4. Emergency State Zone

When the ACE signal is in the emergency state interval, the system frequency deviation is too large, and the BESS and the thermal power unit cannot meet the system frequency control demand. In this state, the BESS should be out of operation, and the power grid system should be used to cut the machine and dump the load, maintaining the safe and stable operation of the whole system and avoiding the rapid deterioration of the power grid frequency.

4.2. Self-Recovery Strategy of Battery Energy Storage System

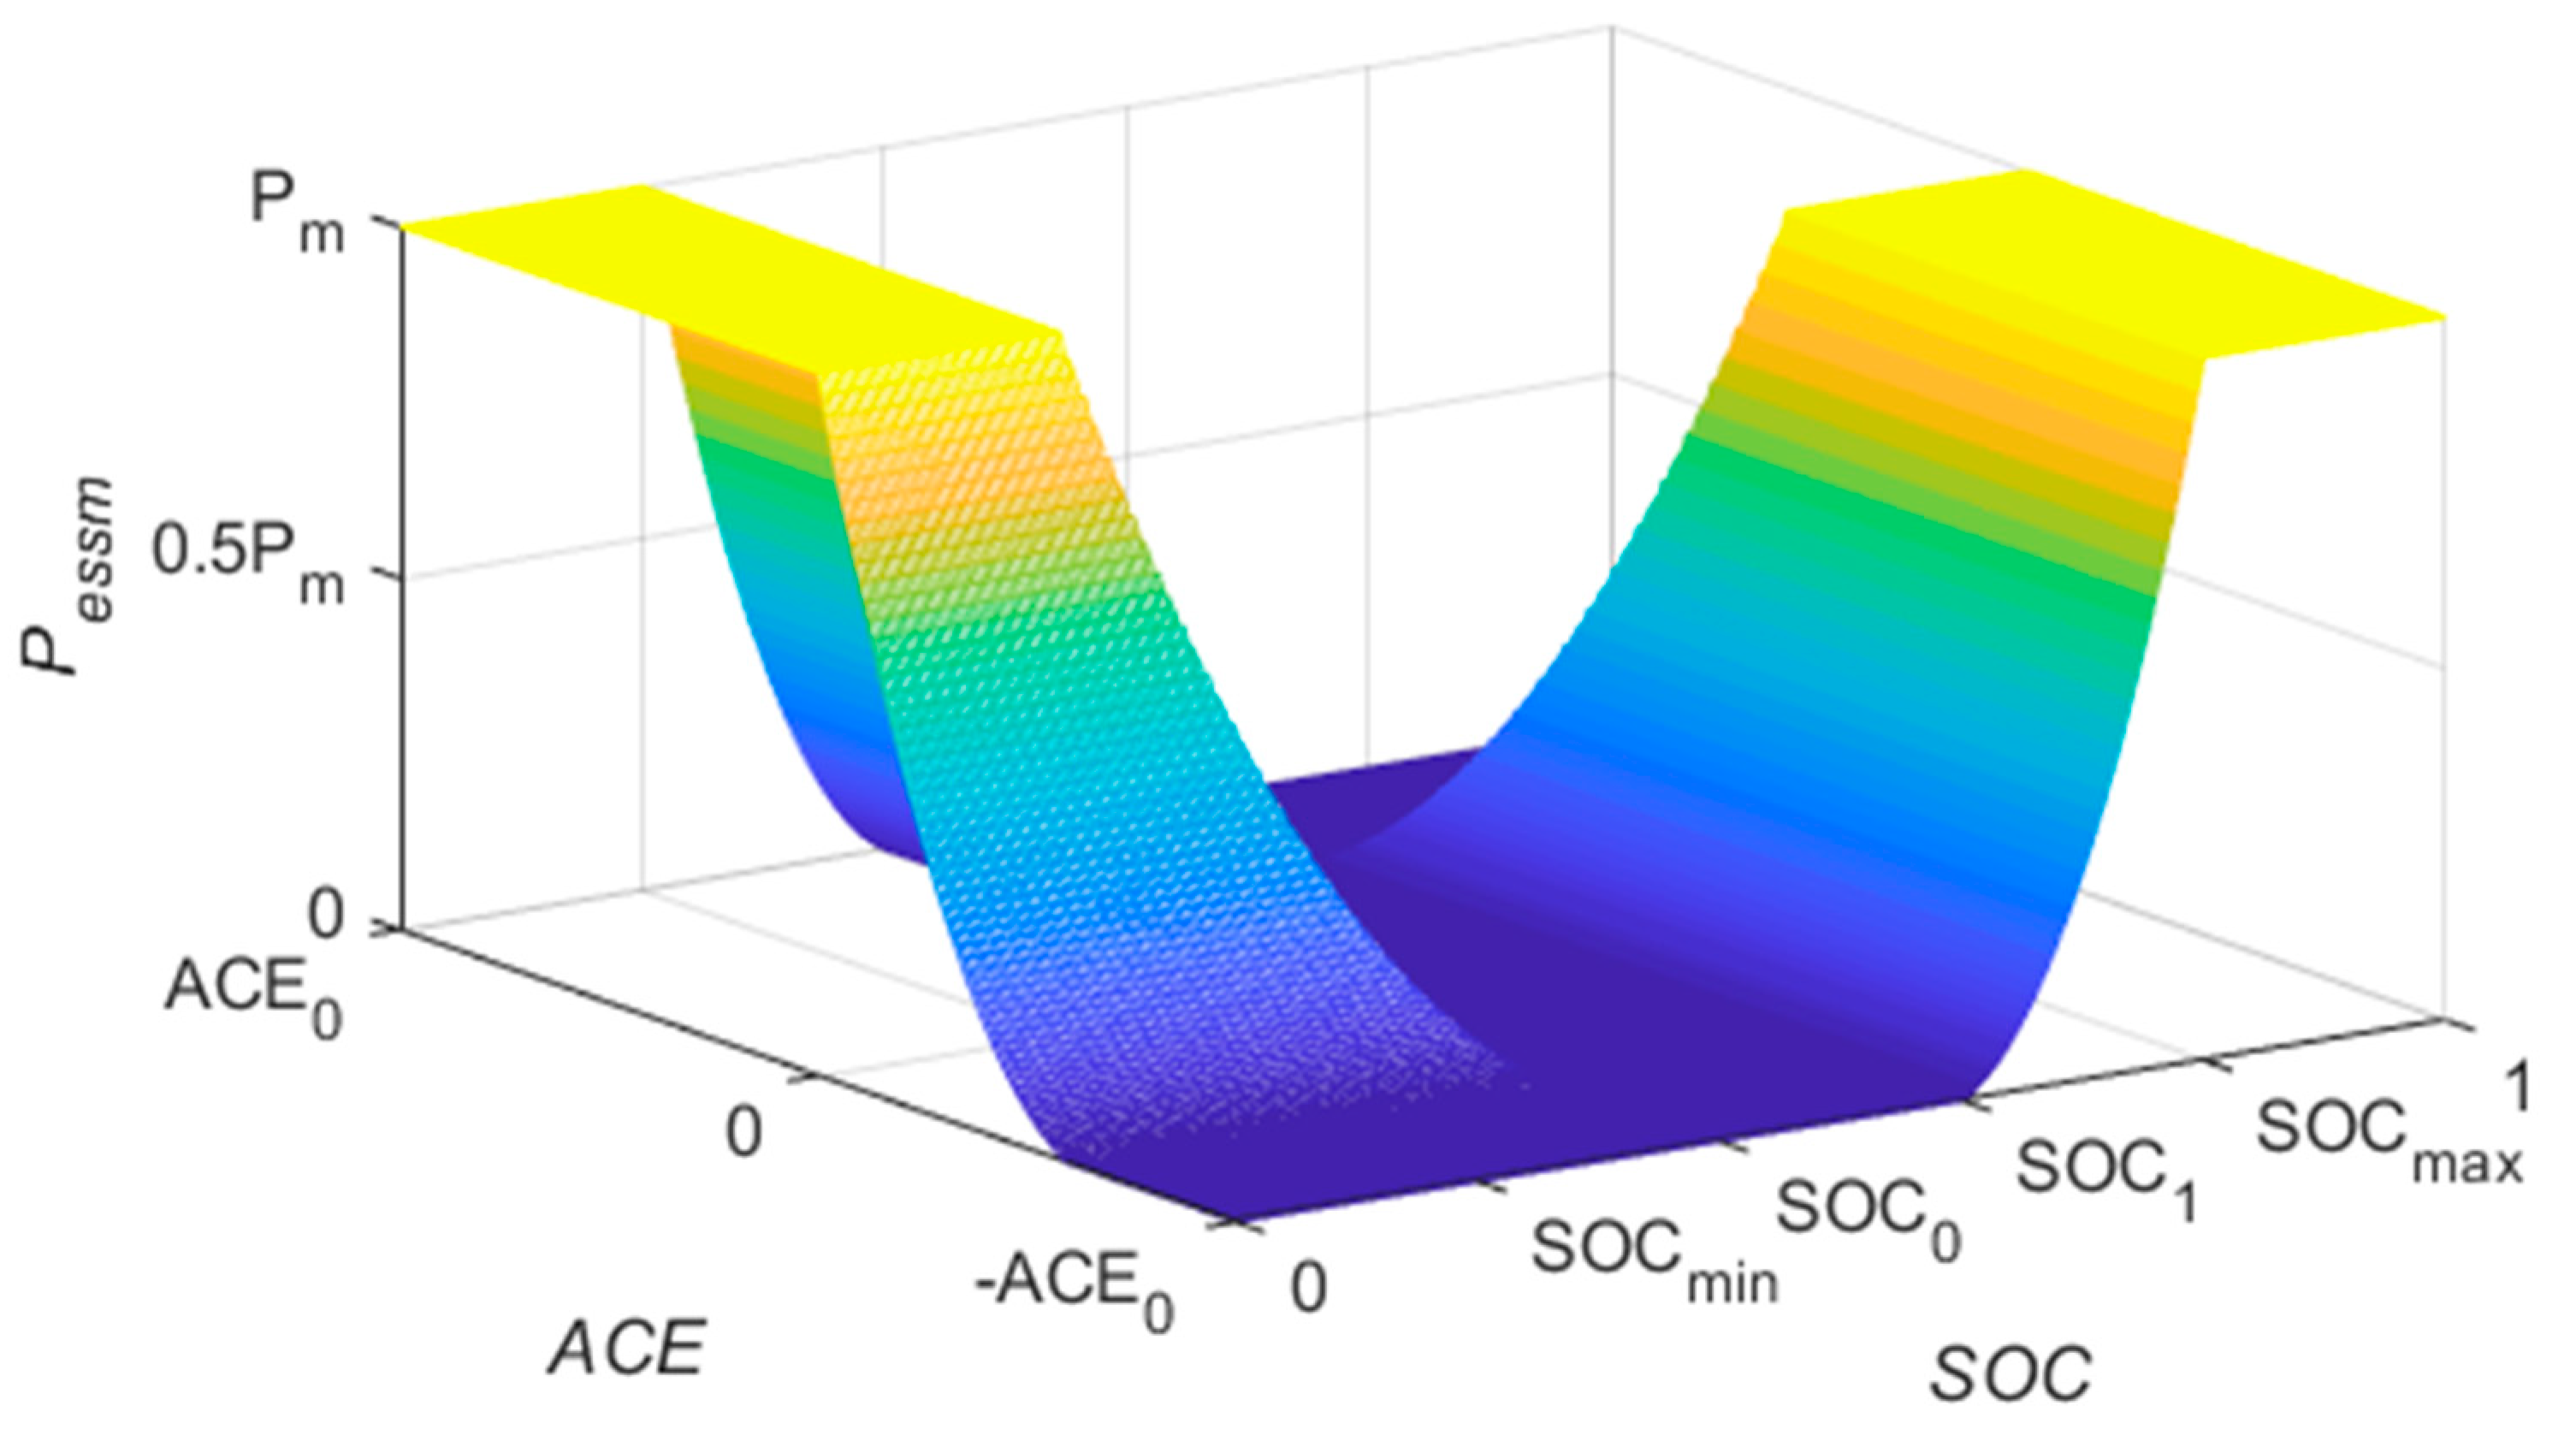
When a BESS absorbs or releases only electrical energy for a long time, its SOC deteriorates gradually. Therefore, if the system is in the normal frequency control area, the BESS self-recovery strategy can use the residual capacity of the traditional unit’s frequency control. Under the premise that the self-recovery operation of energy storage will not cause the system frequency deviation to exceed the normal regulation area, the BESS can properly reverse the output and improve the SOC. Therefore, the BESS can be fully powered in the sub-emergency regulation area. The self-recovery output limit of energy storage is shown in Figure 3.
The self-recovery power demand of energy storage and constraint curve of the power grid’s frequency control system in Figure 3 obtain the control law of self-recovery action for the BESS, as shown in Equations (15) and (16).
P c 1 = P m   S O C S O C min P m 20 x 2 17 x + 3.6 S O C min < S O C S O C 0 0 S O C S O C 0 P d 1 = 0 S O C S O C 1 P m 20 x 2 23 x + 6.6 S O C 1 < S O C S O C max P m S O C > S O C max
P c 2 = 0 A C E 0.7 A C E 0 P m 2.22 y 2 + 3 y + 1 0.7 A C E 0 < A C E 0 P m A C E > 0 P d 2 = P m A C E 0 P m 2.22 y 2 3 y + 1 0 < A C E 0.7 A C E 0 0 A C E > 0.7 A C E 0
where P c 1 , P d 1 are both (15) the self-recovery power of energy storage; P c 2 , P d 2 are both (16) the battery self-recovery output limit in the normal adjustment interval of ACE; P m is the rated power of energy storage; A C E 0 is the normal adjustment range.
Equation (15) determines the self-recovery demand power of the BESS according to SOC. Equation (16) limits the self-recovery power of the BESS according to the power grid’s ACE state. Considering the limitations of Equations (15) and (16), the minimum values of the two are selected as the actual self-recovery power of the BESS in every moment, the details are shown in Equation (17).
P e s s = min P c 1 , P c 2 , S O C < S O C 0 min P d 1 , P d 2 , S O C > S O C 1
where P e s s is the actual self-recovery power of BESS; P c 1 , P d 1 are both determined by Equation (15), and P c 2 , P d 2 are both determined by Equation (16).
According to Equation (17), the self-recovery diagram of energy storage can be obtained, as shown in Figure 4.
In Figure 4, when S O C 0 < S O C < S O C 1 , the SOC state is better and does not require self-recovery. When S O C 0 > S O C > S O C min or S O C 1 < S O C < S O C max , the SOC state is poor and needs self-recovery. The self-recovery power is determined by considering SOC and ACE signals comprehensively. When S O C < S O C min or S O C > S O C max , the SOC state is worst and stay in a state of emergency. BESS will stop participating in frequency control to enter in self-recover at the maximum power.
By designing the self-recovery strategy of SOC, the BESS and the power grid system can sense each other’s state in real-time. When the SOC deteriorates and the power grid is in the normal frequency control area, the energy storage self-recovery action can be conducted in real-time. The self-recovery power can be changed according to the ACE size and SOC so that the SOC of the BESS can maintain its optimal state, providing enough frequency control capacity for the later frequency control task.

4.3. Decomposition of ACE Signal

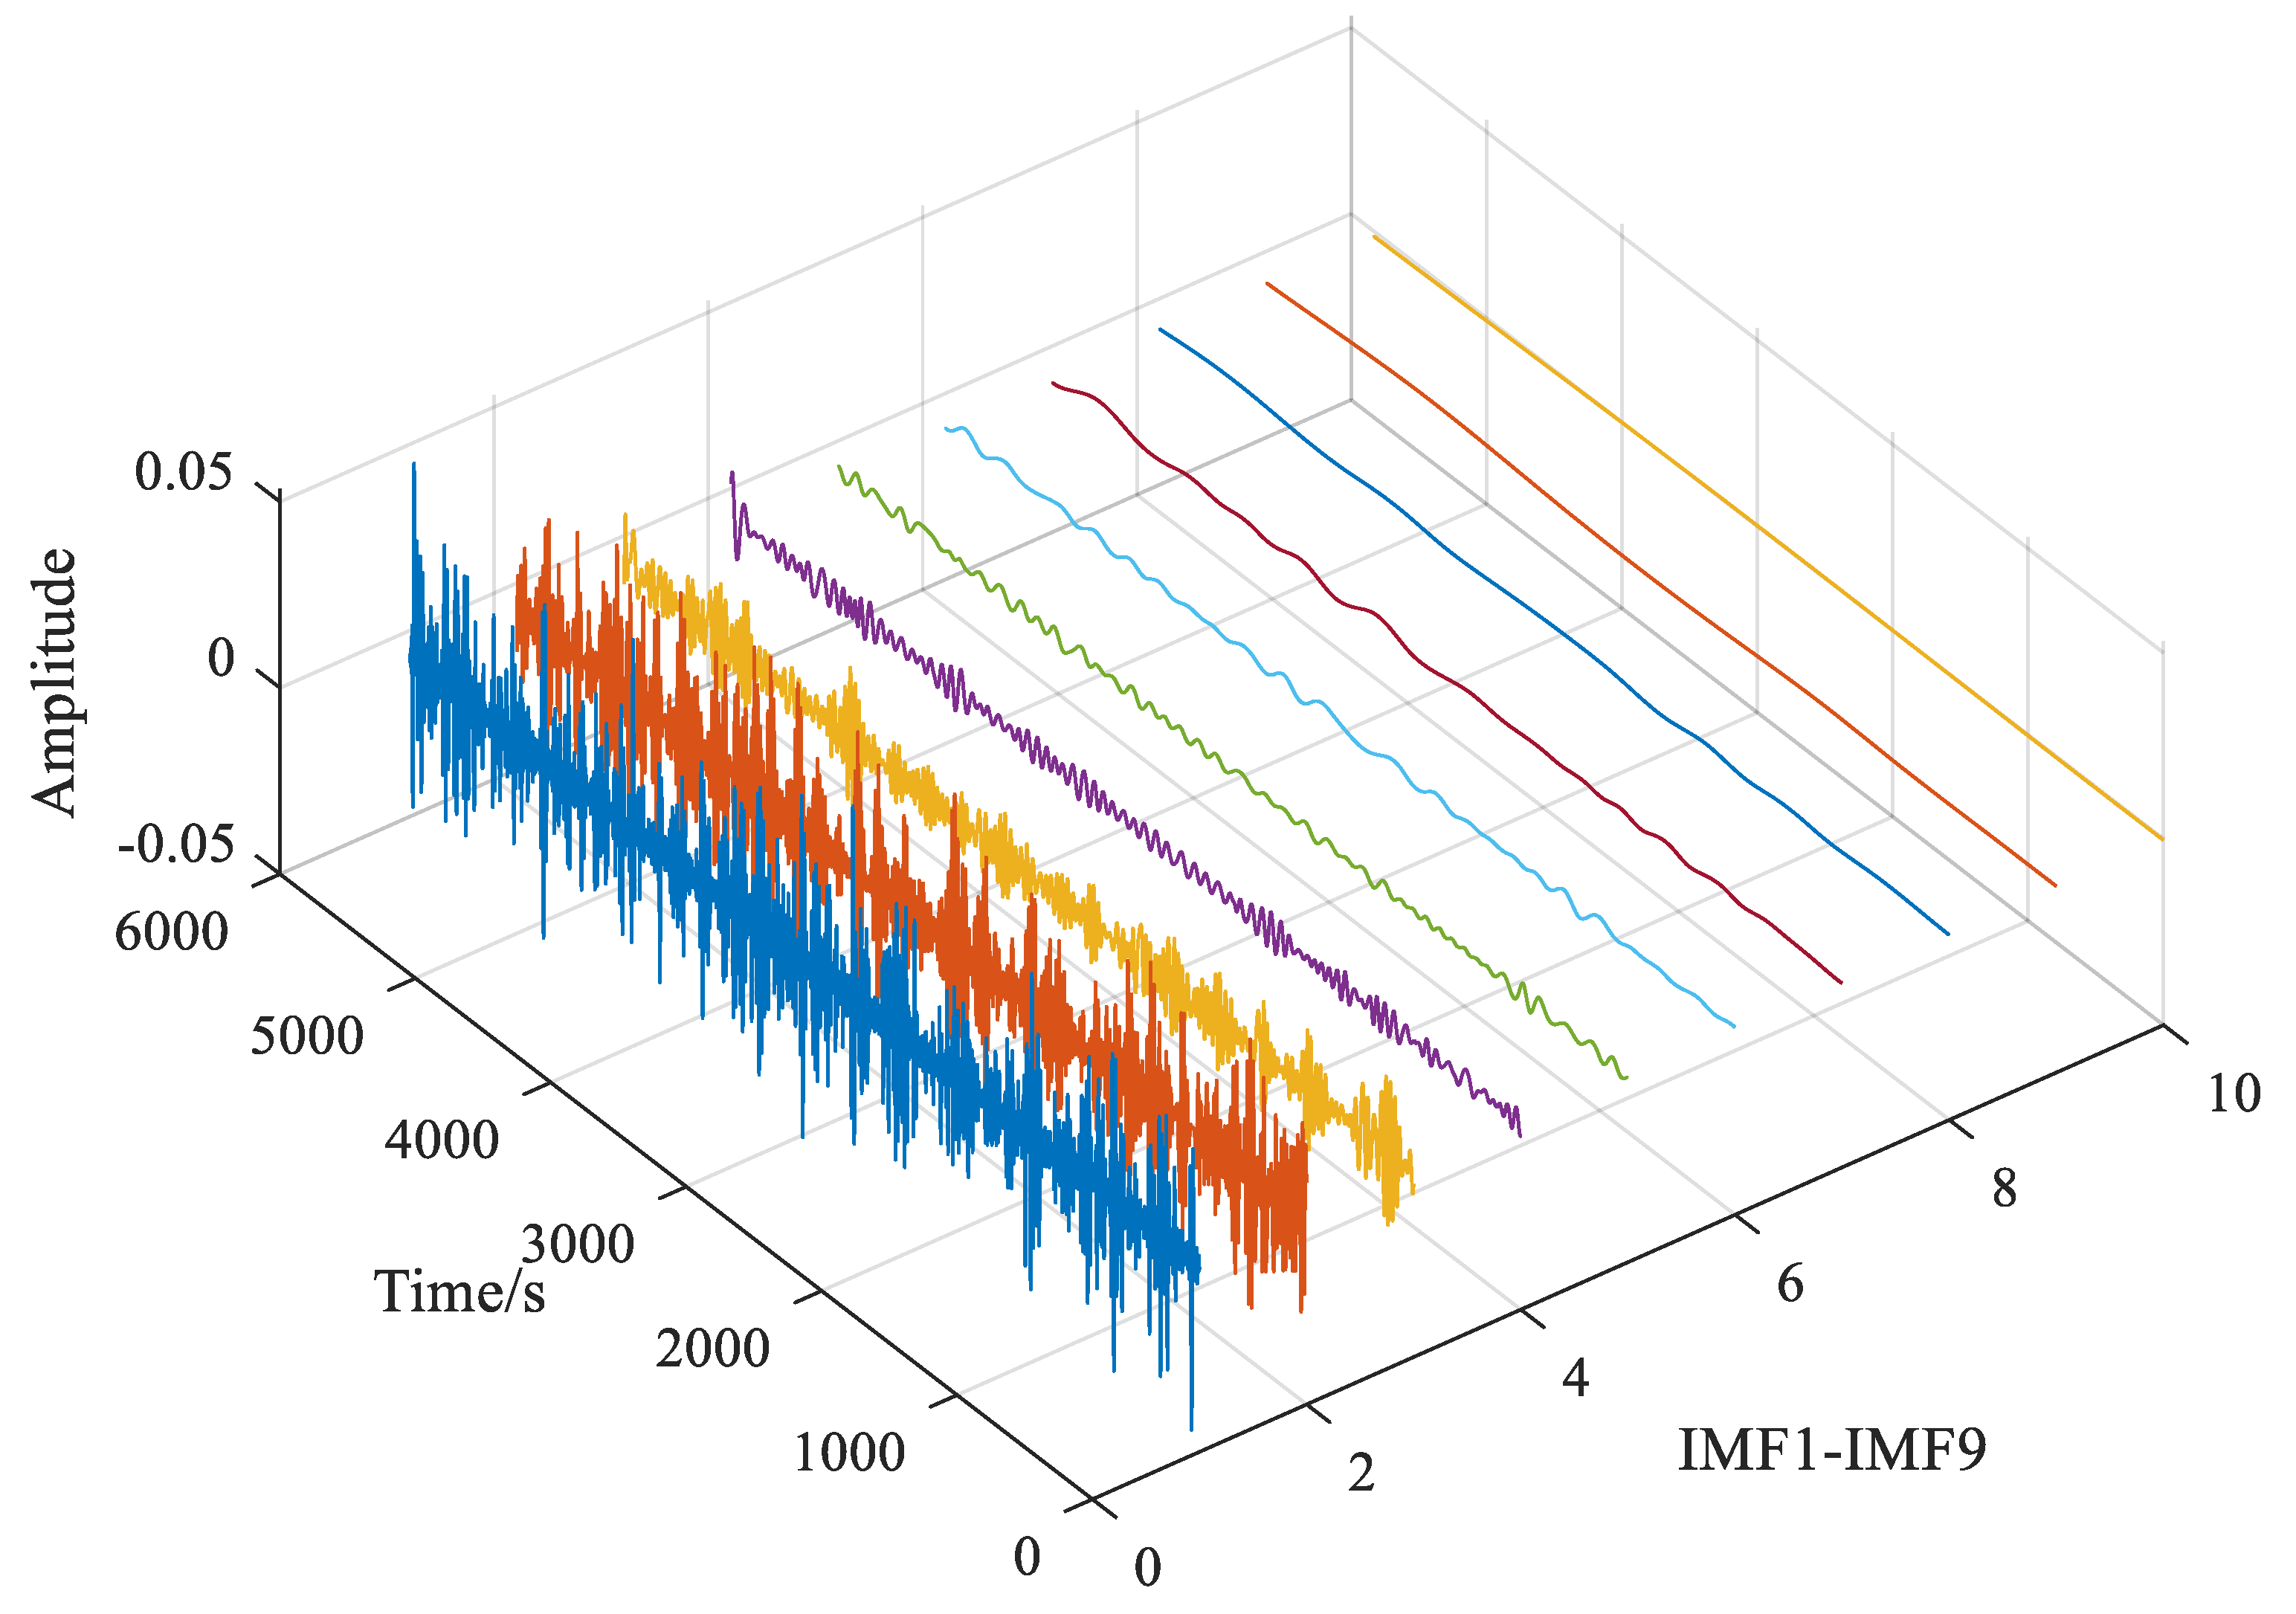
In the sub-emergency adjustment interval of ACE, high and low frequencies should be divided. The EMD method is used to decompose the ACE signal in real-time. Thus, the IMF1-IMF9 of each frequency band component can be obtained. The lower order modal component has a higher frequency, whereas the higher-order modal component has a lower frequency, as shown in Figure 5. Therefore, the first K order IMF components are assigned to the BESS, and the traditional unit bears the rest. The SOC and ACE size determines the value of K. When the system’s ACE signal is positive, and the SOC is high (>0.65), or when the ACE signal is negative, and the SOC is low (SOC is <0.35), appropriately reducing the high-frequency component borne by the BESS is conducive to maintaining the SOC and reducing the deterioration speed. Similarly, when the ACE signal is positive, and the SOC is low, or when the ACE signal is negative, and the SOC is high, appropriately increasing the high-frequency component undertaken by the BESS improves the Frequency regulation effect and accelerates the SOC recovery to the normal interval. The value of K is shown in Equations (18) and (19).
When the ACE signal is positive, the value of K is shown in Equation (18):
k = 4 0 S O C < S O C l o w 2 S O C l o w S O C S O C h i g h 1 S O C h i g h < S O C 1
When the ACE signal is negative, the value of K is shown in Equation (19):
k = 1 0 S O C < S O C l o w 2 S O C l o w S O C S O C h i g h 4 S O C h i g h < S O C 1
The ACE signal’s high-frequency component has zero mean and small amplitude characteristics, etc. BESS assumes the ACE signal’s high-frequency part with the advantage of rapid response and helps maintain the stability of internal SOC. It reduces the frequency control pressure of BESS and its frequency control capacity configuration requirements in frequency control power plants. The thermal power unit’s assumption of the ACE signal’s low-frequency component reduces the wear caused by frequent operation of the unit and improves the unit operation’s economy. The integrated control policy flow is shown in Figure 6.

5. The Simulation Verification

5.1. The Simulation Parameters

We adopted the control method of Tie-Line Bias Control for this paper. The frequency response model of two area interconnection systems with energy storage batteries was established by MATLAB/Simulink. Then, we compared the proposed method, the scheme not considering energy storage (Method 1), and the PI control method considering energy storage SOC self-recovery (Method 2) to verify the effectiveness of these strategies. Relevant parameters are shown in Table 1 and Table 2.

5.2. Analysis of Simulation Results

The evaluation index of the secondary frequency control is defined as follows: Δ f m , Δ f rms is the maximum value and root mean square value of frequency deviation, Δ P t i e _ m , Δ P t i e _ rms is the maximum value and root mean square value of the tie-line power deviation; A C E m and A C E rms are the maximum value and root mean square value of regional control deviation; W gen and W ess are the amount of electricity contributed by thermal power units and energy storage batteries. S oc _ rms is the root mean square value of SOC.

5.2.1. Scene under Step Load Disturbance

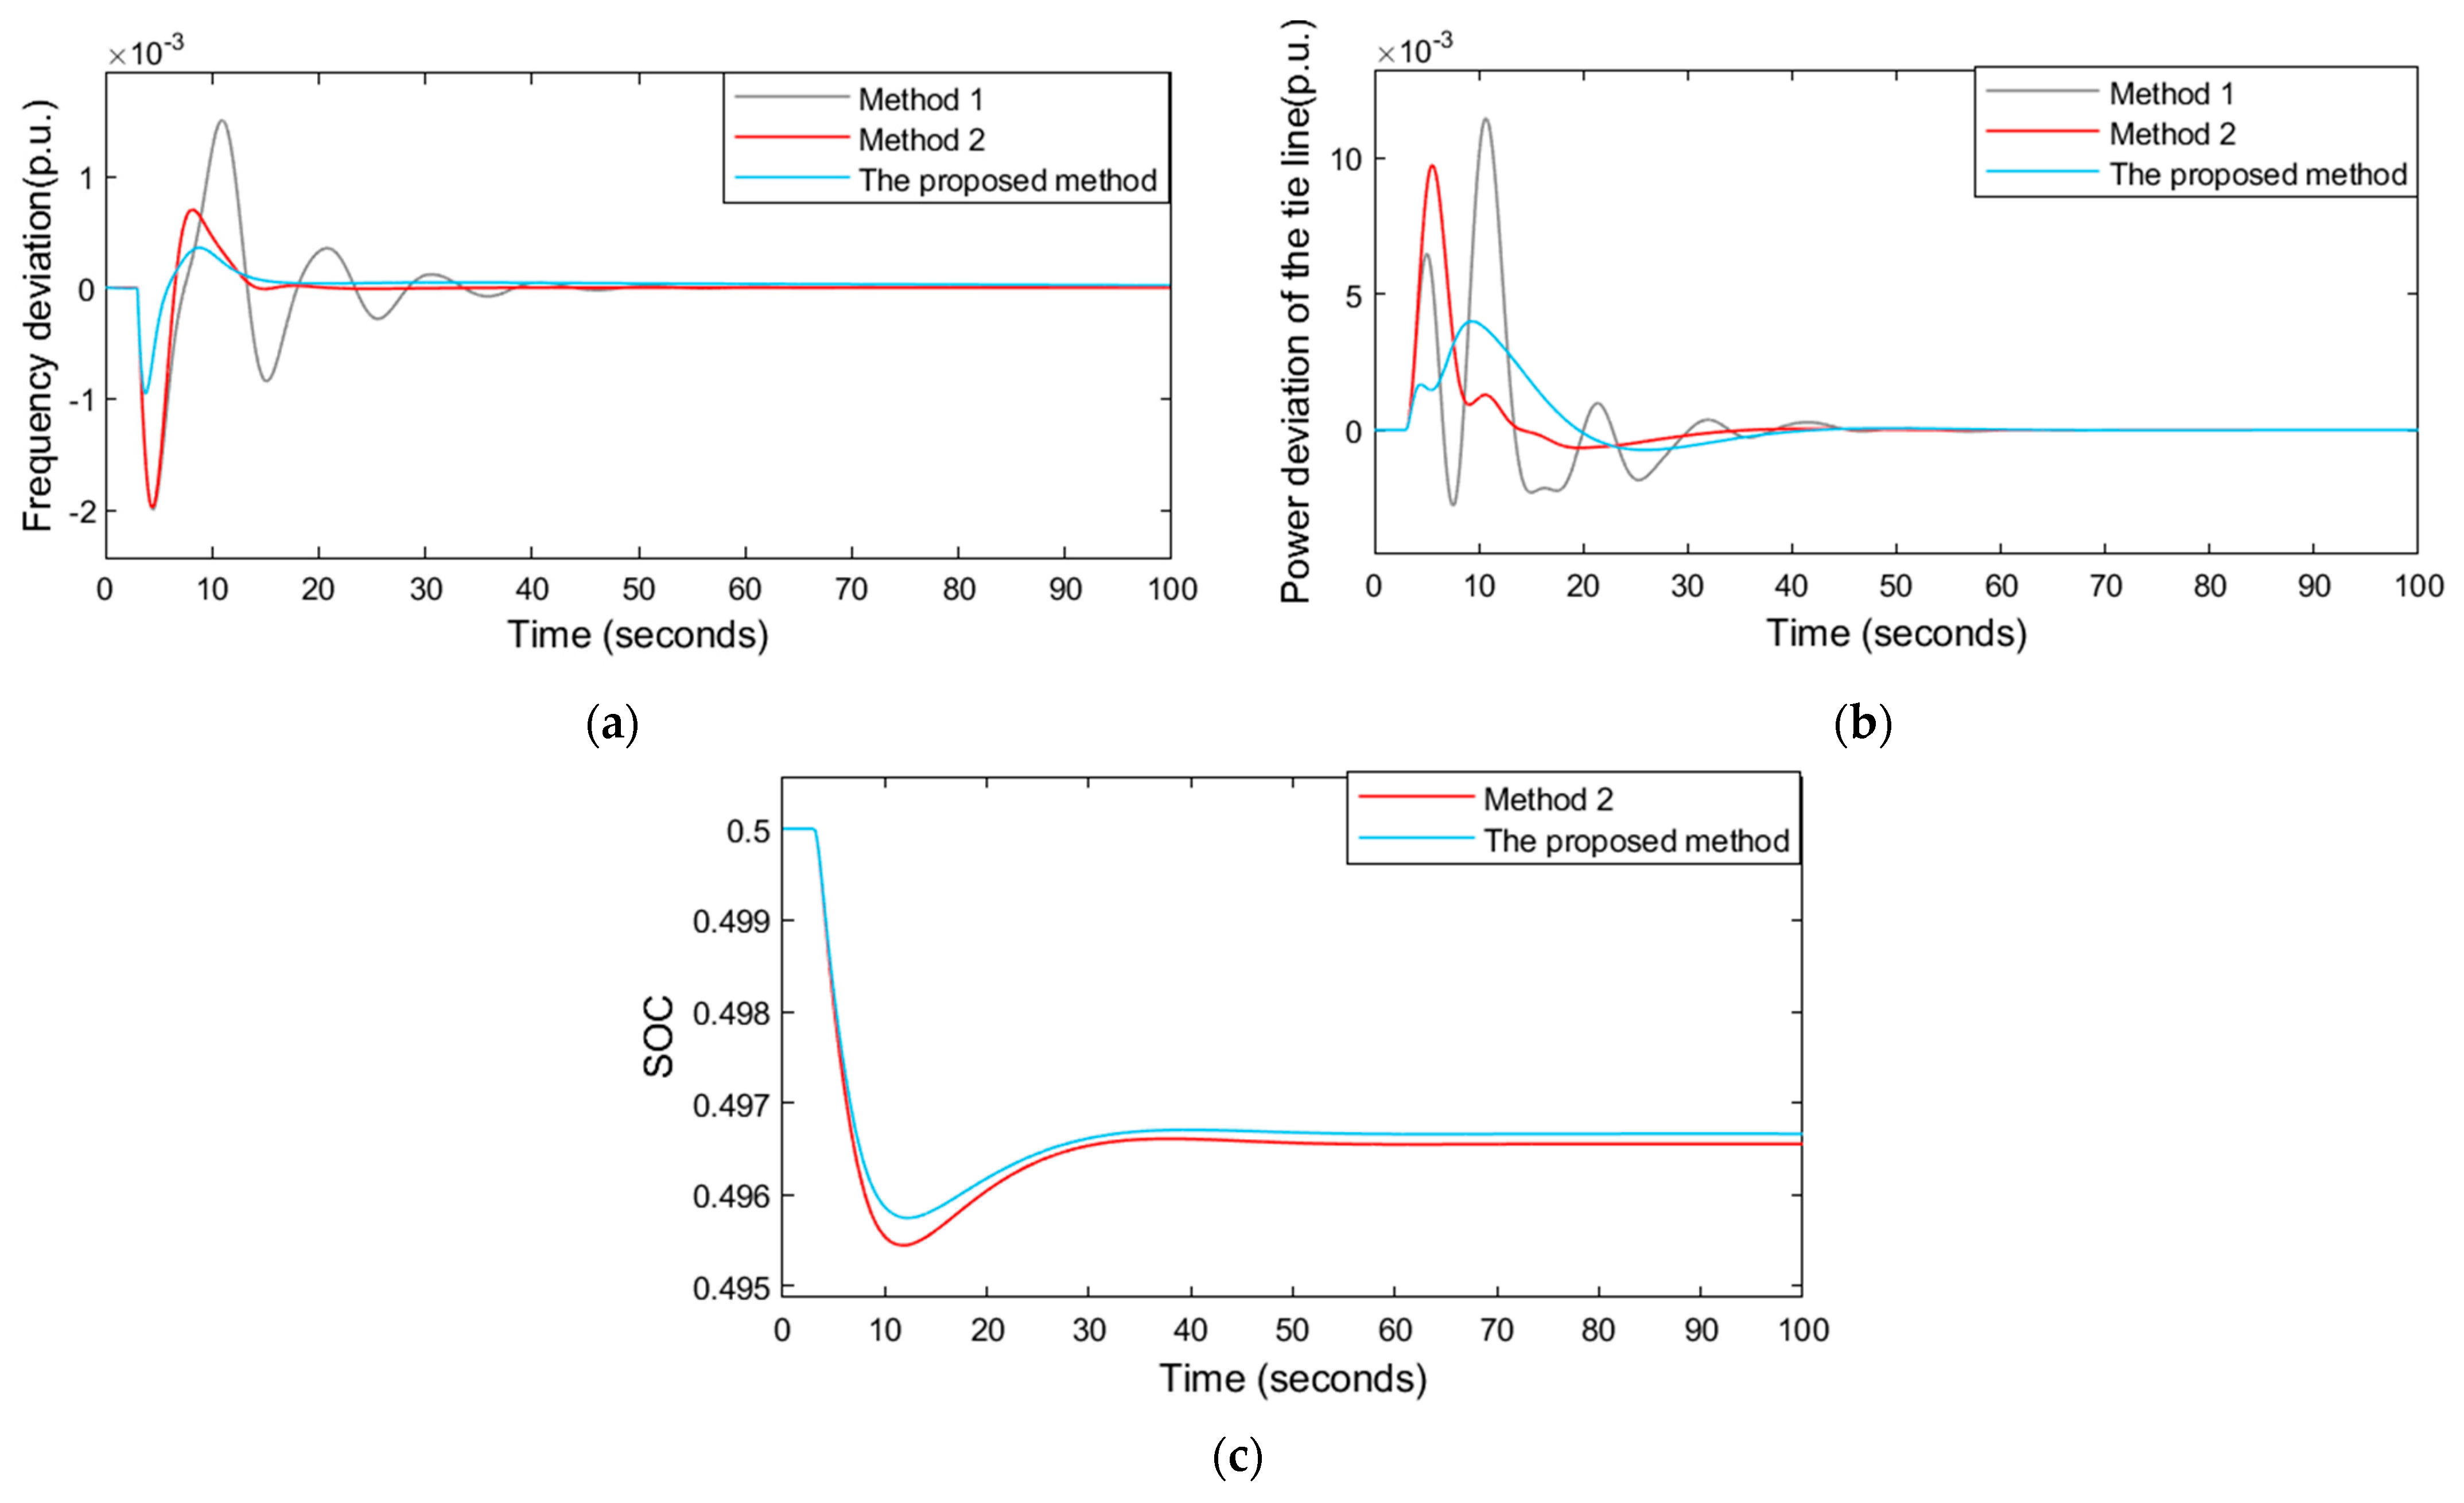
At 0.03 s, a step disturbance of 0.03 pu was applied to area 2. The simulation time was set to 100 s, and the range of the prediction model was 0.1 s. Figure 7 compares the system response curves of the proposed strategy, Method 1, and Method 2 in area 2.
According to the experimental analysis results in Figure 6 and Table 3, we observed that the following.
(1)
In Figure 7a,b, and Table 3, we compare the proposed method with Method 1(without BESS) and Method 2 (PI). From the results, we obtained the maximum values and root mean square values of system frequency deviation, the maximum values and root mean square values of tie-line power deviation, and the adjustment time, all of which decreased with our proposed method and Method 2. The overshoot of the proposed scheme is the smallest, indicating that the dynamic stability is superior to the other two methods.
(2)
The system’s response time is significantly faster in the MPC method than in Method 2, which fully uses the rapid response characteristics of the BESS. Figure 7c shows that SOC has a better maintenance effect.

5.2.2. Scene under Continuous Load Disturbance

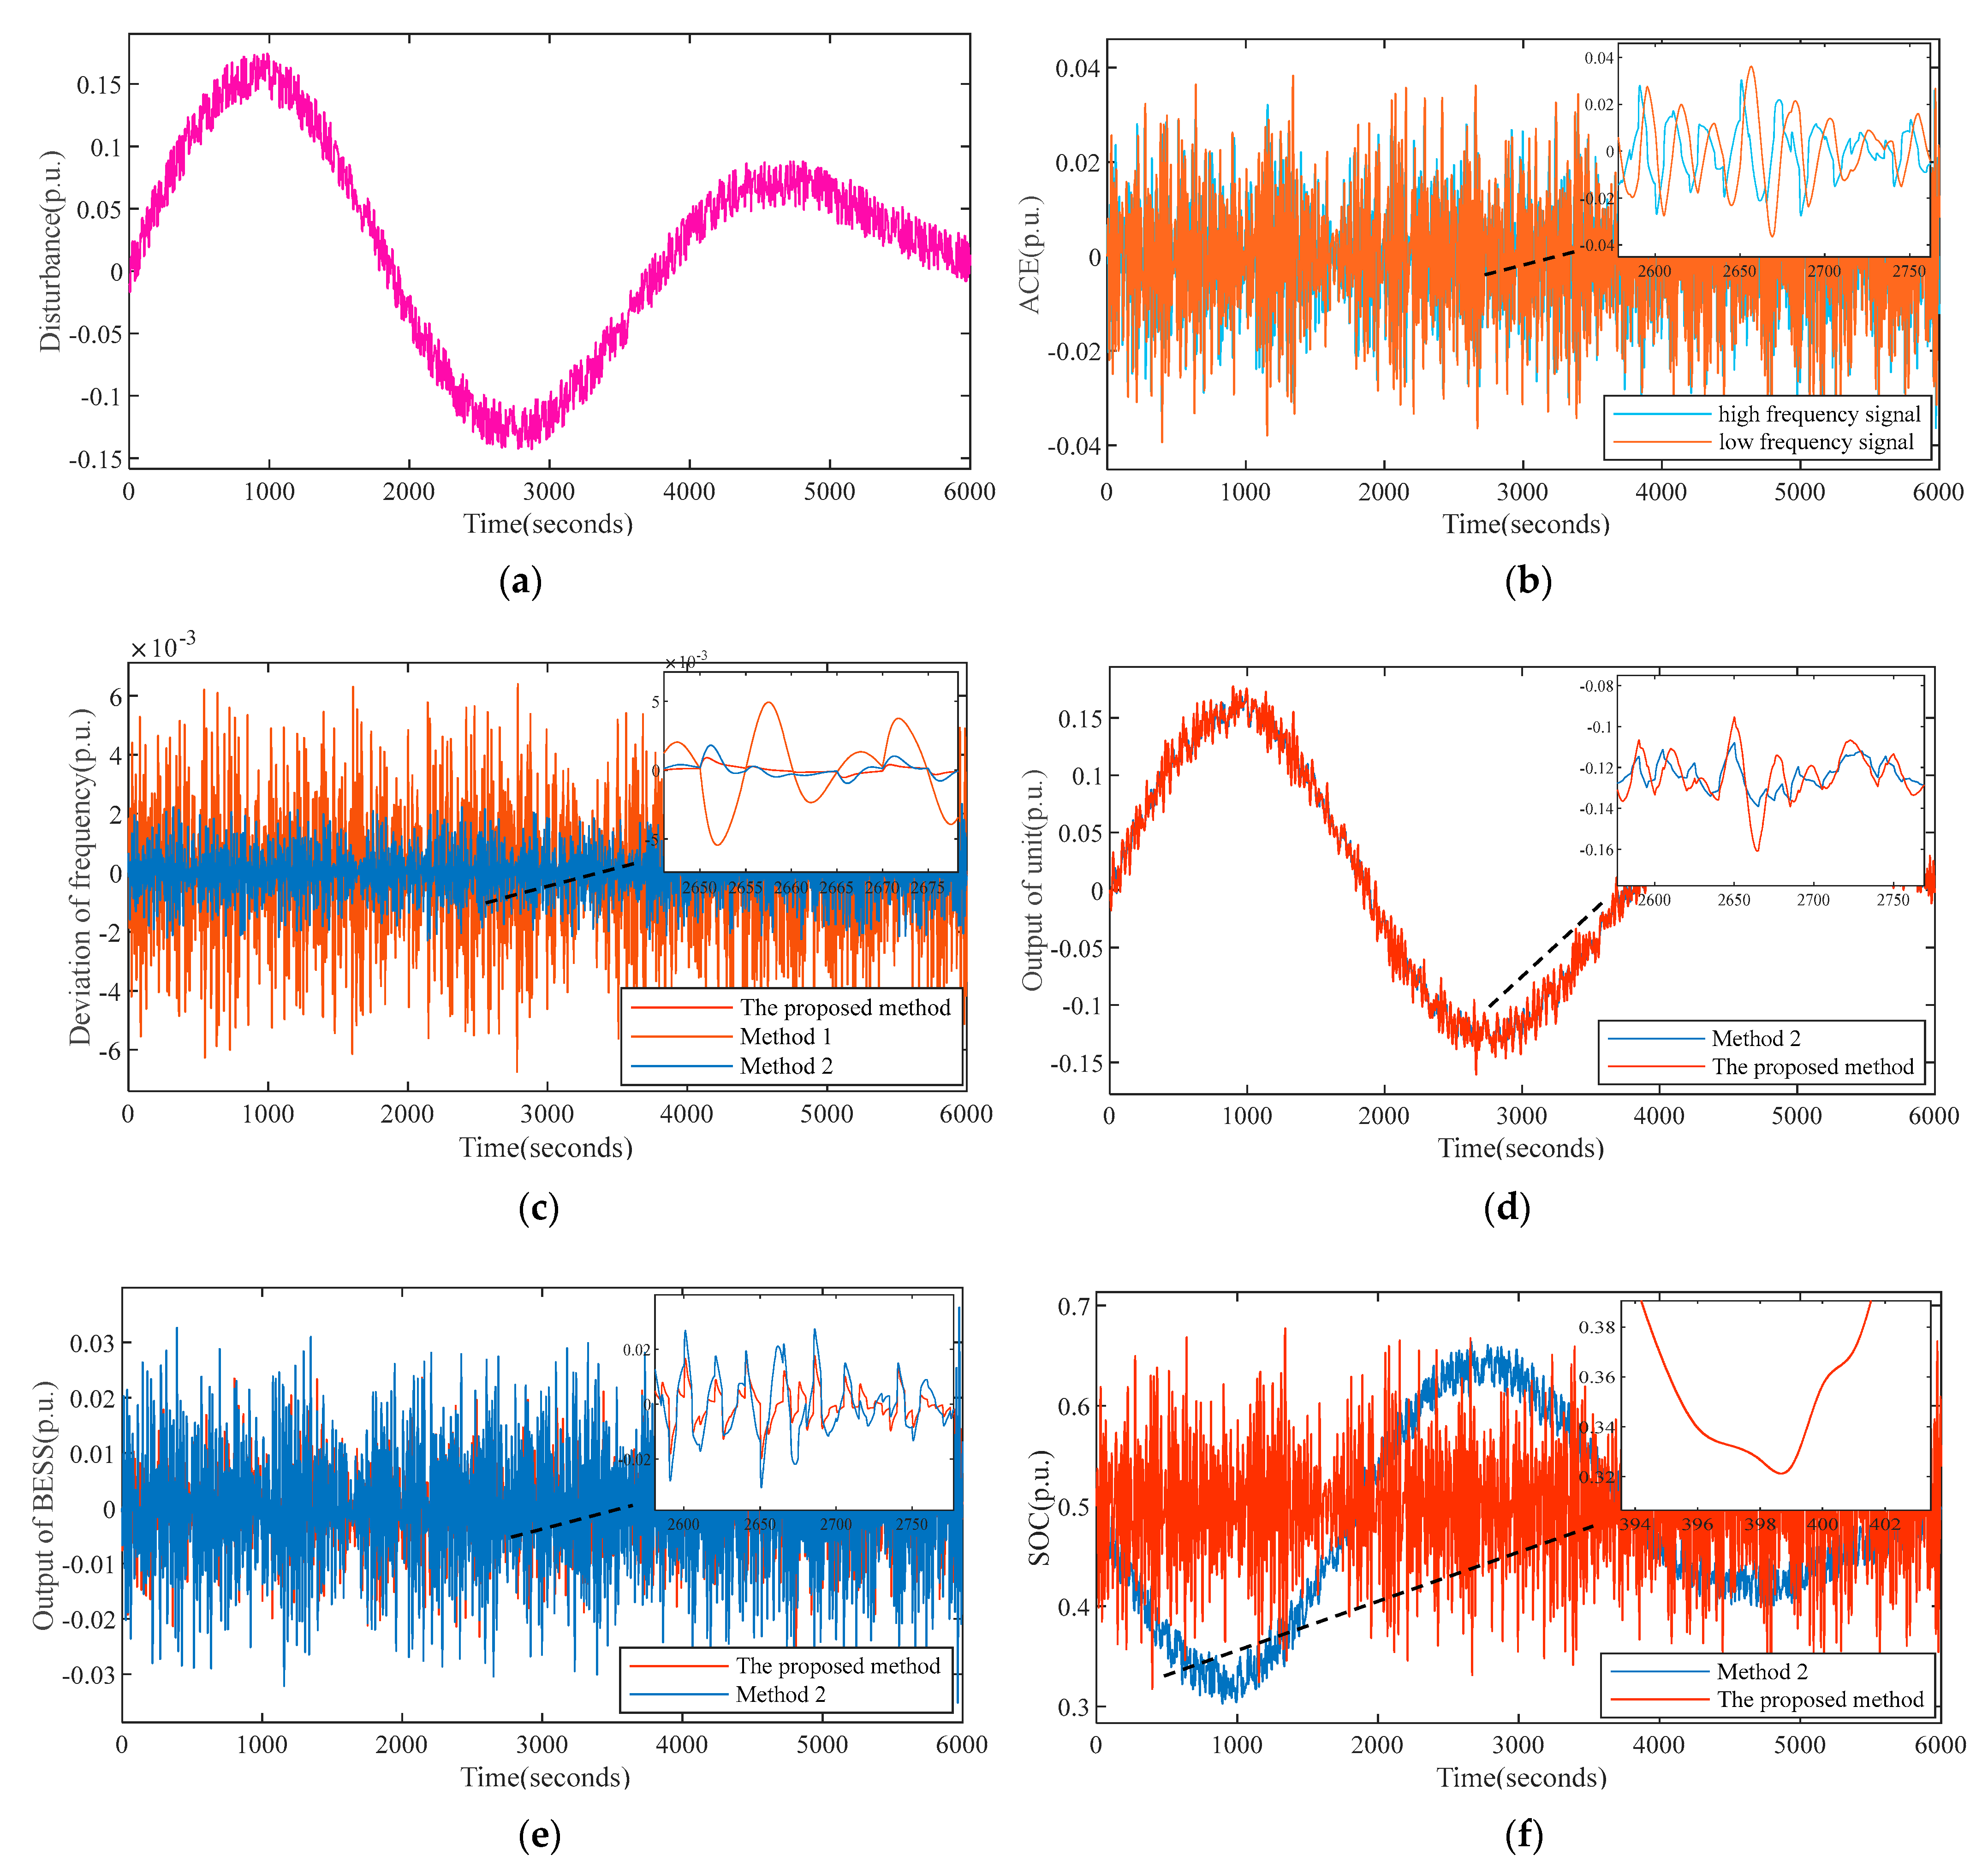
Typical continuous load disturbance conditions of 100 min in a certain area are selected, as shown in Figure 8a; the simulation time is set to 6000 s, and the range of the prediction model is 0.1 s. Figure 8 compares the system response curves of the proposed method, Method 1, and Method 2 in area 2.
From the simulation analysis results in Figure 8 and Table 4, we observed that:
(1)
The maximum value of frequency deviation and the root mean square value of frequency deviation for the proposed method are the minimum values compared to the other two methods, and the frequency control effect is significantly improved. In addition, the frequency decline rate of the proposed method is minor, and the recovery speed is faster.
(2)
Figure 8b shows the final ACE signal allocation. The high-frequency component is assigned to the BESS and the traditional unit bears the low-frequency component of the ACE. According to Figure 8d,e and Table 4, the operation frequency of the unit is reduced and the operation loss is reduced. Moreover, the unit can contribute more energy, which is beneficial to frequency control. At the same time, the output of BESS is reduced, which reduces the frequency control capacity configuration requirements of BESS.
(3)
In Figure 8f, the SOC fluctuation range of our strategy is between 0.3 and 0.7, the state-keeping effect is better, and the burden of BESS is reduced. In addition, it can be seen that when SOC is lower than 0.3, the SOC falling speed is significantly reduced and the rising speed is increased. It is proven that changing the component of high frequency for energy storage in real time is beneficial to maintain SOC state. The ACE signal’s high-frequency component has the characteristics of zero mean value and small amplitude. Assuming the ACE signal’s high-frequency component by the BESS has its advantages of fast response speed and maintaining SOC.

6. Conclusions

In this paper, EMD was used to decompose the ACE signal into high- and low-frequency signals. Considering the ACE signal and SOC, the MPC output weighting matrix and constraints were determined to change the high-frequency component of BESS in real-time and perform SOC self-recovery. The simulation results showed that the strategy fully used the advantages of BESSs and traditional thermal power units, reduced the frequent operation of thermal power units, and dynamically adjusted the distribution of frequency control demand signals. It improved the frequency control effect, maintained a good SOC, and simultaneously reduced the capacity configuration demand for BESS. In actual engineering applications, the performance index of frequency control, the benefit of the frequency control effect, and the interaction between them will be considered. Our future research work will include a more comprehensive study of this content.

Author Contributions

Conceptualization, X.L. and X.W.; methodology, X.L.; software, X.L.; validation, X.L., X.W. and W.N.; formal analysis, X.L. and F.W.; investigation, W.N.; resources, X.W.; data curation, X.L.; writing—original draft preparation, X.L.; writing—review and editing, X.L. and X.W.; visualization, W.N.; supervision, X.L.; project administration, F.W.; funding acquisition, X.W. All authors have read and agreed to the published version of the manuscript.

Funding

This research was funded by The Youth Science and Technology Fund of Gansu Province under grant 17JR5RA346, Science and Technology Project of State Grid Gansu Electric Power Company under grant SGGSJYOOPSJS1800.

Institutional Review Board Statement

Not applicable.

Informed Consent Statement

Not applicable.

Data Availability Statement

Not applicable.

Conflicts of Interest

The authors declare no conflict of interest.

References

  1. Liu, Y.; Chen, L.; Han, X. Analysis on key issues of new energy substitution in China under energy transformation. J. Proc. CSEE 2022, 42, 515–524. [Google Scholar]
  2. Zhang, J.; Li, Q.; Wang, X. Power supply planning method for large-scale new energy grid-connected system. J. Proc. CSEE 2020, 40, 3114–3124. [Google Scholar]
  3. Li, J.; Feng, X.; Yan, G. Review on research of power system under high wind power permeability. J. Power Syst. Prot. Control 2018, 46, 163–170. [Google Scholar]
  4. Yao, L.; Yang, B.; Cui, H. Challenges and progresses of energy storage technology and its application in power systems. J. Mod. Power Syst. Clean Energy 2016, 4, 519–528. [Google Scholar] [CrossRef] [Green Version]
  5. Li, X.; Huang, J.; Yang, Y. Review on frequency control of large-scale energy storage power supply. J. Power Syst. Prot. Control 2016, 44, 145–153. [Google Scholar]
  6. Sun, B.; Yang, S.; Liu, Z. Analysis and enlightenment of current status of frequency control demonstration and application of megawatt energy storage at home and abroad. J. Autom. Electr. Power Syst. 2017, 41, 8–16. [Google Scholar]
  7. Xie, X.; Guo, Y.; Wang, B. Improving AGC performance of coal-fueled thermal generators using multi-mw scale BESS: A Practical Application. J. IEEE Trans. Smart Grid 2018, 9, 1769–1777. [Google Scholar] [CrossRef]
  8. Cheng, Y.; Tabrizi, M.; Sahni, M. Dynamic available AGC based approach for enhancing utility scale energy storage performance. IEEE Trans Smart Grid. 2014, 5, 1070–1078. [Google Scholar] [CrossRef]
  9. Ma, Z.; Li, X.; Tan, Z. The primary frequency regullation control method of energy storage frequency modulation dead zone is considered. J. Trans. China Electrotech. Soc. 2019, 34, 2102–2115. [Google Scholar]
  10. Meng, G.; Chang, Q.; Sun, Y. Energy storage auxiliary frequency modulation control Strategy Considering ACE and SOC of Energy Storage. J. IEEE Access 2021, 9, 26271–26277. [Google Scholar]
  11. Cui, H.; Yang, B.; Jiang, Y. Based on fuzzy control and SOC self-recovery energy storage participating in secondary frequency control control strategy. J. Power Syst. Prot. Control 2019, 47, 89–97. [Google Scholar]
  12. Zhao, T.; Parisio, A.; Milanovicj, V. Distributed control of battery energy storage systems for improved frequency control. J. IEEE Trans. Power Syst. 2020, 35, 3729–3738. [Google Scholar] [CrossRef]
  13. Li, R.; Li, X.; Tan, Z. Integrated control strategy considering energy storage battery participating in secondary frequency control. J. Autom. Electr. Power Syst. 2018, 42, 74–82. [Google Scholar]
  14. Liu, Q.; He, S.; Lu, W. Model predictive control method for secondary frequency control assisted by battery energy storage. J. Electr. Meas. Instrum. 2020, 57, 119–125. [Google Scholar]
  15. Yan, G.; Liu, Y.; Duan, S. Battery energy storage unit group participates in power distribution strategy of secondary frequency control in power system. J. Autom. Electr. Power Syst. 2020, 44, 26–34. [Google Scholar]
  16. Lv, L.; Chen, S.; Zhang, X. Secondary frequency modulation control strategy for power system considering SOC consistency of large-scale battery storage. J. Therm. Power Gener. 2021, 50, 108–117. [Google Scholar]
  17. Le, J.; Liao, X.; Zhang, Y. Review and prospect of distributed model predictive control methods for power system. J. Autom. Electr. Power Syst. 2020, 44, 179–191. [Google Scholar]
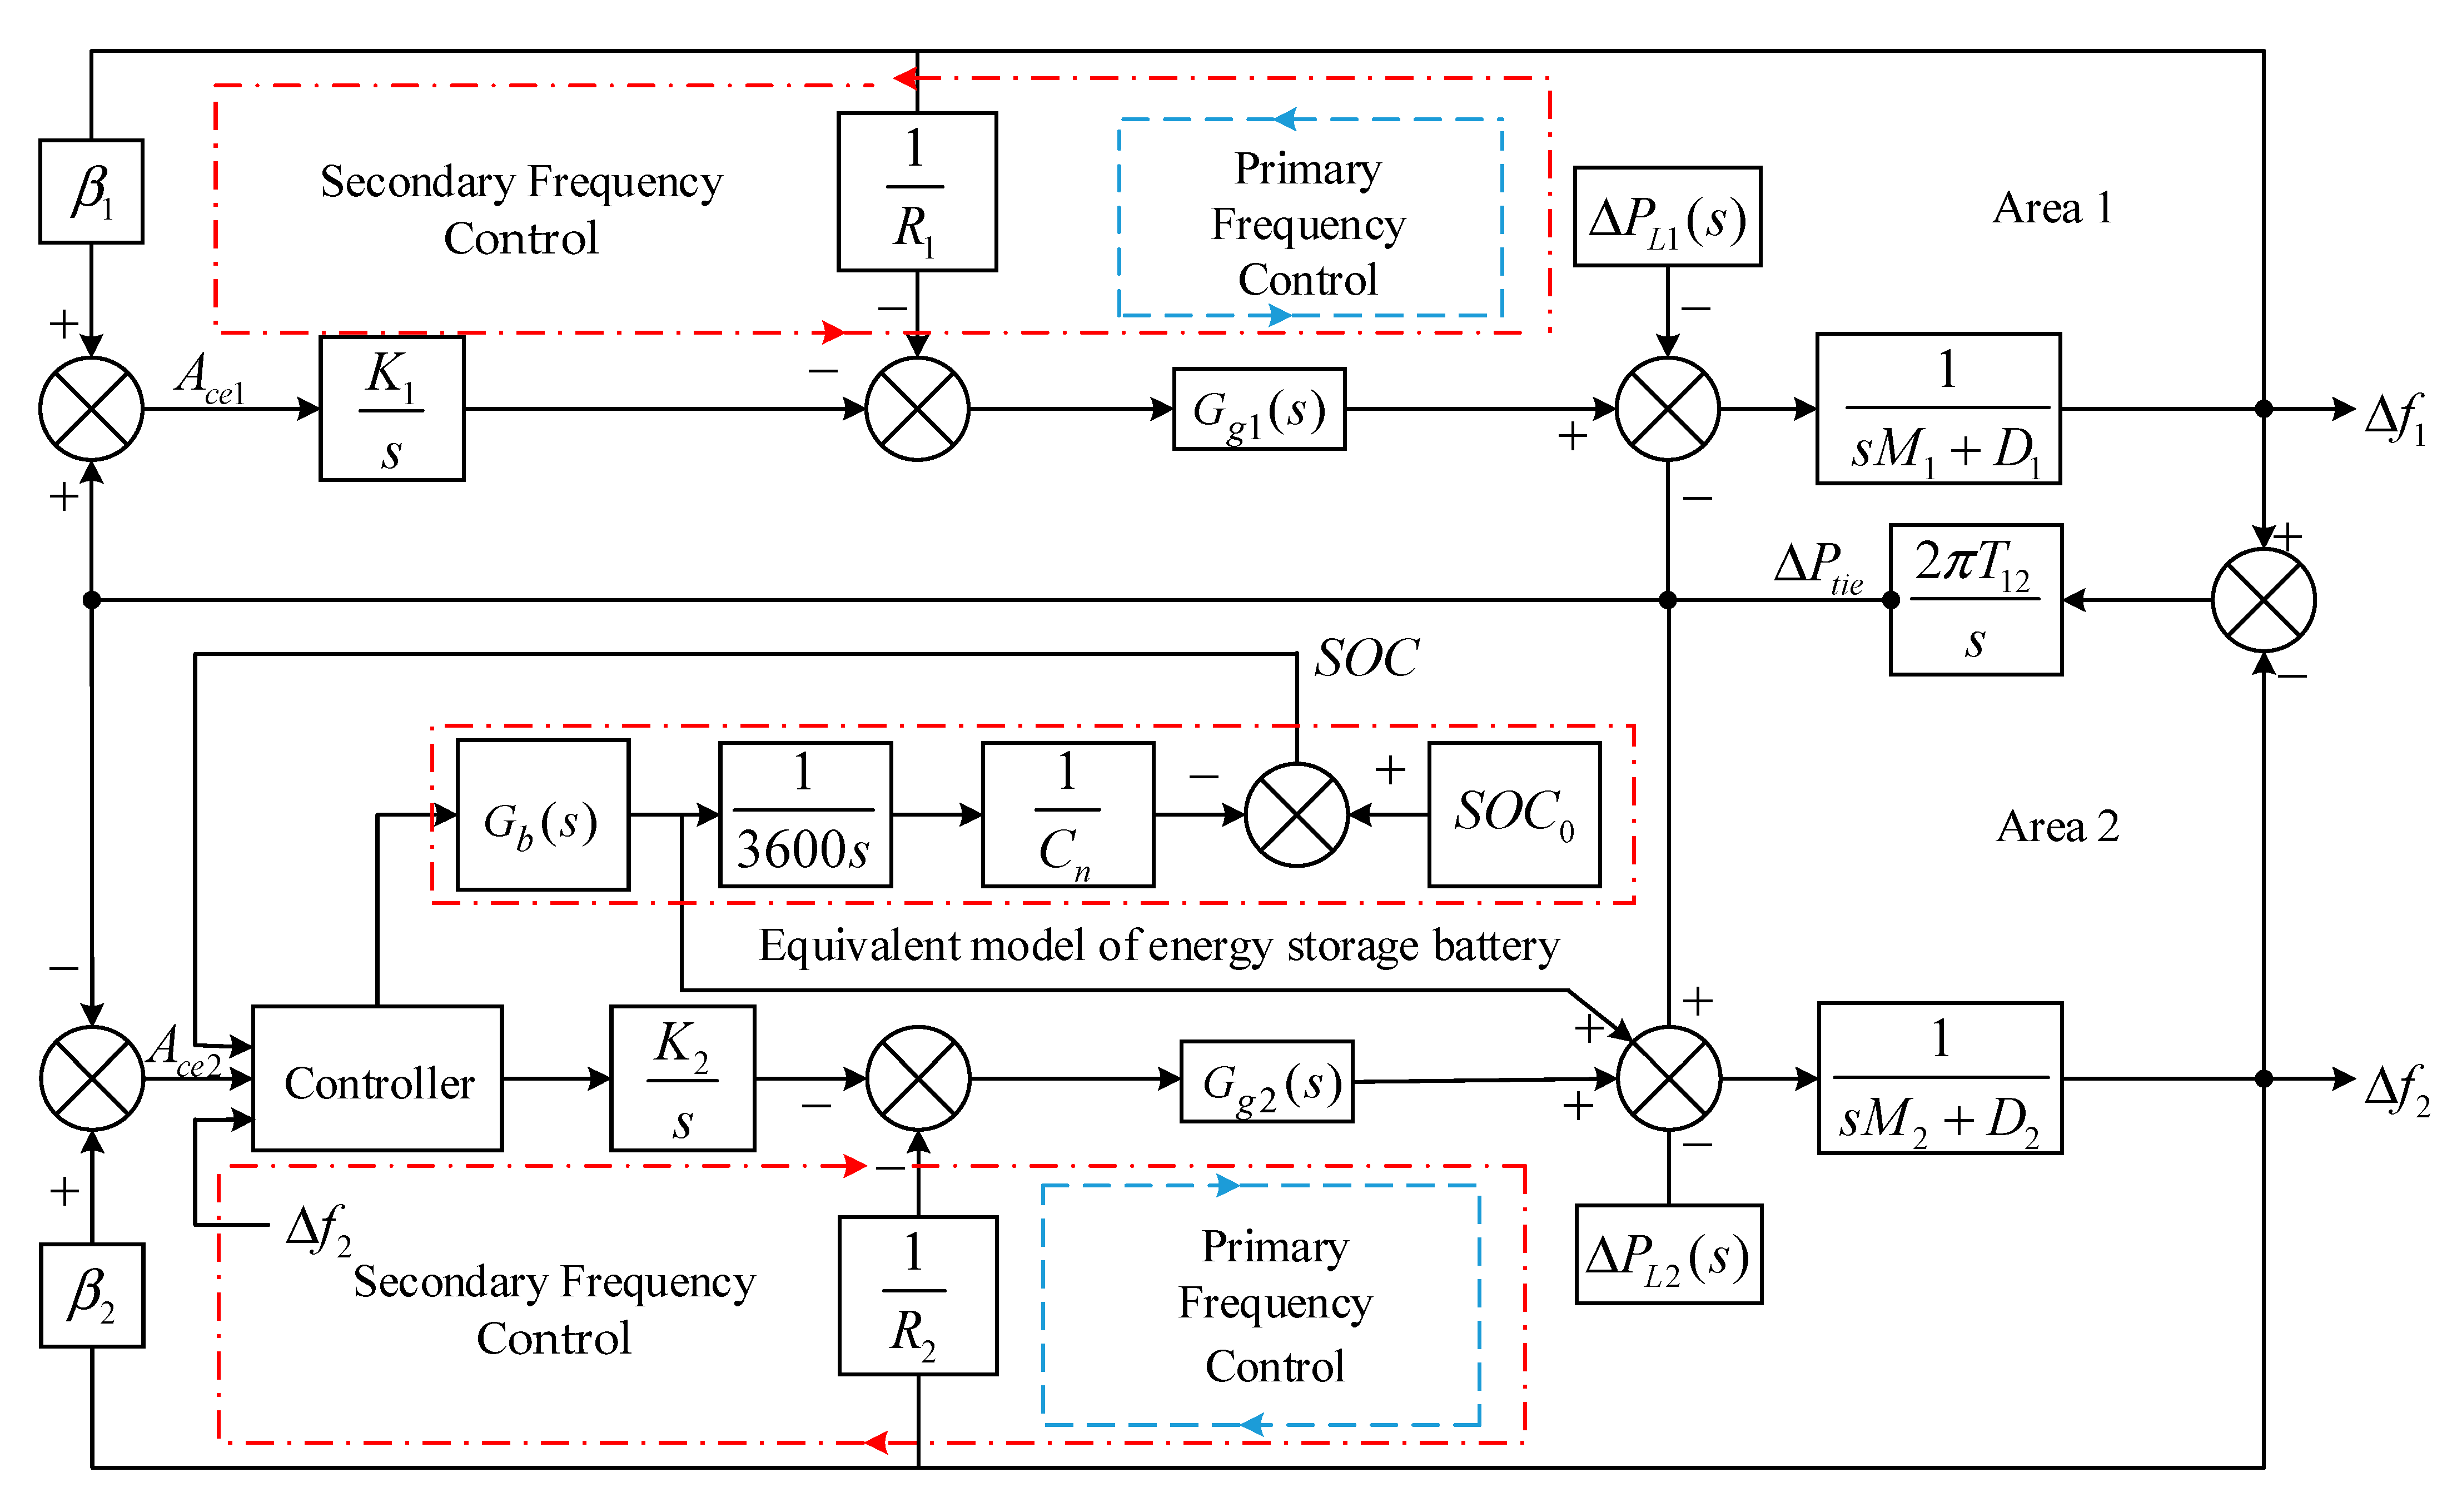
Figure 1. Frequency control model of the two-zone system with energy storage devices.
Energies 16 01228 g001
Figure 2. The flowchart of MPC application.
Energies 16 01228 g002
Figure 3. Diagram of output restrictions in self-recovery of energy storage.
Energies 16 01228 g003
Figure 4. Energy storage battery recovery chart.
Energies 16 01228 g004
Figure 5. ACE signal decomposition curve based on EMD.
Energies 16 01228 g005
Figure 6. Flowchart of the control strategy.
Energies 16 01228 g006
Figure 7. System response with step disturbance. (a) Description of the frequency deviation response curve. (b) Description of the tie-line power bias. (c) Description of change in SOC.
Energies 16 01228 g007
Figure 8. System response applying with continuous perturbation applied. (a) Continuous loading disturbance. (b) Low frequency signal and high frequency signal. (c) Deviation of frequency. (d) Output of unit. (e) Output of BESS. (f) The change of SOC.
Energies 16 01228 g008
Table 1. Parameters of simulation system model.
ParametersValueParametersValue
Power reference/MW300 T CH _ 1 , T CH _ 2 0.2, 0.3
Frequency reference/Hz50 T RH _ 1 , T RH _ 2 10, 8
Energy storage capacity/MW·h4.5 F HP _ 1 , F HP _ 2 0.25, 0.37
Energy storage power/MW9 T b 0.05
T g 1 , T g 2 0.1, 0.08 B 1 , B 2 35, 21
R 1 , R 2 0.03, 0.05 D 1 , D 2 2.75, 2
K 1 , K 2 0.5, 0.5 M 1 , M 2 10, 12
Table 2. Parameters of control rule.
ParametersValueParametersValueParametersValue
S O C min 0.2 S O C low 0.35 S O C 0 0.4
S O C max 0.8 S O C high 0.65 S O C 1 0.6
A C E ce , d 1 × 10⁻⁷ A C E ce , n 0.03 A C E ce , e 0.05
Table 3. Frequency regulation evaluation index under step disturbance.
Evaluation IndexThe Proposed MethodMethod 1Method 2
Δ f m / p . u . 9.560 × 10−41.998 × 10−31.690 × 10⁻³
Δ f rms / p . u . 2.084 × 10−45.722 × 10−44.365 × 10⁻⁴
Δ P t i e _ m / p . u . 7.298 × 10−42.776 × 10−29.718 × 10⁻³
Δ P t i e _ rms / p . u . 1.016 × 10−31.995 × 10−31.483 × 10⁻³
S oc _ rms 9.560 × 10−41.998 × 10−31.690 × 10⁻³
Table 4. Frequency regulation evaluation index under continuous disturbance.
Evaluation IndexThe Proposed MethodMethod 1Method 2
Δ f m / p . u . 1.100 × 10−36.463 × 10−32.316 × 10⁻³
Δ f rms / p . u . 2.763 × 10−41.933 × 10−36.015 × 10⁻⁴
W gen 0.2420.2740.265
W ess 0.021_0.0189
S oc _ rms 0.019_0.038
Disclaimer/Publisher’s Note: The statements, opinions and data contained in all publications are solely those of the individual author(s) and contributor(s) and not of MDPI and/or the editor(s). MDPI and/or the editor(s) disclaim responsibility for any injury to people or property resulting from any ideas, methods, instructions or products referred to in the content.