Article

Insights on the Effects of Magnetic Forces on the Efficiency of Vibration Energy Harvesting Absorbers in Controlling Dynamical Systems

1
Department of Mechanical and Aerospace Engineering, New Mexico State University, Las Cruces, NM 88003, USA
2
Sandia National Laboratories, Albuquerque, NM 87185, USA
*
Author to whom correspondence should be addressed.
Energies 2023, 16(3), 1272; https://doi.org/10.3390/en16031272
Submission received: 5 December 2022 / Revised: 14 January 2023 / Accepted: 15 January 2023 / Published: 25 January 2023

Abstract

:
This study investigates the effects of magnetic constraints on a piezoelectric energy harvesting absorber while simultaneously controlling a primary structure and harnessing energy. An accurate forcing representation of the magnetic force is investigated and developed. A reduced-order model is derived using the Euler–Lagrange principle, and the impact of the magnetic force is evaluated on the absorber’s static position and coupled natural frequency of the energy harvesting absorber and the coupled primary absorber system. The results show that attractive magnet configurations cannot improve the system substantially before pull-in occurs. A rigorous eigenvalue problem analysis is performed on the absorber’s substrate thickness and tip mass to effectively design an energy harvesting absorber for multiple initial gap sizes for the repulsive configurations. Then, the effects of the forcing amplitude on the primary structure absorber are studied and characterized by determining an effective design of the system for a simultaneous reduction in the primary structure’s motion and improvement in the harvester’s efficiency.

1. Introduction

The design and effectiveness of structural absorbers is a massive field of research for designers and engineers [1,2,3]. These researchers aim to limit the effects of environmental sources of excitation, including base excitation and fluid-induced vibrations, which can cause catastrophic failures in the structure when the excitation frequency matches the natural frequencies of the structure. Since this field of research received significant attention, there are many designs of absorbers that specialize in their specific applications [4,5,6,7,8]. For systems under base excitations, passive tuned-mass dampers are very effective in controlling the structure’s oscillations [9,10]. The most common tuned-mass damper is the spring-mass damper, but there are many designs for tuned-mass dampers. Pendulums and massive dampers have been combined to dissipate both small and large structural oscillations [11,12]. Another tuned-mass damper design utilizes a cantilever beam with a tip mass as the damper [13,14]. Jacquot et al. [15] investigated a double-ended cantilever beam as a vibrational absorber and incorporated structural damping by choosing a complex elastic modulus.
All these tuned-mass dampers dissipate the energy imposed on the structure mechanically, although it is beneficial to convert this energy into usable electrical energy. To this end, there are three main methods of harvesting energy, namely, electrostatic, electromagnetic and piezoelectric. Electrostatic energy harvesters are most commonly used in microelectromechanical (MEMS) structures and generate electricity through the change in capacitance as two charged materials move toward and apart from each other during excitation [16]. One main disadvantage of electrostatic energy harvesters is that they require an external power source to initiate the conversion process [17]. Electromagnetic energy harvesters are commonly permanent magnets oscillating through a coil of wires generating an electrical charge from the movement of the magnetic field, and some researchers have used additional magnets to levitate the moving magnet to reduce the friction in the system [18,19,20,21]. Piezoelectric energy harvesting occurs through the strain imposed on piezoelectric materials, which are specific materials that have molecular structures oriented as an electric dipole. As the strain is applied, the dipoles deform and produce a charge that can be harvested from the material [22]. Due to this capability, piezoelectric materials are commonly adhered to cantilever beams [23,24,25]. Additionally, electromagnetic and piezoelectric energy harvesters have been combined to increase the power generated [26,27,28,29,30]. Xia et al. [29] investigated a piezoelectric beam with a magnetic tip mass moving through a coil and investigated the various possible electrical boundary conditions. Zhao et al. [30] investigated a similar system, although the magnet was attached to the beam by a spring, and a driving beam was placed above the energy harvester to induce contact nonlinearity and generate a broadband response. Mahmoudi et al. [28] investigated a fixed–fixed piezoelectric beam with a magnetic mass in the middle of the beam. Coils are placed above and below the magnet, and additional magnets are placed at the end of the coils oriented to repulse the oscillating magnet to improve stability. This method greatly improves the amount of energy harvested over the electromagnetic energy harvesters in the magnetic levitation configuration by eliminating the friction developed between the magnet and enclosure. It is clear that by combining these two energy harvesters, the amount of energy harvested can be increased. However, these investigations pertain to energy harvesters directly under base excitation. Since a vibrational absorber is directly coupled to its source of excitation, the inclusion of another source of damping for the absorber could add complexity to the tuning of the absorber to the primary structure. Due to this, this study will focus on a piezoelectric energy harvester as the absorber and will include the electromagnetic energy harvester in future work.
Many researchers have utilized a piezoelectric energy harvester as an absorber previously [31,32,33,34,35] and have shown great control of the primary structure while simultaneously harvesting adequate amounts of electrical energy. These studies investigated the energy harvester where the direction of excitation is perpendicular to the absorber, so the excitation of the structure excites the absorber. However, other researchers have placed the absorber parallel to the direction of excitation. The absorber exhibits transverse excitation when the natural frequency of the primary structure is commensurable to the natural frequency of the absorber, commonly in a 2:1 ratio, and quadratic nonlinearities are present [13,14,36,37]. This model has been seen to adequately control a structure while harvesting energy [13] and strong interactions between the primary structure’s displacement and the energy harvested [36]. These proposed models all have the energy harvesting absorber on the outside of the structure. This is due to the absorber needing a natural frequency half as large as a similar system placed perpendicular to the source of excitation. This can cause the environment to affect and inhibit the absorber. Additionally, it was seen that the proposed model did not perform as well as a linear tuned and damped absorber with the same mass ratio. The performance of the autoparametric absorber could be improved by increasing the mass of the tip mass, but the mechanical constraints of the cantilever will limit the ability to fully optimize the absorber [13]. For this study, a piezoelectric energy harvester will be placed perpendicularly to the excitation source and internally to the primary structure.
Piezoelectric energy harvesters produce the most energy when the most strain occurs; thus, the most energy is harvested during the oscillations of the cantilever beam. Therefore, the range of frequencies that harvest energy is quite narrow and centered around the beam’s natural frequencies. Therefore, researchers have focused on broadening the range of frequencies to harvest energy through the inclusion of nonlinear effects. Magnets have been used in numerous configurations to improve the performance of piezoelectric energy harvesters [38,39,40,41,42]. Tang and Yang [43] performed comparative analyses of experimental and simulated results for a piezoelectric energy harvester with a magnetic oscillator. It was shown that the bandwidth was increased by 200% and the peak power was increased by 41% when using the magnetic oscillator over the case without magnets. Additionally, the simulated results were excellent qualitatively but overpredicted the peak power harvested. In Ref [44], the authors investigated a piezoelectric energy harvester with a magnet embedded in the tip mass that paired with a single attractive magnet. It was noted that the attractive magnet induced a softening behavior in the harvester, allowing for the development of a broadband region. The distance between the magnets was investigated to optimize the system and avoid pull-in which occurs when the magnets becoming attached. Later, Abdelmoula et al. [45] continued this research with dual attractive magnetic constraints. It was shown that the inclusion of the second magnetic force decreased the gap size that induced static pull-in, which defines the gap when the attractive magnets connect, and it was observed that dual magnet configurations would generate wider broadband regions than the single magnet configuration with the same initial gap between the magnets. These studies all consider piezoelectric energy harvesters directly under base excitation. This is different from energy harvesting absorbers, which are directly coupled to their source of excitation. Previous work has shown that mechanical stoppers have improved the amount of energy harvested while maintaining adequate control of the primary structure [46,47], so this study will aim to improve the efficiency of the energy harvesting absorber by including magnetic constraints. The rest of this study is organized as follows. In Section 2, the coupled system is introduced, and the reduced-order model of the system is developed. Then, the effects of the magnetic forces on the absorber’s initial position as well as the coupled natural frequencies are investigated. Section 3 represents the bulk of the paper, where multiple investigations are performed to improve the efficiency of the energy harvesting absorber system. The effects of the magnetic force for both single-sided and double-sided configurations on the absorber’s potential energy as well as the overall system performance are explored and discussed. Next, the absorber’s parameters are investigated to effectively control the primary structure’s amplitude with small initial gaps between the magnets. Then, different forcing amplitudes are investigated for the double-sided repulsive case to fully understand the system’s performance. To this end, nonlinear characterization is performed for aperiodic regions that are present. Finally, the modeling of the system and the computational results are summarized and discussed in Section 4.

2. System’s Description and Model Formulation

A dynamical system under base excitation of y t was approximated as a spring-mass damper system using the structure’s stiffness and damping coefficients k and c , respectively, as shown in Figure 1. Different configurations of the magnets will produce different static and dynamic responses of the absorber. Thus, it is shown in Figure 1a,b that the dual symmetric magnets with the same polarities produce no change in the static position, regardless of the initial gap between the magnets. Figure 1c–e will produce a change in static position due to the opposite polarities or the lack of presence of the second magnetic constraint. A cantilever piezoelectric energy harvesting absorber is included to control the primary system while simultaneously harvesting energy. The red piezoelectric layers cover half of the beam’s length and fully cover the beam’s width. Additionally, orange magnets are embedded into the tip mass of the absorber to possibly improve the absorber’s ability to harvest energy by inducing nonlinear forcing by interacting with the magnets placed in the primary structure. The displacement of the primary structure is denoted as w 1 t , while the relative displacement of the absorber at distance x along the beam is denoted as w 2 x , t . Due to the magnetic forces, the absorber may have a nonzero static position. To that end, the absorber’s displacement is separated into the sum of the static and dynamic displacements and is expressed as follows:
w 2 x , t = w 2 s x + w 2 d x , t
To accurately depict the displacement of the absorber, the Galerkin discretization is utilized and depicted in Equation (2). The Galerkin method discretizes a continuous system into discrete solutions by summing the basis functions multiplied by their expansion coefficients. This method is utilized to accurately and efficiently describe the displacement of the energy harvesting absorber by using the absorber’s mode shapes, φ i x , as the basis functions and multiplying them by their modal coordinates, r i t . This allows for reduced run times to solve the computational model by performing a convergence analysis to determine the minimum number of modes needed to generate accurate results.
w 2 d x , t = i = 1 φ i x r i t  
The governing equations for cantilever piezoelectric energy harvesters and energy harvesting absorbers are well known in the literature [32,33,44,46]. A common way of developing the governing equations for this system is using the Euler–Lagrange equations, thus requiring the kinetic and potential energies, as well as the non-conservative work. The expressions of the energies and non-conservative work are expressed in Equations (3)–(5).
T = 1 2 M w ˙ 1 2 + 1 2 M t u ˙ 2 + 1 2 I t w ˙ 2 L , t + 1 2 M b 1 0 L 1 w ˙ 1 + w ˙ 2 x , t 2 d x + 1 2 M b 2 L 1 L w ˙ 1 + w ˙ 2 x , t 2 d x    
Π = E I 1 0 L 1 w 2 x , t 2 d x + E I 2 L 1 L w 2 x , t 2 d x + b ε 33 h s + h p 0 L 1 w 2 x , t V t d x e 31 b L 1 h p V t 2 + 1 2 k w 1 y t 2
δ W n c = c w ˙ 1 y ˙ t δ w 1 0 L c a w ˙ 2 x , t d x δ w 2 I δ λ + F m a g n e t i c δ w 2 L s , t    
where u ˙ = w ˙ 1 + w ˙ 2 L , t + L c w ˙ 2 L , t , the second moment of inertia, I t = 4 3 M t L c 2 , the mass of the beam, M b 1 = b ρ s h s + 2 b ρ p h p and M b 2 = b ρ s h s , the length of the piezoelectric patch is L 1 , the energy harvesting absorber’s stiffnesses are E I 1 = b E s h s 3 12 + 1 2 b E p h s 2 h p + b E p h s h p 2 + 2 3 b E p h p 3 and E I 2 = b E s h s 3 12 , c a represents the damping of the absorber, I denotes the current, the voltage generated is V = λ ˙ , and the magnetic force is F m a g n e t i c .

2.1. Magnetic Force Representation

The expression of the force applied between the magnets is dependent on multiple parameters, especially the magnet’s shape and material, which affects the shape and strength of the magnetic field. The most accurate method of expressing the magnetic force is to perform experimental measurements. However, this method is time consuming and requires special equipment to accurately measure the forces. Additionally, it is necessary to perform experiments multiple times to increase accuracy, and a variety of magnets should be used to develop a model that is accurate for any magnet. Alternatively, the dipole–dipole approximation simplifies this calculation by assuming that the distance between the magnets is large enough, so that the shape of the magnets is irrelevant, and that the magnets are always vertically aligned, which allows the magnets to be approximated as point charges. The magnetic force using the dipole–dipole approximation is expressed as
F d d t = 3 τ a 1 a 2 2 π d w 2 L s , t 4      
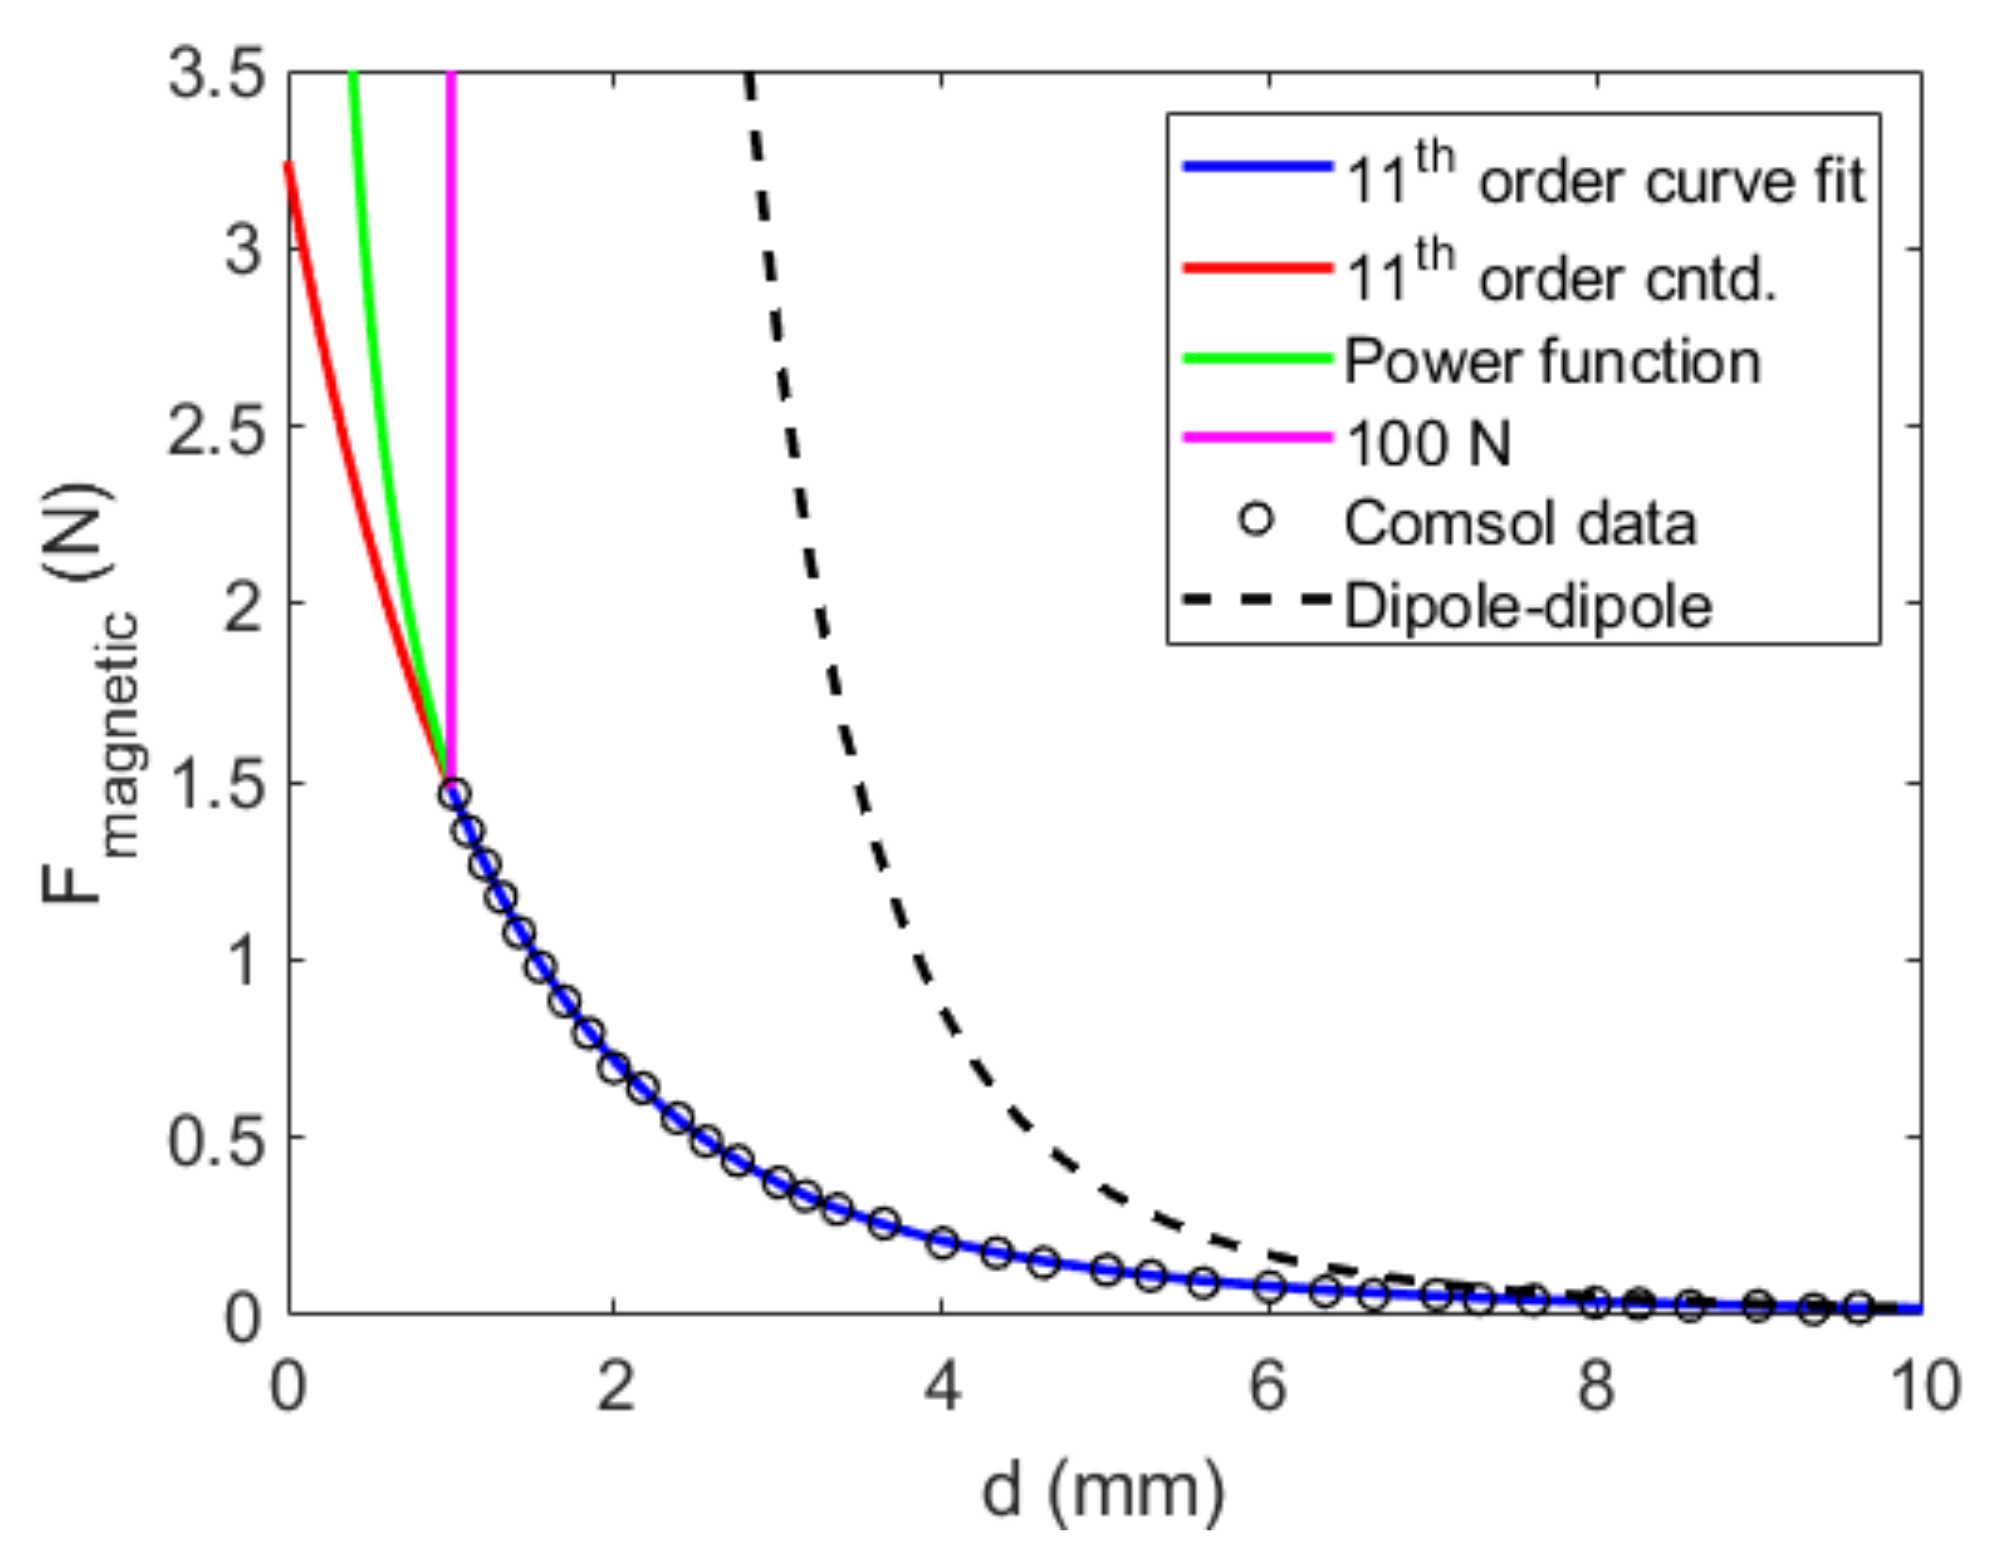
where d represents the initial gap between the magnets, τ is the vacuum permeability, a 1 and a 2 are the moments of the magnetic dipole, which are equal to each other when the magnets are repulsive, and a 1 = a 2 when the magnets are attractive. As mentioned before, the dipole–dipole approximation is accurate for large gaps, so researchers have evaluated the accuracy of the approximation by comparing the results to simulations performed in COMSOL, a Multiphysics finite element analysis software [48]. The data obtained from COMSOL are compared to the dipole–dipole approximation in Figure 2, and it can be seen that the approximation is only accurate for gaps larger than 7   m m . To ensure accurate results and low computational times, a polynomial curve fit is applied to the COMSOL data, which is expressed as
F p o l y t = j = 0 n p j d w 2 L s , t j    
where the polynomial coefficients p j can be seen in Table 1.
Since the COMSOL data are only accurate for gaps between 1 and 10 mm, the expression of the magnetic force is expressed as a piecewise function, as seen in Equation (8), so the dipole–dipole approximation can be used for gaps larger than 12   m m .
F m a g n e t i c = 3 τ a 1 a 2 2 π d w 2 L s , t 4 f o r   d w 2 L s , t > 12   m m j = 0 11 p j d w 2 L s , t j f o r   d w 2 L s , t 12   m m  

2.2. Magnetic Force Effects on the Absorber’s Static Position and Natural Frequency

Small initial gaps between the magnets will apply a force to the absorber, causing a static displacement when the absorber is configured with a single magnetic constraint or with two magnetic constraints with asymmetric gaps or opposite polarities. The direction of this displacement is dependent on the magnets being in the attractive or repulsive configuration. To determine the static position of the absorber when it is decoupled from the primary structure, the strategy used in Ref [44] is followed. The static equations of motion and associated boundary conditions are expressed as
w 2 s 1 i v = 0 ,   f o r   0 x L 1        
w 2 s 2 i v = 0 ,   f o r   L 1 x L          
w 2 s 1 0 = 0   ,     w 2 s 1 0 = 0   ,     w 2 s 1 L 1 = w 2 s 2 L 1   ,     w 2 s 1 L 1 = w 2 s 2 L 1  
  E I 1 w 2 s 1 L 1 = E I 2 w 2 s 2 L 1   ,     E I 1 w 2 s 1 L 1 = E I 2 w 2 s 2 L 1        
  E I 2 w 2 s 2 L + F m a g w 2 s L s = 0   ,     E I 2 w 2 s 2 L = 0                
where w 2 s 1 represents the static position of the absorber in the section with the piezoelectric layers, and w 2 s 2 represents the static position of the section without piezoelectric layers.
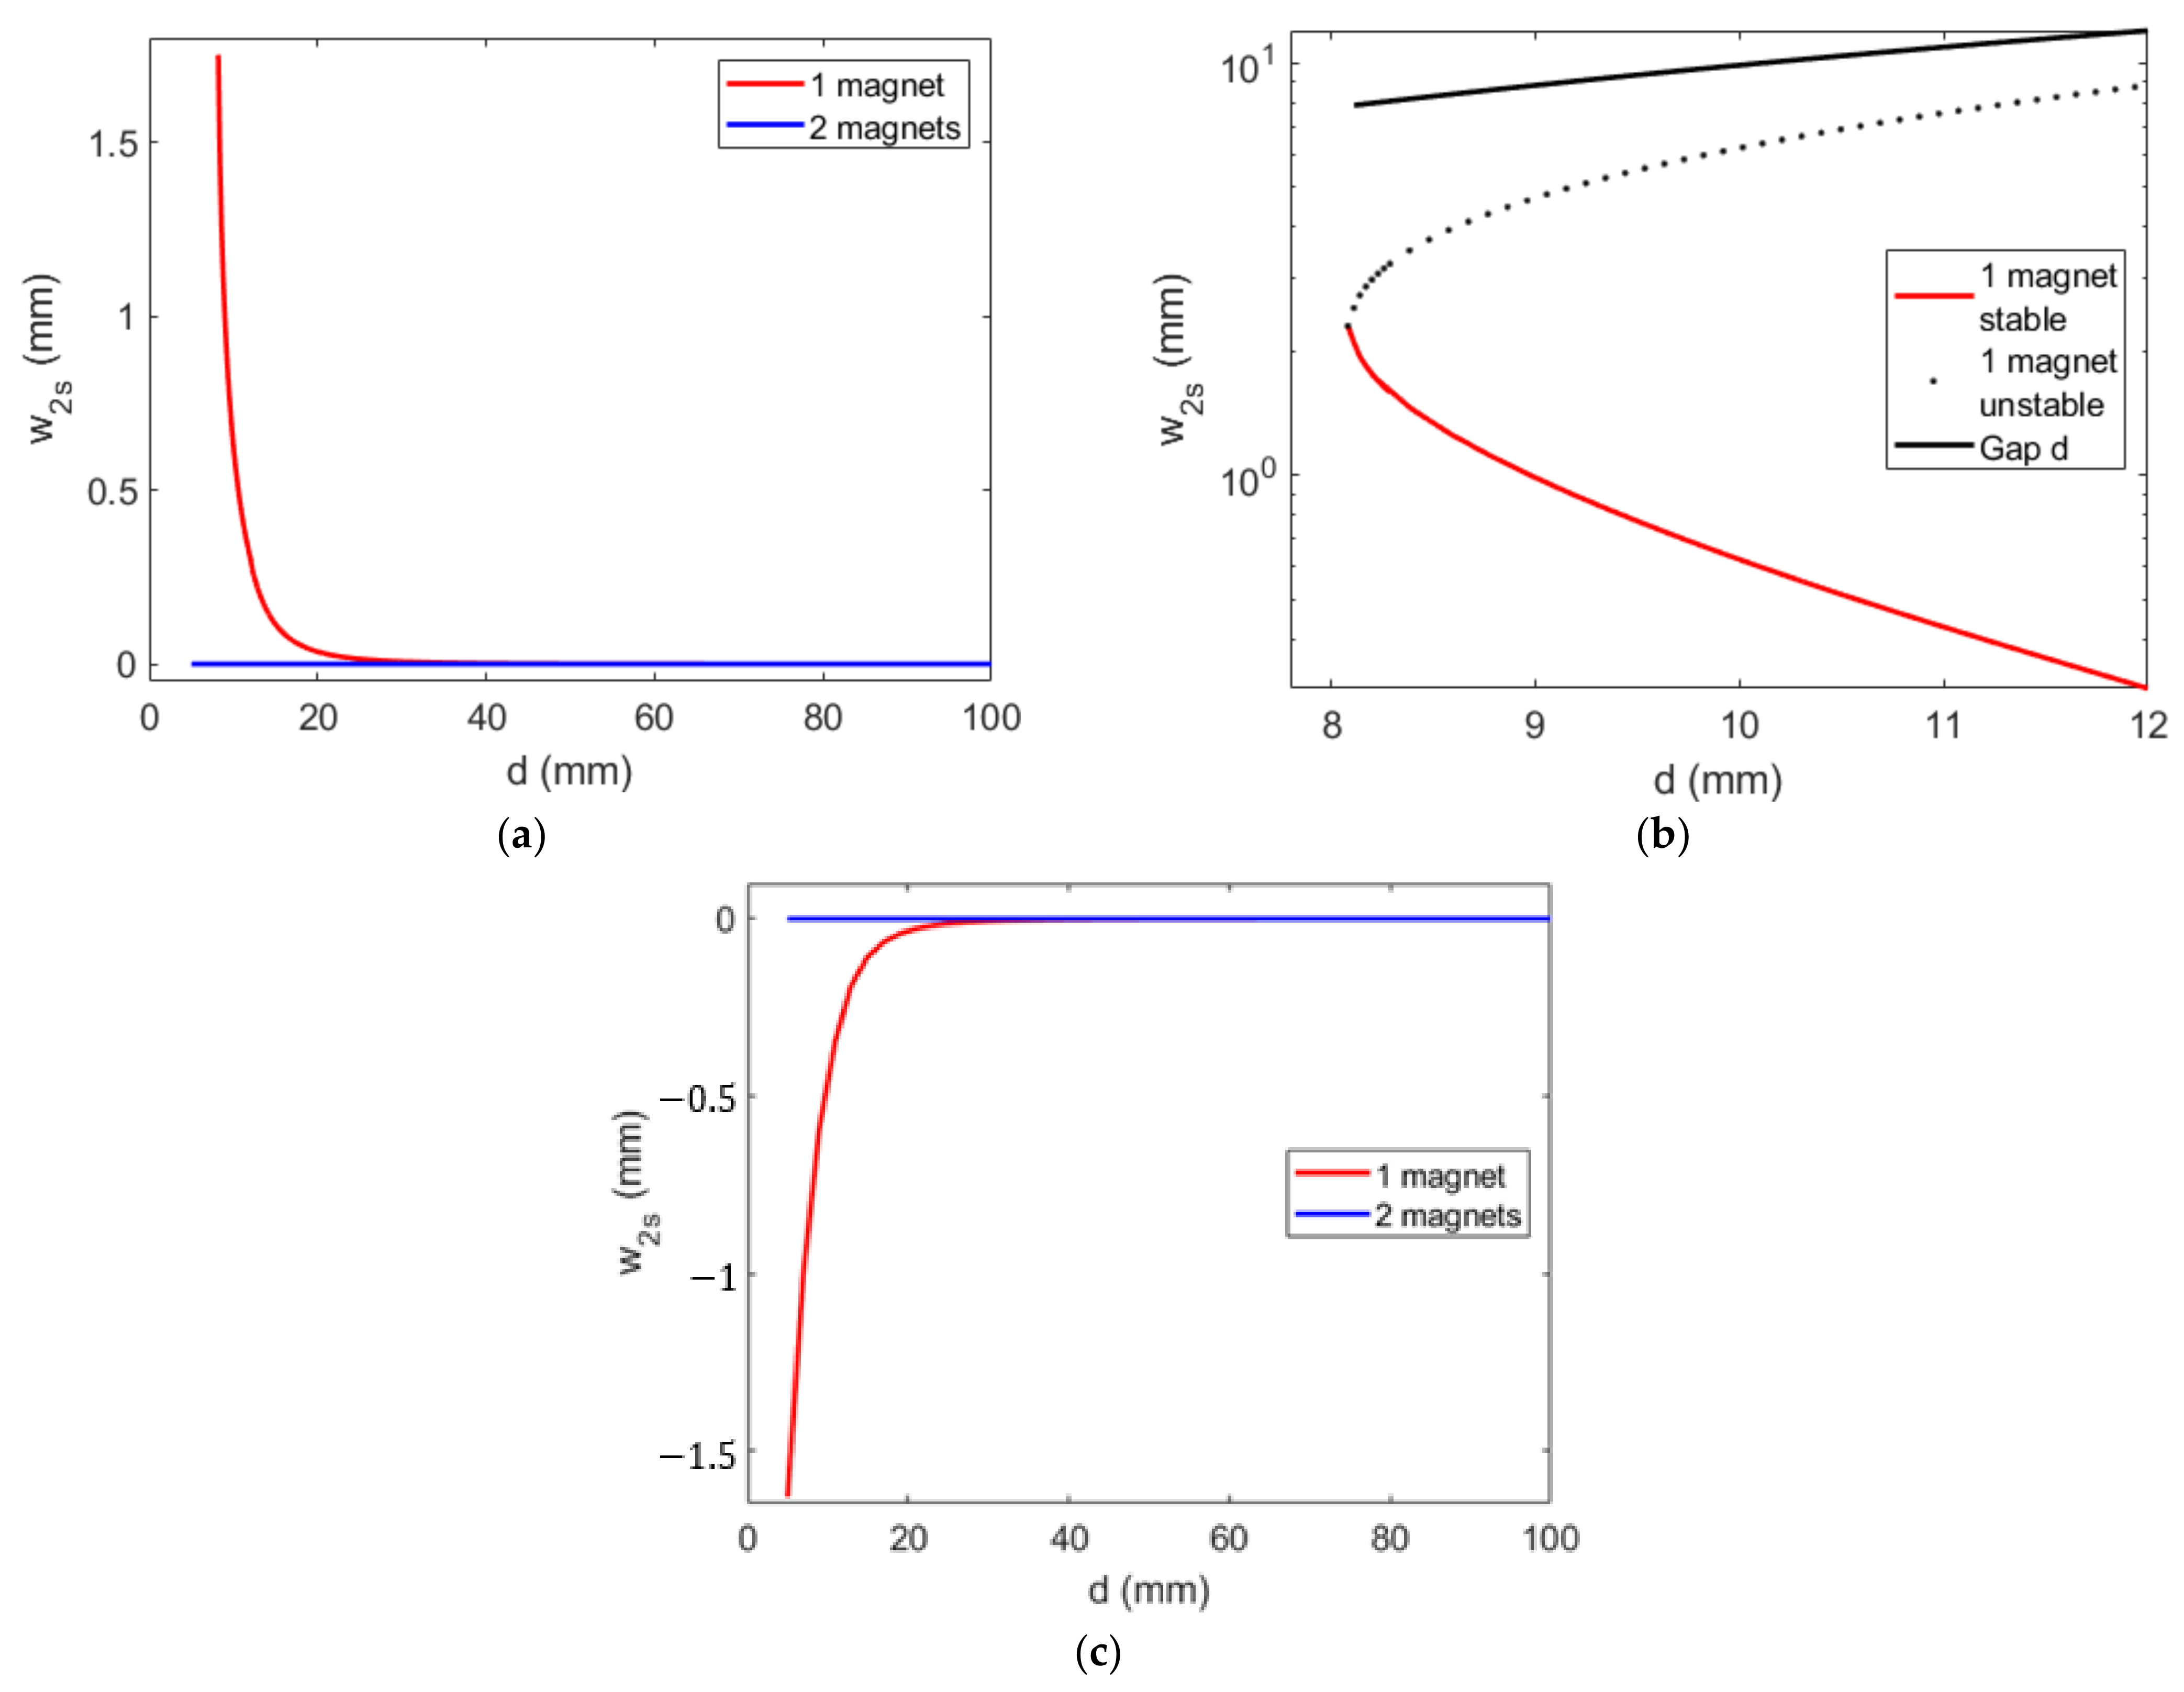
The static position for attractive and repulsive configurations is shown in Figure 3. It is clear that when the double magnet configuration is used, the equal spacing of the magnets cancels out the effects of the static position. When only a single magnet is positioned above the absorber, static pull-in occurs at a gap of 8.2   m m . This change is clear in Figure 3b, where the stable and unstable branches of the static position are shown. The two branches become equal at the pull-in frequency, and there is no stable solution at smaller gaps. Additionally, static displacement starts to occur around 30   m m , so a larger gap will only affect the system dynamically.
In addition to the static position, it is important to investigate the effects of the magnetic forces on the coupled natural frequencies of the absorber’s system. First, an eigenvalue analysis is performed on the energy harvesting absorber. Through this analysis, the mode shapes and the orthogonality conditions of the absorber are derived from the Euler–Bernoulli beam theory and the absorber’s associated boundary conditions. The linearized magnetic forcing function, which is linearized using the Taylor series expansion around w 2 d = 0 , is present in the boundary condition for the shear force at the location of the magnetic constraint. This methodology is well known in the literature and was solved following the approach used in Refs [44,45]. The eigenfunctions are normalized using the orthogonality conditions shown in Equations (14) and (15). The second orthogonality equation shows the effects of the magnetic force F m a g on the absorber’s natural frequency when the force is large. The coupled natural frequencies of the system are further investigated in Section 2.3 through an eigenvalue analysis.
0 L 1 φ 1 s x m 1 φ 1 r x d x + L 1 L φ 2 s x m 2 φ 2 r x d x + φ 2 s L M t φ 2 r L + φ 2 s L M t L c φ 2 r L + φ 2 r L M t L c φ 2 s L + φ 2 s L I t + M t L c 2 φ 2 r L = δ r s
0 L 1 φ 1 s x E I 1 φ 1 r x d x + L 1 L φ 2 s x E I 1 φ 2 r x d x φ 2 s L δ F m a g δ w 2 d w 2 d = 0 φ 2 r L = δ r s ω r 2  
As for the coupled absorber’s primary system, the kinetic and potential energies and the non-conservative work are used in the Euler–Lagrange equations to derive the nonlinear reduced-order model. The system’s governing equations of motion are presented in Equations (16)–(18). The values of the parameters used in this study are given in Table 2.
M s 1 w ¨ 1 + c w ˙ 1 + k w 1 + i = 1 M s 2 i r ¨ i = F c o s ω f t + ϕ        
r i ¨ + 2 ξ i ω i r i ˙ + ω i 2 r i + M s 2 i w ¨ 1 θ i V + N i = 0                  
C p V ˙ + V R + i = 1 θ i r i ˙ = 0            
where the capacitance of the harvester is C p = 2 ε 33 b L 1 h p , the piezoelectric coupling term is θ = E p d 31 b h p + h s φ i L 1 , and the two mass sums, as well as the nonlinear contribution of the magnetic force, are as follows:
M s 1 = M + M t + M b 1 L 1 + M b 2 L L 1 M s 2 i = M t φ i L + M t L c φ i L + M b 1 0 L 1 φ i x d x + M b 2 L 1 L φ i x d x N i = F m a g F m a g w 2 d = 0 δ F m a g δ w 2 d w 2 d = 0 j = 1 φ j L s r j t φ i L s

2.3. Effects of the Magnetic Force on the Linear Characteristics of the Coupled System

A linear eigenvalue problem analysis is performed to determine the effects of the gap size on the coupled natural frequencies of the system. Additionally, only one mode in the Galerkin discretization is considered for this linear analysis. State space variables are derived to fully describe the coupled system, and the equations of motion can be expressed in state space as follows:
q ˙ = A q      
where q represents the state space variables q = w 1   w ˙ 1   r 1   r ˙ 1   V T , and the matrix A is described as
A = 0 1 0 0 0 k M s 1 M s 21 2 c M s 1 M s 21 2 ω 1 2 M s 21 M s 1 M s 21 2 2 ξ ω 1 M s 21 M s 1 M s 21 2 θ 1 M s 21 M s 1 M s 21 2 0 0 0 1 0 k M s 21 M s 1 M s 21 2 c M s 21 M s 1 M s 21 2 ω 1 2 M s 1 M s 1 M s 21 2 2 ξ ω 1 M s 1 M s 1 M s 21 2 θ 1 M s 1 M s 1 M s 21 2 0 0 0 θ 1 C p 1 R C p
The eigenvalues of the state space matrix are calculated, which results in two complex conjugate eigenvalues, where the real parts represent the coupled damping of the system, and the imaginary values denote the coupled natural frequencies. It should be noted that there are no direct contributions of the magnetic force in the state space. However, the uncoupled natural frequency of the absorber is present, which is affected by the magnetic force as seen in Equation (15) and the associated boundary conditions, and its methodology and effects on the decoupled absorber are discussed in Refs [44,45]. The effects of the magnetic force on the coupled natural frequencies obtained through the eigenvalue analysis are presented in Figure 4. The attractive cases show a softening in the natural frequencies as the gap decreases, as depicted in Figure 4a. In fact, the natural frequency of the absorber approaches zero, which is indicative of static pull-in. It is noted that the double magnet configuration has a lower pull-in frequency, which allows for the absorber to have higher displacements before pull-in occurs. For the repulsive cases, the natural frequencies increase as the initial gap decreases. The magnetic force has a significant impact on the system’s linear characteristics, and hence, it should directly affect the resonance regions of the system and levels of the harvested power.

3. Baseline System’s Effectiveness and Effects of the Magnetic Force

An in-depth investigation is carried out to effectively design energy harvesting absorbers for attractive and repulsive configurations, as well as single and double magnet configurations. For each configuration, multiple gap sizes are explored. In an effort to have multiple gaps that do not induce dynamic pull-in, the amplitude of the forcing function F 0 , which is normalized with regard to the mass of the system where F 0 = m s 1 M F , is set at 0.1   N . Then, the substrate thickness and the mass of the tip mass will be adjusted to effectively couple the energy harvesting absorber to the primary structure for small gaps where the magnets strongly affect the natural frequencies of the system. Afterward, the amplitude of the forcing excitation will be increased to study the onset of aperiodic behaviors.

3.1. Investigation of Magnetic Force Representation and Computational Discretization Convergence

To perform this investigation, the accuracy of the magnetic force expression is assessed for gaps smaller than 1   m m . To this end, three forcing functions are investigated: a continuation of the 11th-order curve fit, an extrapolated power function and a constant 100   N force. These expressions can be seen graphically in Figure 5.
Figure 6 depicts the time histories of the absorber’s displacement for the differing forcing expressions. When looking at the transient portion in Figure 6a, it can be seen that the polynomial curve fit and the power function have similar shapes, which is expected, since the gap is still close to 1   m m away from the stationary magnet. The constant 100   N force sees a sharp decrease in amplitude. In the steady-state portion in Figure 6b, the polynomial curve fit does not prevent the repulsive magnets from coming in contact. In fact, the absorber pushes into and passes the stationary magnet. The power function behaves as physically expected where the repulsive magnets do not contact each other. Again, the 100   N force prevents the absorber from coming within 1   m m of the stationary magnet, and the strong force appears to cause the absorber to exhibit aperiodic behavior. Due to this, the power function is selected to represent the magnetic force when the gaps are smaller than 1   m m . The final expression of the magnetic force for the two magnets is expressed in Equations (20) and (21).
F m a g 1 t = 3 τ a 1 a 2 2 π d w 2 L s , t 4 f o r   d w 2 L s , t > 12   m m j = 0 11 p j d w 2 L s , t j f o r   1   m m d w 2 L s , t 12   m m 0.0023 d w 2 L s , t 0.9386 f o r   d w 2 L s , t < 1   m m          
F m a g 2 t = 3 τ a 1 a 2 2 π d w 2 L s , t 4 f o r   d + w 2 L s , t > 12   m m j = 0 11 p j d + w 2 L s , t j f o r   1   m m d + w 2 L s , t 12   m m 0.0023 d + w 2 L s , t 0.9386 f o r   d + w 2 L s , t < 1   m m            
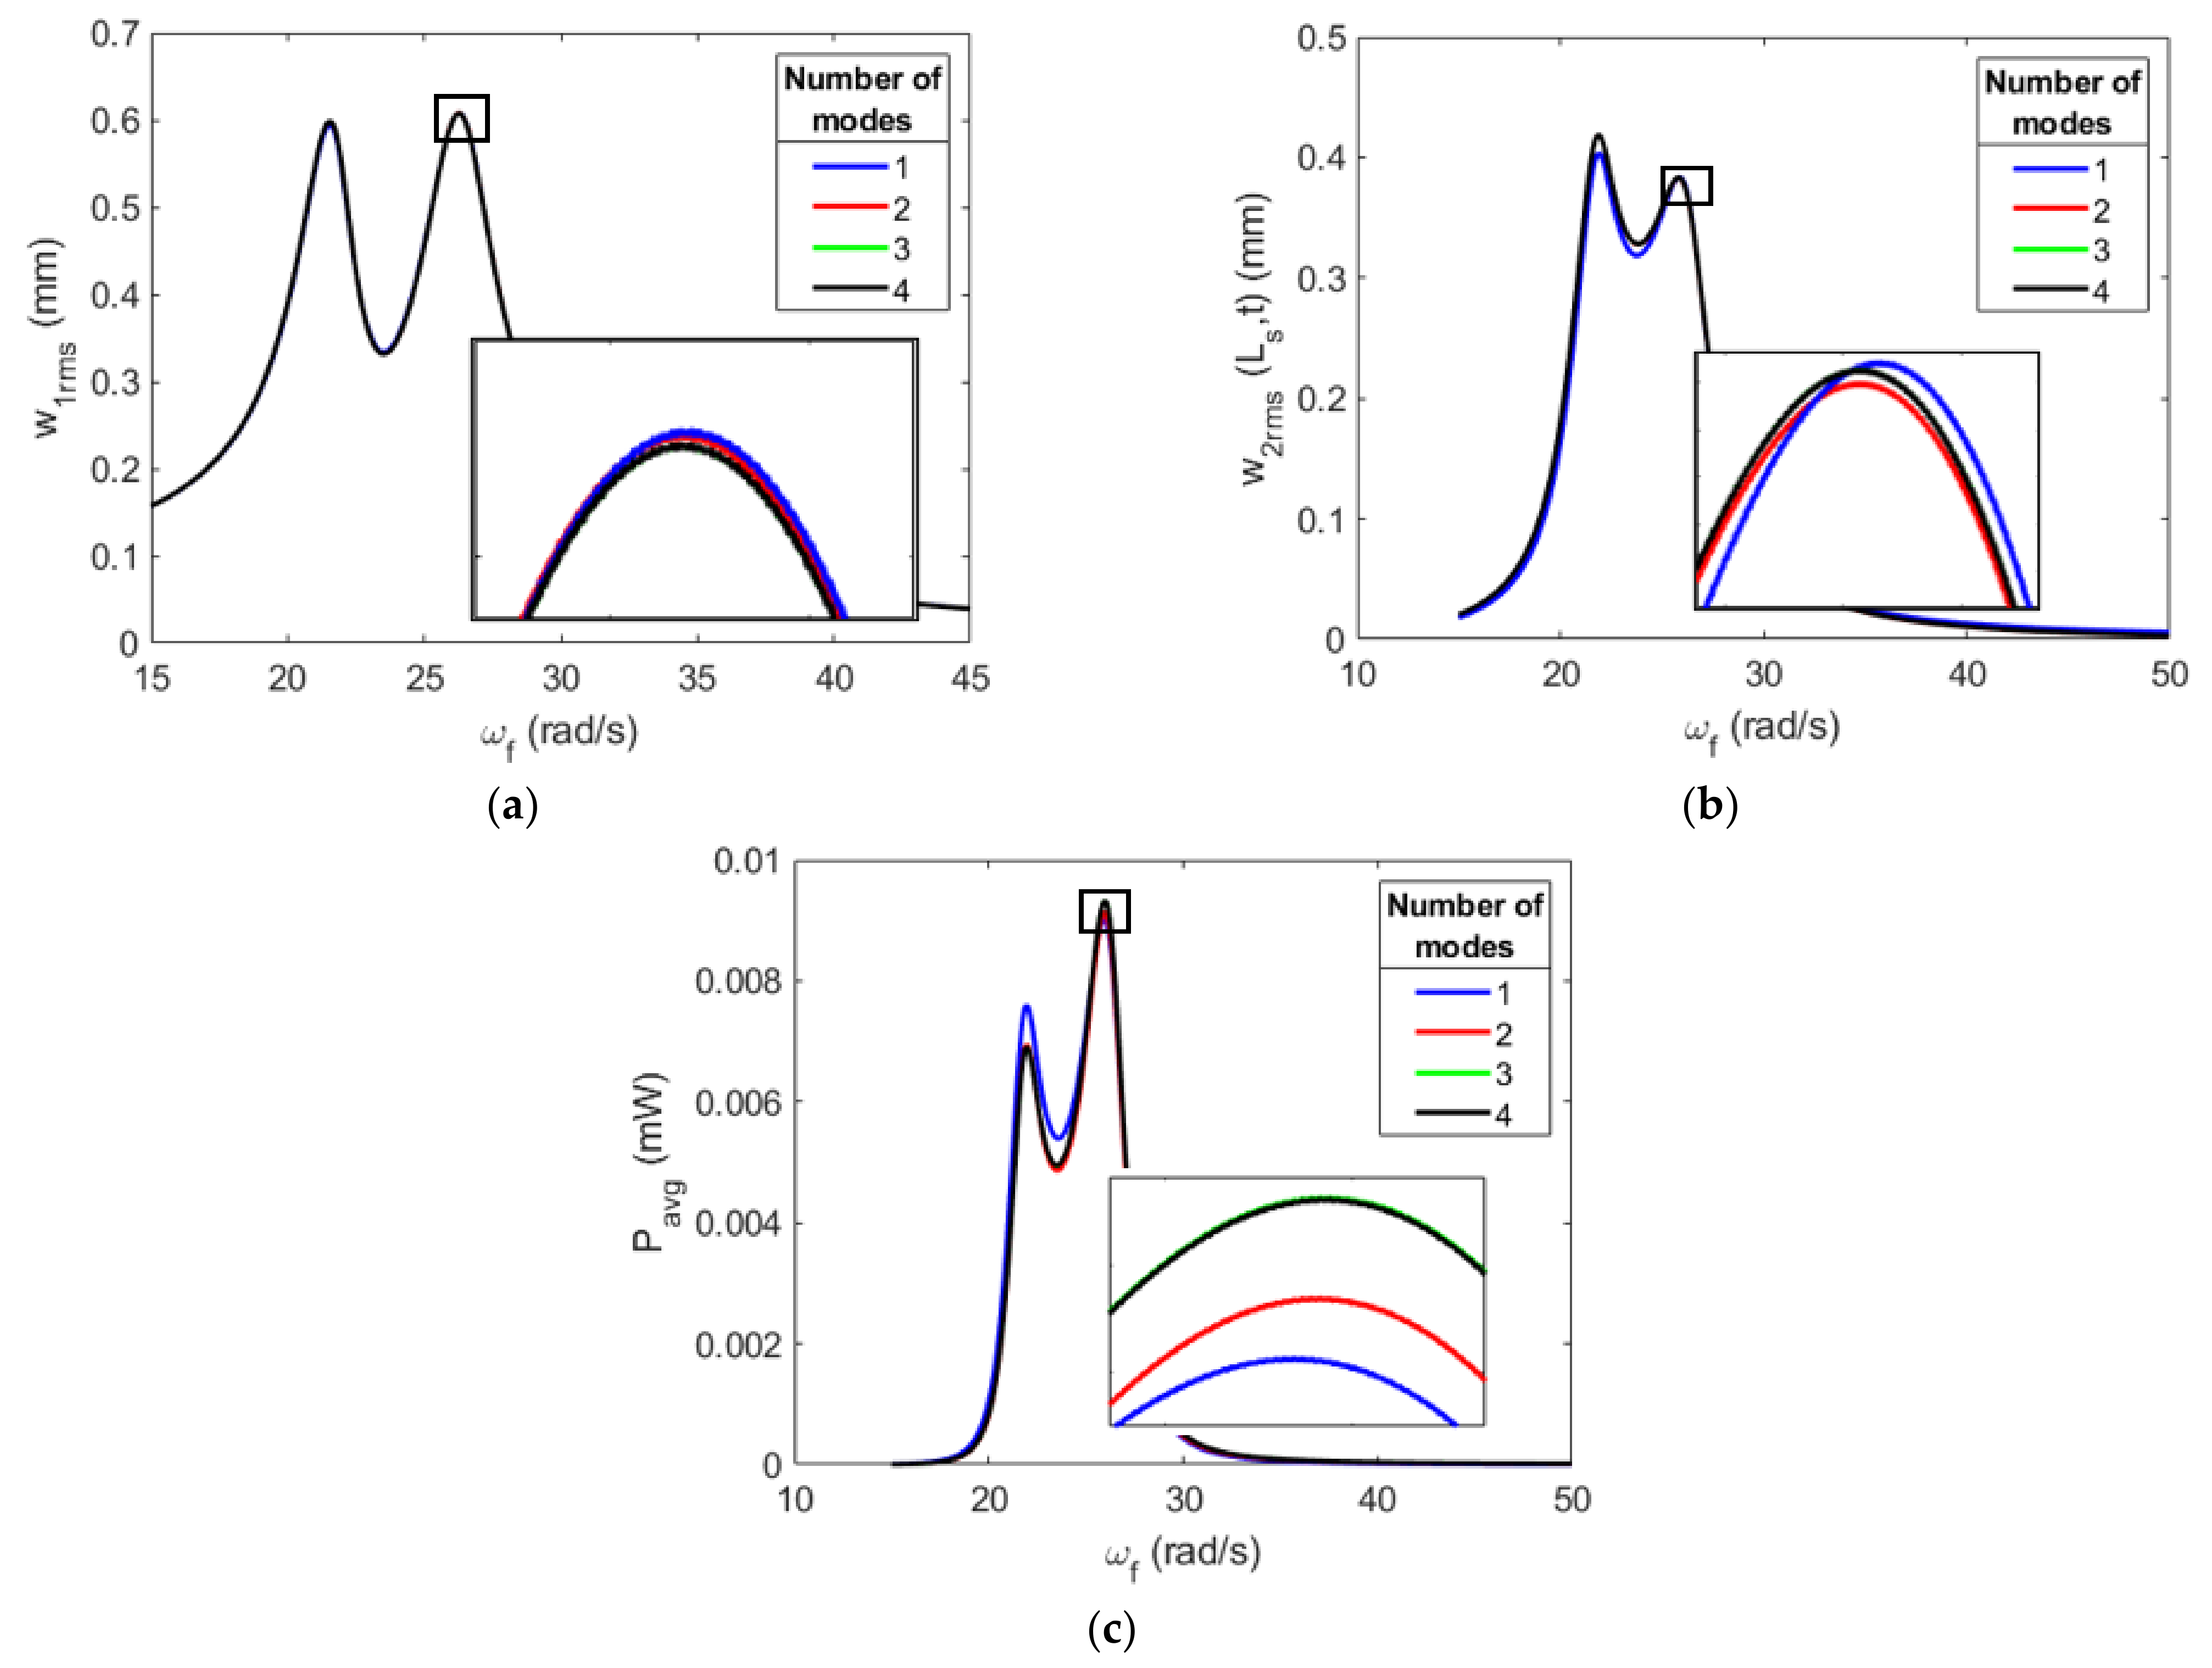
Next, a convergence analysis is performed to determine the number of modes that are required for accurate results. Figure 7 shows the primary structure’s displacement, the absorber’s displacement and the harvested power for various modes in the Galerkin discretization. The primary structure’s displacement has similar results for all modes. This result is similar to the absorber’s displacement. However, the three- and four-mode representations are nearly identical. The harvested power shows the most variance, although it is clear that the three-mode representation converges with the four-mode representation. These results indicate that three modes in the Galerkin discretization are adequate for accurately representing the absorber’s motion and levels of harvested power.

3.2. Attractive Stopper Configurations and System Performance

First, the potential energy is investigated to understand the stable points of the system, which is quite important for the attractive cases. To this end, the expression of the potential energy is derived from Equation (17) for an absorber with a single mode in the Galerkin discretization and is expressed in Equation (22).
Π = ω 2 r 2 2 + N m a g r d r        
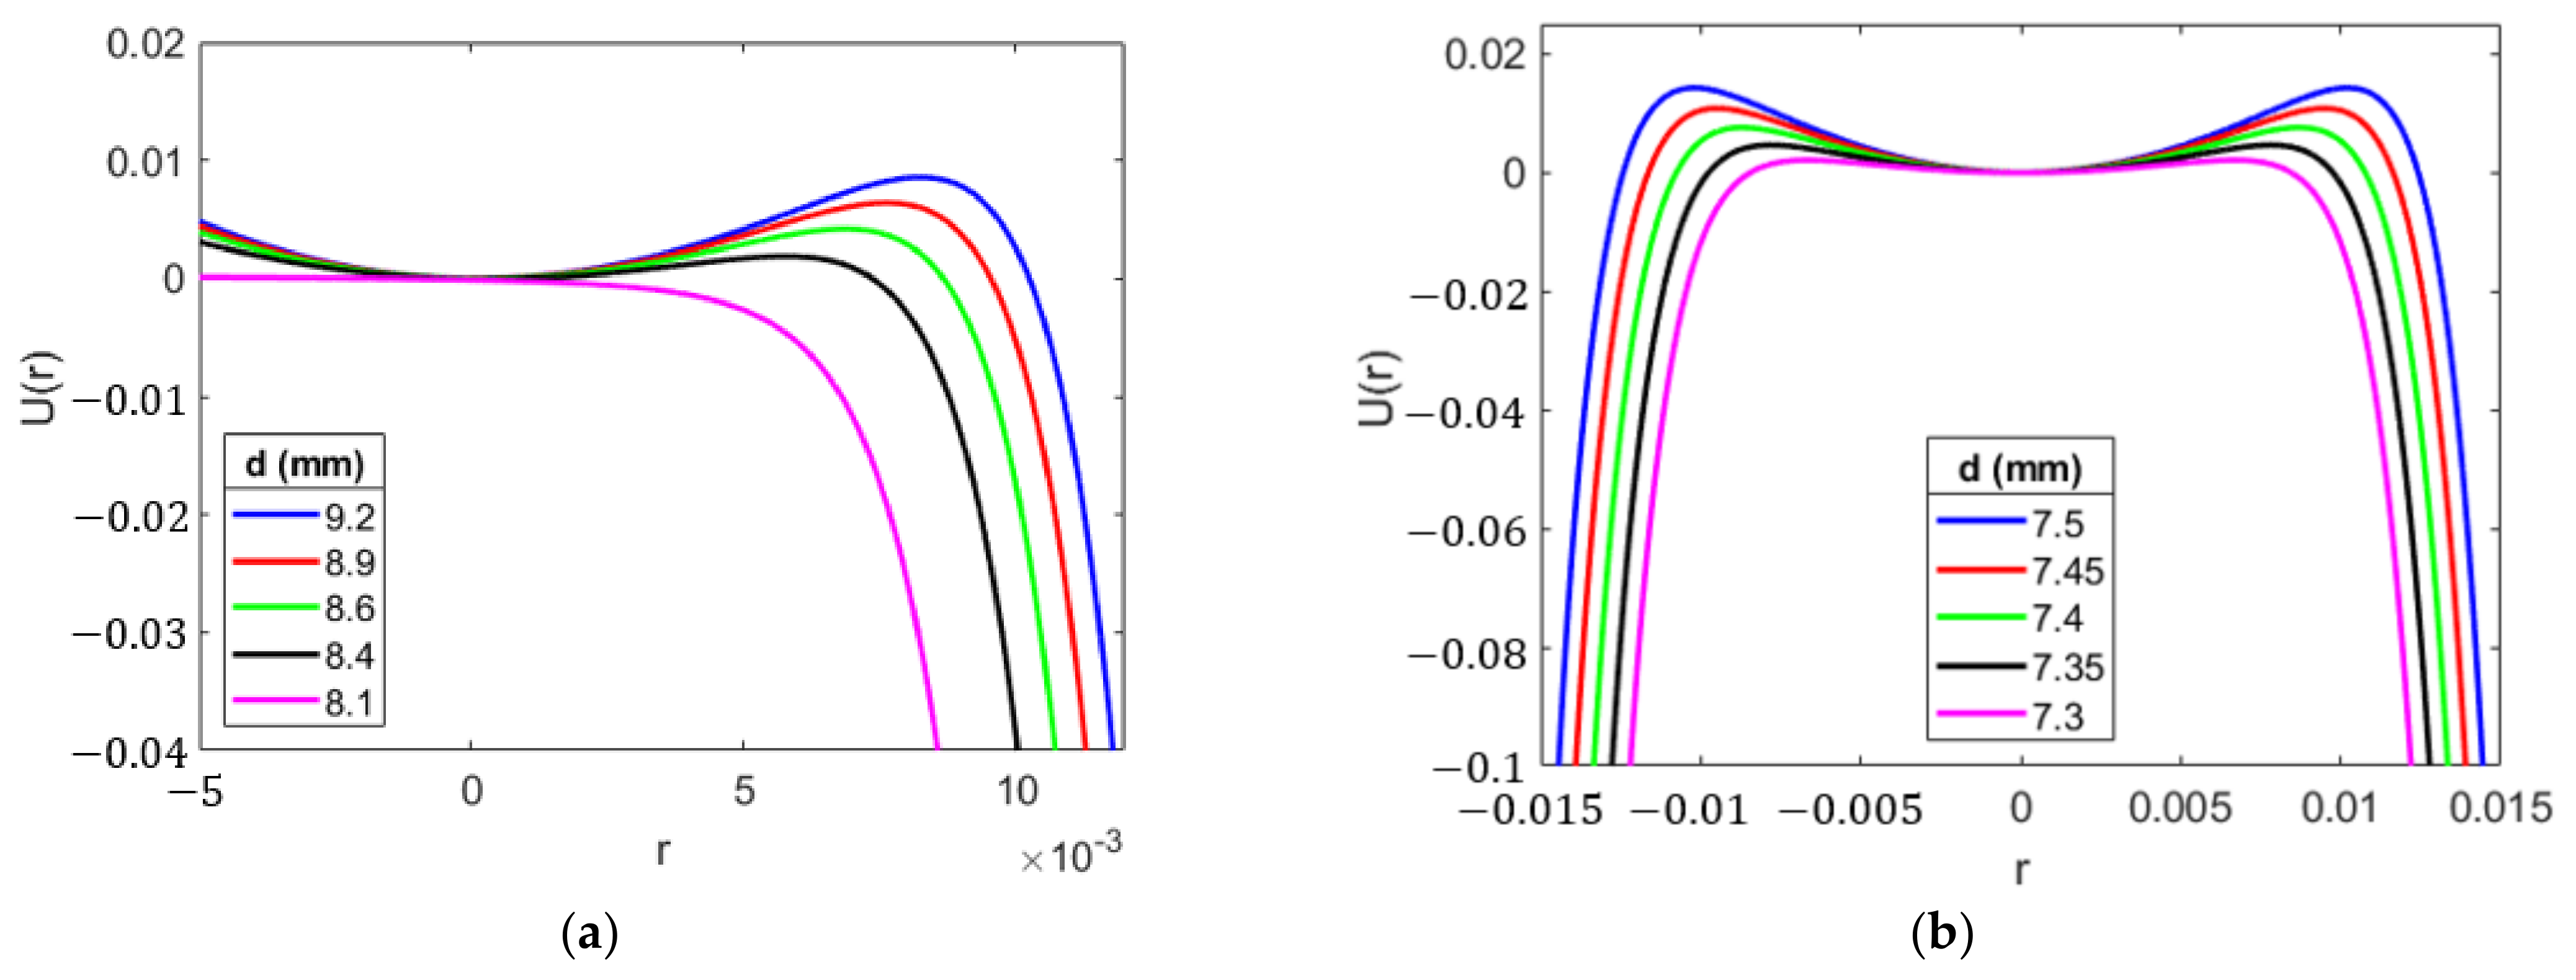
The potential energies are presented in Figure 8. With larger gaps, one stable and one unstable position are present for the single magnet configuration. As the gap decreases, the stable points decrease until there are no longer distinct points when the pull-in occurs, causing the entire system to become unstable. This instability is clearly shown in Figure 9, which depicts phase portraits for large gaps and the critical pull-in gap size for both single and double magnet configurations. As seen in the large gaps in Figure 9a,c, stable regions exist as the black dashed lines oscillating within the separatrix in blue. Once enough energy is introduced into the system, the system is unstable, oscillating on the outside of the separatrix, seen as the red dashed lines. The critical gaps in Figure 9b,d show that the stable regions of the separatrix have collapsed to a single point; thus, only unstable regions are present.
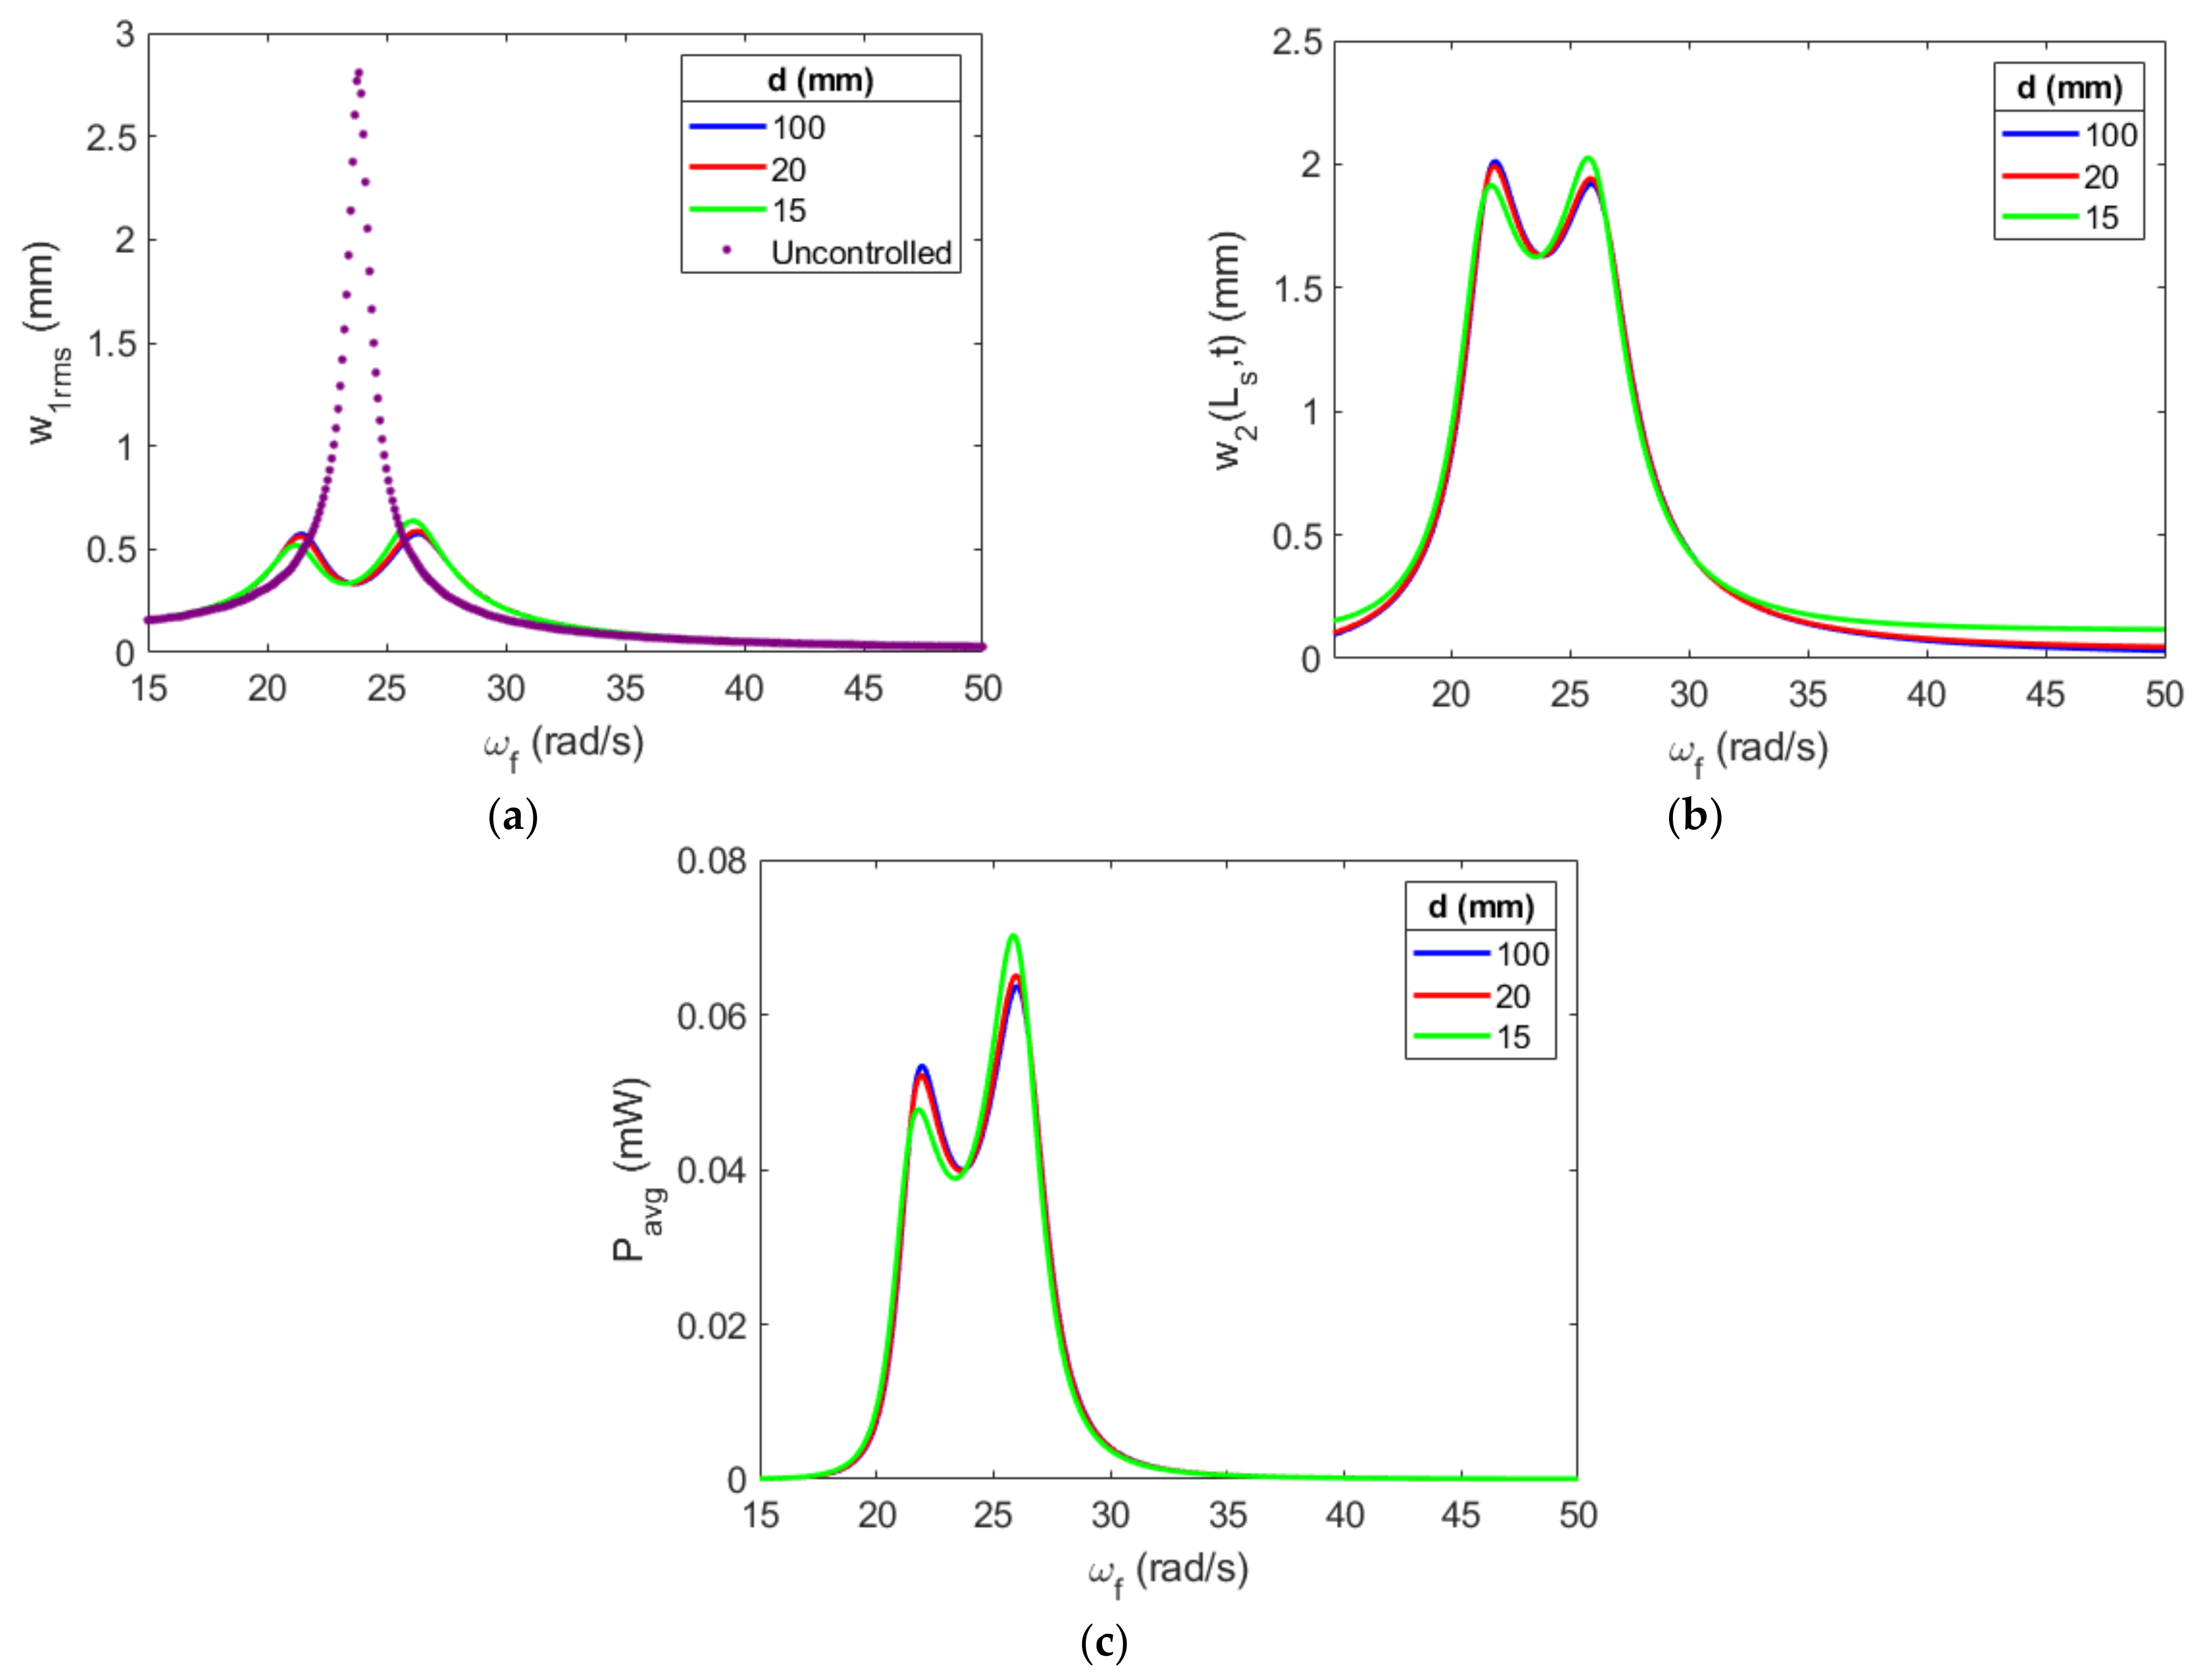
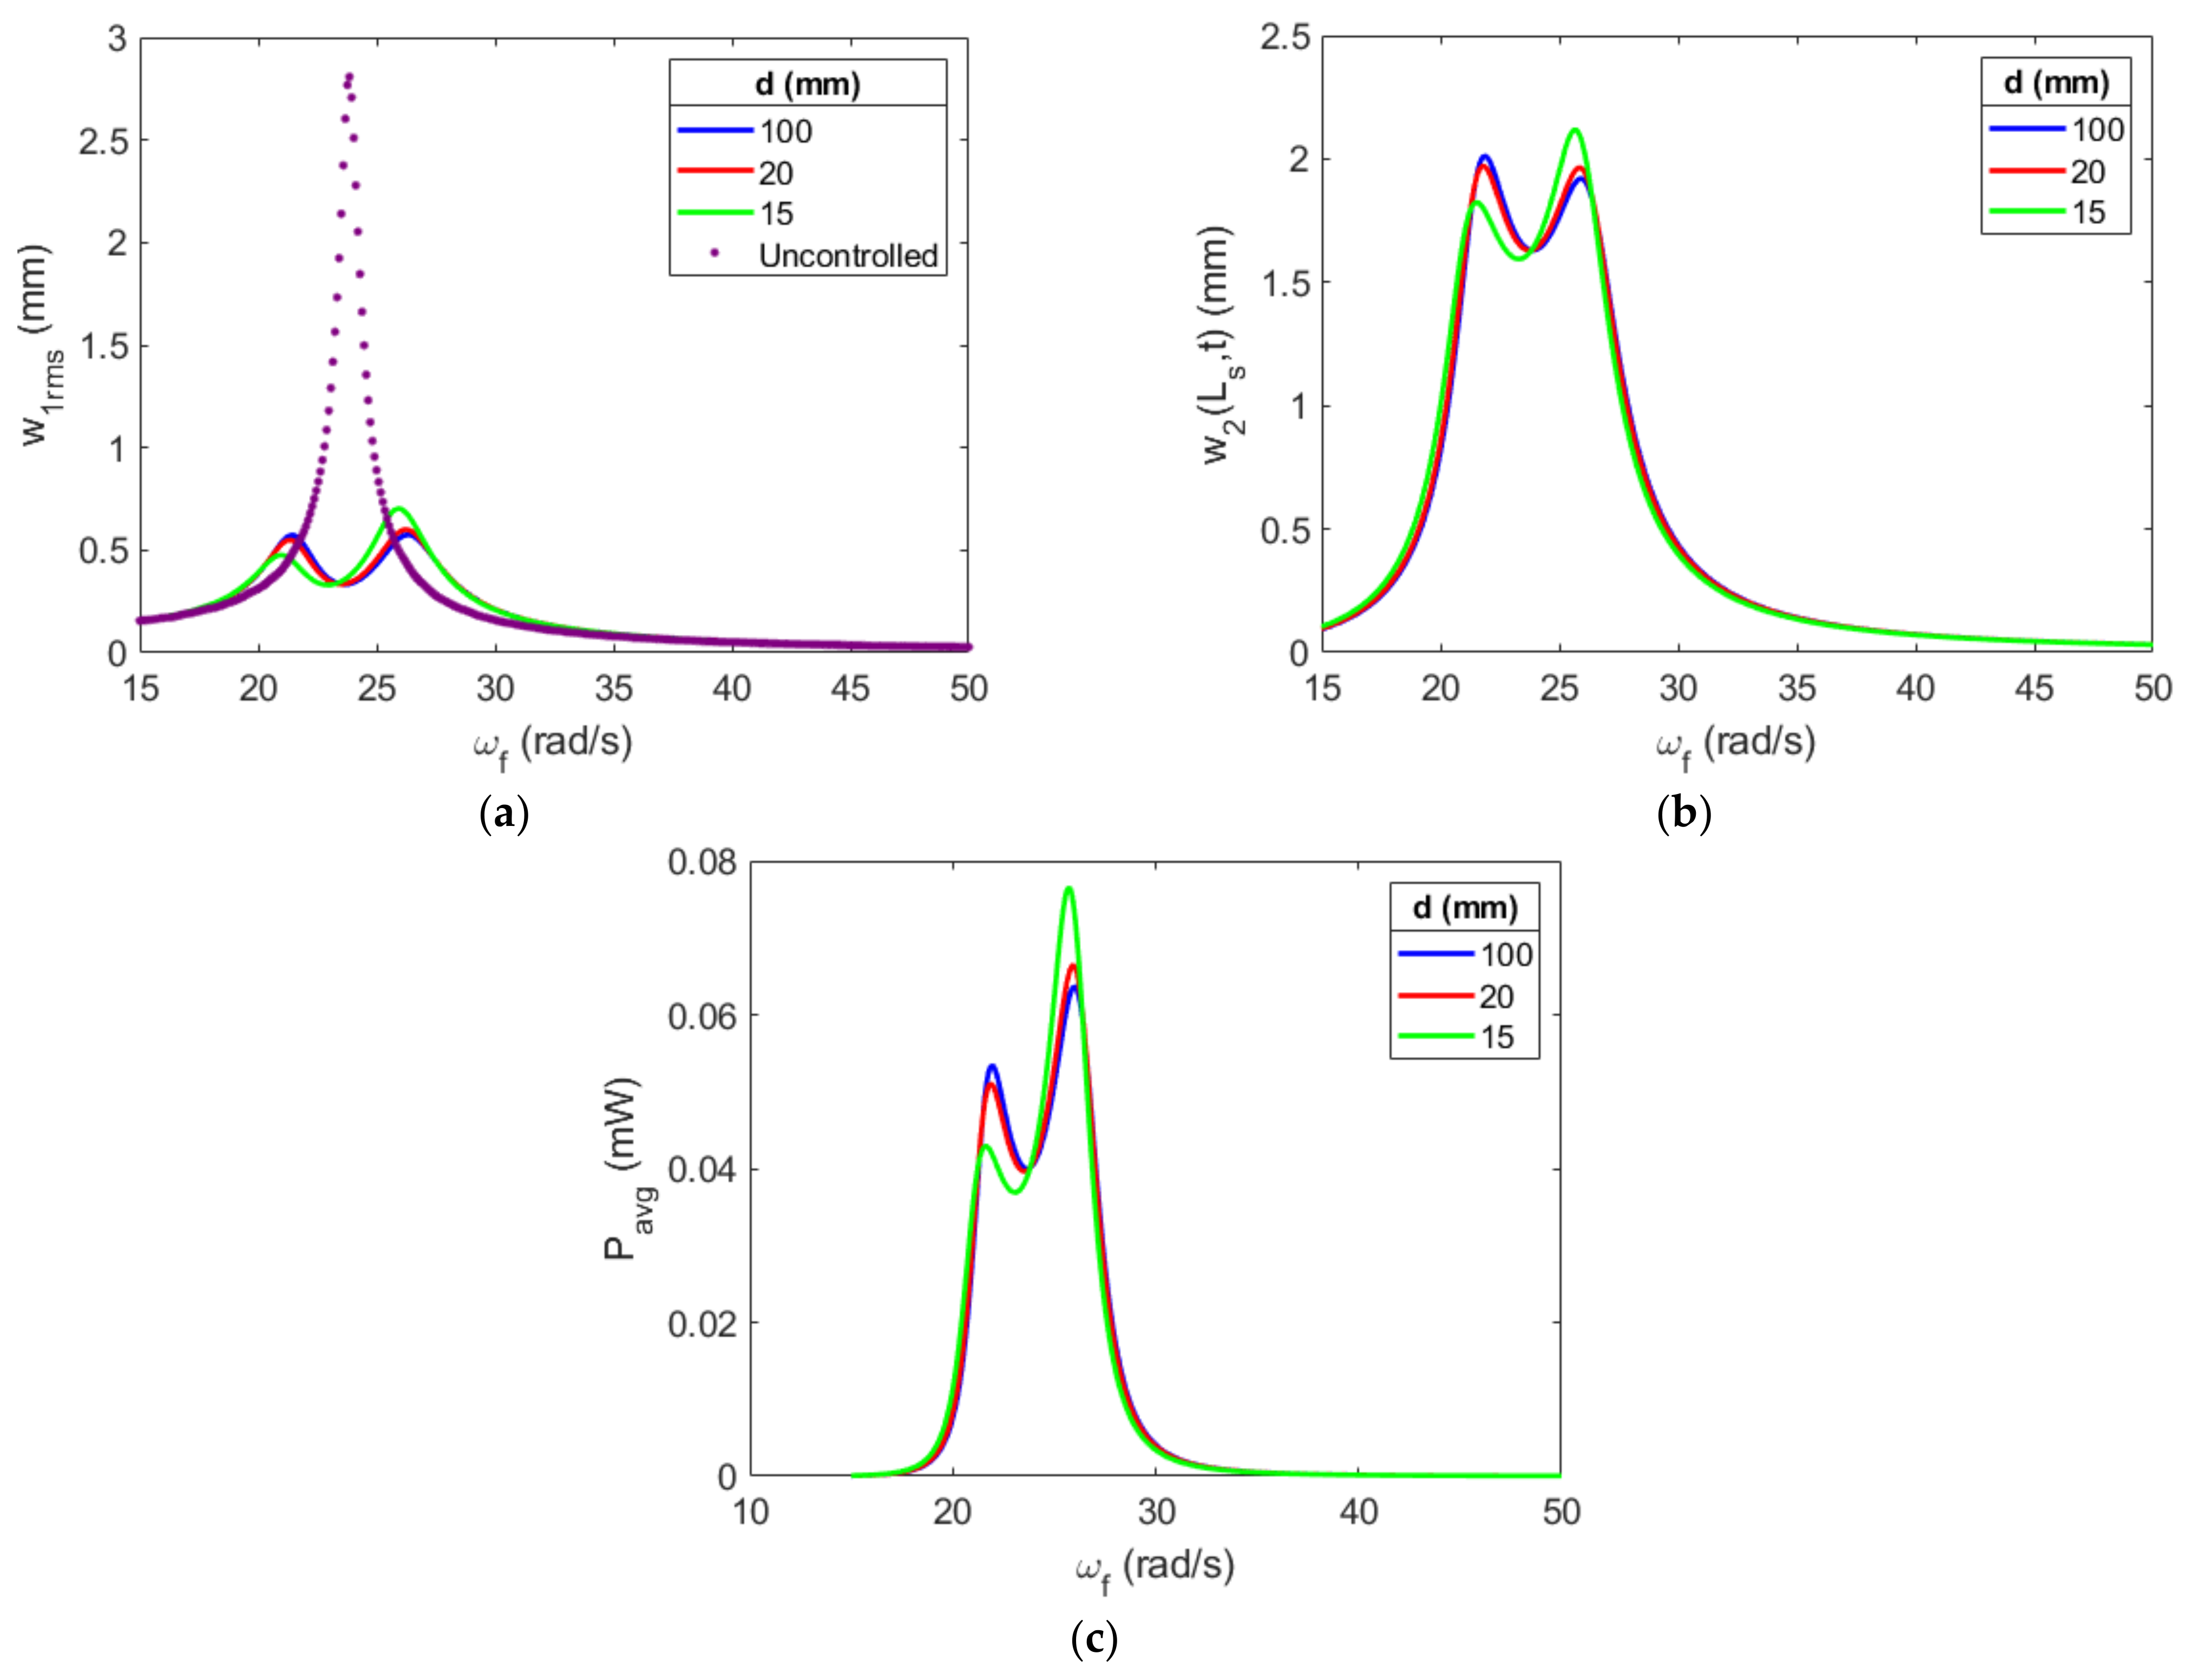
The primary structure’s displacement, the absorber’s displacement and the average power harvested are investigated in Figure 10 to analyze the effectiveness of the single attractive magnet configuration. The primary structure’s displacement is the most important parameter because the primary goal of including the absorber is to eliminate or reduce harmful resonant oscillations. The energy harvested is a secondary goal, while the absorber’s displacement helps understand the system’s behavior. Three gap sizes are investigated, the largest gap being 100   m m , representing the system without magnets. The smallest gap size is 15   m m because smaller gaps induce dynamic pull-in. The critical gap size that induces dynamic pull-in is not identified, but the behavior change is so minimal that evaluating the system at the critical gap size would not greatly increase the levels of power generated. As mentioned before, the gap size of 15   m m only increases the peak and average power by 10% and 0.58%, respectively. The primary structure’s displacement is greatly controlled, but the interaction with the magnets is not strong, so a large change is not expected.
The double magnet configuration, seen in Figure 11, is investigated similarly to the single magnet configuration. In fact, the two configurations have very similar results. Again, the smallest gap size investigated is 15   m m . However, this configuration has a stronger effect on the system than the single magnet configuration due to the static magnetic force lowering the coupled natural frequencies. However, the peak and average powers only increase by 6 × 10 3   m W and 1.3 × 10 5   m W , respectively, from the single magnet configuration. The primary structure’s amplitude is efficiently controlled by reducing the primary structure’s amplitude by 75%, which is 5% worse than the configuration without magnets. The small increase in power is a great result but may not be large enough to justify the cost of the additional components. The repulsive magnet configurations will be able to use smaller gap sizes, which may allow the generation of more power.

3.3. Repulsive Stopper Configurations

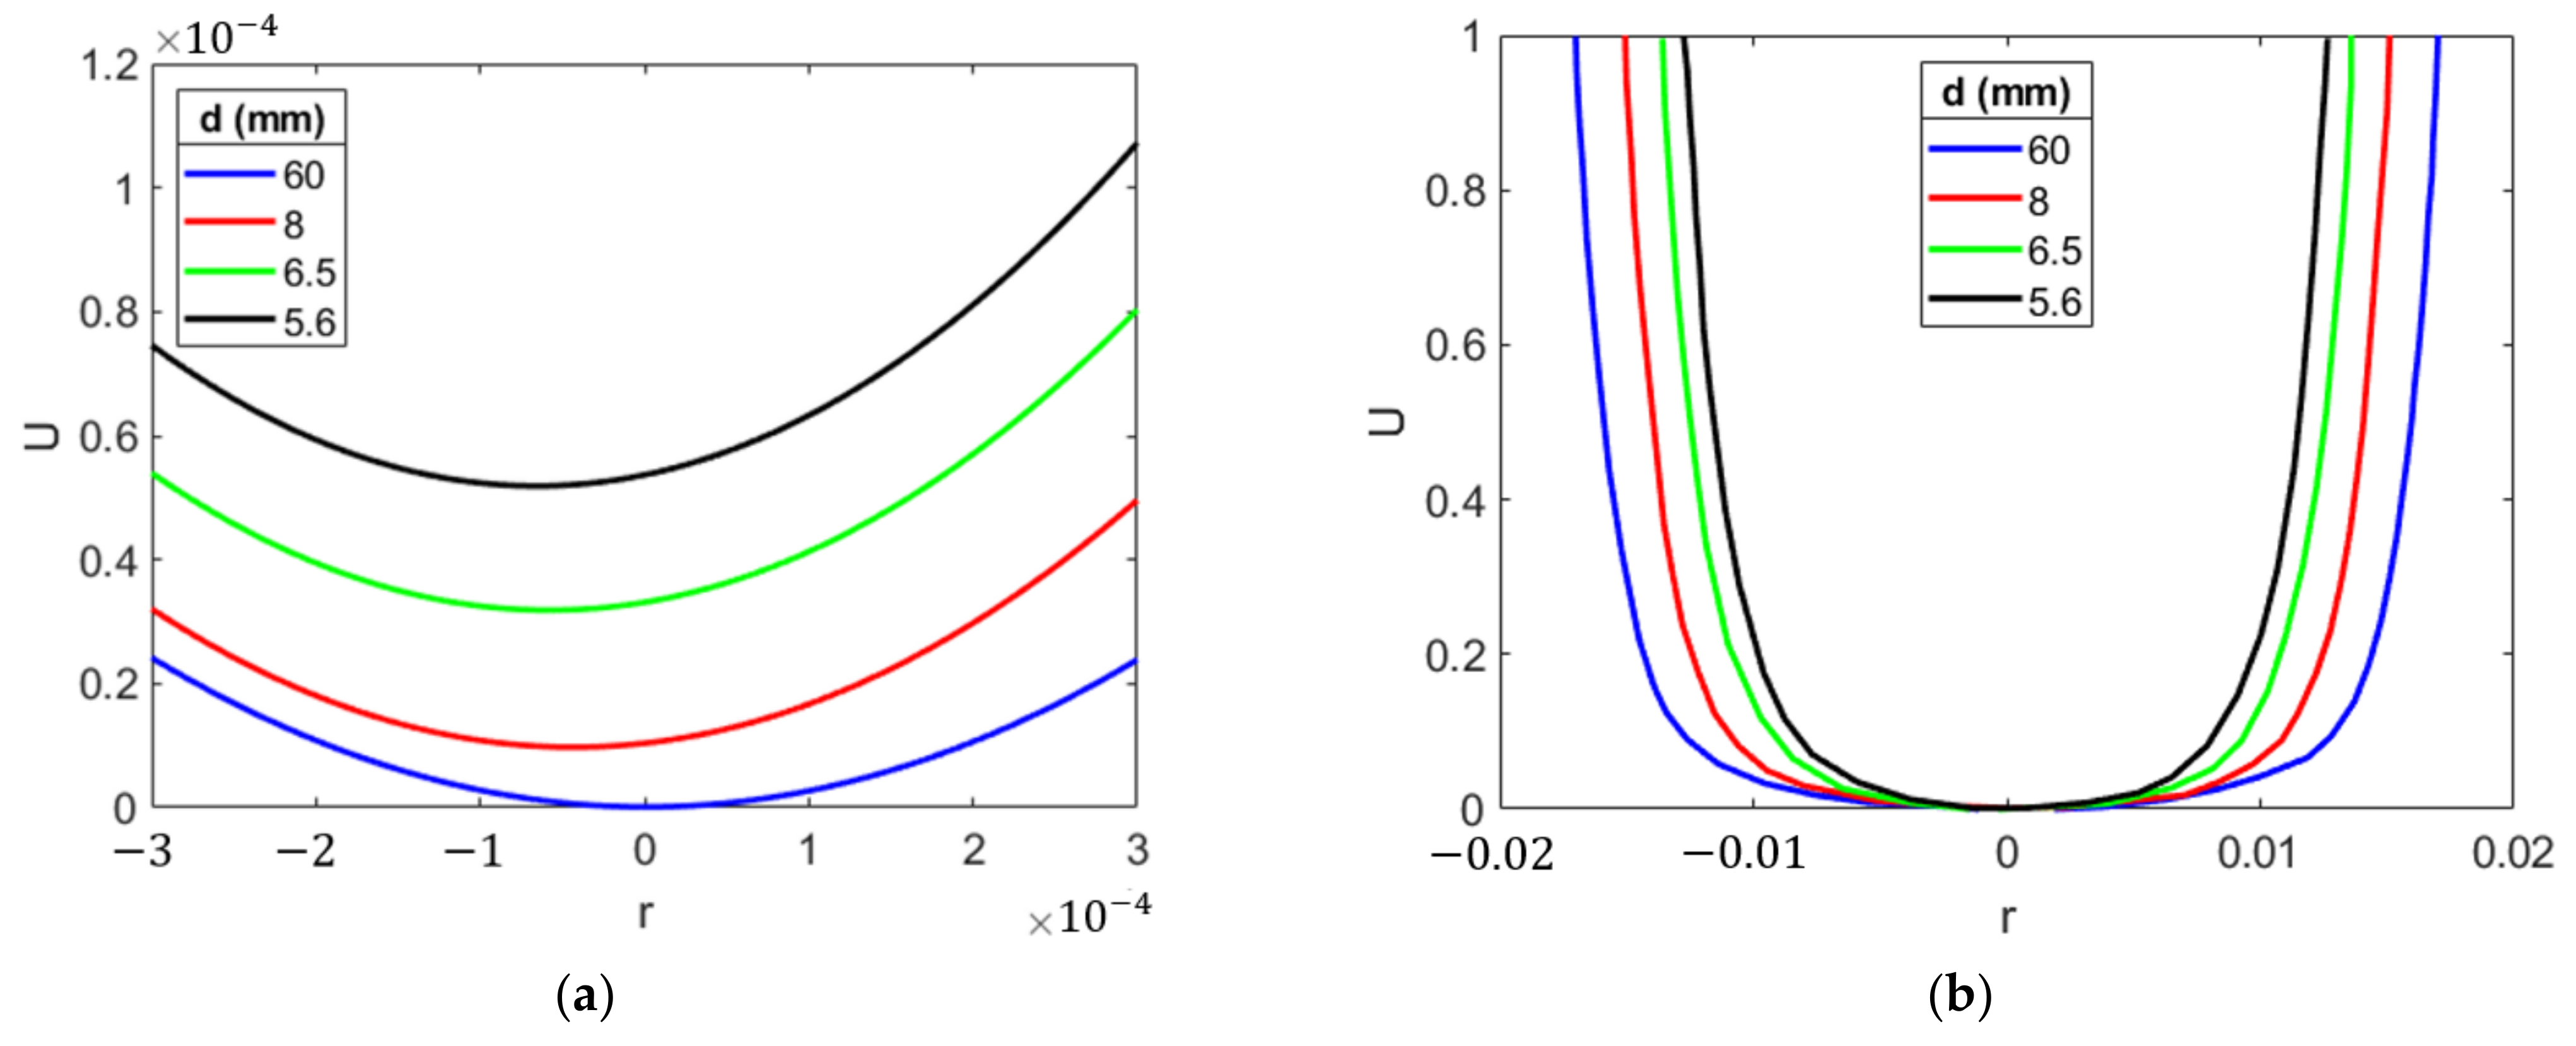
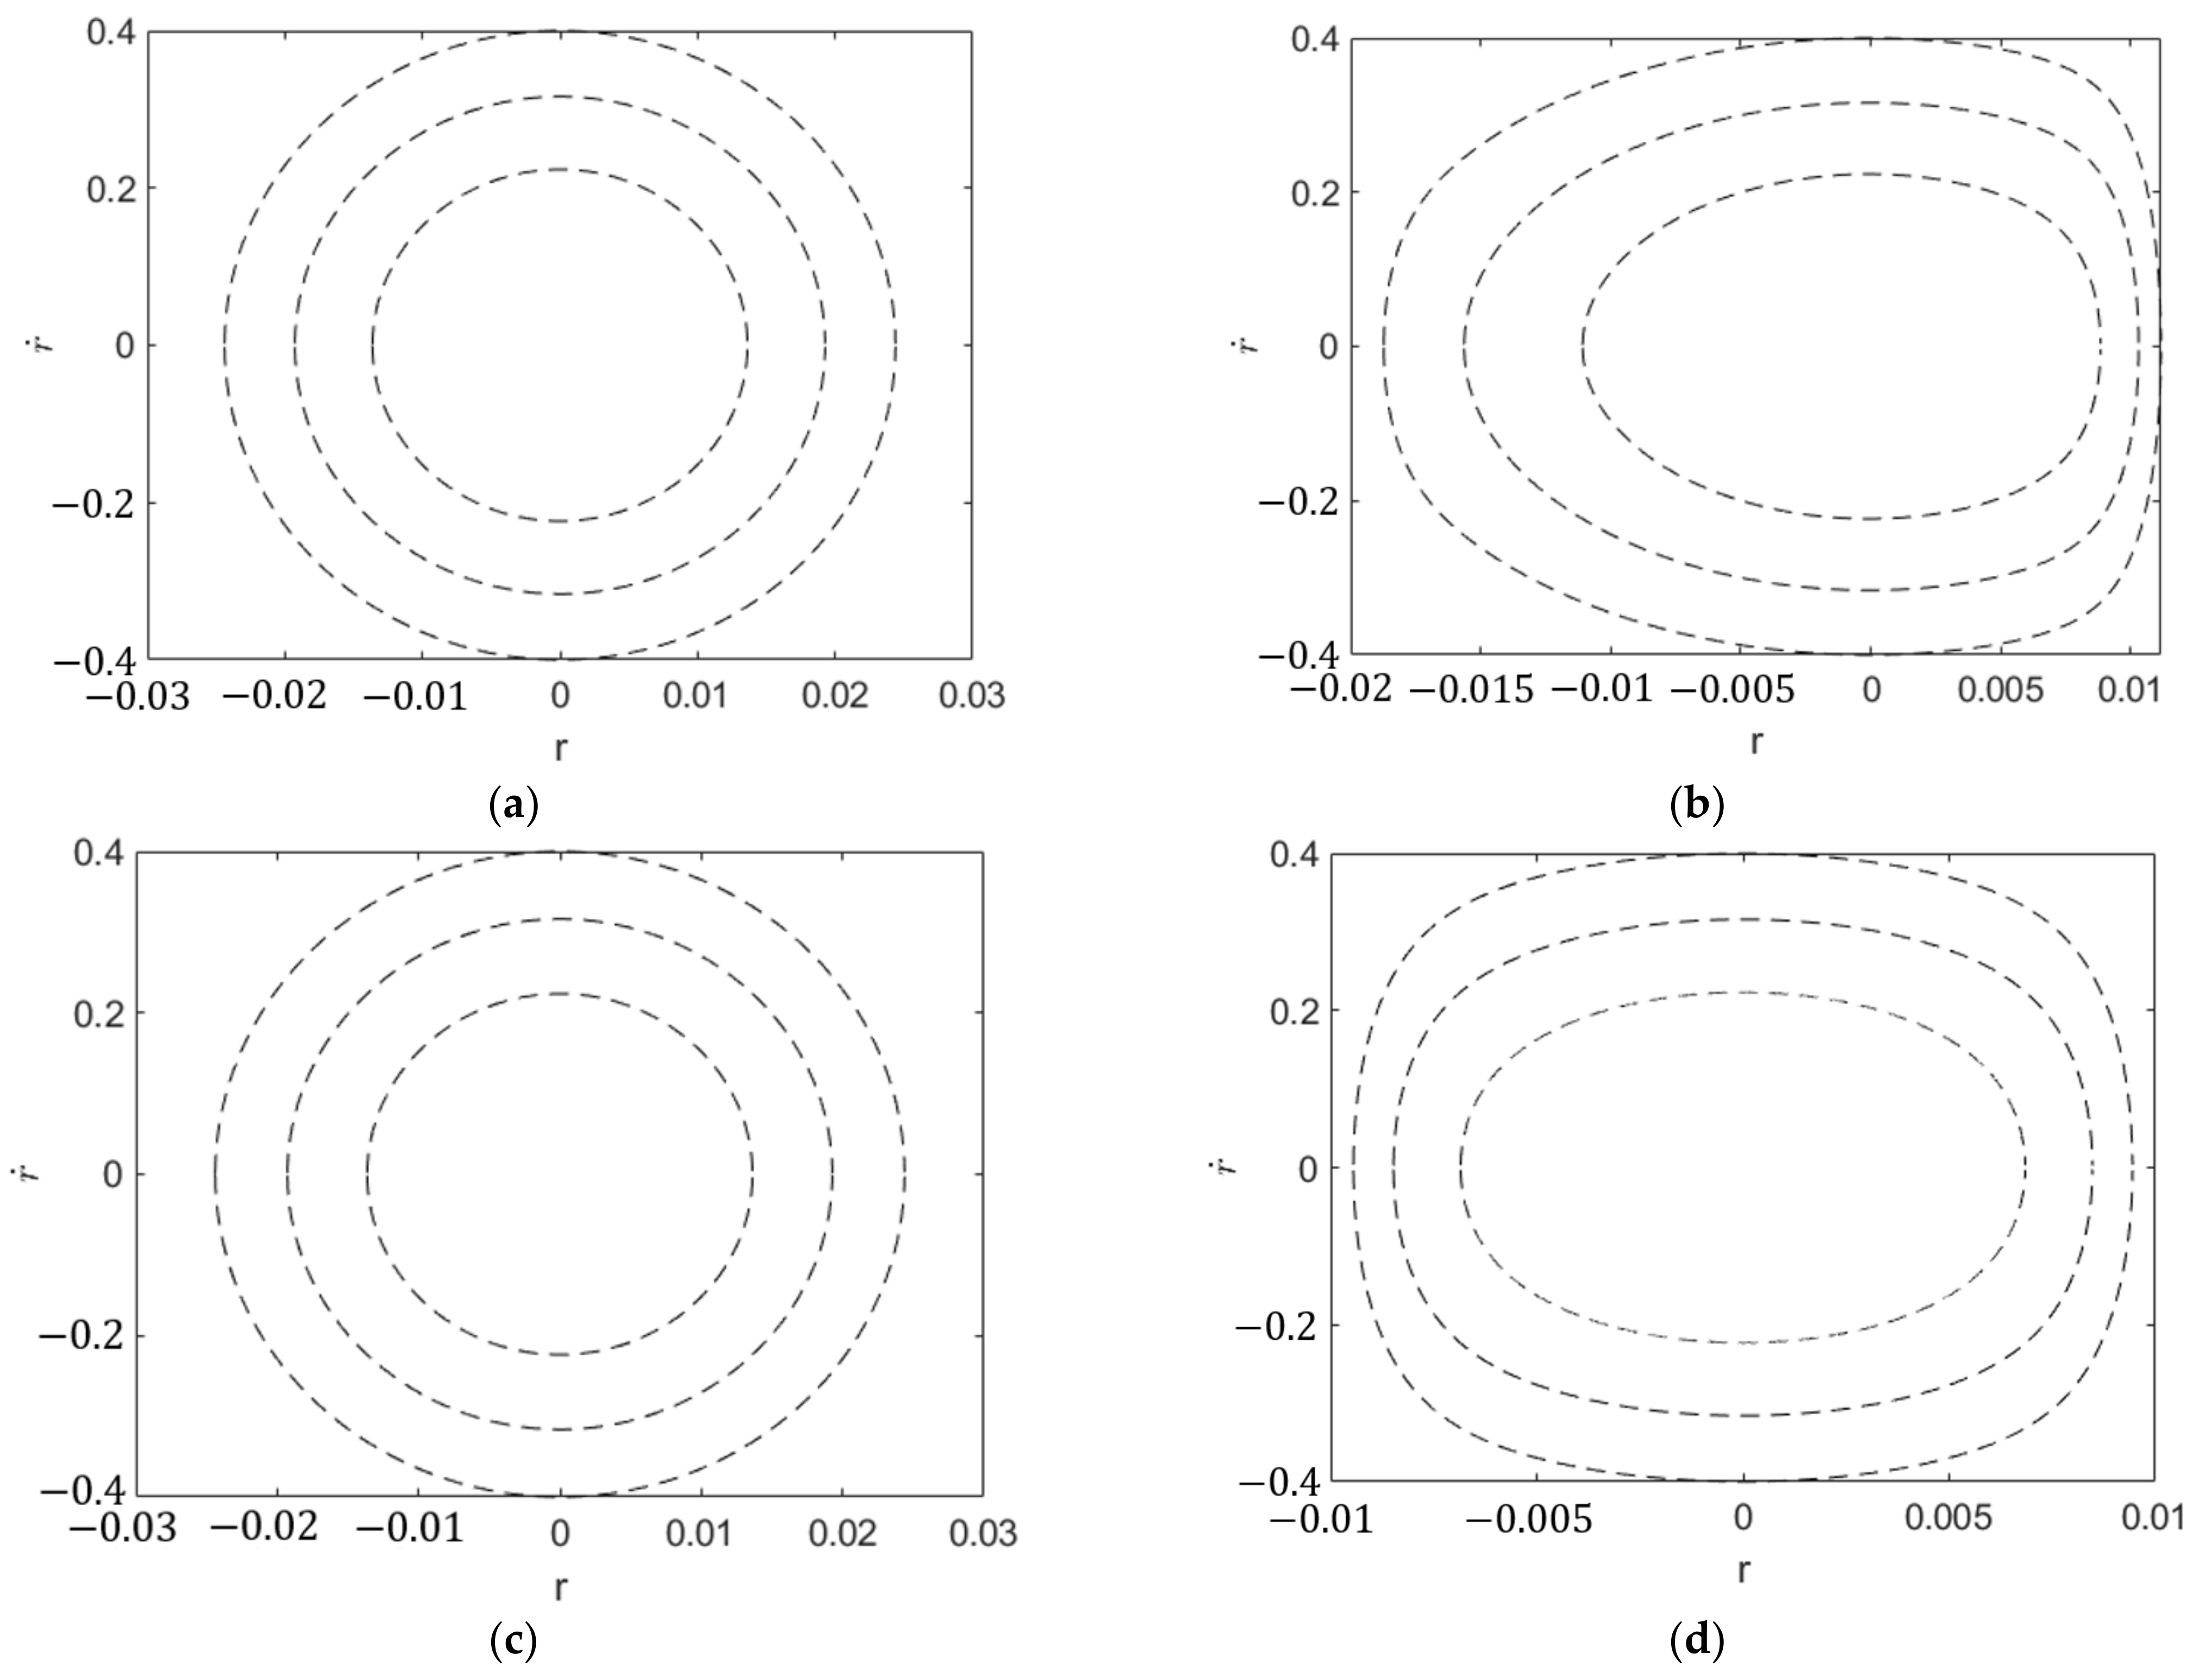
Figure 12a depicts the potential energy for the repuslive single magnet configuration. As expected, there is a single stable point for each gap, without the possibility of static pull-in occurring. Additionally, the change in static position can be seen as the center of the well shifts to the left as the initial gap decreases. The double magnet configuration in Figure 12b is symmetrical due to the symmetrical gap and magnetic composition. Clearly, the larger gaps have wider wells, allowing for more displacement in the system. Figure 13 shows phase portraits for two gaps for both the single and double magnet configurations. The large gaps seen in Figure 13a,c do not have any interactions with the magnets and produce circular orbits. As the gap size decreases, the magnets affect the position of the absorber for lower levels of energy and clearly affect the absorber’s orbit.
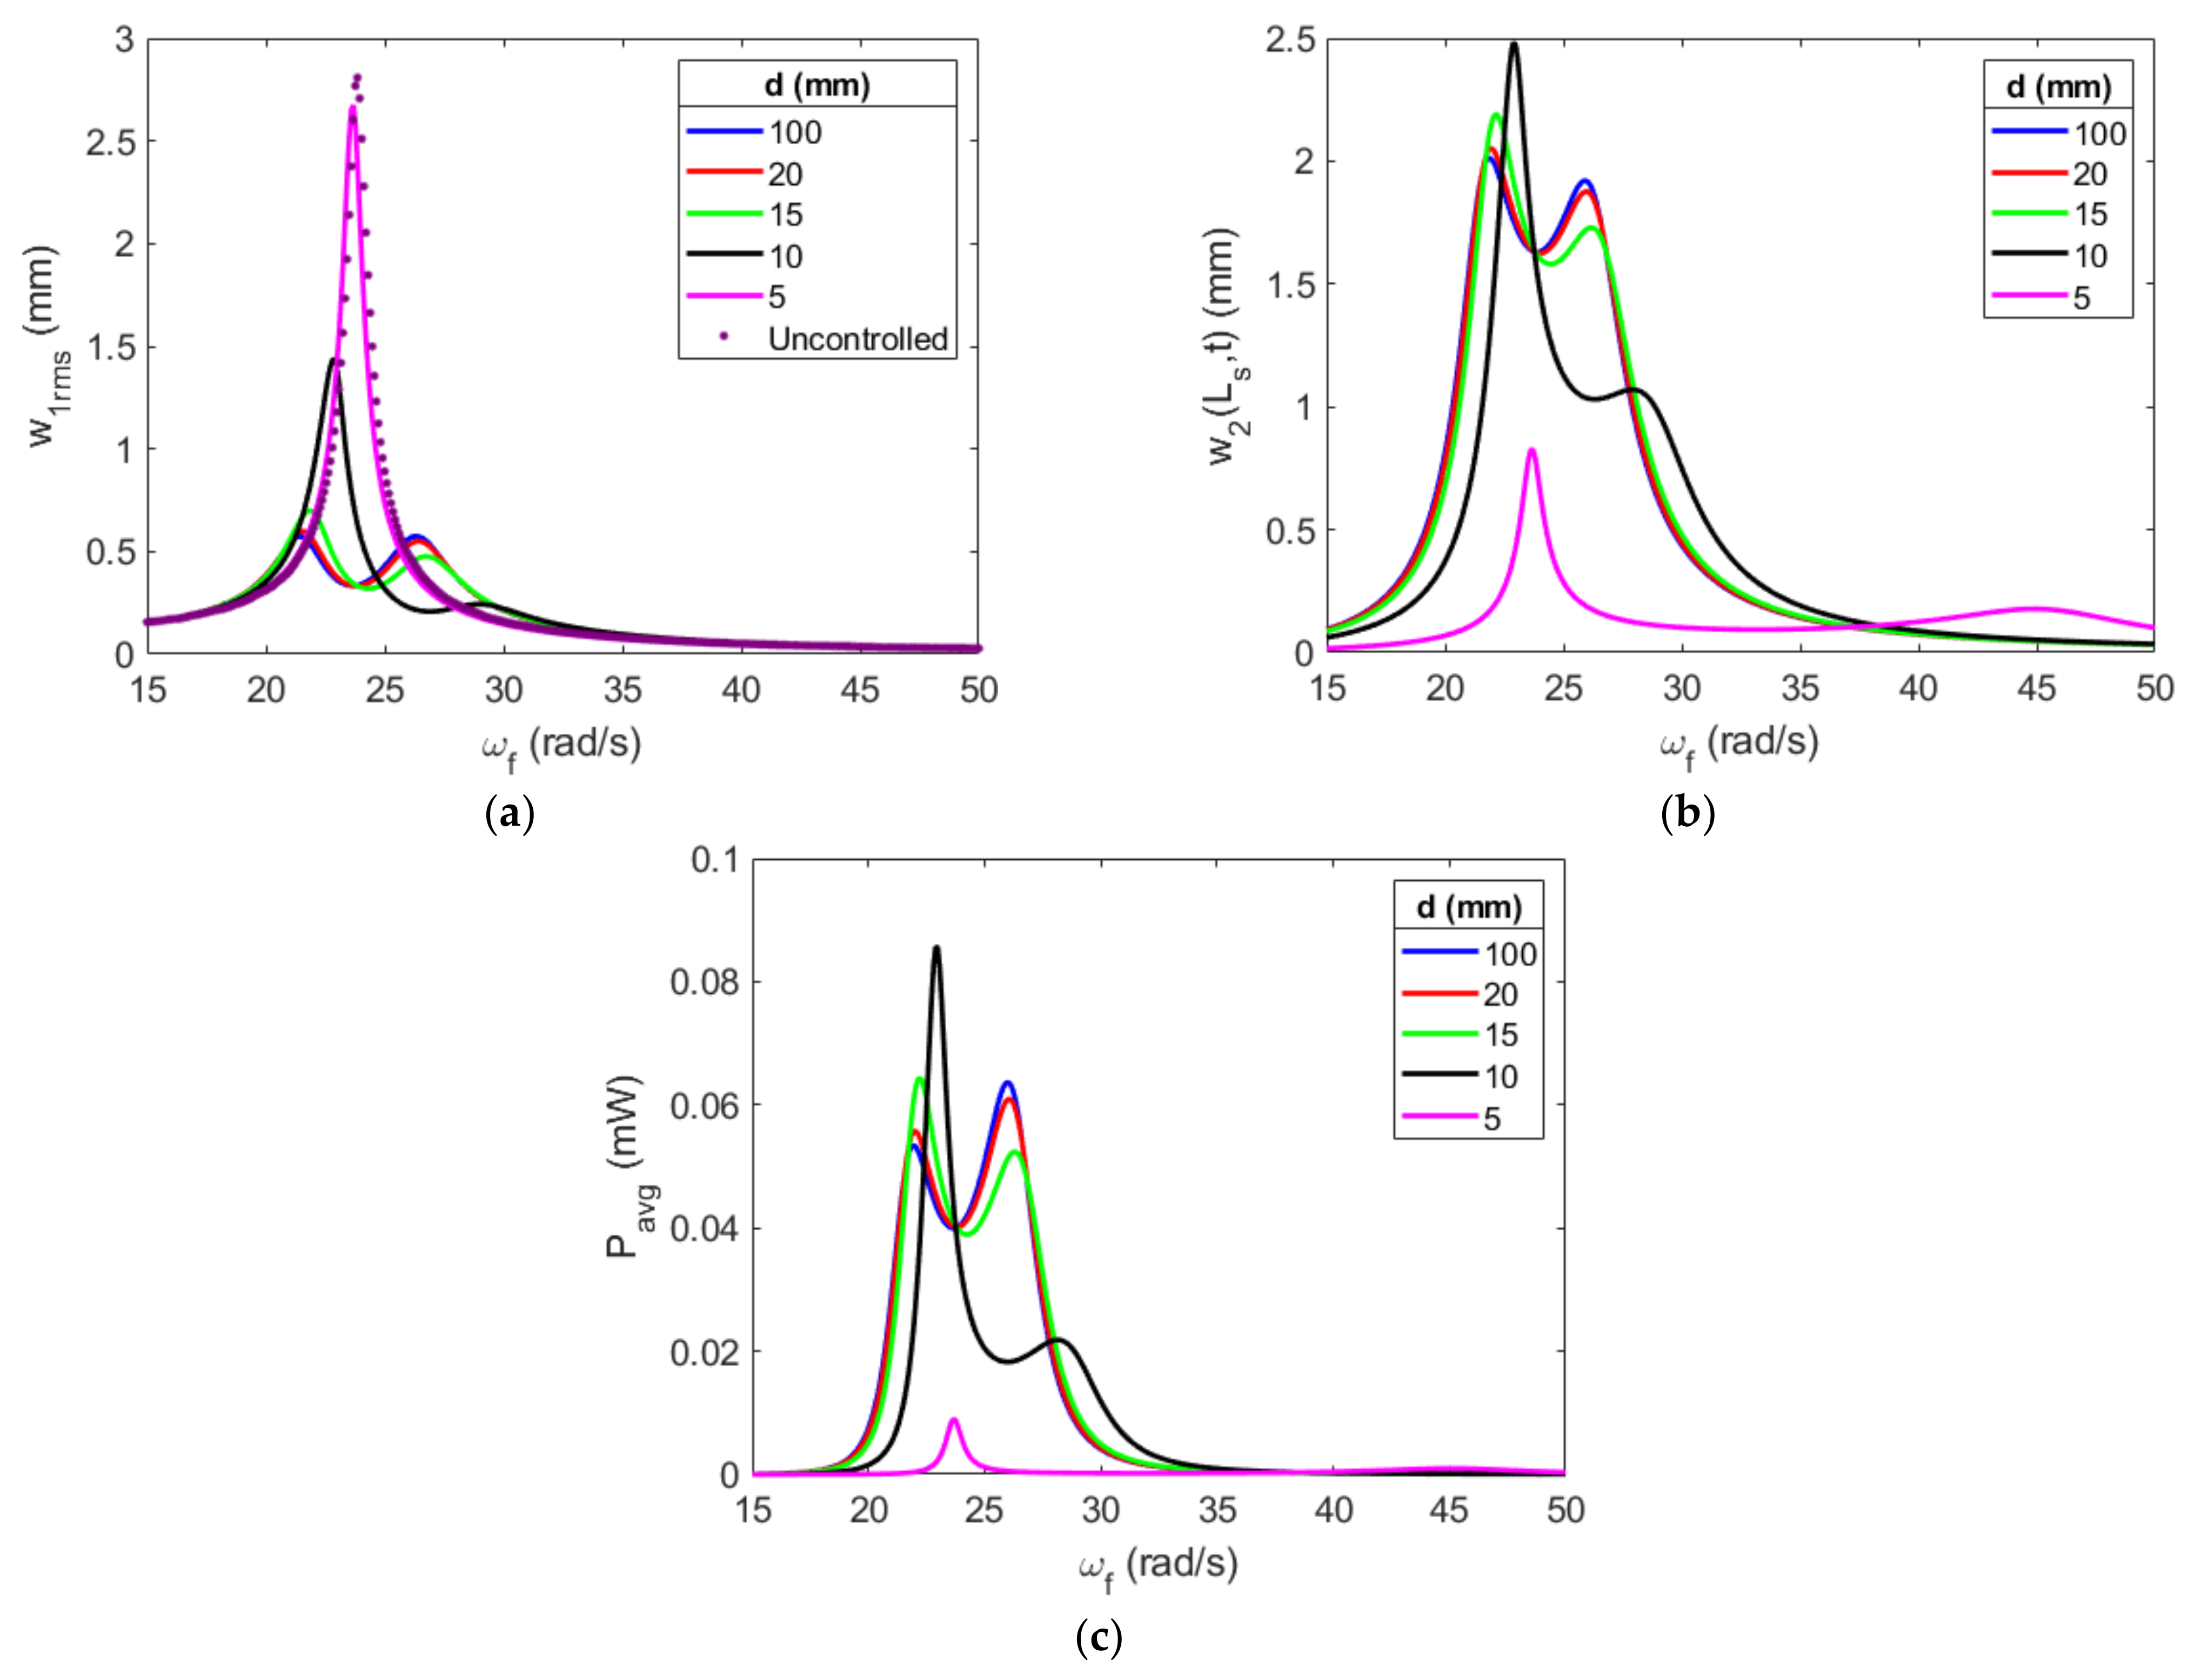
The primary structure’s displacement, the absorber’s displacement and the average power generated for the single magnet configuration are displayed in Figure 14. The static position of the absorber is clearly increasing as the gap decreases in size. The maximum absorber displacements for gaps of 10   m m and 5   m m are very similar, even though the static positions are quite different. This similarity indicates that the magnets are having a stronger effect on the static position and natural frequency of the absorber than they are on the dynamic behavior of the system. This result is also explained by the absorber not coming close to the stationary magnet, where even for the smallest gap of 5   m m , the absorber is still at least 2   m m away from the stationary magnet. Additionally, a gap of 5   m m induces a shift in frequency. This shift in frequency affects the coupling between the primary structure and the absorber, which impacts the absorber’s ability to dissipate the primary structure’s oscillations. This change is clearly seen in Figure 14a, where the first resonant peak is nearly equal to the primary structure’s uncoupled natural frequency. The larger gaps, with much better coupling, have relatively equal peaks, which are farther away from the uncoupled natural frequency. This slight decoupling also affects the average power generated, producing nearly half of the power, on average, of the configuration without magnets. The 10   m m gap observes a large increase in peak power over the configuration without stoppers, but the decrease in the second resonant peak prevents the average power from increasing.
For the double repulsive configuration, as presented in the plotted frequency response functions in Figure 15, the double magnet configuration has a stronger hardening effect on the natural frequencies. At a gap of 5   m m , the coupled natural frequency dominated by the absorber occurs at 45   r a d / s , which completely decouples the two systems. The absorber only controls 4.8% of the primary structure’s oscillations. The gap of 10   m m generates higher absorber displacement than it does for the single magnet configuration, although only slightly. This also sees an increase in peak power; the shift in frequency decreases the second resonant peak by 0.018   m W , thus decreasing the average power by 20 % over the single magnet configuration. The frequency shift makes it difficult to compare these smaller gaps’ performance to the larger gaps. Therefore, the absorber’s parameters will be adjusted in Section 4 to effectively calibrate the coupling in the system for great comparisons between gaps. For comparison, all of the quantities of interest for all configurations of the frequency responses in Section 3 are tabulated in Appendix A.

4. Effective Design of Repulsive Magnetic Configurations

Before investigating the effects of the absorber’s parameters on the overall performance of the coupled system, a linear analysis is first performed to assess the impact of the various parameters of the system’s coupled damping and natural frequencies when repulsive magnetic configurations are considered. Previous studies have shown that the load resistance has a strong effect on the system’s linear characteristics [33,36]. To this end, an eigenvalue analysis of the electrical load resistance is performed in Figure 16. In the coupled damping, it is clear that the peak damping is shifting to the left as the gap size decreases. This peak damping generally produces the maximum power due to the shunt damping effect, so it is important to effectively select the load resistance for the initial gap of the system.
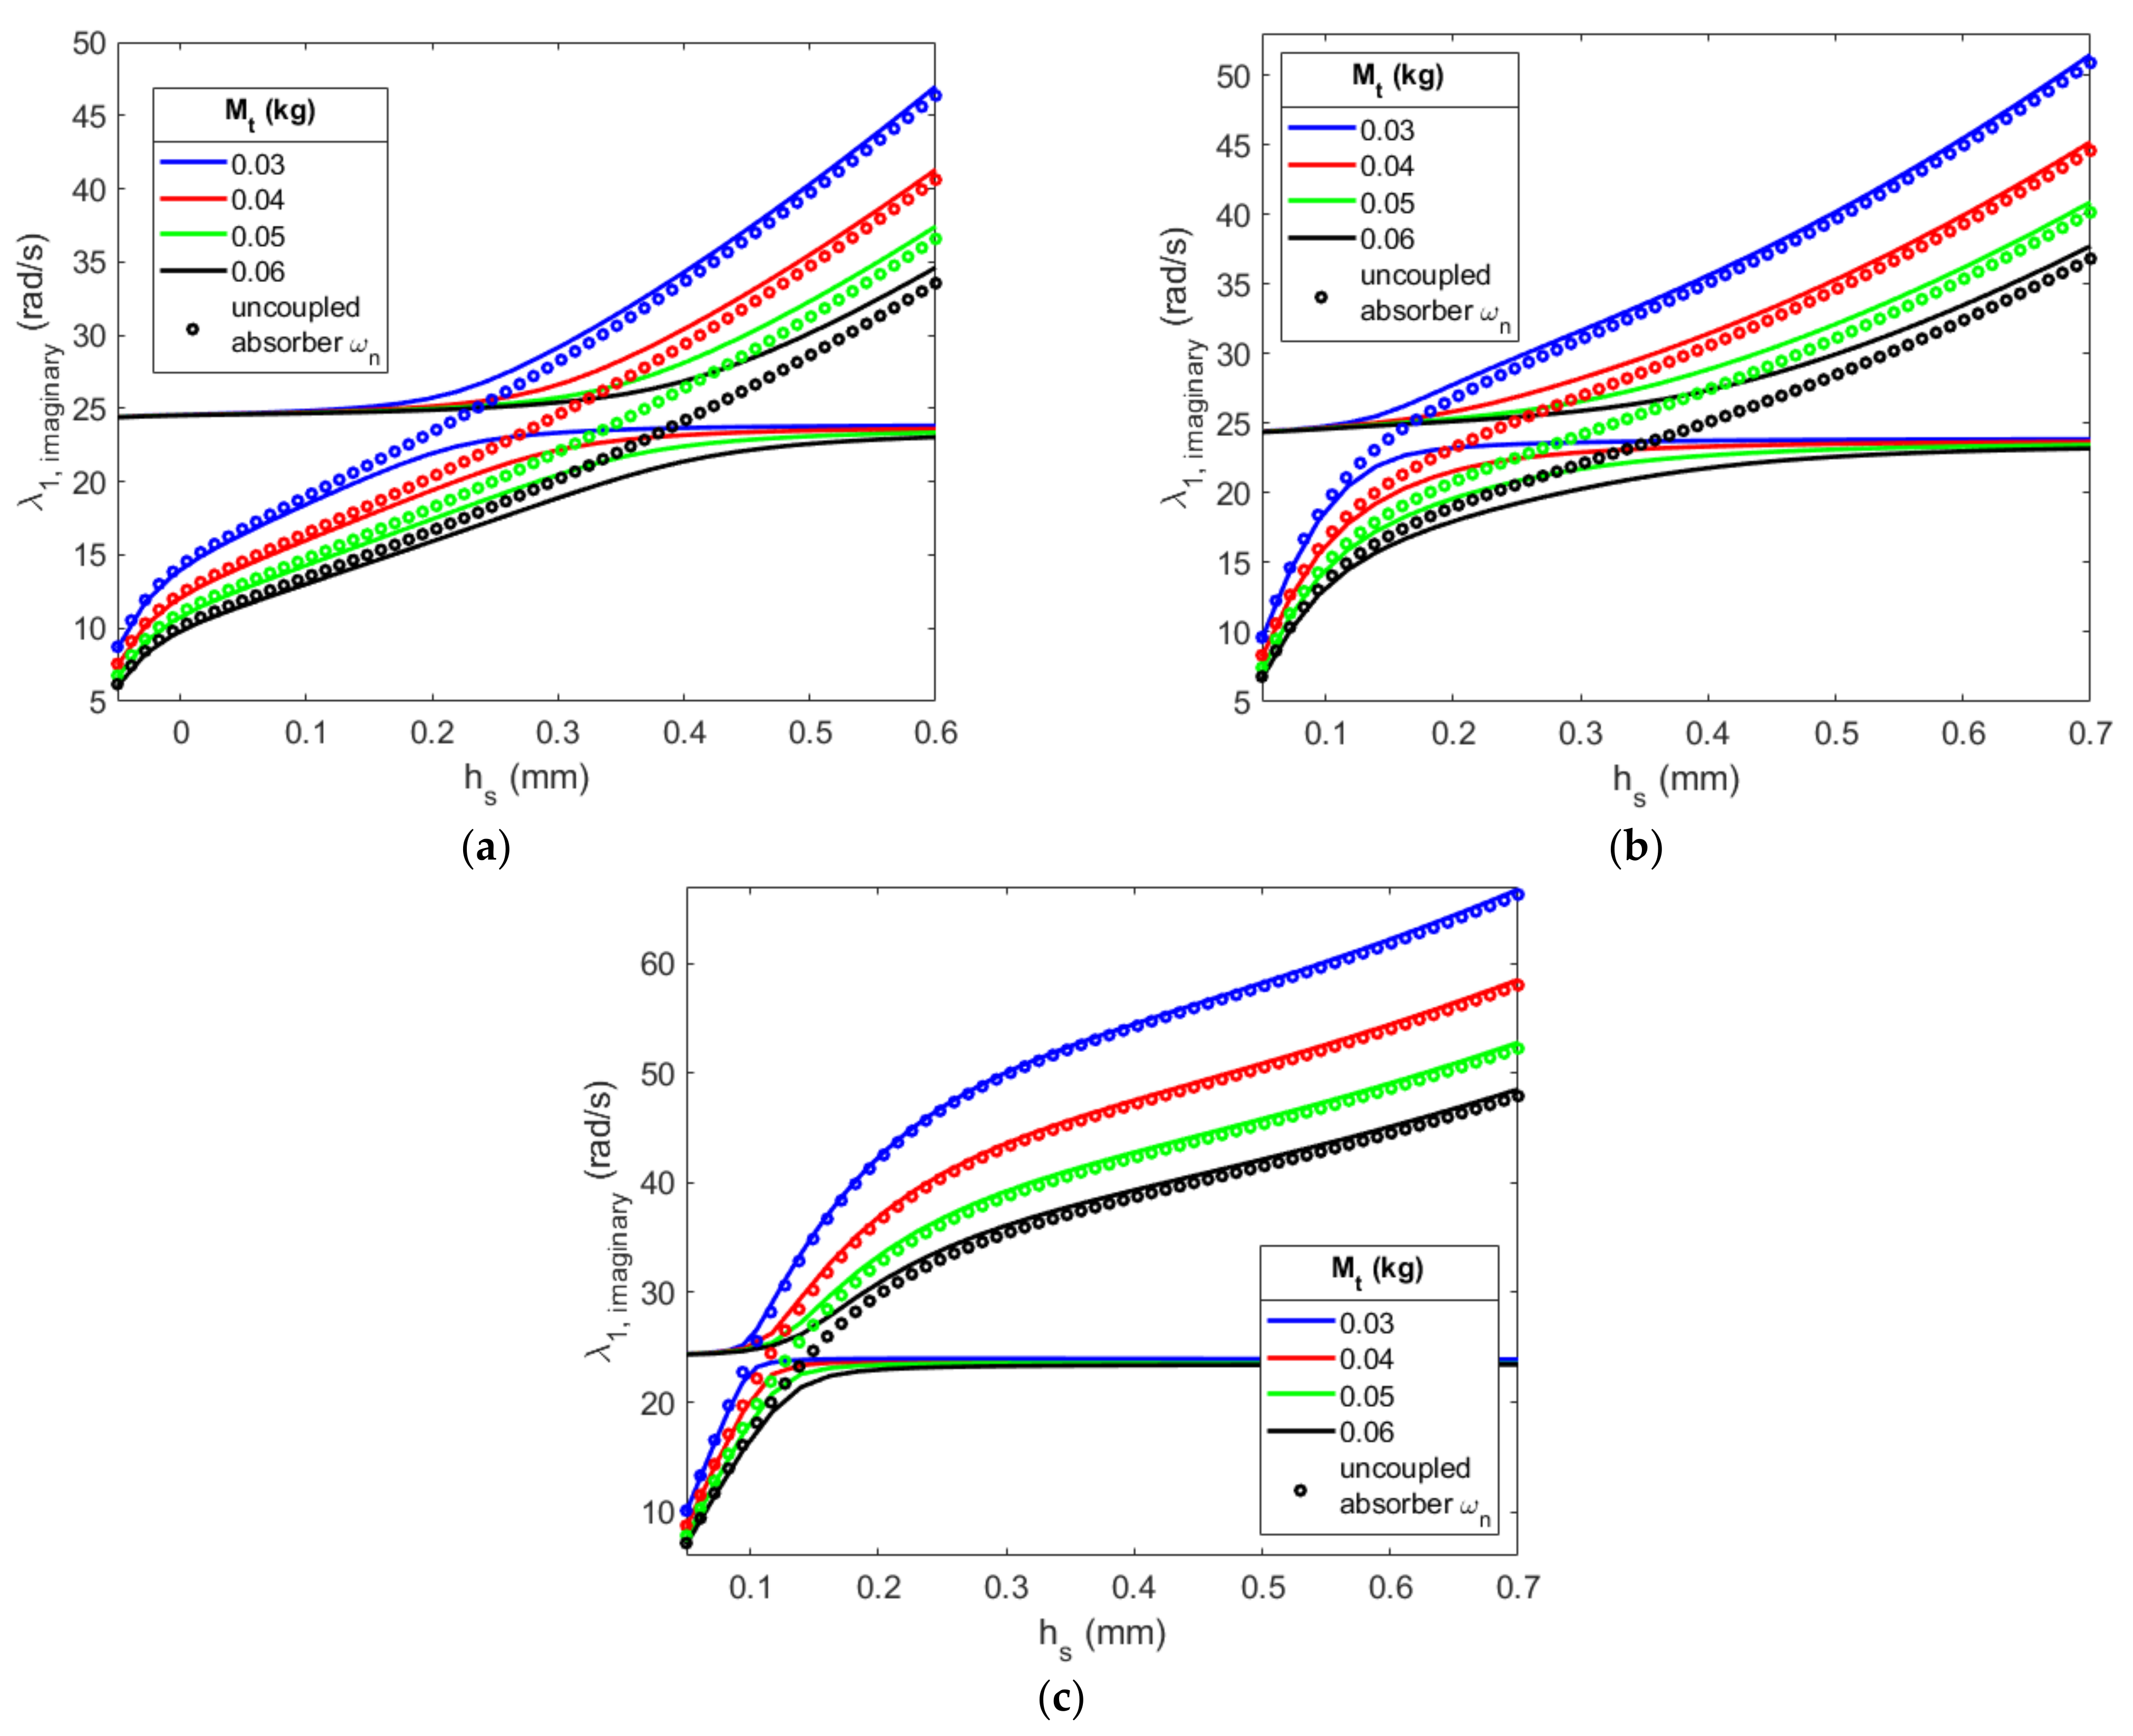
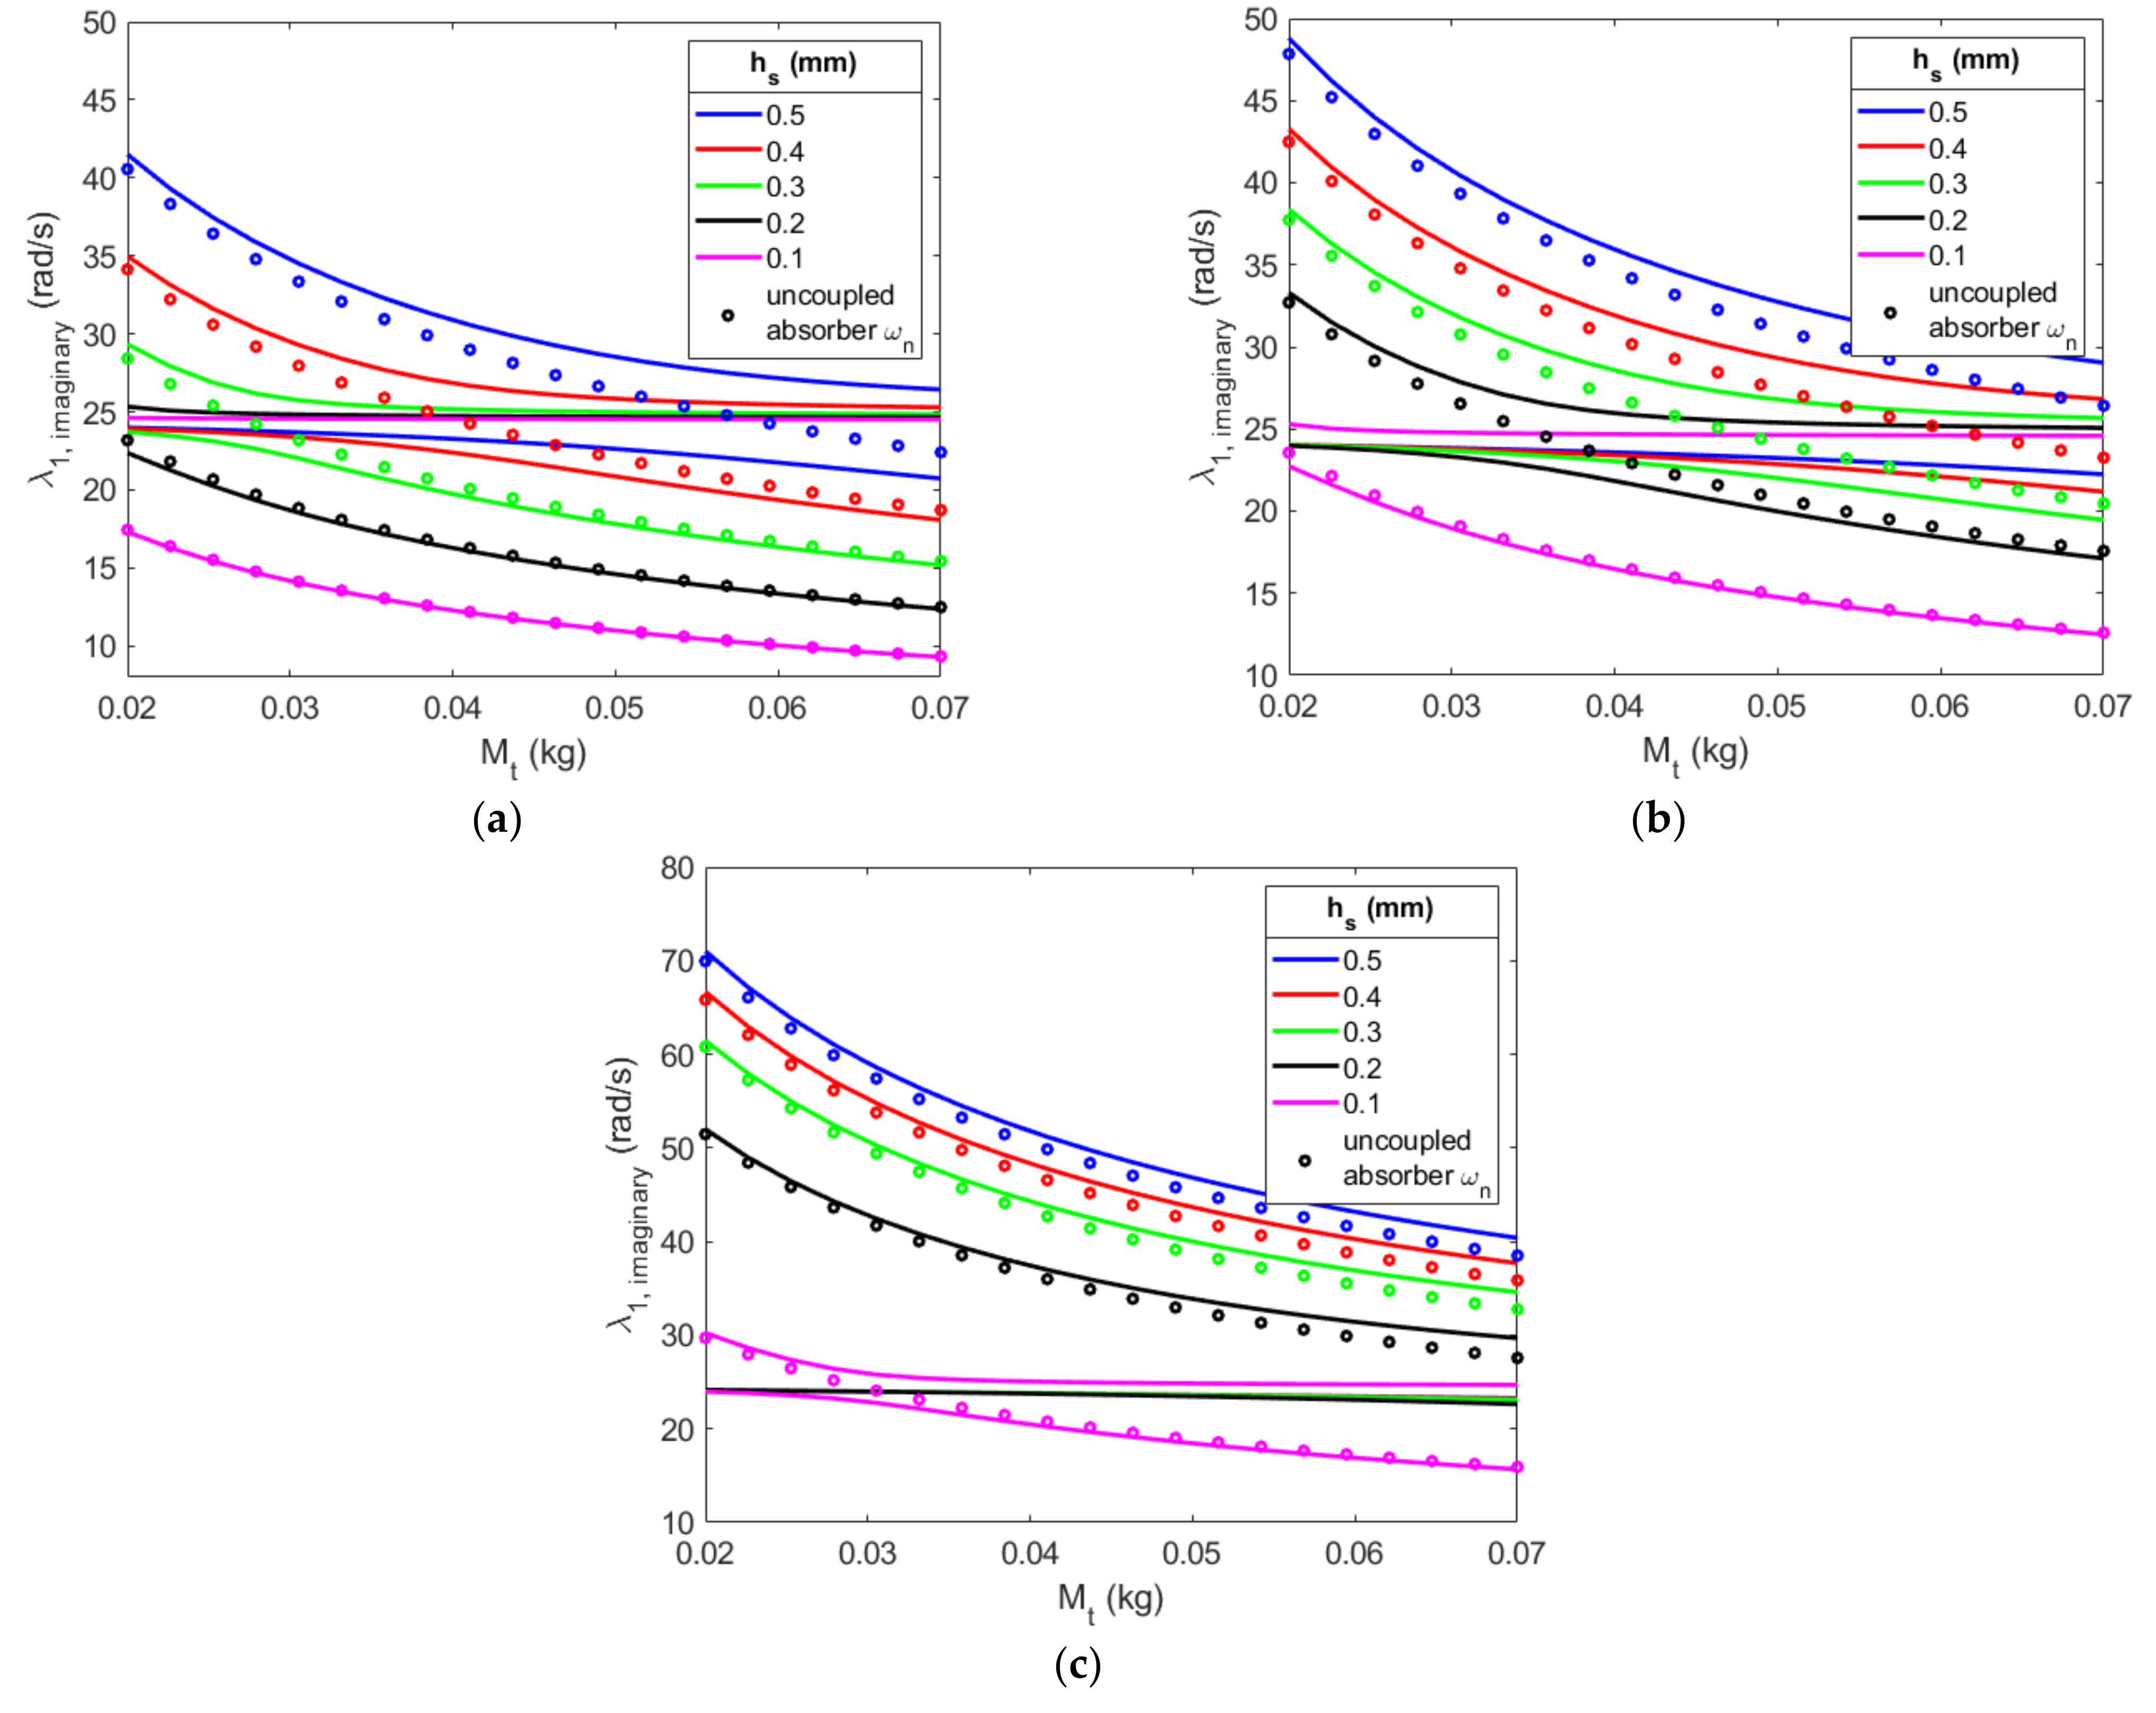
It is clear that small initial gaps have a strong effect on the absorber’s natural frequency, which detunes the absorber and the primary structure. These small gaps require individual parameter investigations to efficiently reduce the primary structure’s amplitude and maximize the power harvested from the absorber. Thus, an eigenvalue problem analysis is performed. To ensure strong coupling between the coupled natural frequencies, parametric values should be selected where the coupled natural frequencies are as close as possible. When the coupled natural frequencies are close, a strong coupling interaction may occur. In fact, the veering phenomenon can be seen in this region. The veering phenomenon occurs when the coupled natural frequencies, which each represent the dominant frequency of one of the coupled subsystems, move close to each other and after each coupled natural frequency exchange whose subsystem’s dominant frequency is represented. This is clear in Figure 17a,b, where the decoupled natural frequency of the absorber, represented as the circle markers, matches different coupled natural frequencies at the beginning of the plot rather than at the end of the plot. Two parameters will be investigated to ensure strong coupling: the thickness of the substrate and the mass of the tip mass. These parameters are selected because they influence the absorber’s natural frequency and are easier to modify during the manufacturing of the system than modifying the piezoelectric layers. Two eigenvalue analyses will be conducted to select proper pairings of the parametric values, where one parameter will be selected as the focus of that study, and a few values of the other parameter will be selected to generate a range of results. These investigations will show great comparisons between the different initial conditions considered while keeping the parameters constant. Finally, to show the most effective response for each initial gap and substrate thickness investigated, the tip mass will be selected for each substrate thickness and each gap size.

4.1. Effective Design: Absorber’s Tip Mass

Four tip masses are investigated over a range of substrate thicknesses, as seen in Figure 17, for gap sizes of 10   m m ,   7.5   m m and 5   m m . It is clear that the tip mass has a much stronger effect on the coupled natural frequencies than the substrate thickness, as the locations of the veering phenomena are quite close together, and the gap size affects the general location of them. For instance, a gap size of 5   m m in Figure 17c has all of its veering phenomena fall within 0.1   m m and 0.15   m m substrate thickness. This makes it challenging to select a substrate thickness that will be effective for all gap sizes. However, a substrate thickness of 0.3   m m is selected to investigate the initial gap effects on the system’s effectiveness.
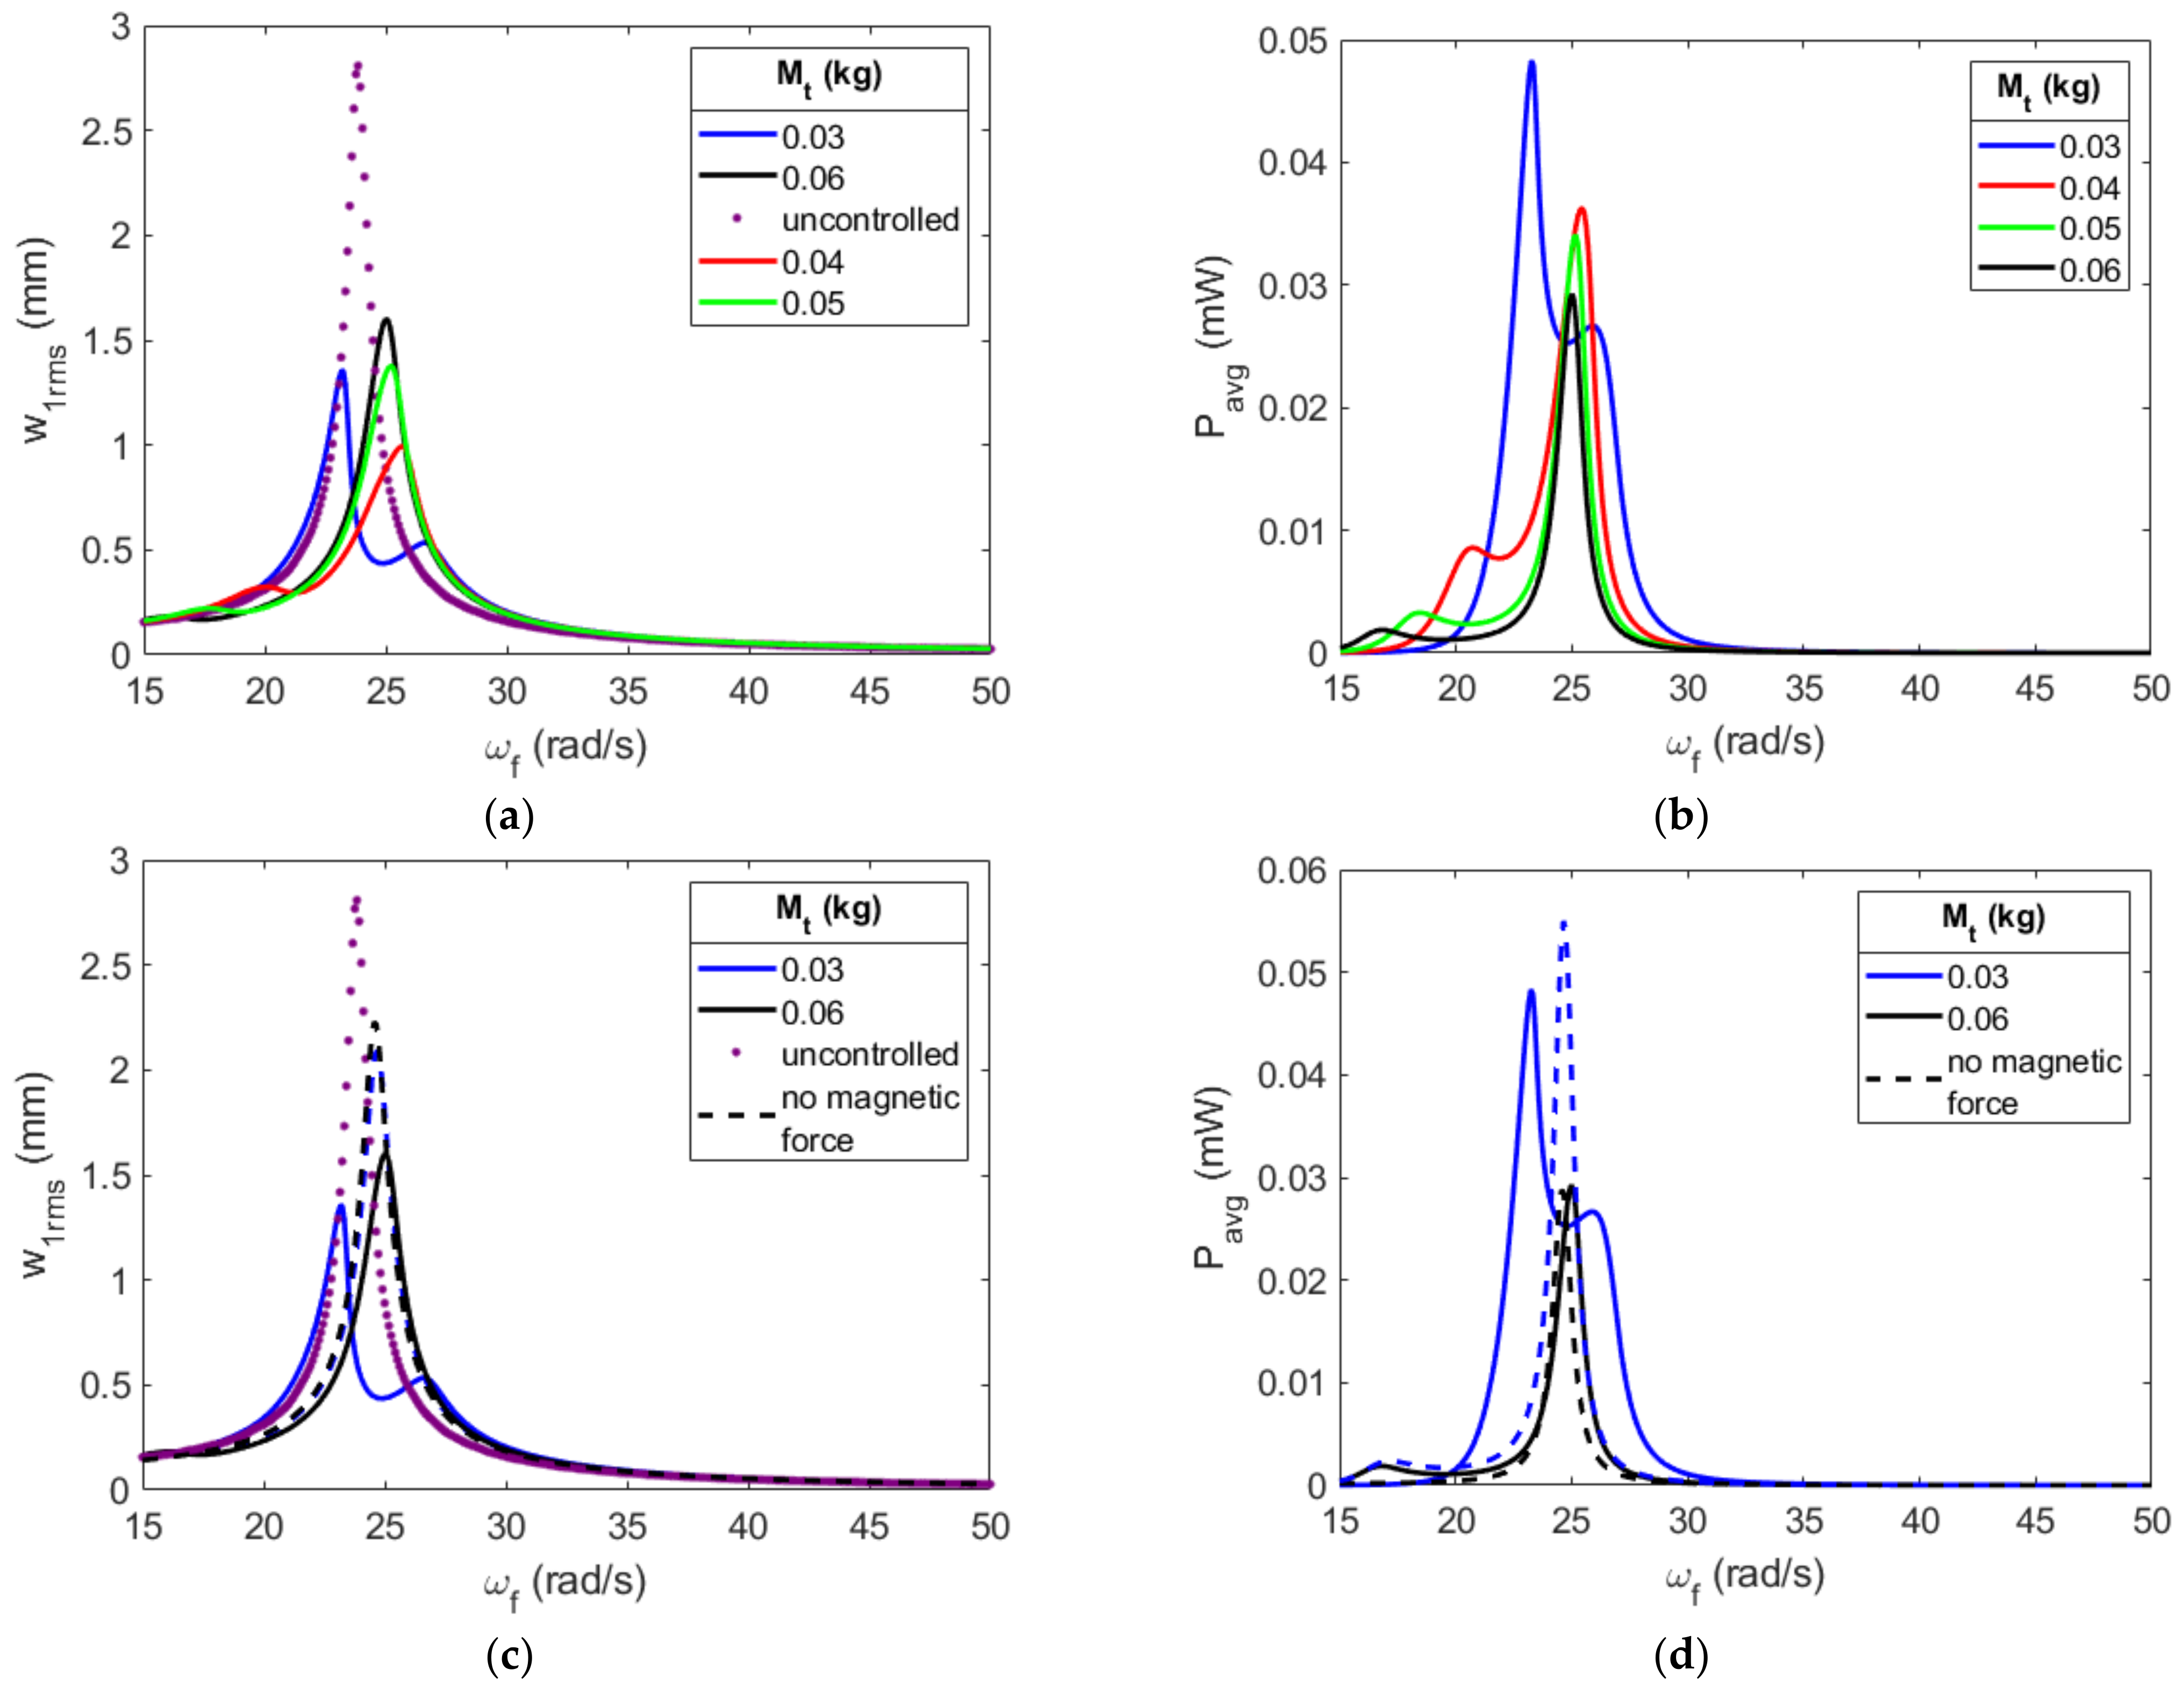
An initial gap of 10   m m is selected to investigate the effects of the tip mass with a constant substrate thickness on the primary structure’s displacement and the power generated and compare them to the same configurations but without magnets, as illustrated in Figure 18. Figure 17a indicates that the tip mass of 0.04   k g would induce the strongest coupling, and this mass does induce the greatest reduction in the primary structure’s displacement of 65%. However, the tip mass of 0.03   k g generates the most energy. In fact, the mass of 0.03   k g is the only tip mass to have its veering phenomenon occur before 0.3   m m , thus resulting in the first resonant peak being the larger of the resonances. Additionally, the case with a tip mass of 0.03   k g and no magnets has the first coupled natural frequency of 16   r a d / s , causing the second coupled natural frequency to be dominated by the primary structure. This results in a large peak energy but a very narrow band of operable frequencies to harvest energy. The hardening effect shifts the coupled natural frequency dominated by the absorber close to the uncontrolled natural frequency, inducing a strong coupling and increasing the average power generated from 2.82 × 10 3   m W to 5 × 10 3   m W . A similar trend is seen with the tip mass of 0.06   k g , but the gap is too large to shift the frequency close to the other coupled natural frequency for strong coupling.
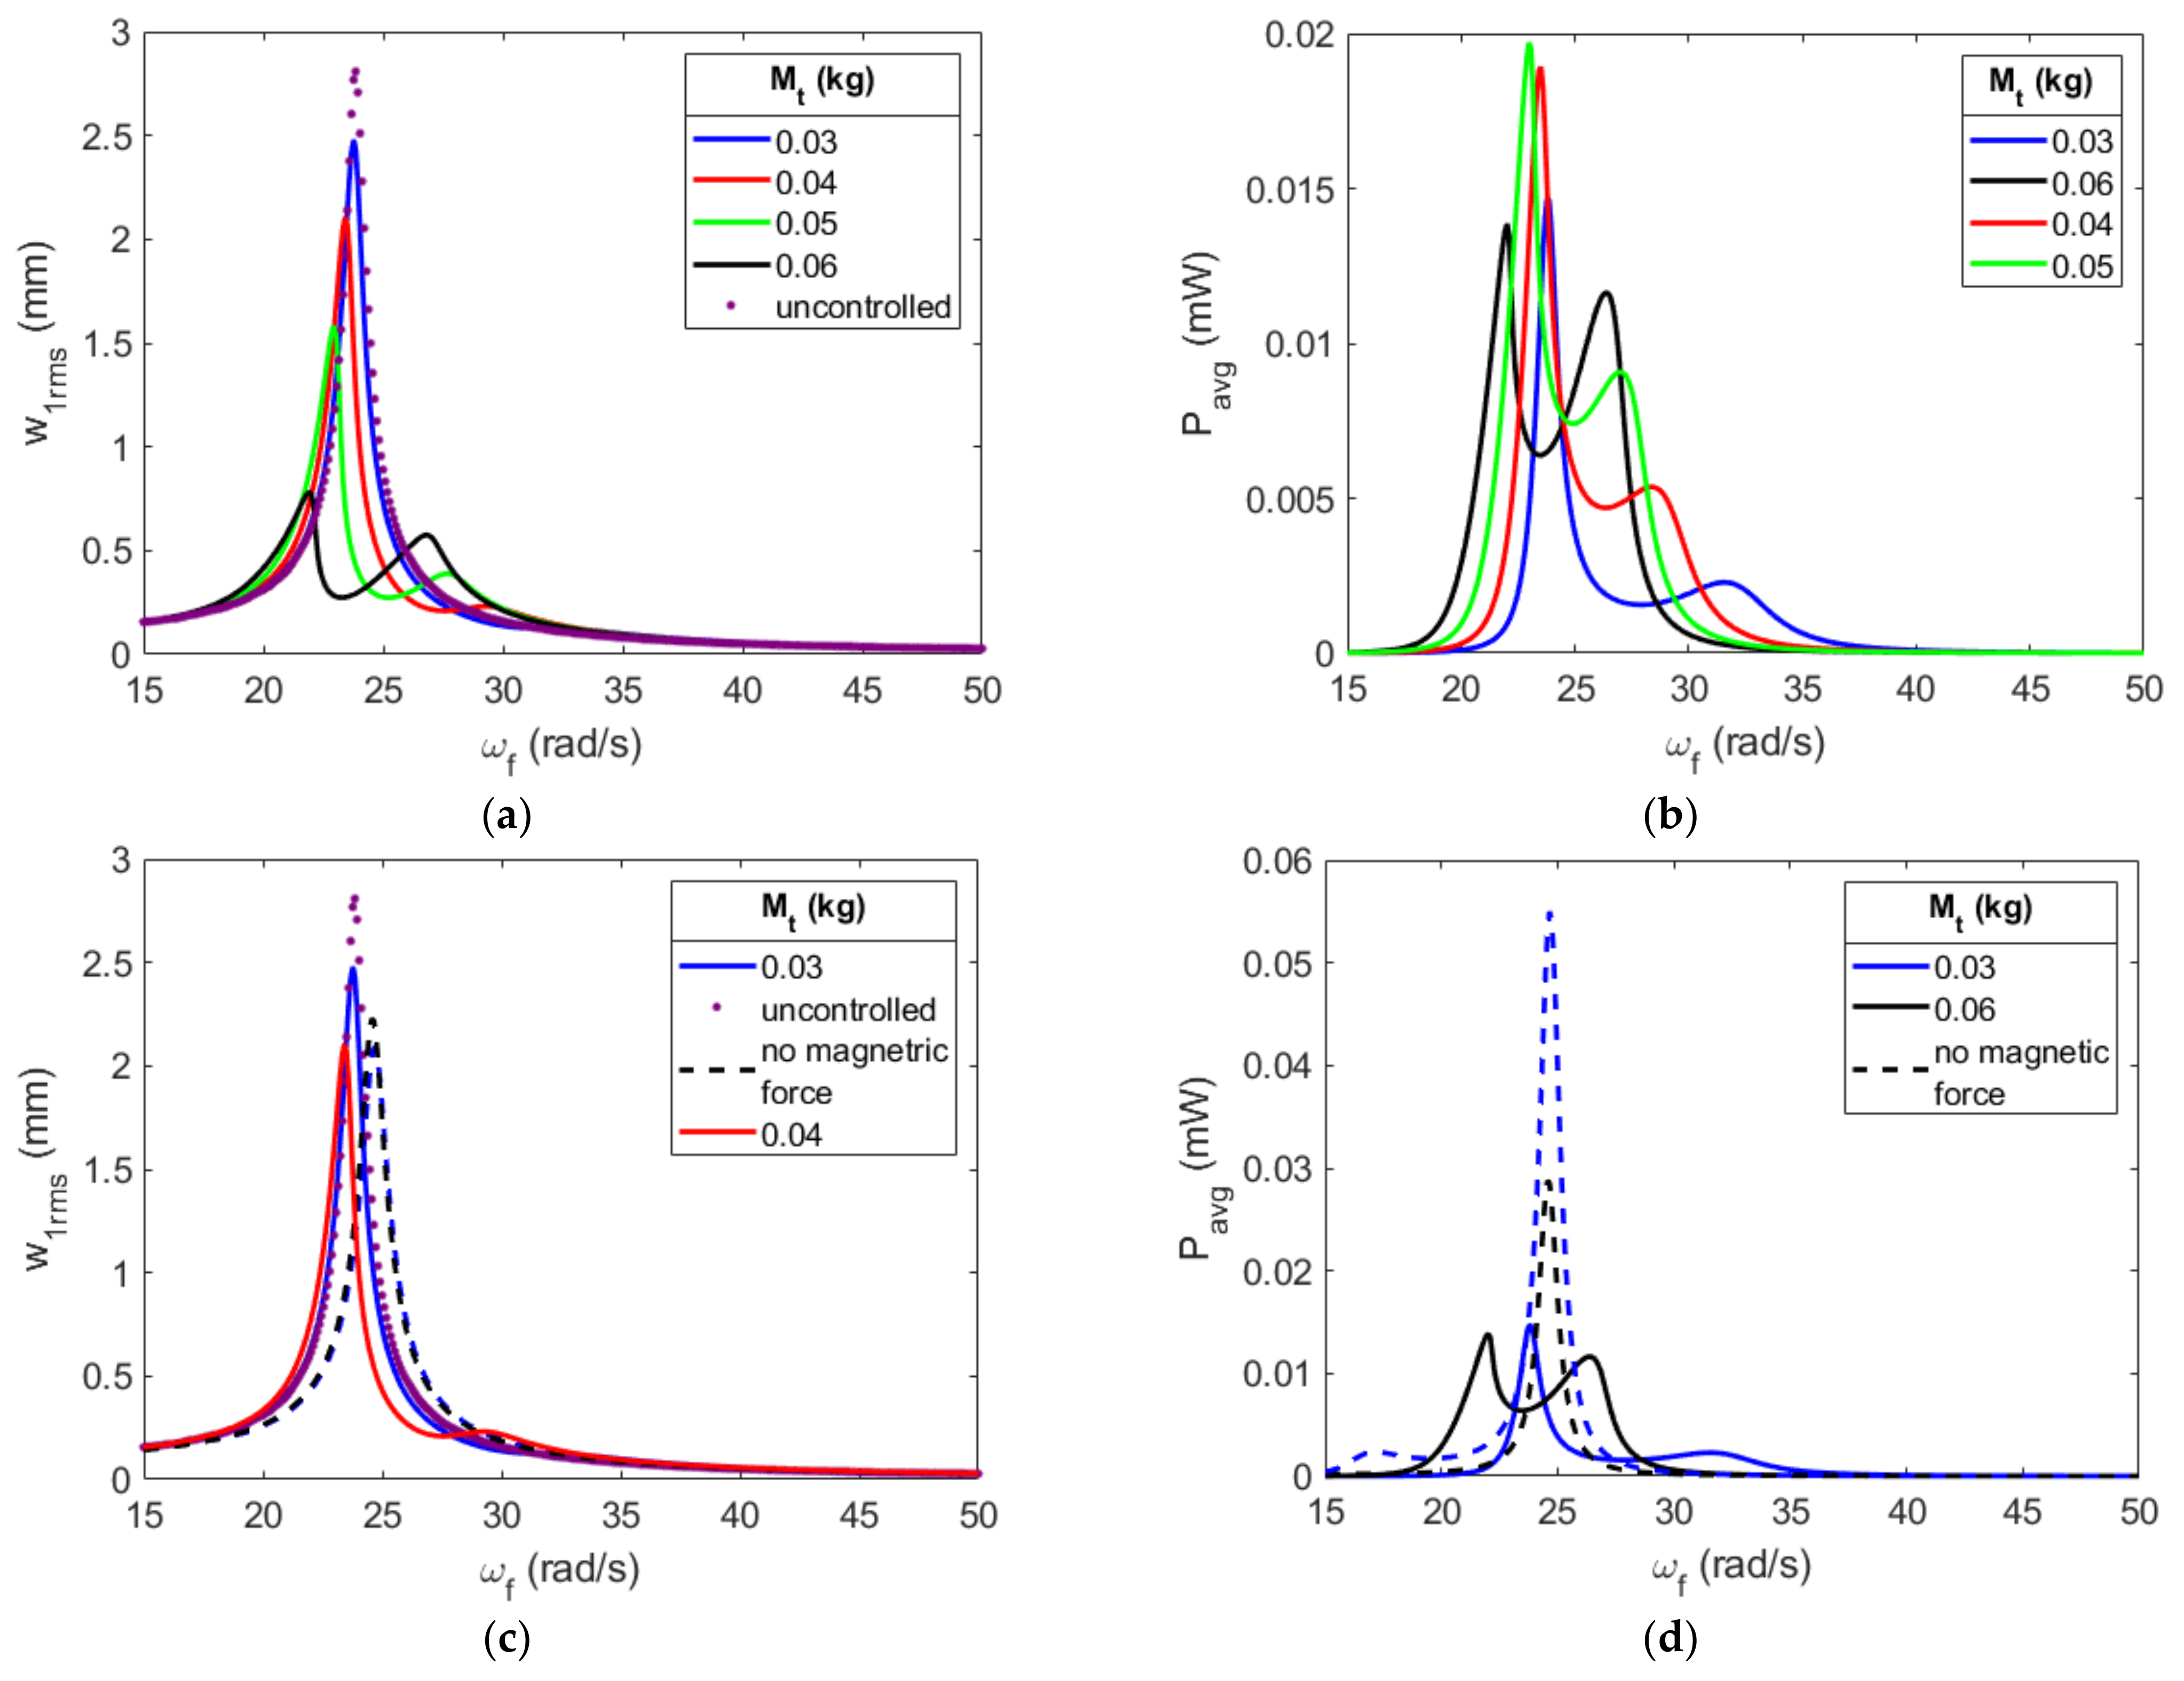
Figure 19 shows the effects of a 7.5   m m gap on the various tip masses with a constant substrate thickness of 0.3   m m . The tip mass of 0.06   k g has excellent coupling between the primary structure and the absorber, which is indicated by how close the two resonant peaks are in amplitude. This greatly increases the control of the primary structure, with a reduction of 72%. The tip mass of 0.05   k g has the highest peak power and has a slightly larger average power over the frequency range than the tip mass of 0.06   k g , with an average power of 2.2 × 10 3   m W and 2.05 × 10 3   m W , respectively. Therefore, this configuration is an excellent selection to achieve the goals of minimizing primary structure displacement and generating energy. When compared to the same configuration without magnets, it is seen that the peak power is reduced by half, but due to the strong coupling of the system, a broadband region is generated, increasing the frequency range that can harvest energy from 2.5   r a d / s to 7.3   r a d / s . The configuration with a tip mass of 0.06   k g and no magnets shows the importance of proper tuning for each gap, as the primary structure’s displacement only controls 18% of the primary structure’s uncontrolled amplitude, which is nearly triple the size of the configuration with magnets.
Concerning the gap of 5   m m , it is clear from the plotted curves in Figure 20 that the absorber is poorly tuned to the primary structure. The tip mass of 0.06   k g has the largest reduction in the uncontrolled primary structure’s displacement with a mere 13%. Likewise, this tip mass has the highest peak power with 1.97 × 10 3   m W , which is twenty-five times smaller than the tip mass of 0.03   k g and a 10   m m gap. Additionally, the hardening effects of the magnets further decrease the performance of the absorber by increasing the primary structure’s displacement when compared to the case with no magnets, as well as drastically decreasing the power generated. These results show the importance of tuning the absorber to properly control the primary structure’s displacement and how improperly tuned absorbers can perform worse than the same configuration without magnets; therefore, the placement of the magnets should be taken into careful consideration.
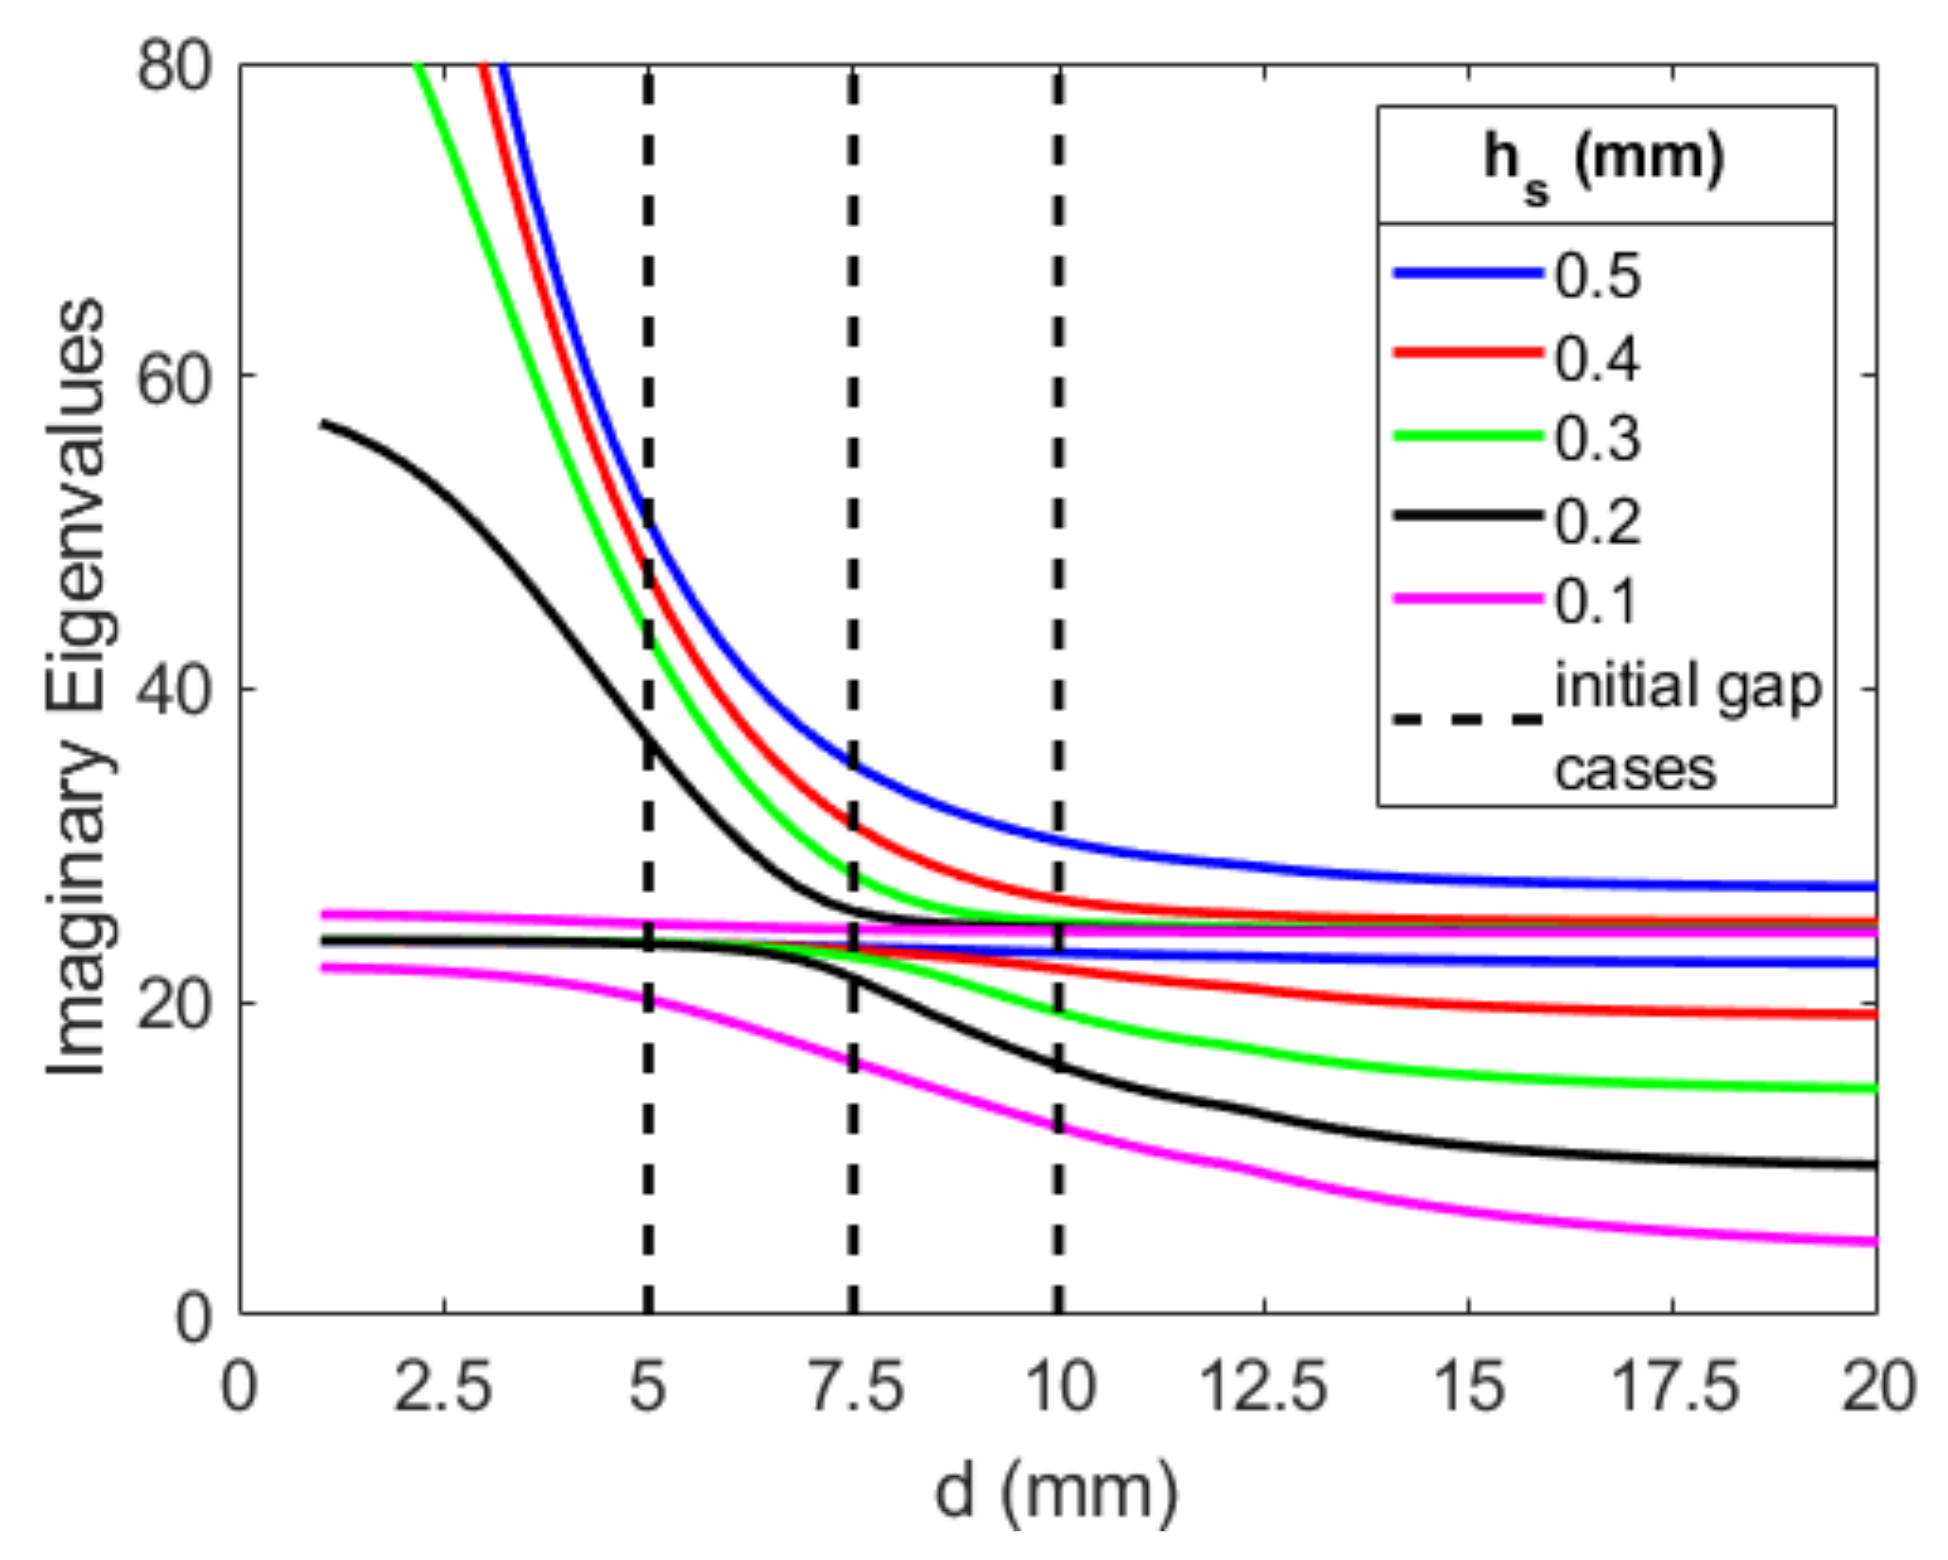
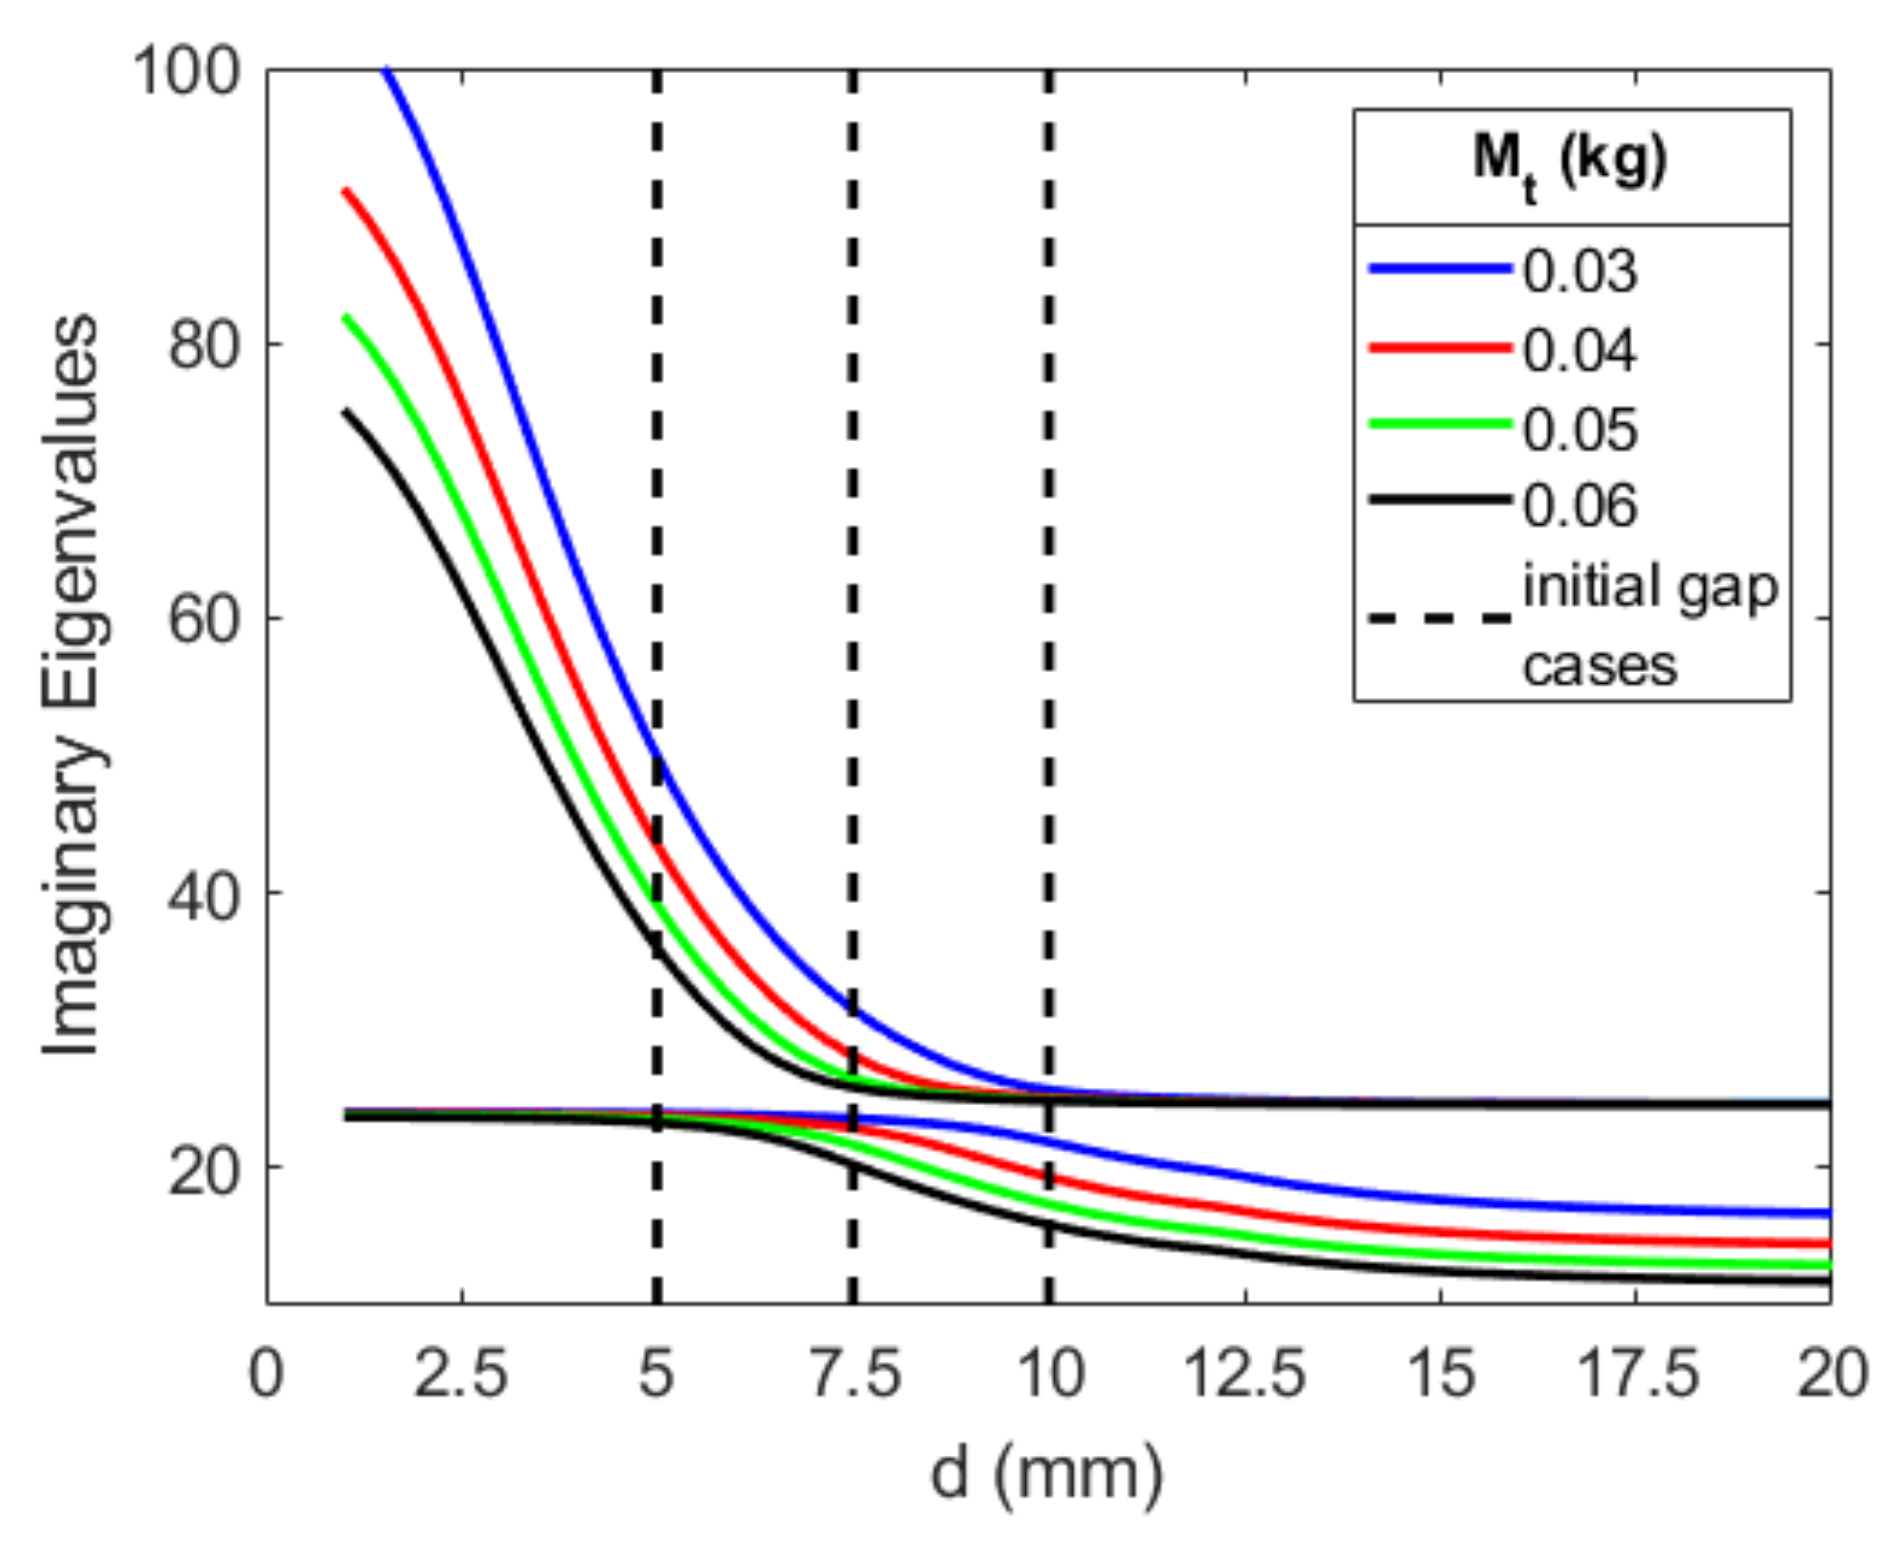
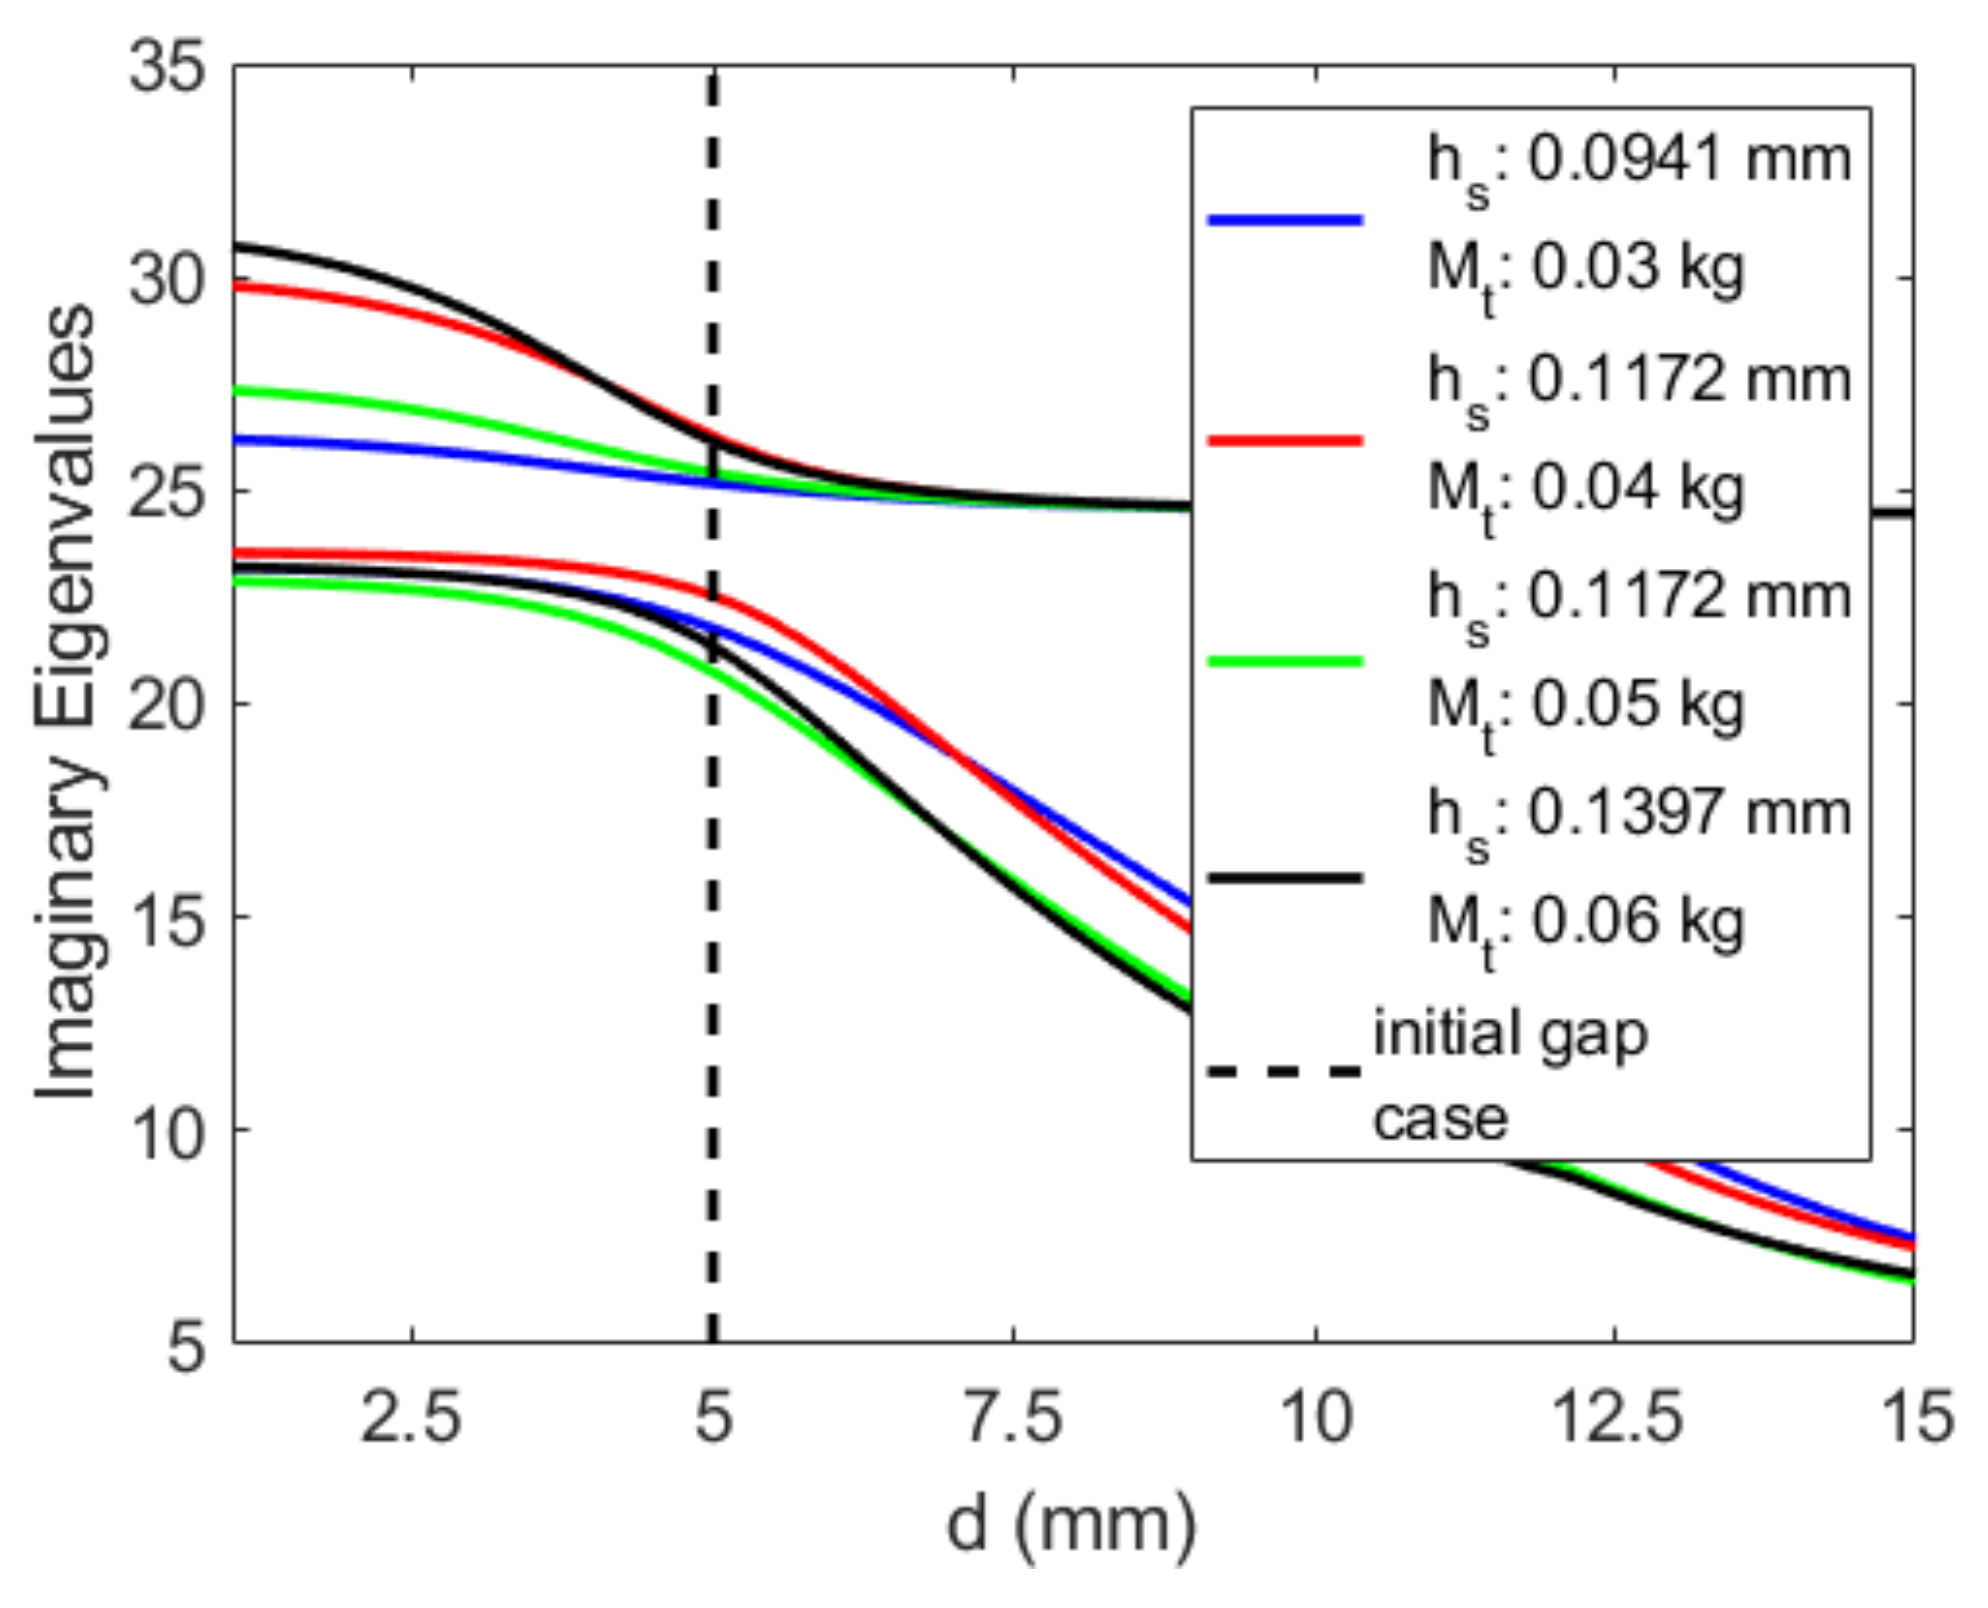
A linear analysis of the initial gap of the magnets is investigated in Figure 21 to determine its effects on the selected tip masses’ coupled natural frequencies. Again, it is clear that the tip mass has a much stronger effect on the coupled natural frequencies. The lower coupled natural frequency for a gap of 5   m m is practically the uncoupled natural frequency of the primary structure. This is also true for the higher coupled natural frequency for a gap of 12.5   m m and larger. The hardening due to the magnetic force is also clear when looking at a gap of 7.5   m m ; the mass of 0.05   k g appears to induce the strongest coupling, as the gap between the coupled natural frequencies is minimal. However, the mass of 0.06   k g has a veering phenomenon at 6.5   r a d / s but performs ideally at the 7.5   m m gap.

4.2. Effective Design: Absorber’s Substrate Thickness and Tip Mass
It is clear that a single substrate thickness for all of the tip masses for a given gap is incapable of ensuring strong coupling for every tip mass. Similar investigations were carried out for four selected substrate thicknesses with a single optimal tip mass for each gap size. The eigenvalue analysis showed that the coupled natural frequencies are less dependent on the substrate thickness than the tip mass. From investigating the configurations over the frequency range, it is clear that it is more achievable to tune the system for a wider range of gap sizes, but the small gap of 5   m m is still greatly different compared to the other gaps. The full discussion, associated eigenvalue analyses and frequency response figures can be found in Appendix B.
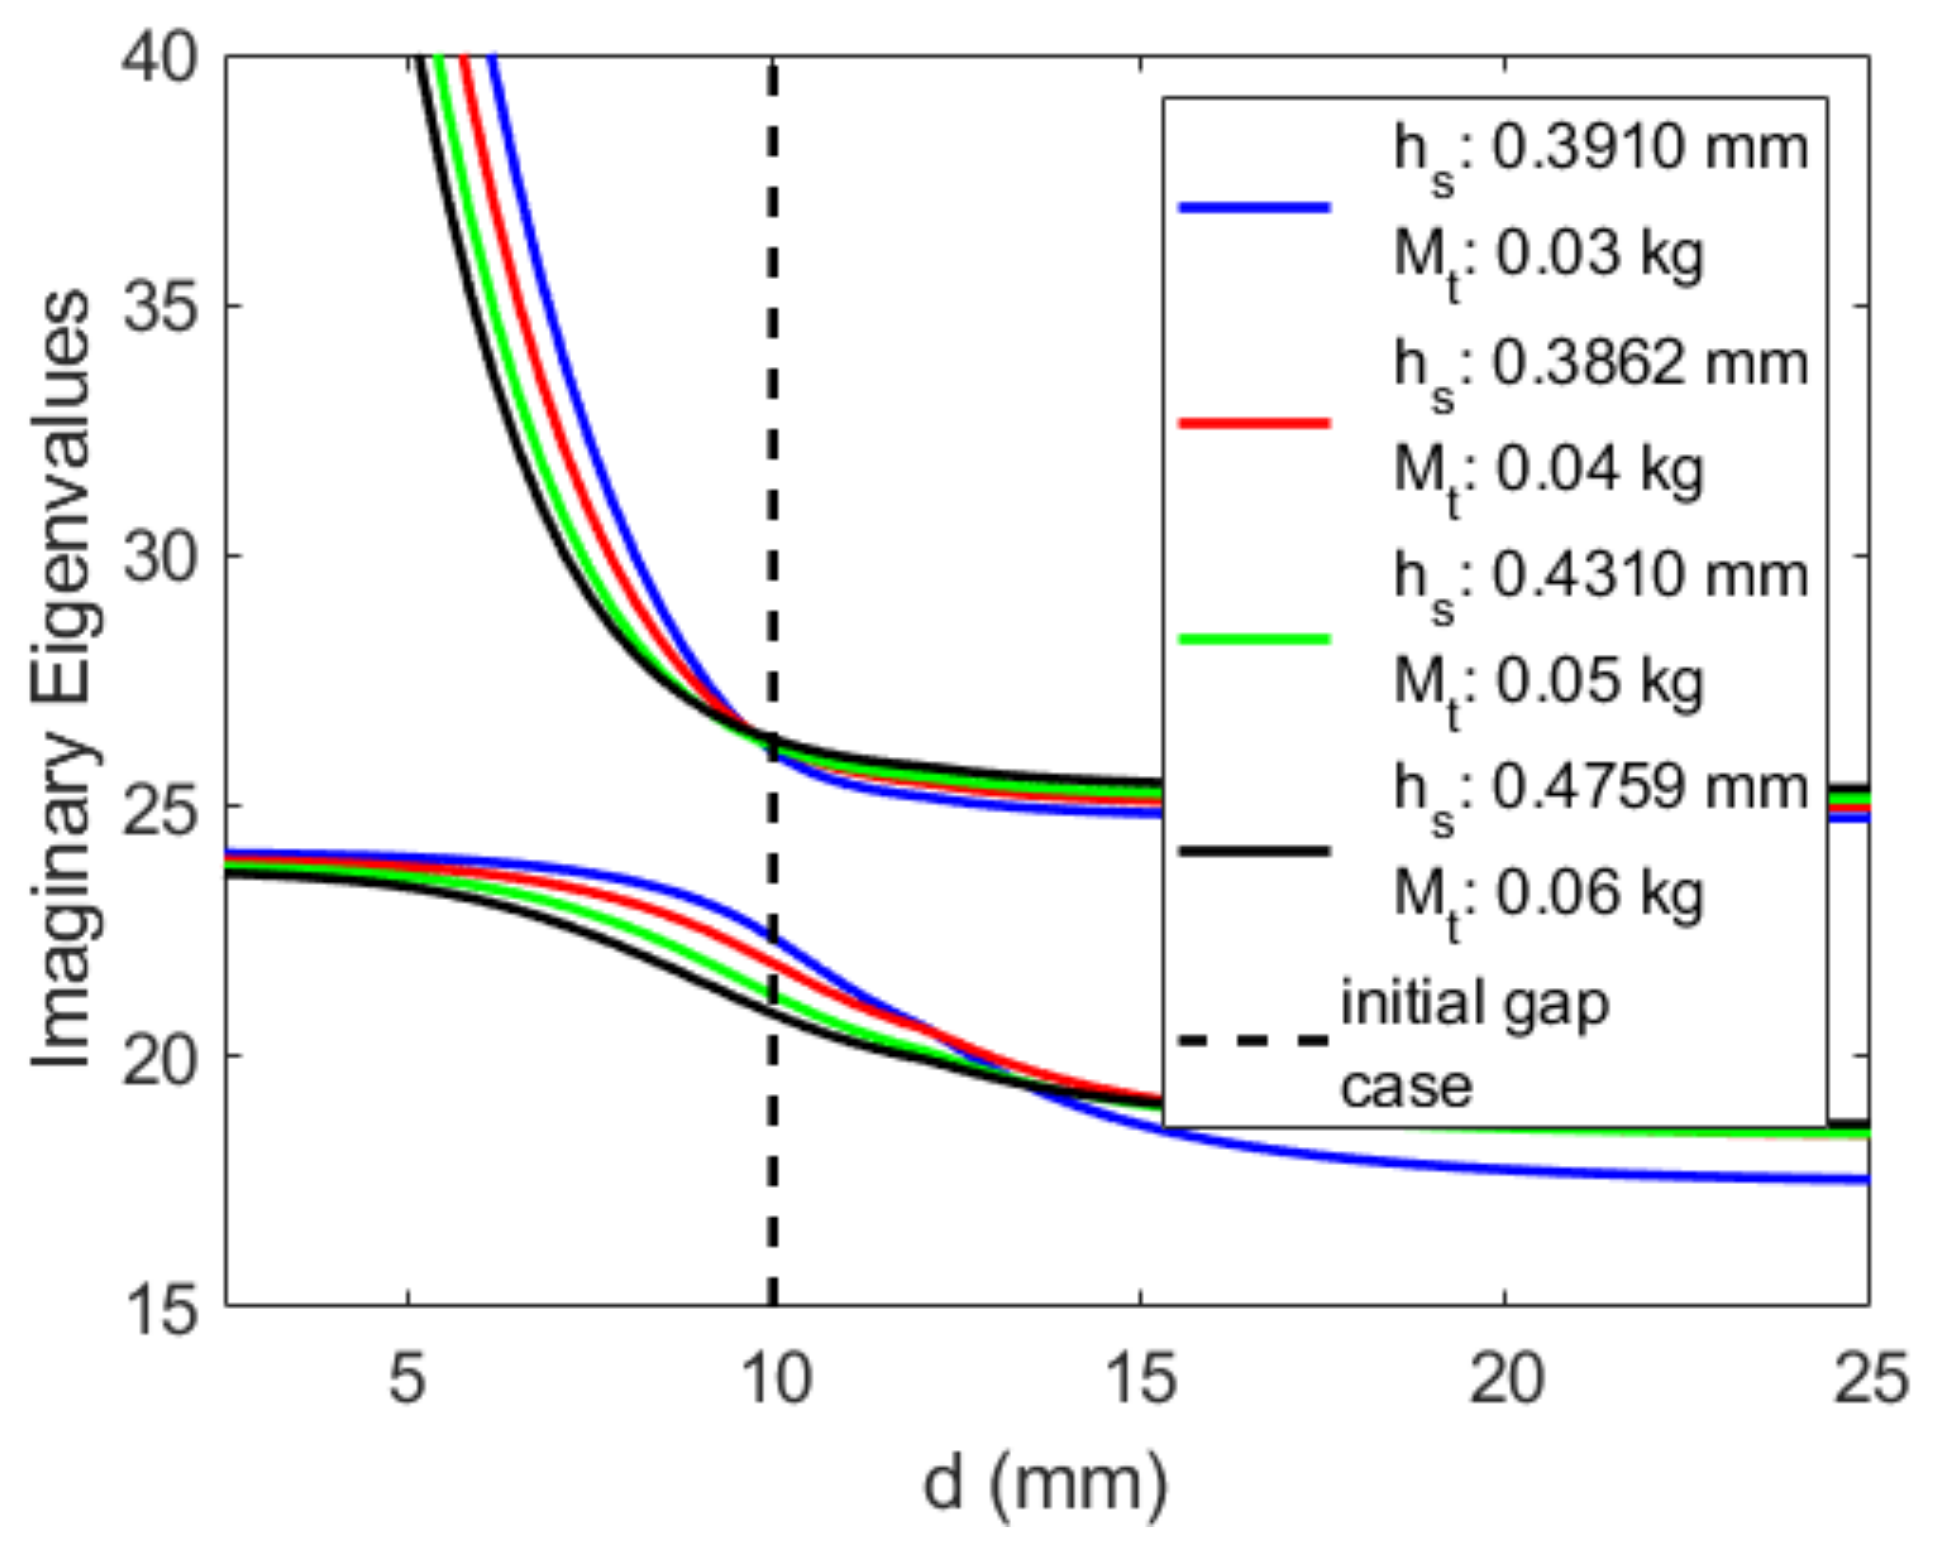
Because it is not possible to tune all gap sizes with a parameter being held constant, an effective substrate thickness for each tip mass is determined by selecting the substrate thickness, which has the smallest distance between the coupled natural frequencies in the eigenvalue analysis. When this distance is minimal, the coupled natural frequencies interact with each other and are not dominated by a single coupled natural frequency. It is seen that the uncoupled natural frequency of the absorber is directly in between the coupled natural frequencies due to the veering phenomenon. Figure 22 depicts the paired tip mass and substrate thickness’s effects on the primary structure’s displacement and the power generated, as well as comparing them to their configurations without magnets for a gap of 10   m m . The configurations with tip masses of 0.05   k g and 0.06   k g have resonant peaks, which are very close in amplitude to each other. This produces a reduction in the primary structure’s uncontrolled displacement of 74% and 77%, respectively. These performances are consistent with the generated power, as the configuration with a tip mass of 0.06   k g has an average power over the frequency range of 7.87 × 10 3   m W , which is higher than the configuration with 0.05   k g with an average power generated of 7.65 × 10 3   m W . Additionally, the configuration with a tip mass of 0.06   k g has the highest average power generated over the frequency range, even though it has the lowest peak power. This is due to each peak being close in magnitude, which reduces the overall loss of power from the resonant peak that is farther away from the uncontrolled primary structure’s frequency, and this configuration also has the most broadband region of frequencies that can generate energy. When comparing these configurations to the no-magnet cases, it is clear that the hardening effect of the magnetic force is present but not overpowering enough for the no-magnet cases to still be able to induce partial coupling. The no-magnet configuration with a tip mass of 0.06   k g still manages to control the primary structure’s uncontrolled displacement by 61%, which can be adequate depending on the application and the requirements of the primary structure. This configuration generates nearly as much power, on average, as its magnetic configuration with an average power of 7.42 × 10 3   m W . Even though the powers are very similar, the magnetic configuration is ideal due to its excellent reduction in the primary structure’s amplitude.
Figure 23 depicts the linear eigenvalue analysis of the initial gap’s effects on the various tuned configurations. Since these values are tuned to enforce strong coupling between the coupled natural frequencies, it is clear why all of the configurations have very similar shapes. In fact, the two best performing configurations with tip masses of 0.05   k g and 0.06   k g have practically identical coupled natural frequencies. The other configurations have a minimal gap between the coupled natural frequencies at a larger gap, causing the lower coupled natural frequency to be mostly dominated by the absorber. Additionally, as the tip mass decreases, the lower coupled natural frequency at 10   m m increases, which aligns with the large amplitudes in the first resonant peaks in Figure 22 for the smaller tip masses.
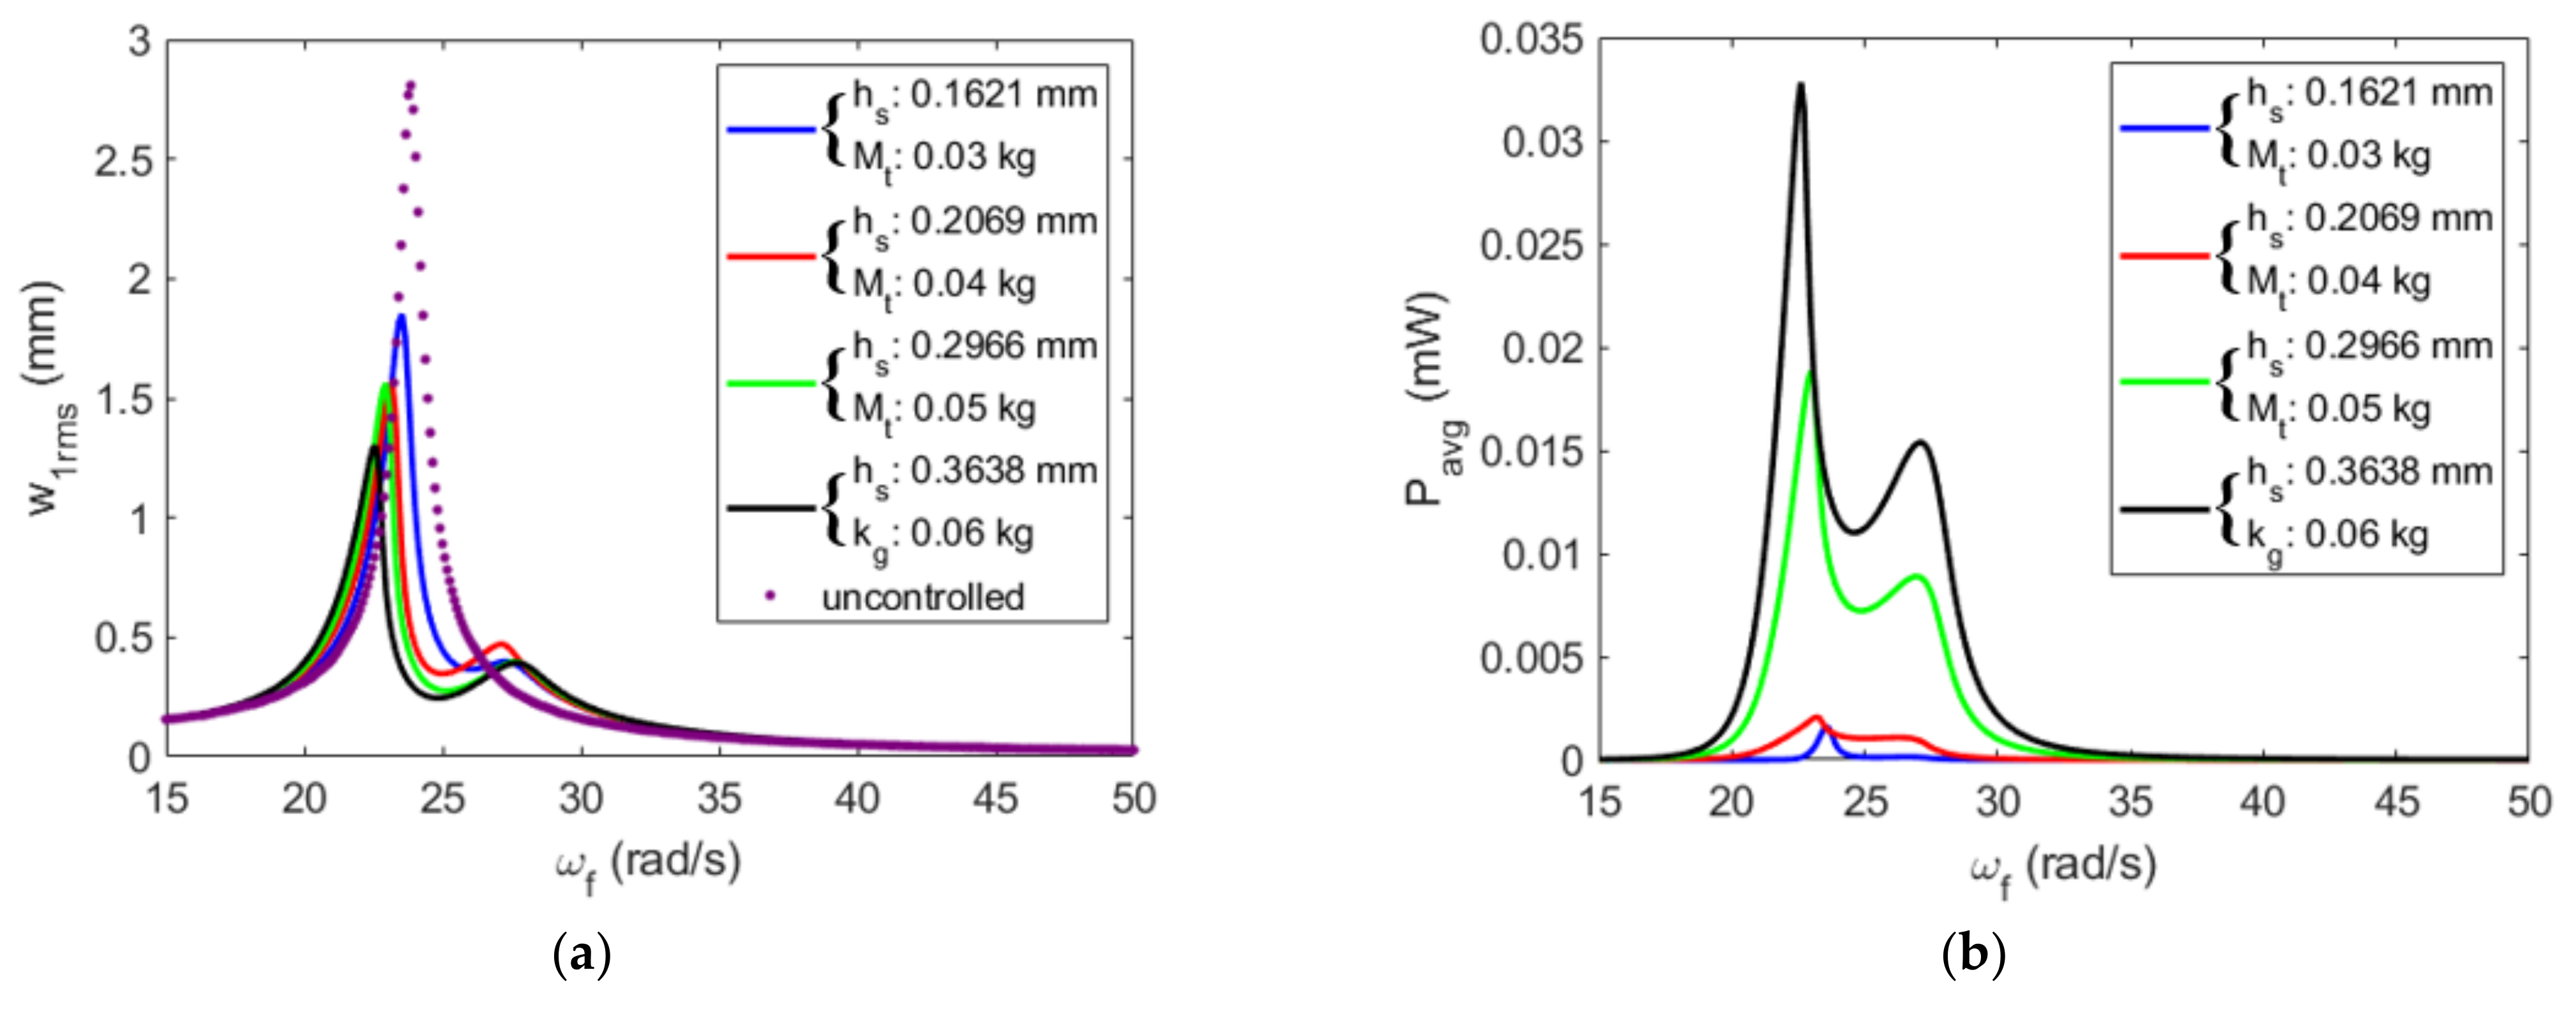
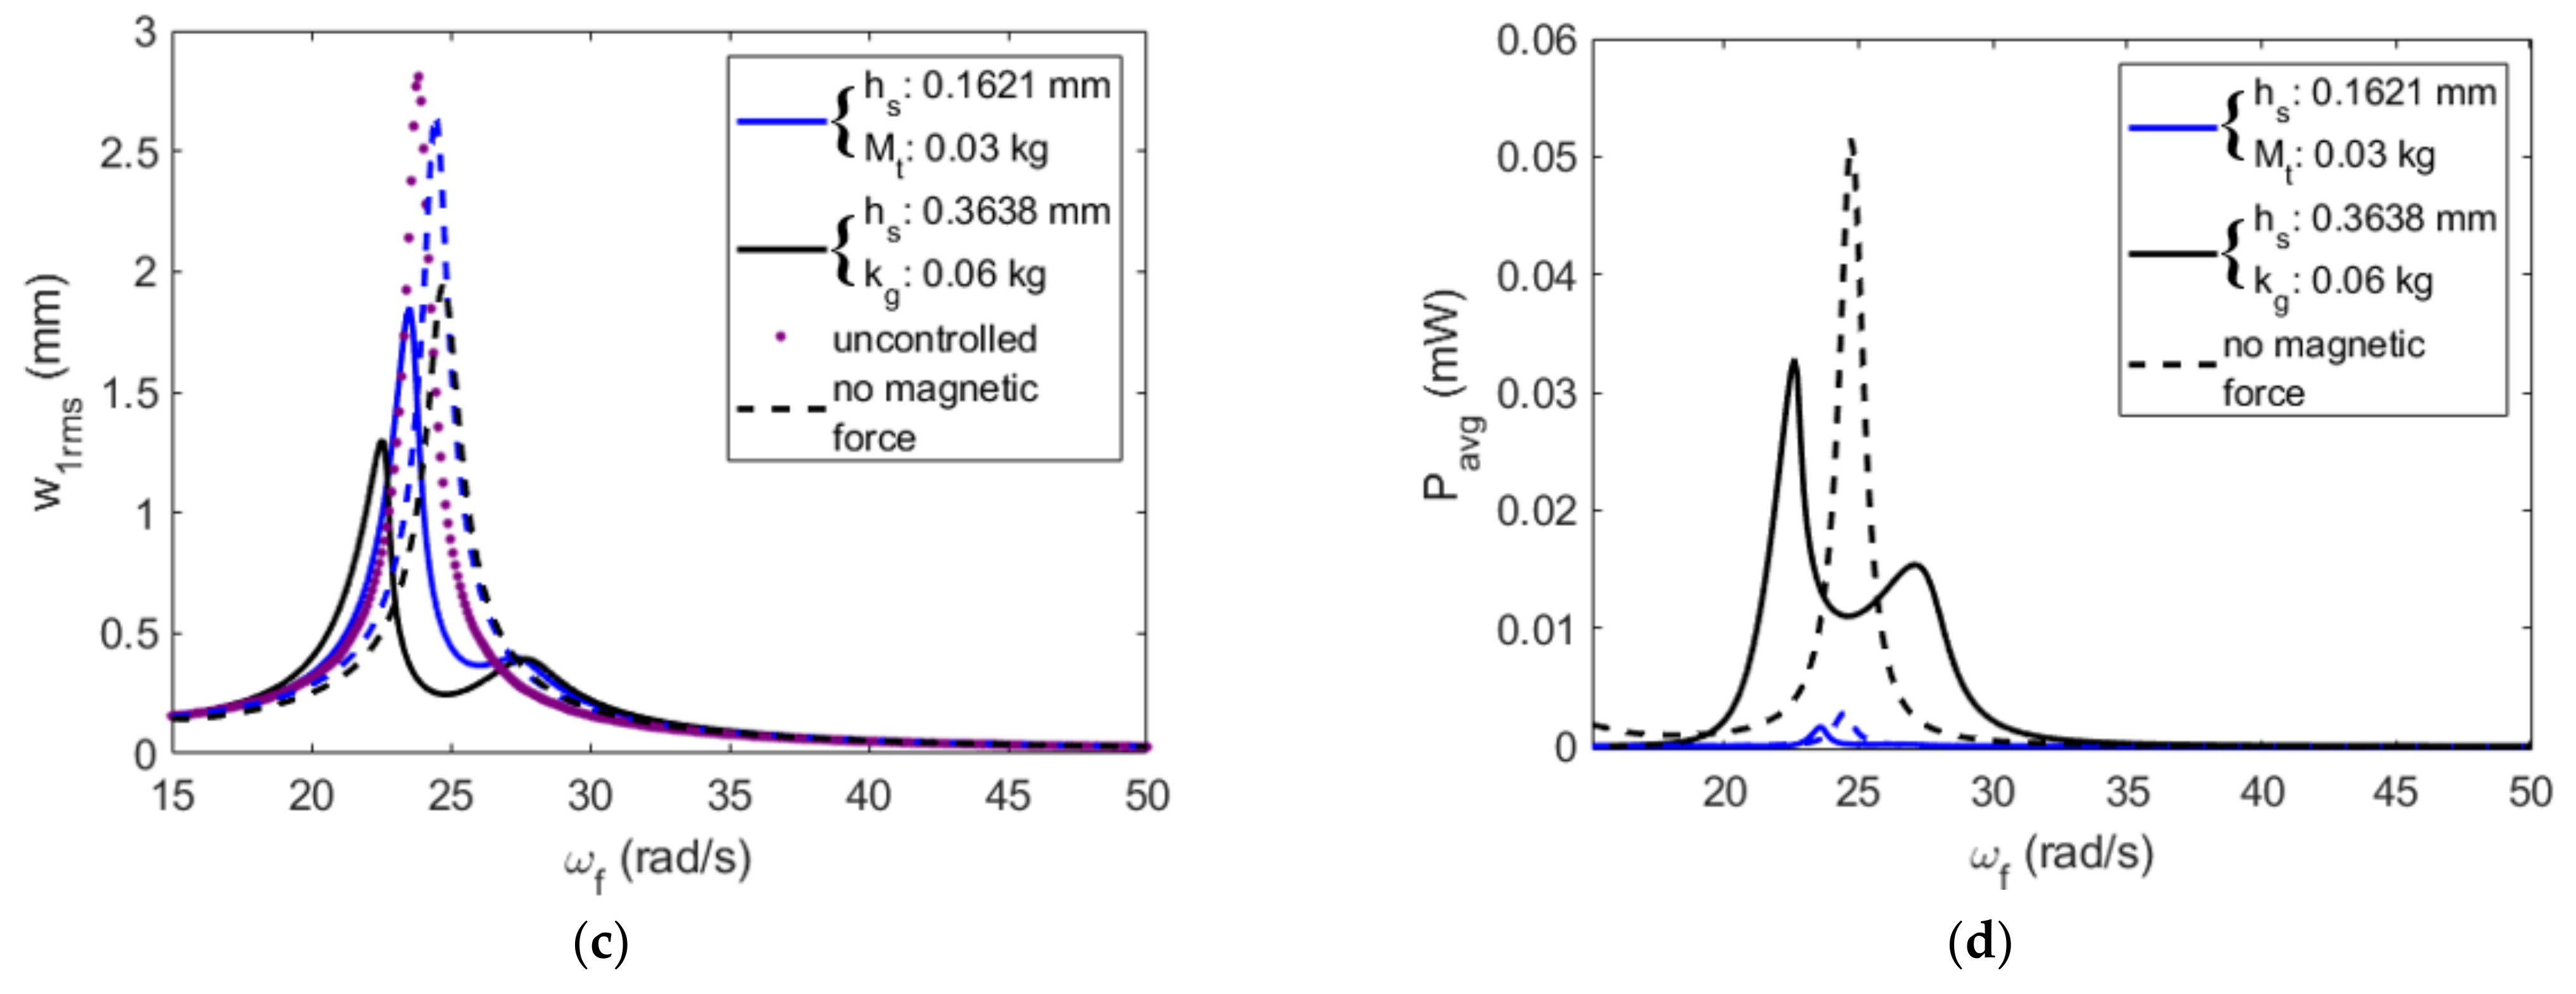
The tuned configurations’ effects on the primary structure’s displacement, the average power harvested, as well as comparisons with the configurations with no magnets for an initial gap size of 7.5   m m are presented in Figure 24. When looking at the primary structure’s displacement, it is noted that all of the configurations behave very similarly, with the first resonant peak being closer to the uncontrolled natural frequency, and therefore, it is much larger than the second resonant peak. The configuration with the greatest reduction is that with the tip mass of 0.06   k g , with a reduction of 53% of the uncontrolled displacement. Additionally, this configuration also has the largest peak and average power generated. When looking at the configurations without magnets, it is clear that there is a much stronger hardening effect, specifically on the average power in Figure 24d, where the first resonant peak is smaller than 15   r a d / s . This causes the second peak to be very narrow, reducing the average energy harvested over the frequency range.
Figure 25 depicts the initial gap’s effects on the coupled natural frequencies for the tuned configurations for a gap of 7.5   m m . At 7.5   m m , the lower coupled natural frequencies are extremely similar, except for the configuration with a tip mass of 0.03   k g , which is slightly larger. Additionally, all configurations’ veering phenomena appear to occur at 7.5   m m . Since the resonant peaks are not close in amplitude in Figure 24, this is clear evidence of the nonlinear hardening effects of the magnetic force. When looking at the gap between the two coupled natural frequencies for a single configuration at the 7.5   m m gap, the configuration with a tip mass of 0.06   k g has the largest gap, which indicates that it has the largest band of frequencies to harvest energy.
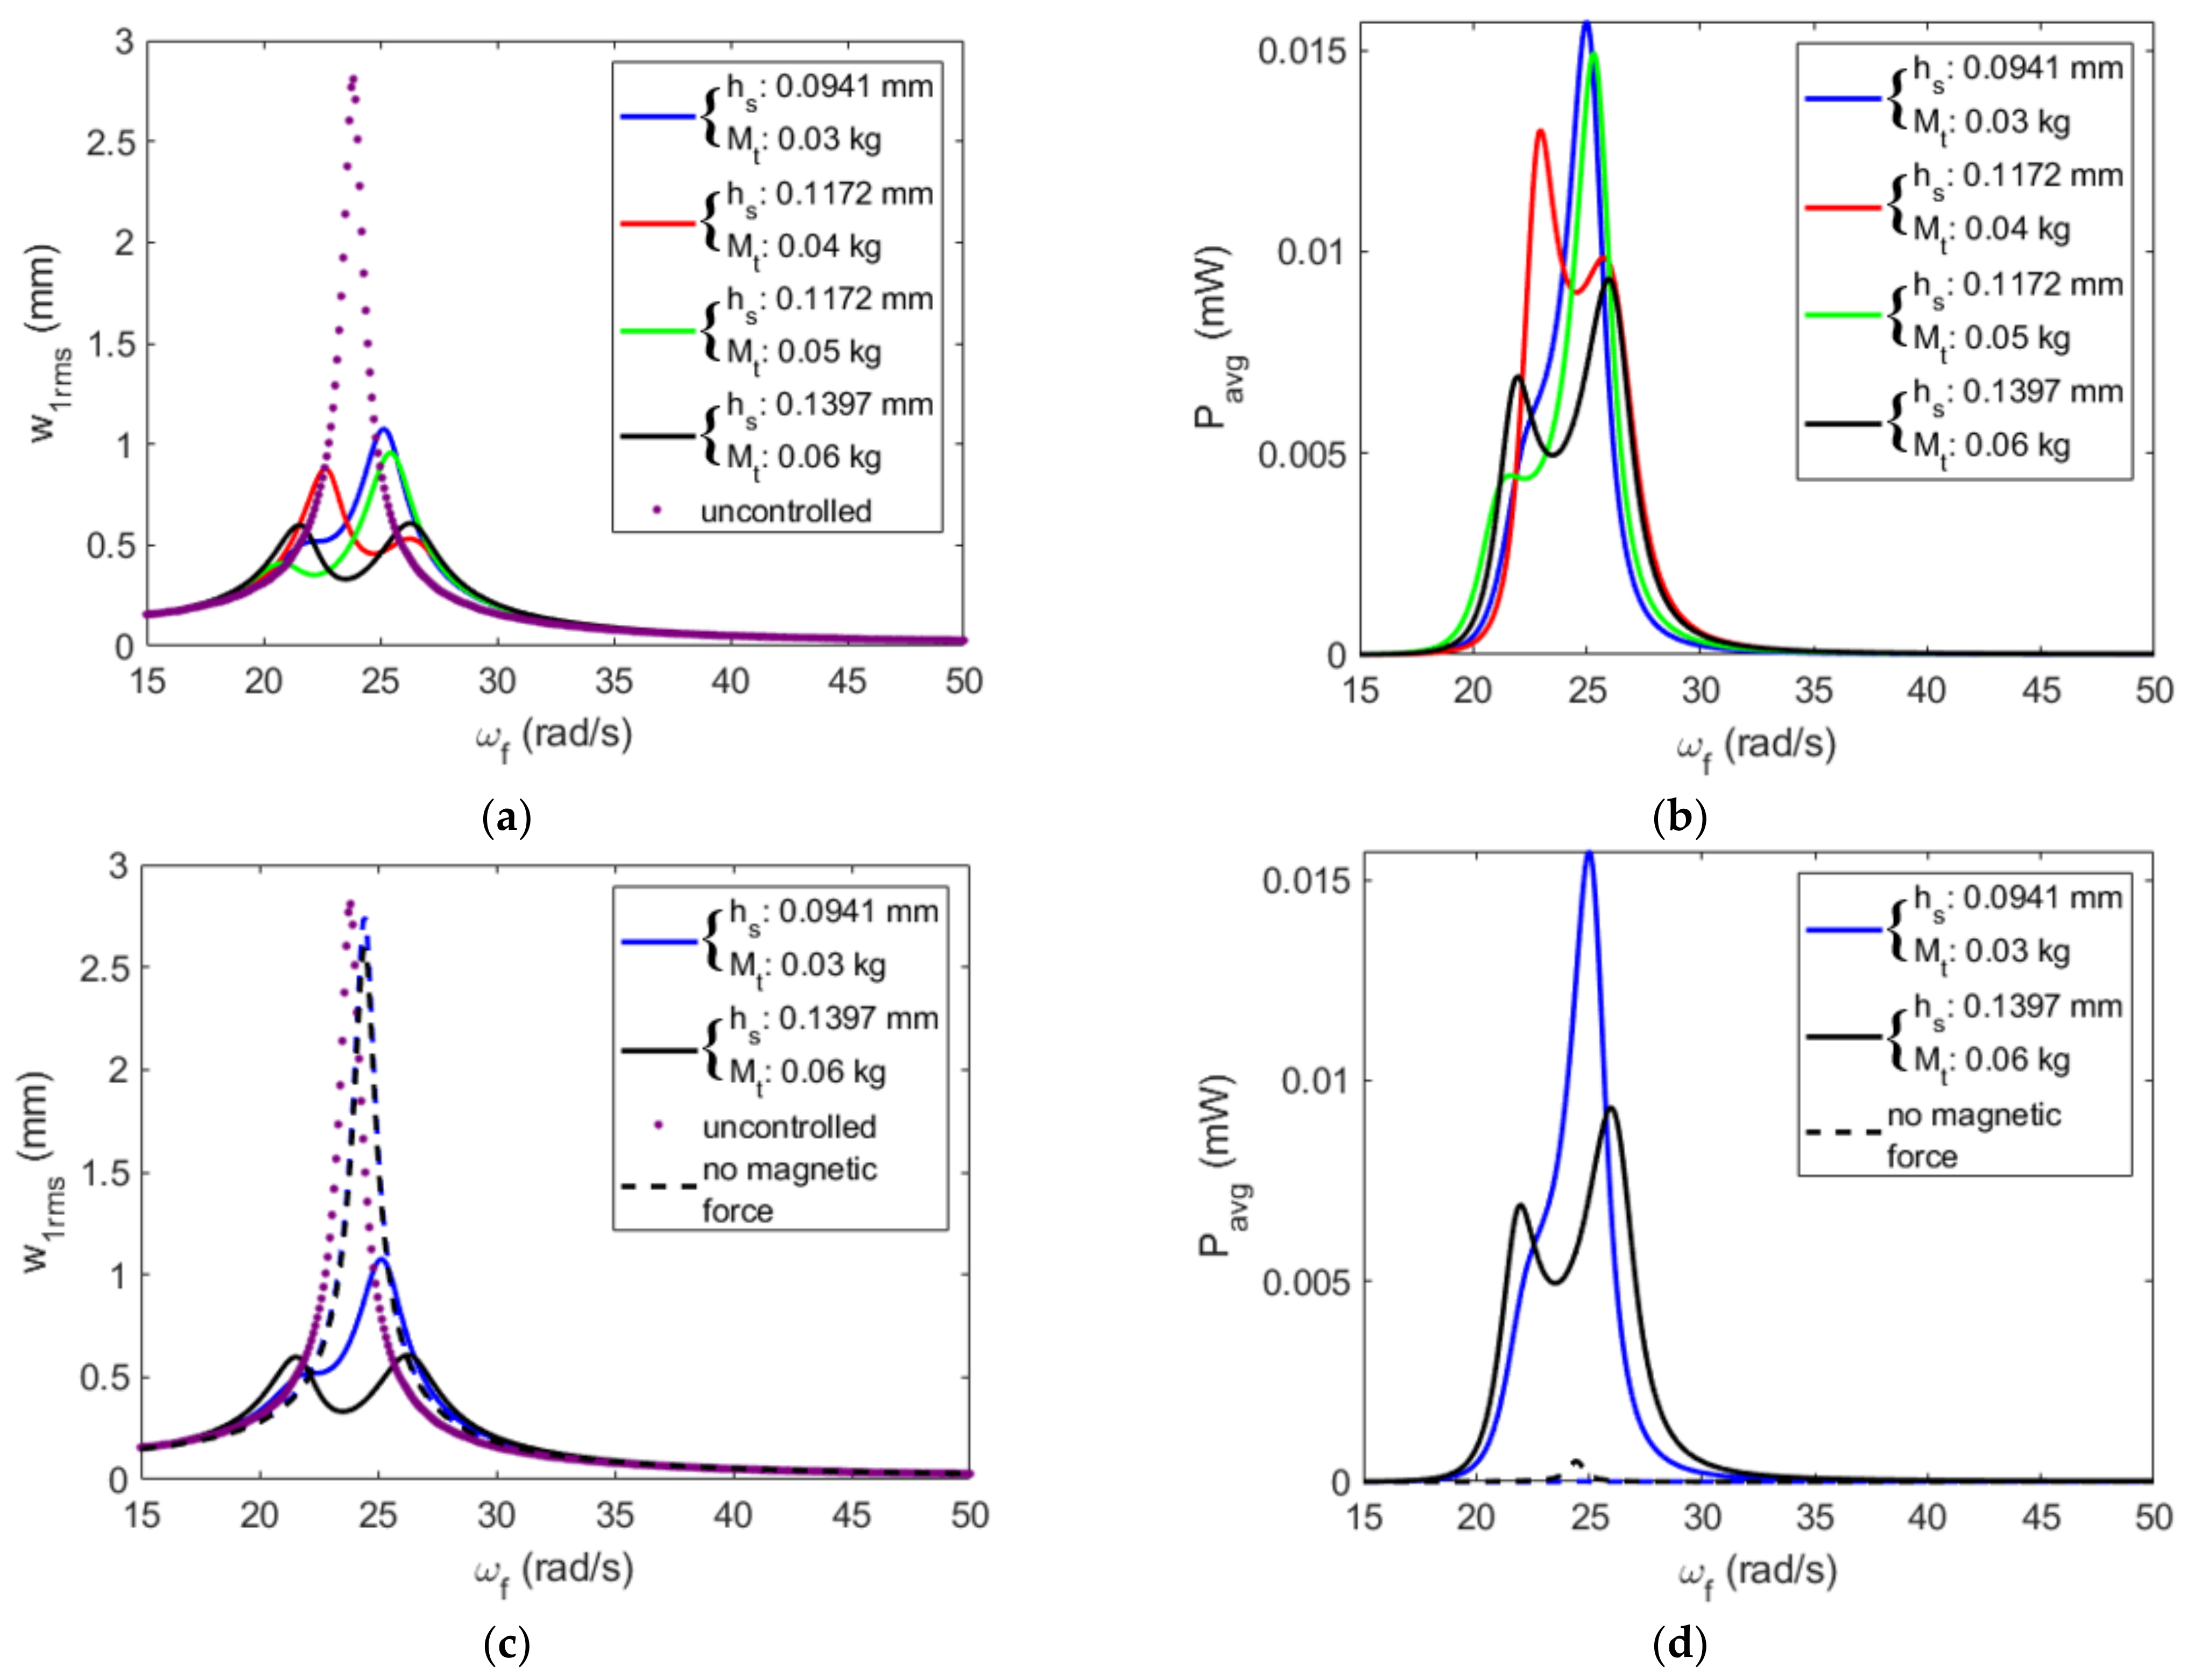
The tuned configurations for a gap of 5   m m are investigated to evaluate their effects on the primary structure’s displacement and the average power generated in Figure 26. Additionally, some gap sizes are compared with their no-magnet configurations in Figure 26c,d. Unlike the previous cases, the behaviors of the configurations are fairly distinct from each other. Although there are differences, all configurations adequately control the primary structure’s displacement. The configuration with a tip mass of 0.03   k g has the highest displacement, but it still reduces the uncontrolled displacement by 62%. The configuration with the highest reduction is the tip mass of 0.06   k g with a reduction of 78%. Unfortunately, this configuration also generates the lowest average power of 1.37 × 10 3   m W over the frequency range. The configuration with the highest average power of 1.7 × 10 3   m W is the tip mass of 0.04   k g . As expected, this small gap induces an extremely large hardening effect on the natural frequencies. The configurations with no magnets are completely decoupled and only reduce the uncontrolled displacement by 2%. Therefore, the tuned configurations generate a few orders of magnitude more power than that of the configurations without magnets.
The initial gap’s effects on the coupled natural frequency for the tuned configurations for a 5   m m gap are depicted in Figure 27. The configurations with a tip mass of 0.04   k g and 0.06   k g have the same higher coupled natural frequency. For the lower coupled natural frequency, the configuration with a tip mass of 0.04   k g is larger, which causes stronger coupling to occur and higher generated power. Additionally, the configurations with a tip mass of 0.03   k g and 0.05   k g appear to have strong coupling occurring at 4   m m , which shows the upper coupled natural frequency to be dominated by the primary structure. Since the coupled natural frequencies do not have a strong interaction, one of the resonant peaks will be much larger than the other, resulting in the large peak power generated but lower average energy harvested over the frequency range, as discussed in Figure 26.

4.3. Effects of the Forcing Amplitude on the System’s Efficiency

As mentioned previously, the amplitude of the forcing was lowered to 0.1   N in an attempt to generate more energy with the magnetic forces without pull-in occurring in the attractive configurations. This value is quite low and does not induce a high displacement of the absorber for high forces to be exerted by the magnet in the repulsive configurations. Therefore, a range of forcing amplitudes is evaluated in this section. Again, 10   m m , 7.5   m m and 5   m m are considered as gap sizes. For each gap, the tuned configuration with a tip mass of 0.06   k g will be used due to its strong performance for each gap in the previous section.
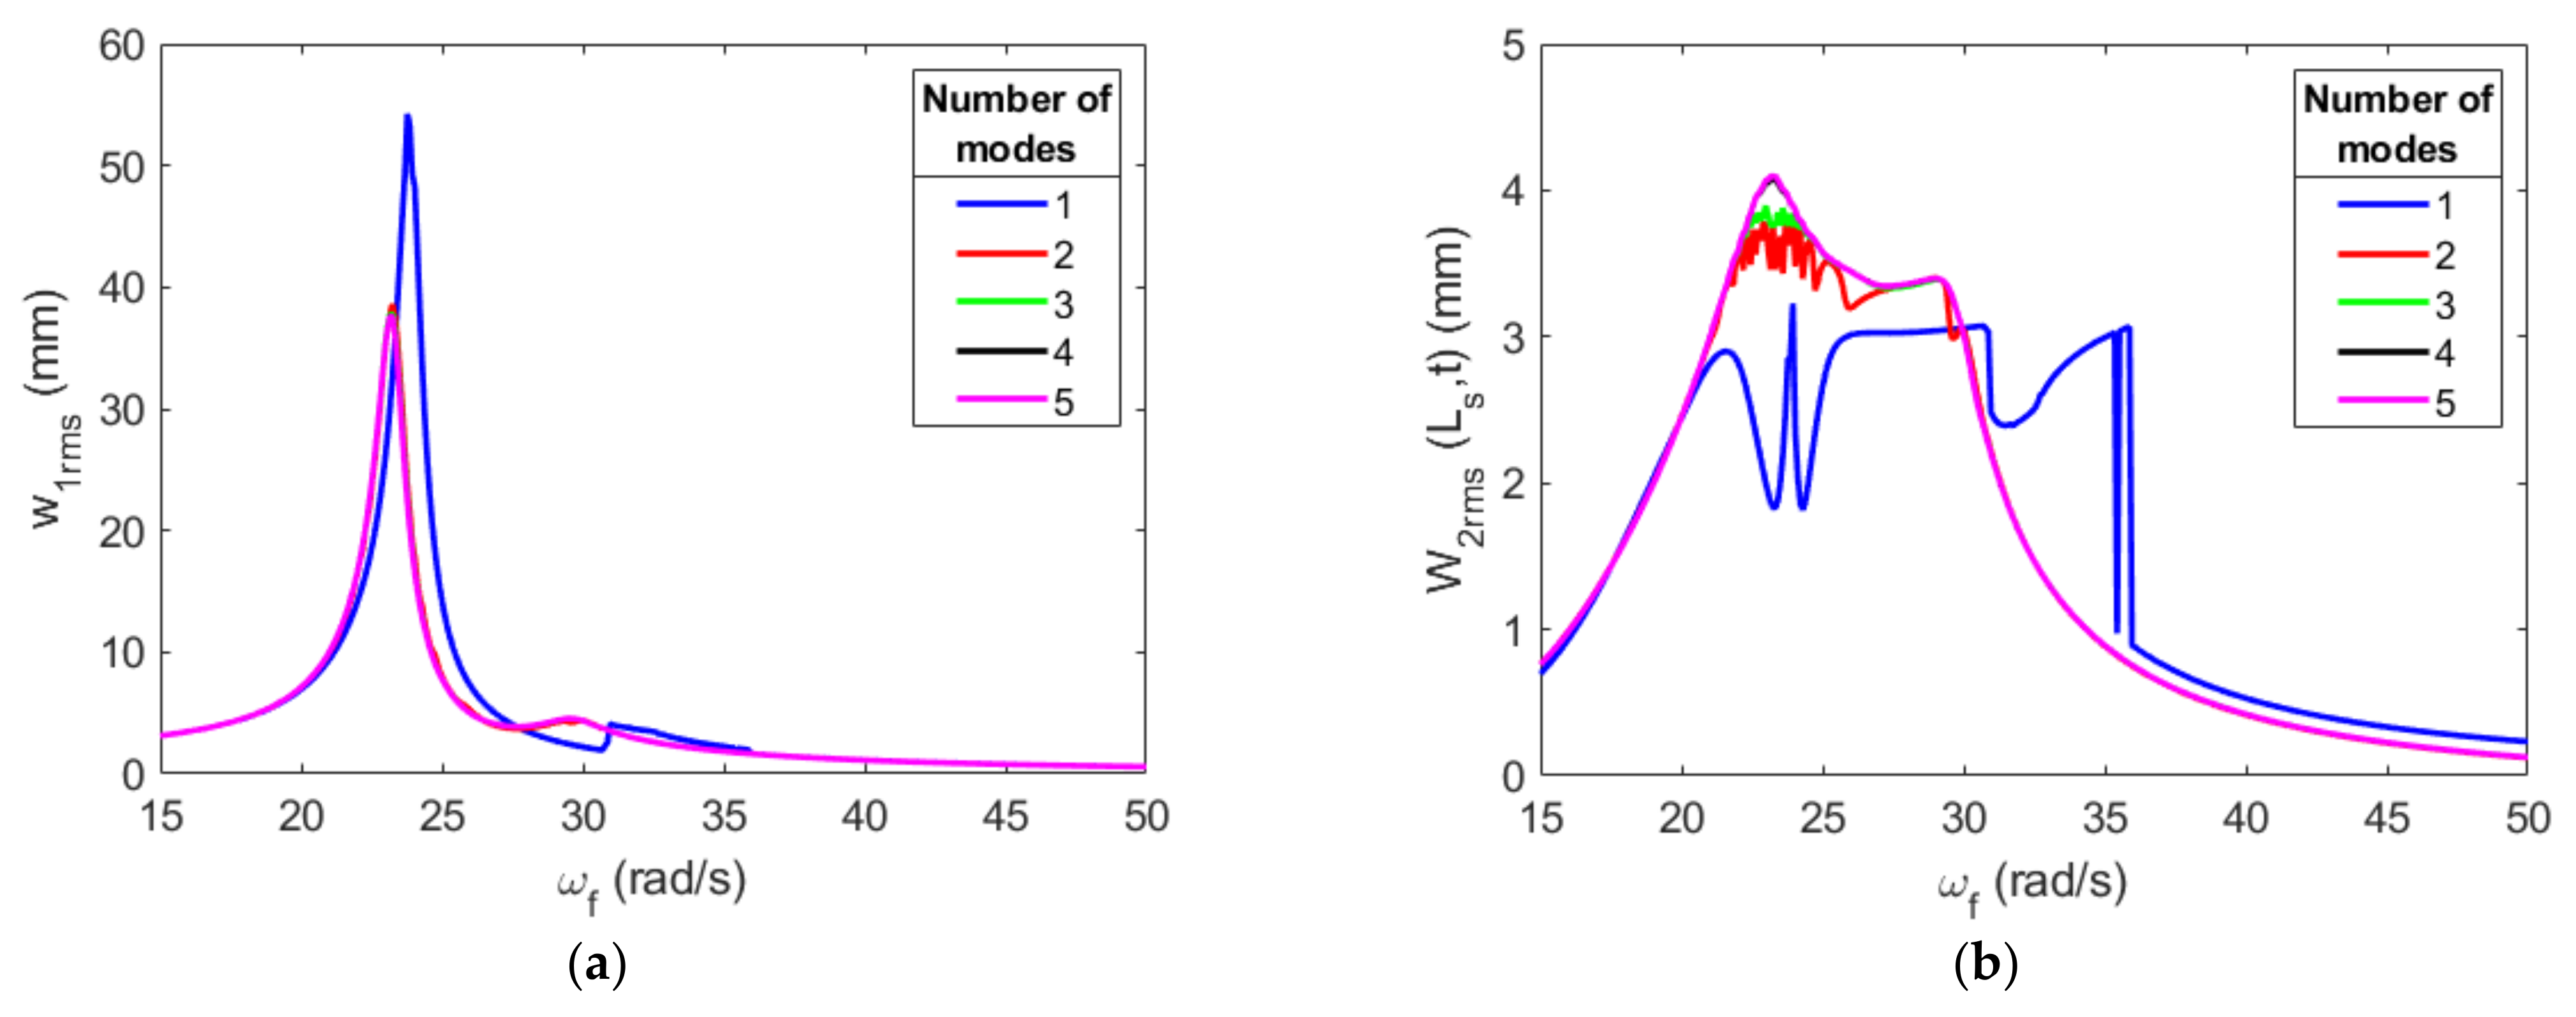
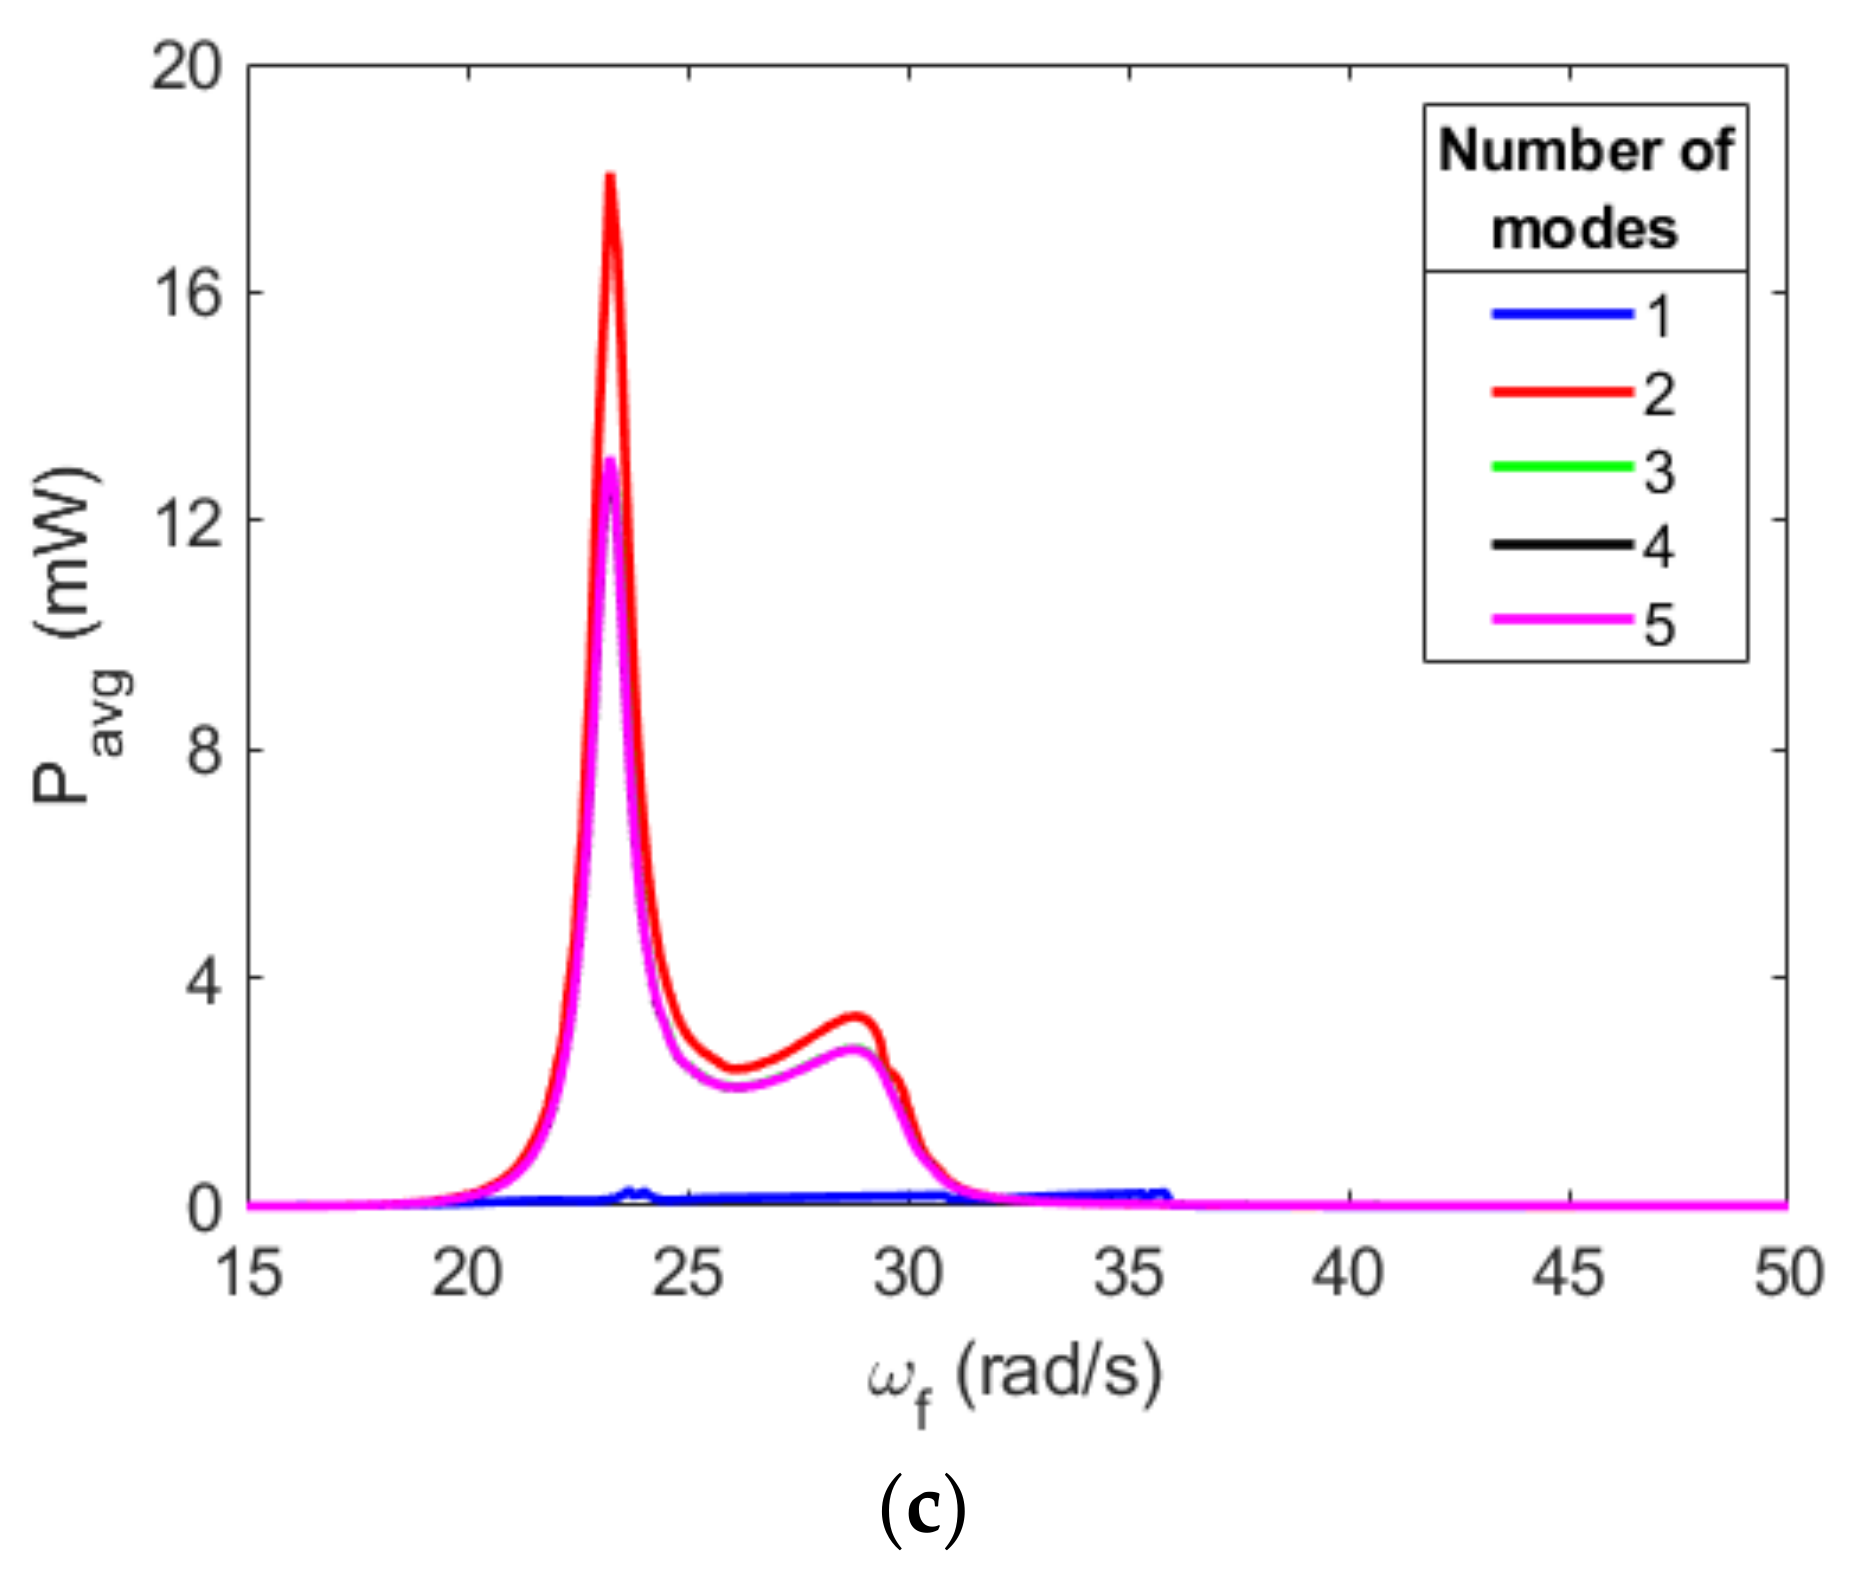
First, a convergence analysis is performed to confirm whether three modes still accurately represent the absorber’s response. Figure 28 depicts a convergence analysis for a forcing amplitude of 2   N and a gap of 5   m m . Interestingly, for the absorber’s displacement shown in Figure 28b, a one-mode approximation depicts a broadband response with an aperiodic region seen at the end of the resonant band, which appears as the drop in amplitude that is averaged out by the root mean square function. The second and third modes do not have a broadband response, but the first resonant peak behaves chaotically. Modes four and five no longer display chaotic behavior, although there is some noise in the first resonant peak. Additionally, modes four and five are extremely close. Since the primary structure’s displacement and the power generated have overlapping results for all modes except the first, the approximations of the four modes with the Galerkin approach are used to accurately represent the absorber’s behavior.
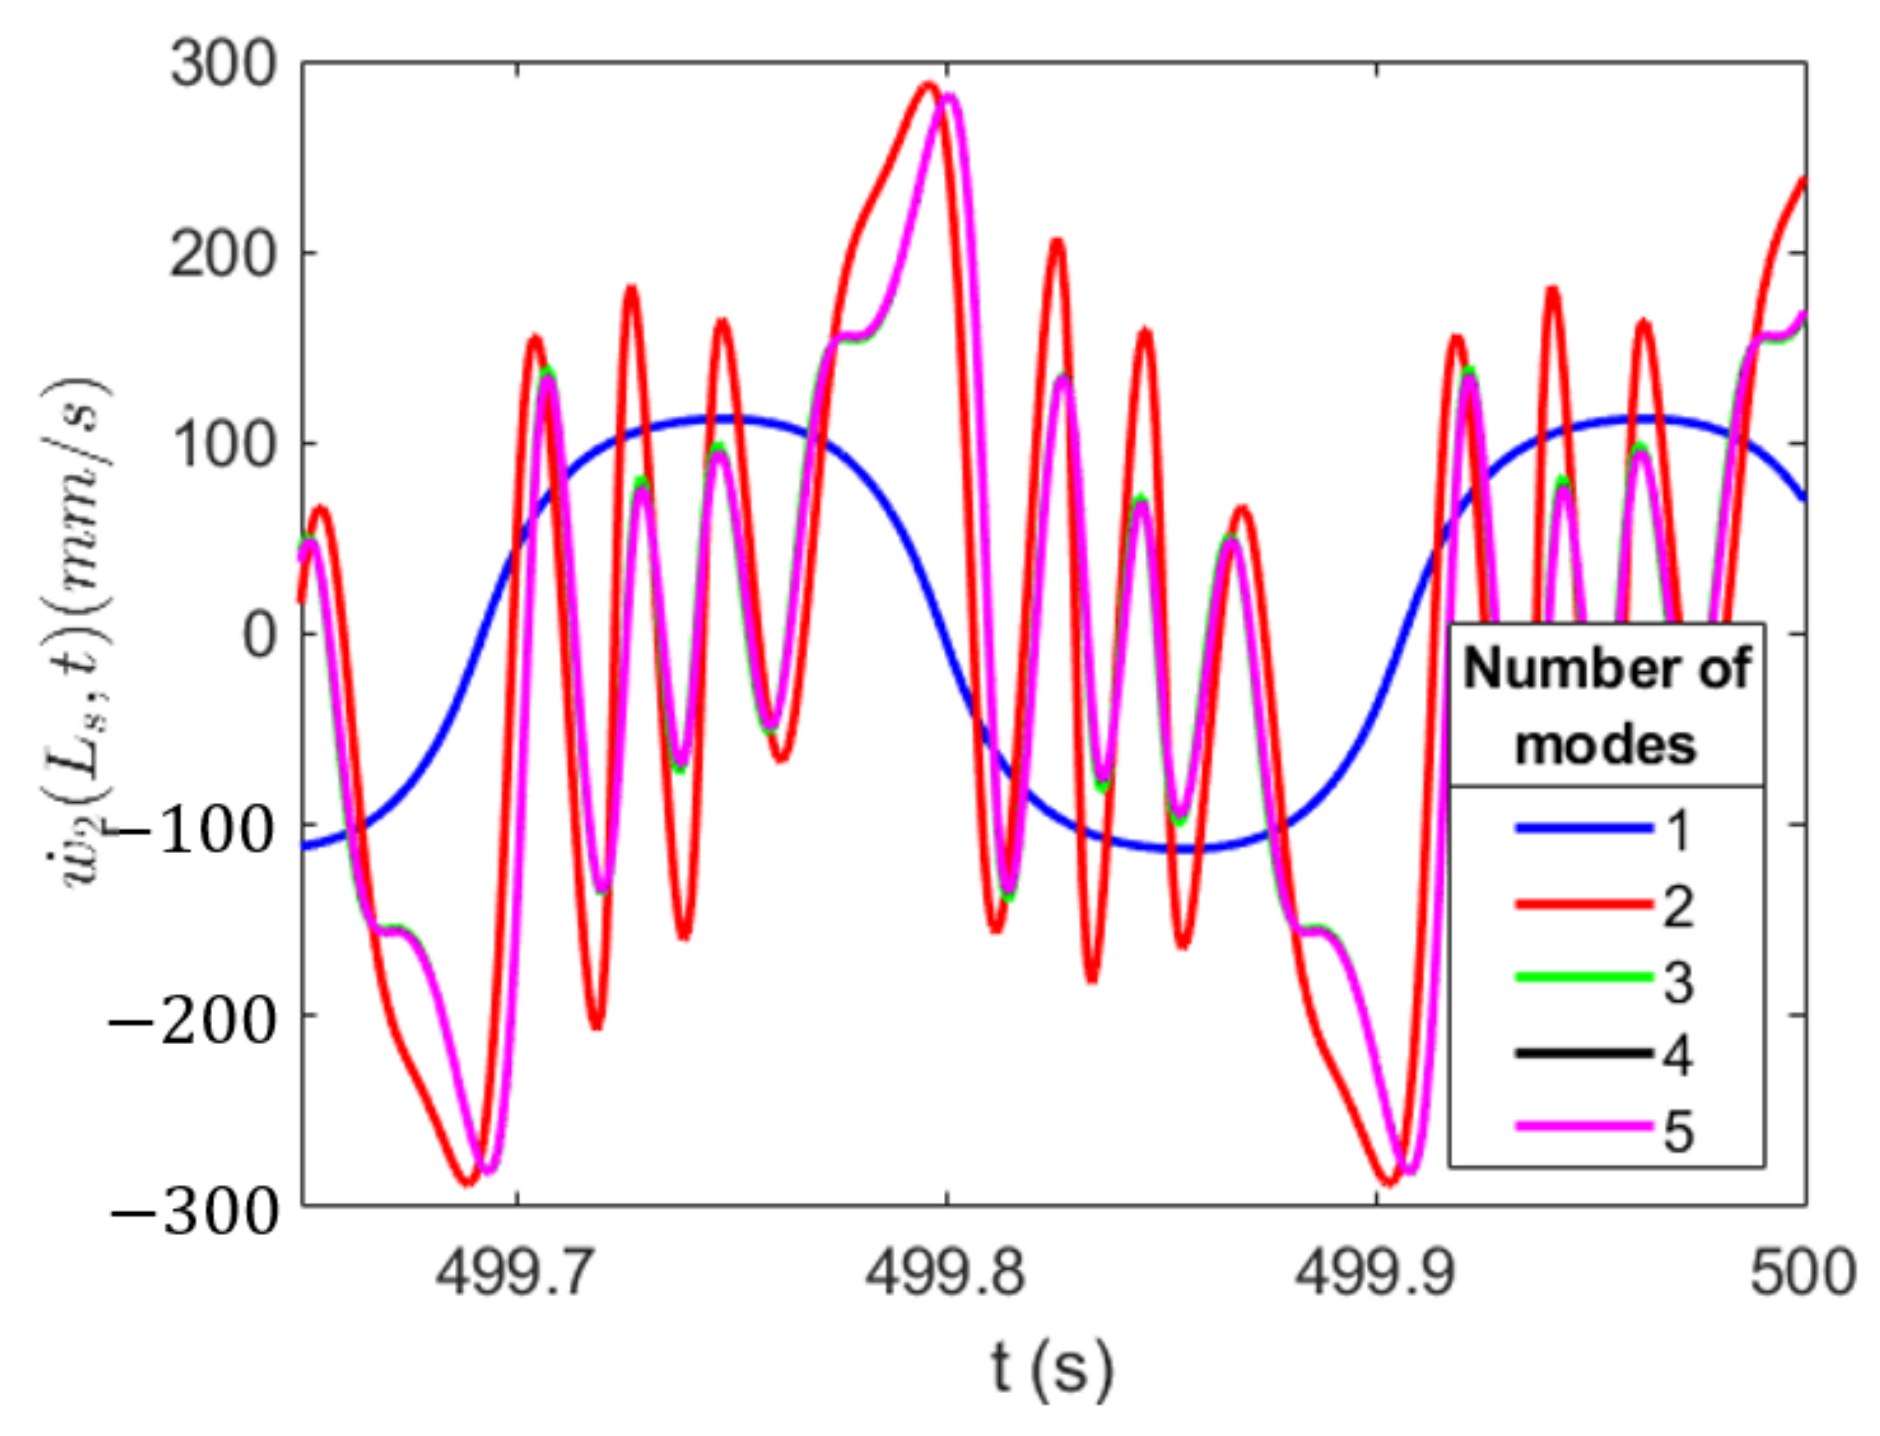
The convergence analysis shows some intriguing behaviors. The power associated with the solution with only one mode, which failed to converge in Figure 28c, is five orders of magnitude smaller than the converged solution of four modes. This is especially interesting because the primary structure and the absorber’s displacement have the same order of magnitude between the converged solution and the single-mode solution. Since the electric coupling equation of motion, Equation (18), is dependent on the velocity of the absorber, a time history of the absorber’s velocity for each solution with the varying number of modes is displayed in Figure 29. When there is only one mode, the system behaves periodically with a low frequency. The converged solution has aperiodic behavior with a high frequency. This high frequency greatly increases the power generated and could greatly benefit the system’s performance.
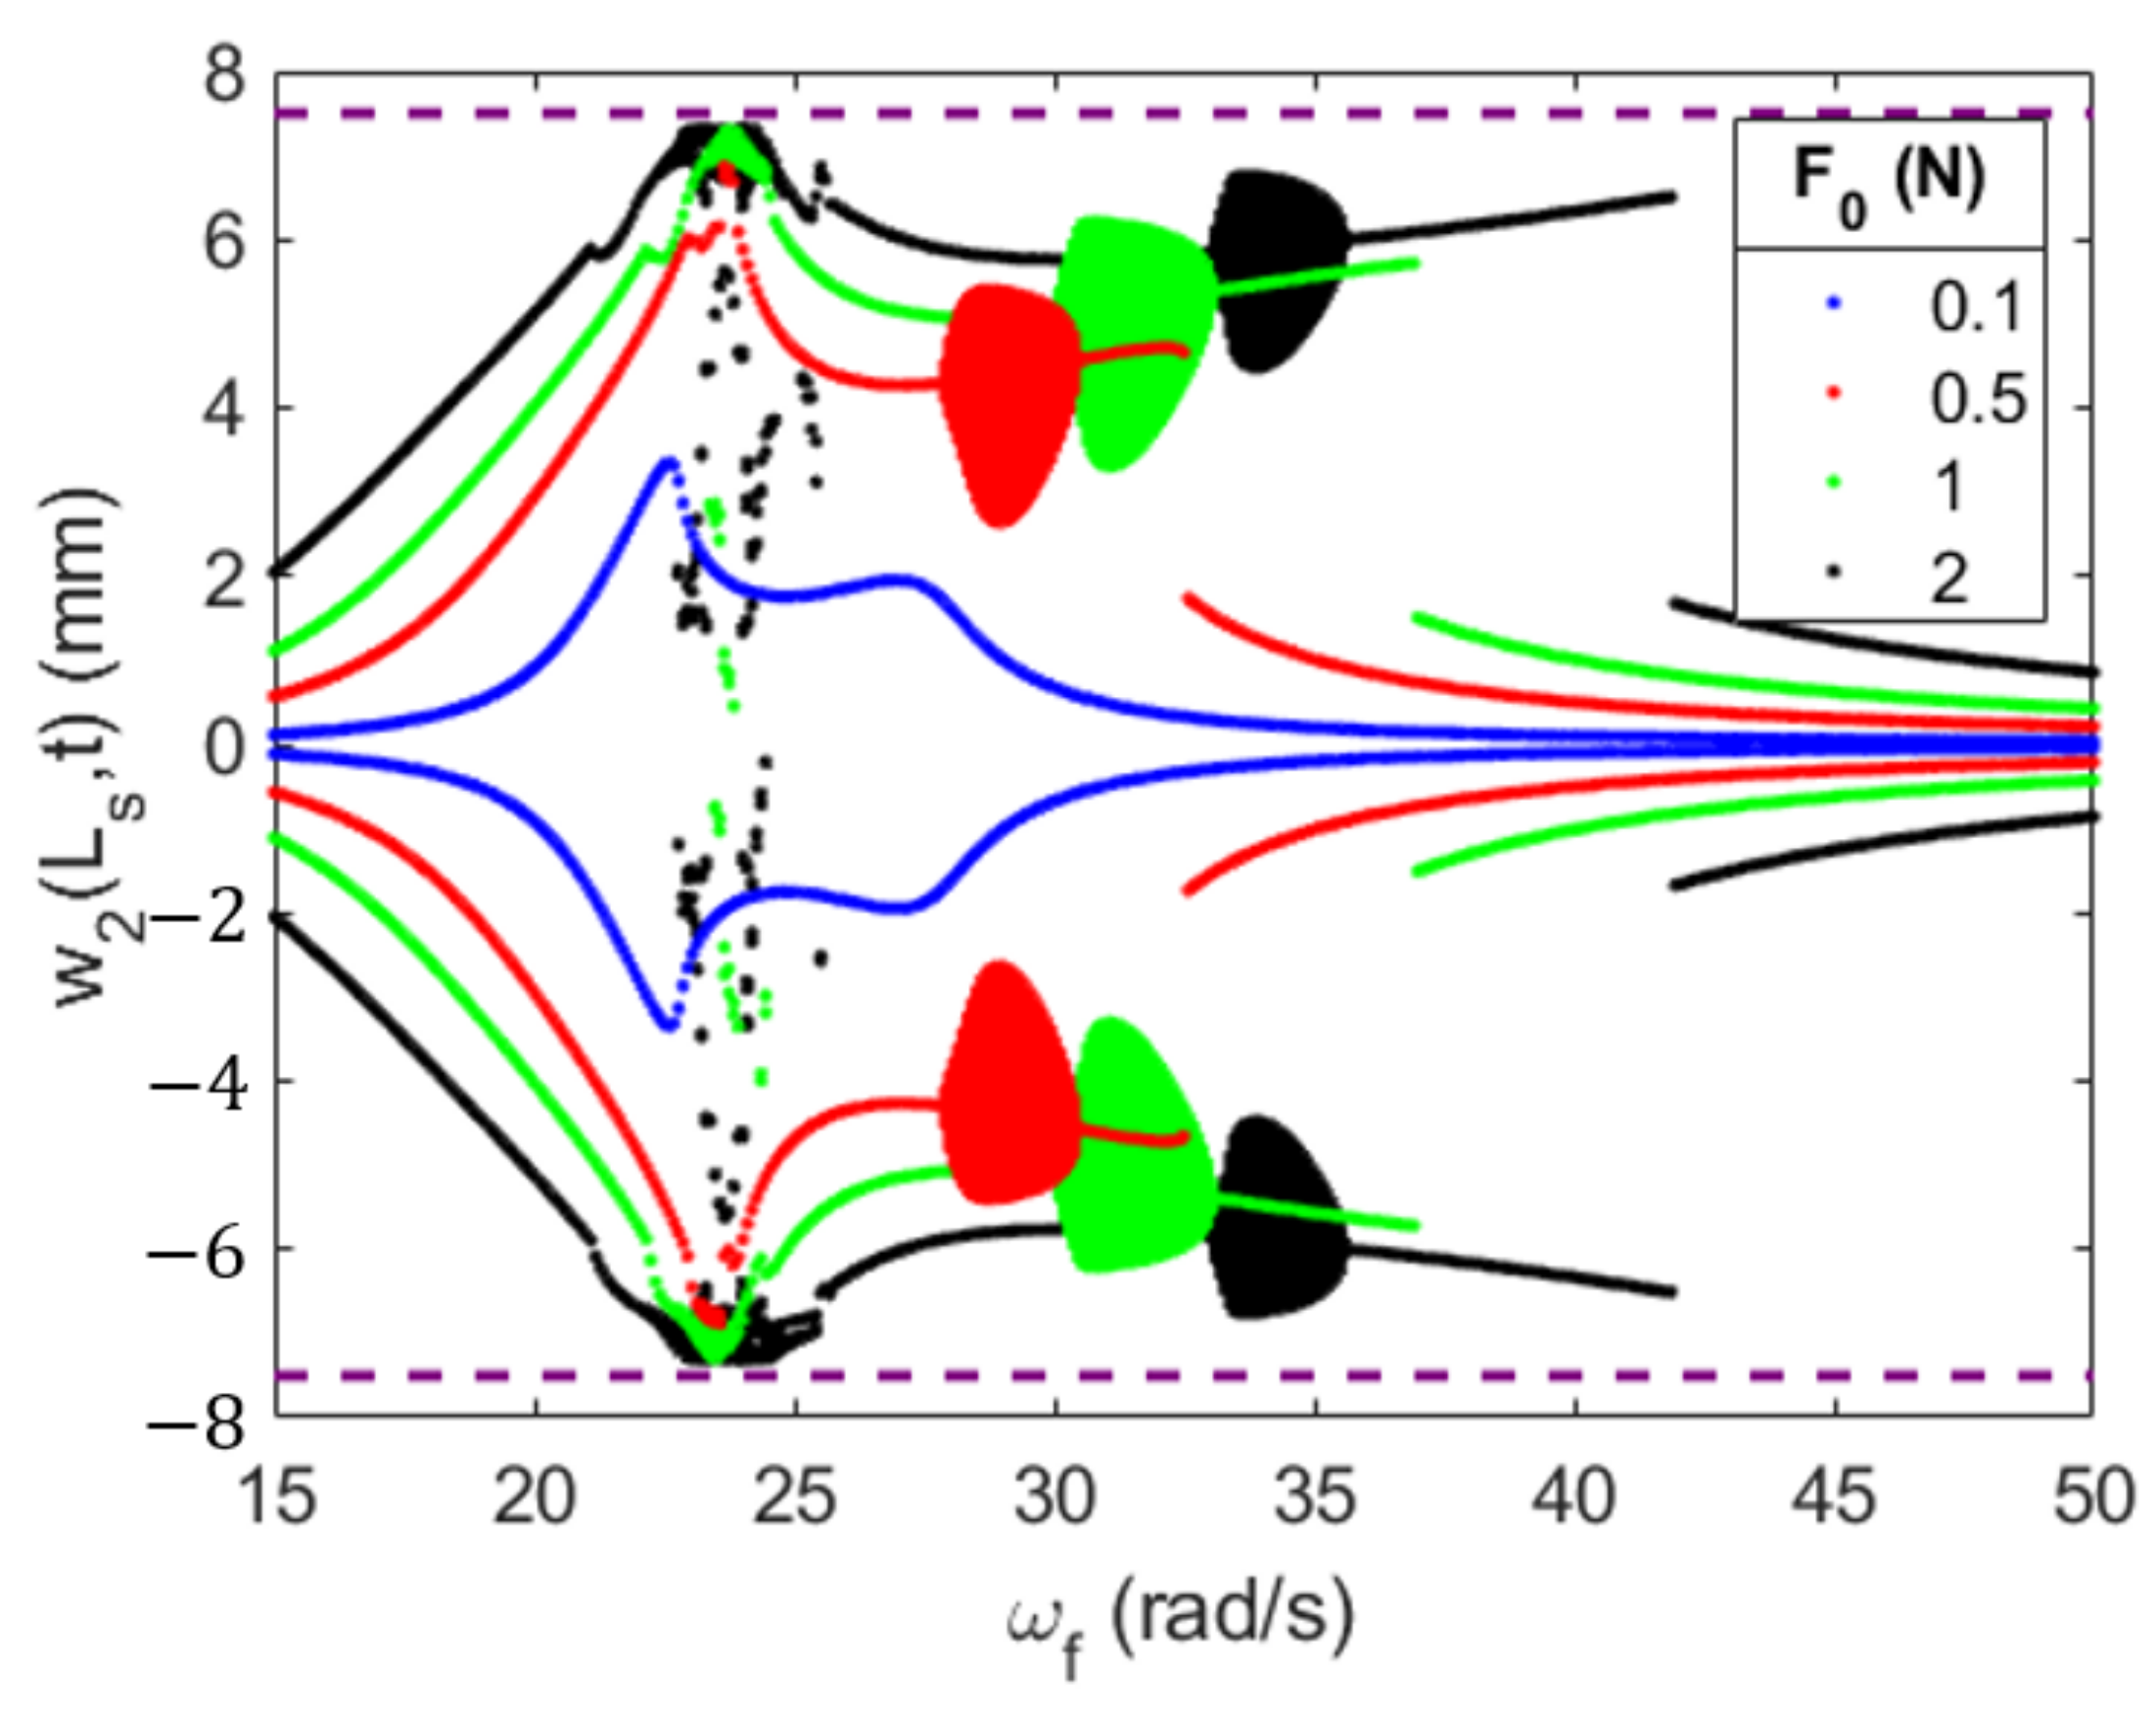
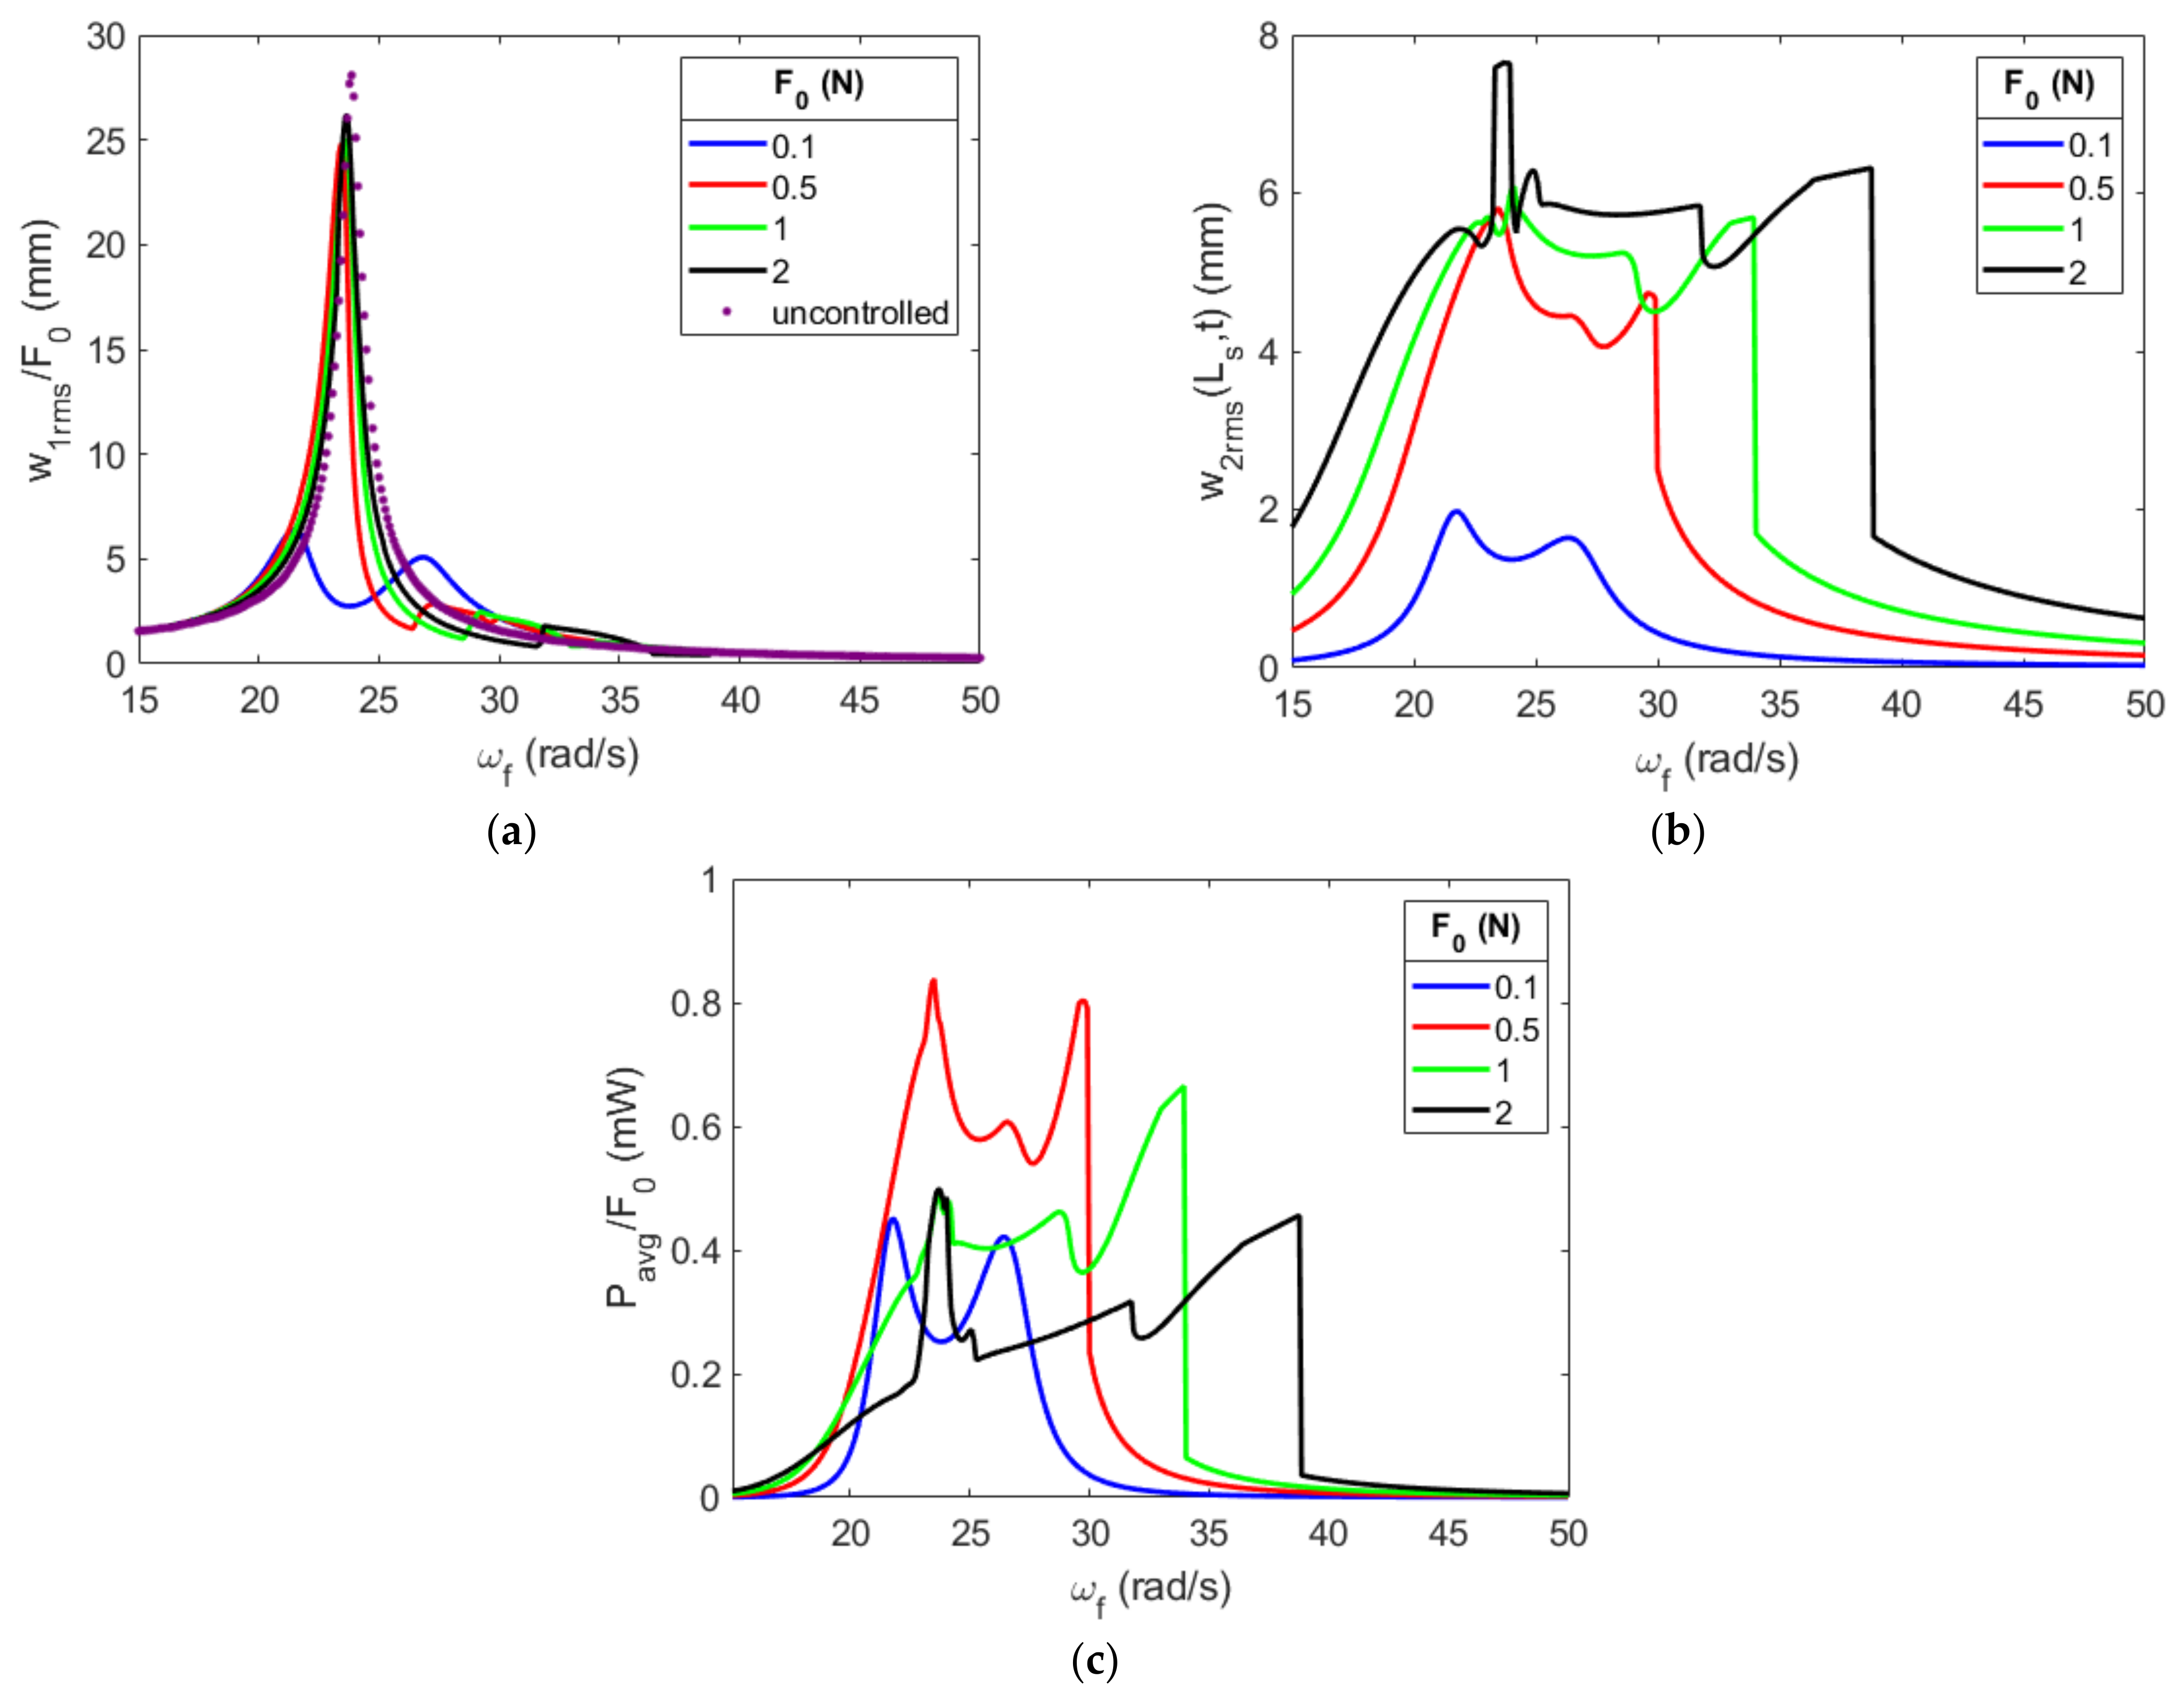
Figure 30 shows the effects of the forcing amplitude on the system with an initial gap of 10   m m , a tip mass of 0.06   k g and a substrate thickness of 0.4759   m m . Additionally, the primary structure’s displacement and energy harvested are normalized to the excitation amplitude to accurately describe the effects of the excitation amplitude on the system’s performance. When the forcing increases beyond 0.1   N , the control of the primary structure’s displacement is lost. The forcing amplitude of 2   N only reduces the displacement by 7%. Additionally, a broadband region is seen in forcing amplitudes above 0.1   N and increases its width as the forcing amplitude increases due to the absorber’s displacement being close to the magnet. As the forcing increases, the absorber’s displacement cannot increase, so the energy of the system does not dissipate and continues to quickly oscillate between the magnets. It is clear that the nonlinear effects of the magnetic force take place, and nonlinear hardening behavior is observed, as shown in Figure 30b. There is also an aperiodic region developed in the broadband region seen as the temporary drop in displacement. Further, the forcing amplitude of 2   N develops an aperiodic region in the first resonant peak. Similar trends and behaviors occur in the generated power in Figure 30c. The forcing amplitude of 0.5   N generates the most power comparatively when normalized to the forcing amplitude. As the forcing amplitude increases further, the broadband increases over the frequency range, but the peak power decreases. This decrease in peak power results in the amplitude of 0.5   N also having the highest average power generated over the frequency range. The 1   N and 2   N excitation amplitudes both generate just over double the average power compared to that of the 0.1   N case, which would be excellent for applications with a wide range of frequencies. However, the fact that the control of the primary structure is lost signifies that these configurations are not desirable.
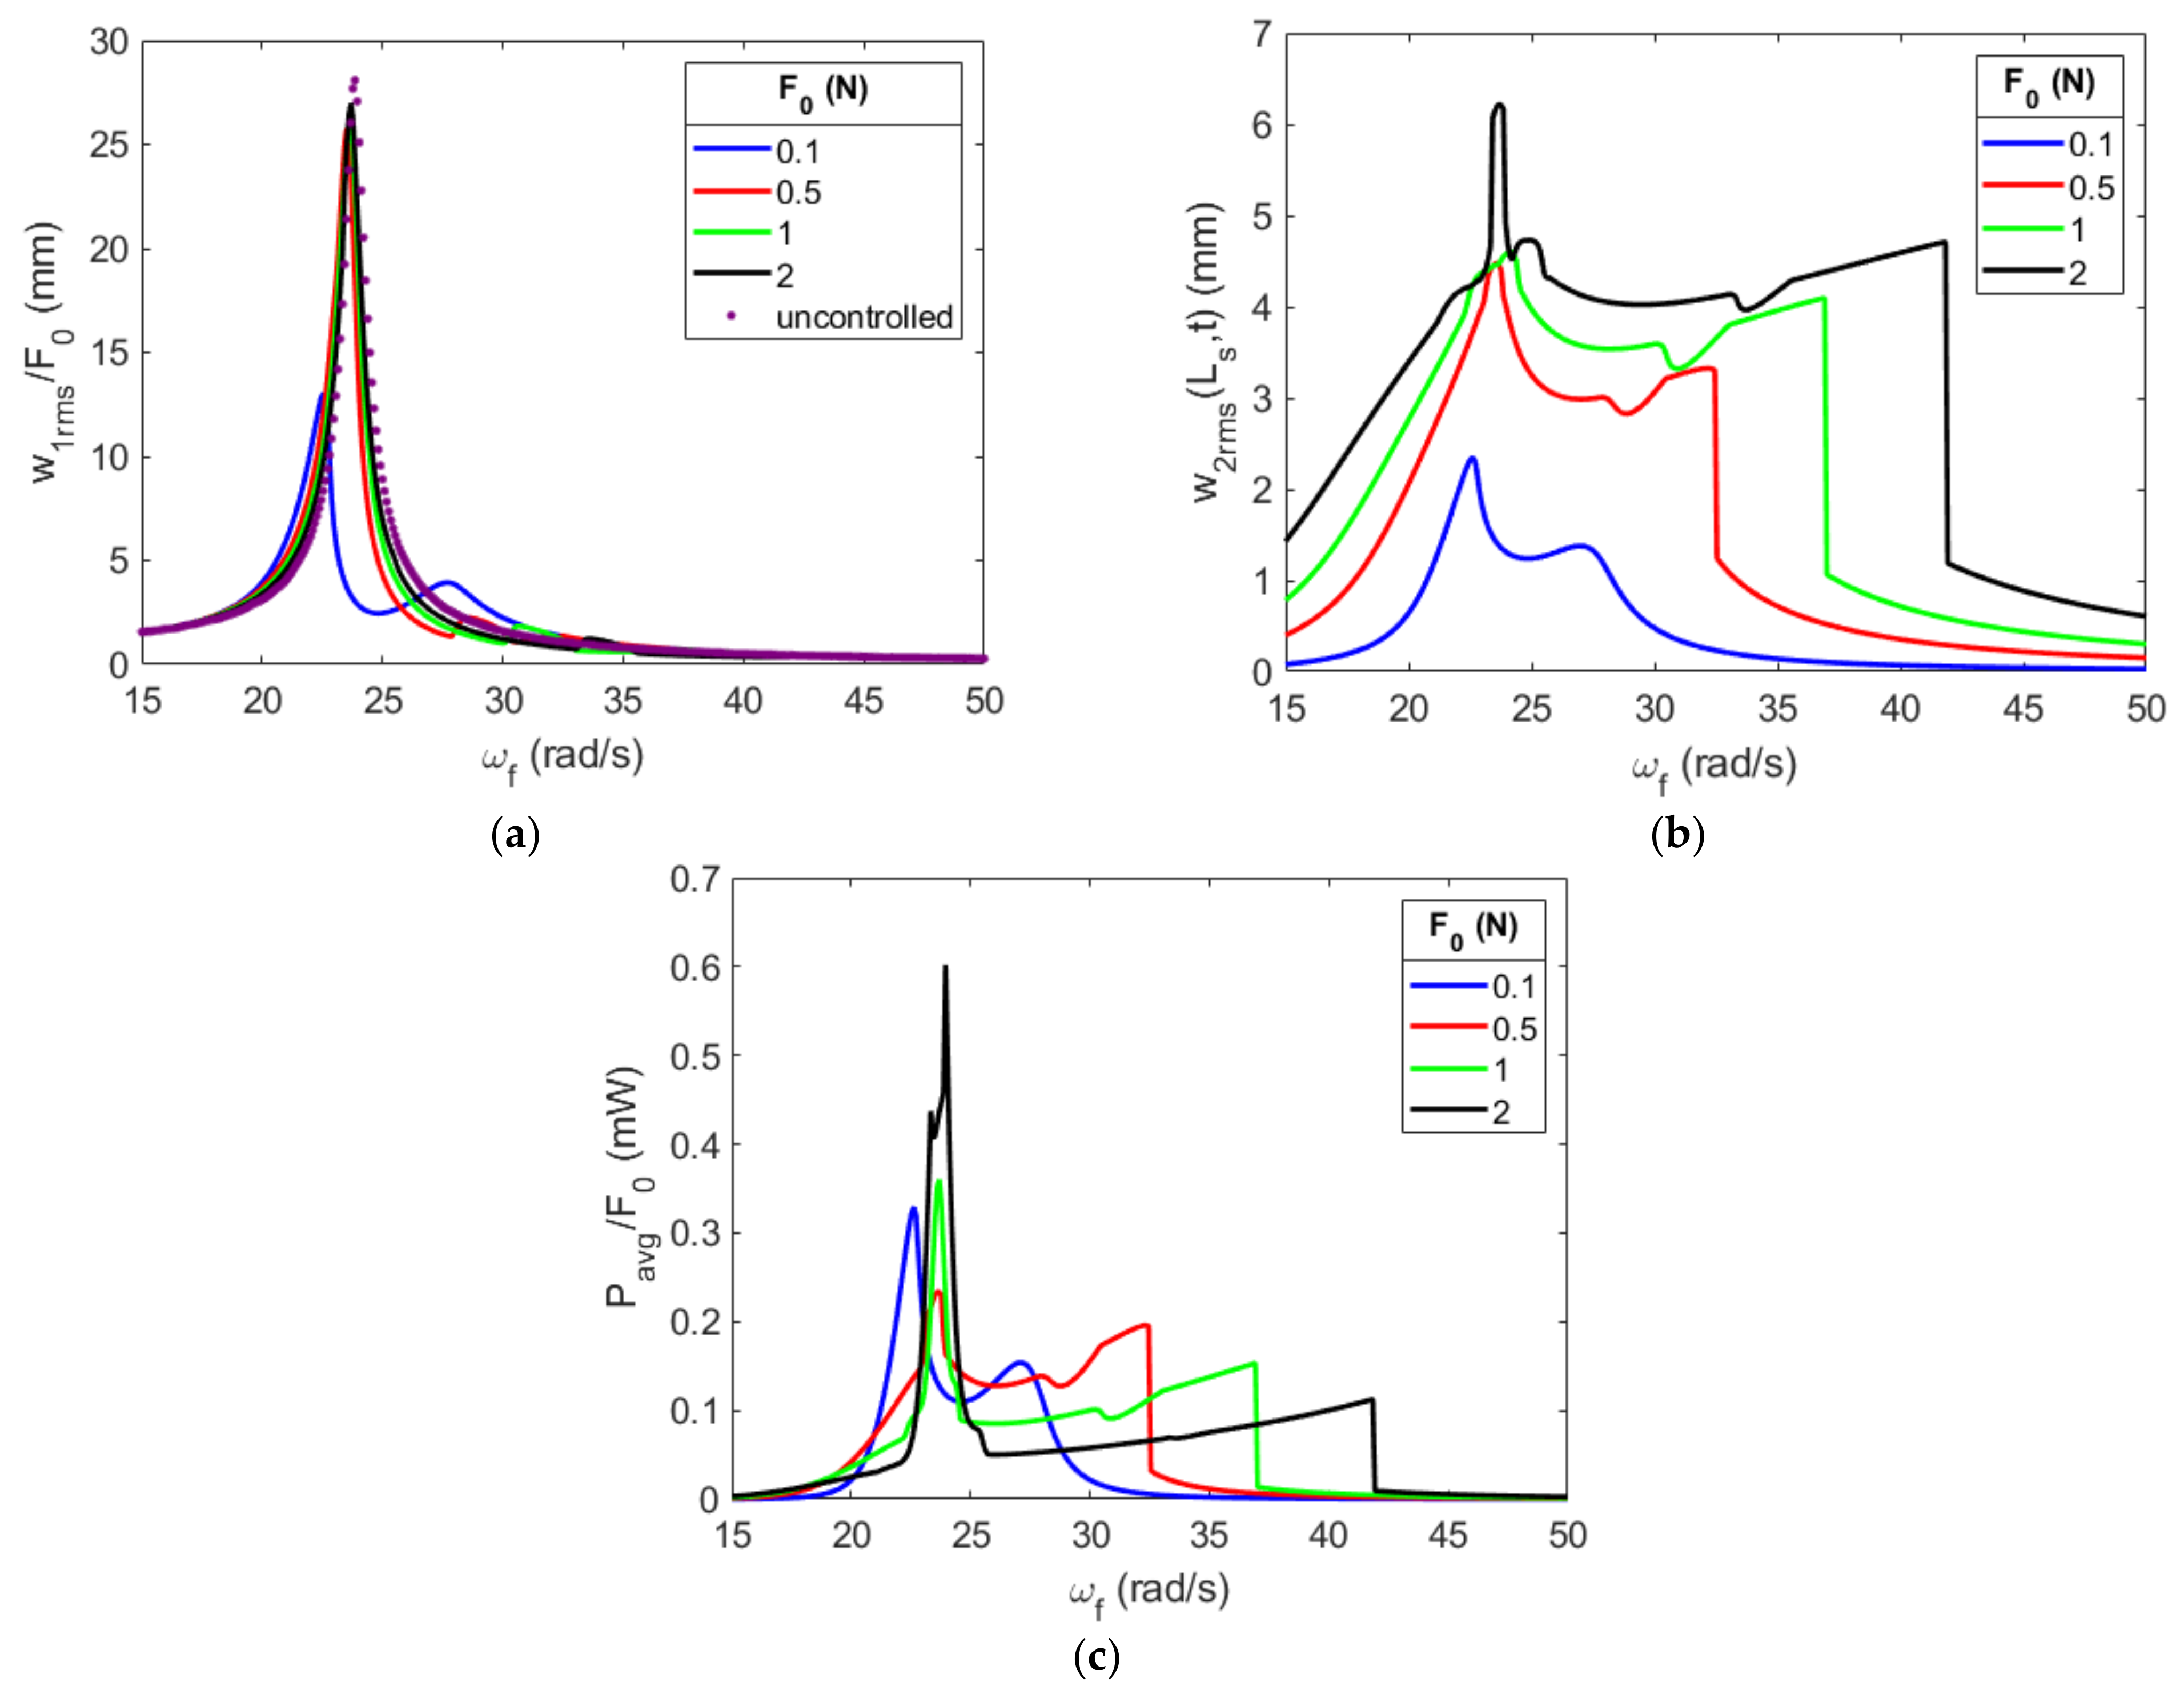
Figure 31 shows the effects of the forcing amplitude on the system with an initial gap of 7.5   m m , a tip mass 0.06   k g and a substrate thickness of 0.3638   m m . The absorber’s displacement, seen in Figure 31b, behaves very similarly to when the gap is 10   m m . However, there are a few key differences. First, the broadband region for each forcing amplitude larger than 0.1   N increases, on average, by 1.667   r a d / s . Additionally, the aperiodic region in the second resonant peak decreases in both amplitude variation and width when compared to the gap of 10   m m . Both of these factors should be attributed to an increase in average power over the frequency range when compared to the gap of 10   m m . However, the average of the normalized energy being harvested greatly decreases, producing less normalized energy, on average, than the 10   m m gap with a 0.1   N amplitude. Again, the presence of the aperiodic regions greatly affects the absorber’s ability to control the primary structure’s displacement. The forcing amplitude of 2   N only reduces the primary structure’s displacement by 3.8%. Coupled with the low levels of power generated, this demonstrates that a gap size of 7.5   m m does not benefit the system’s response.
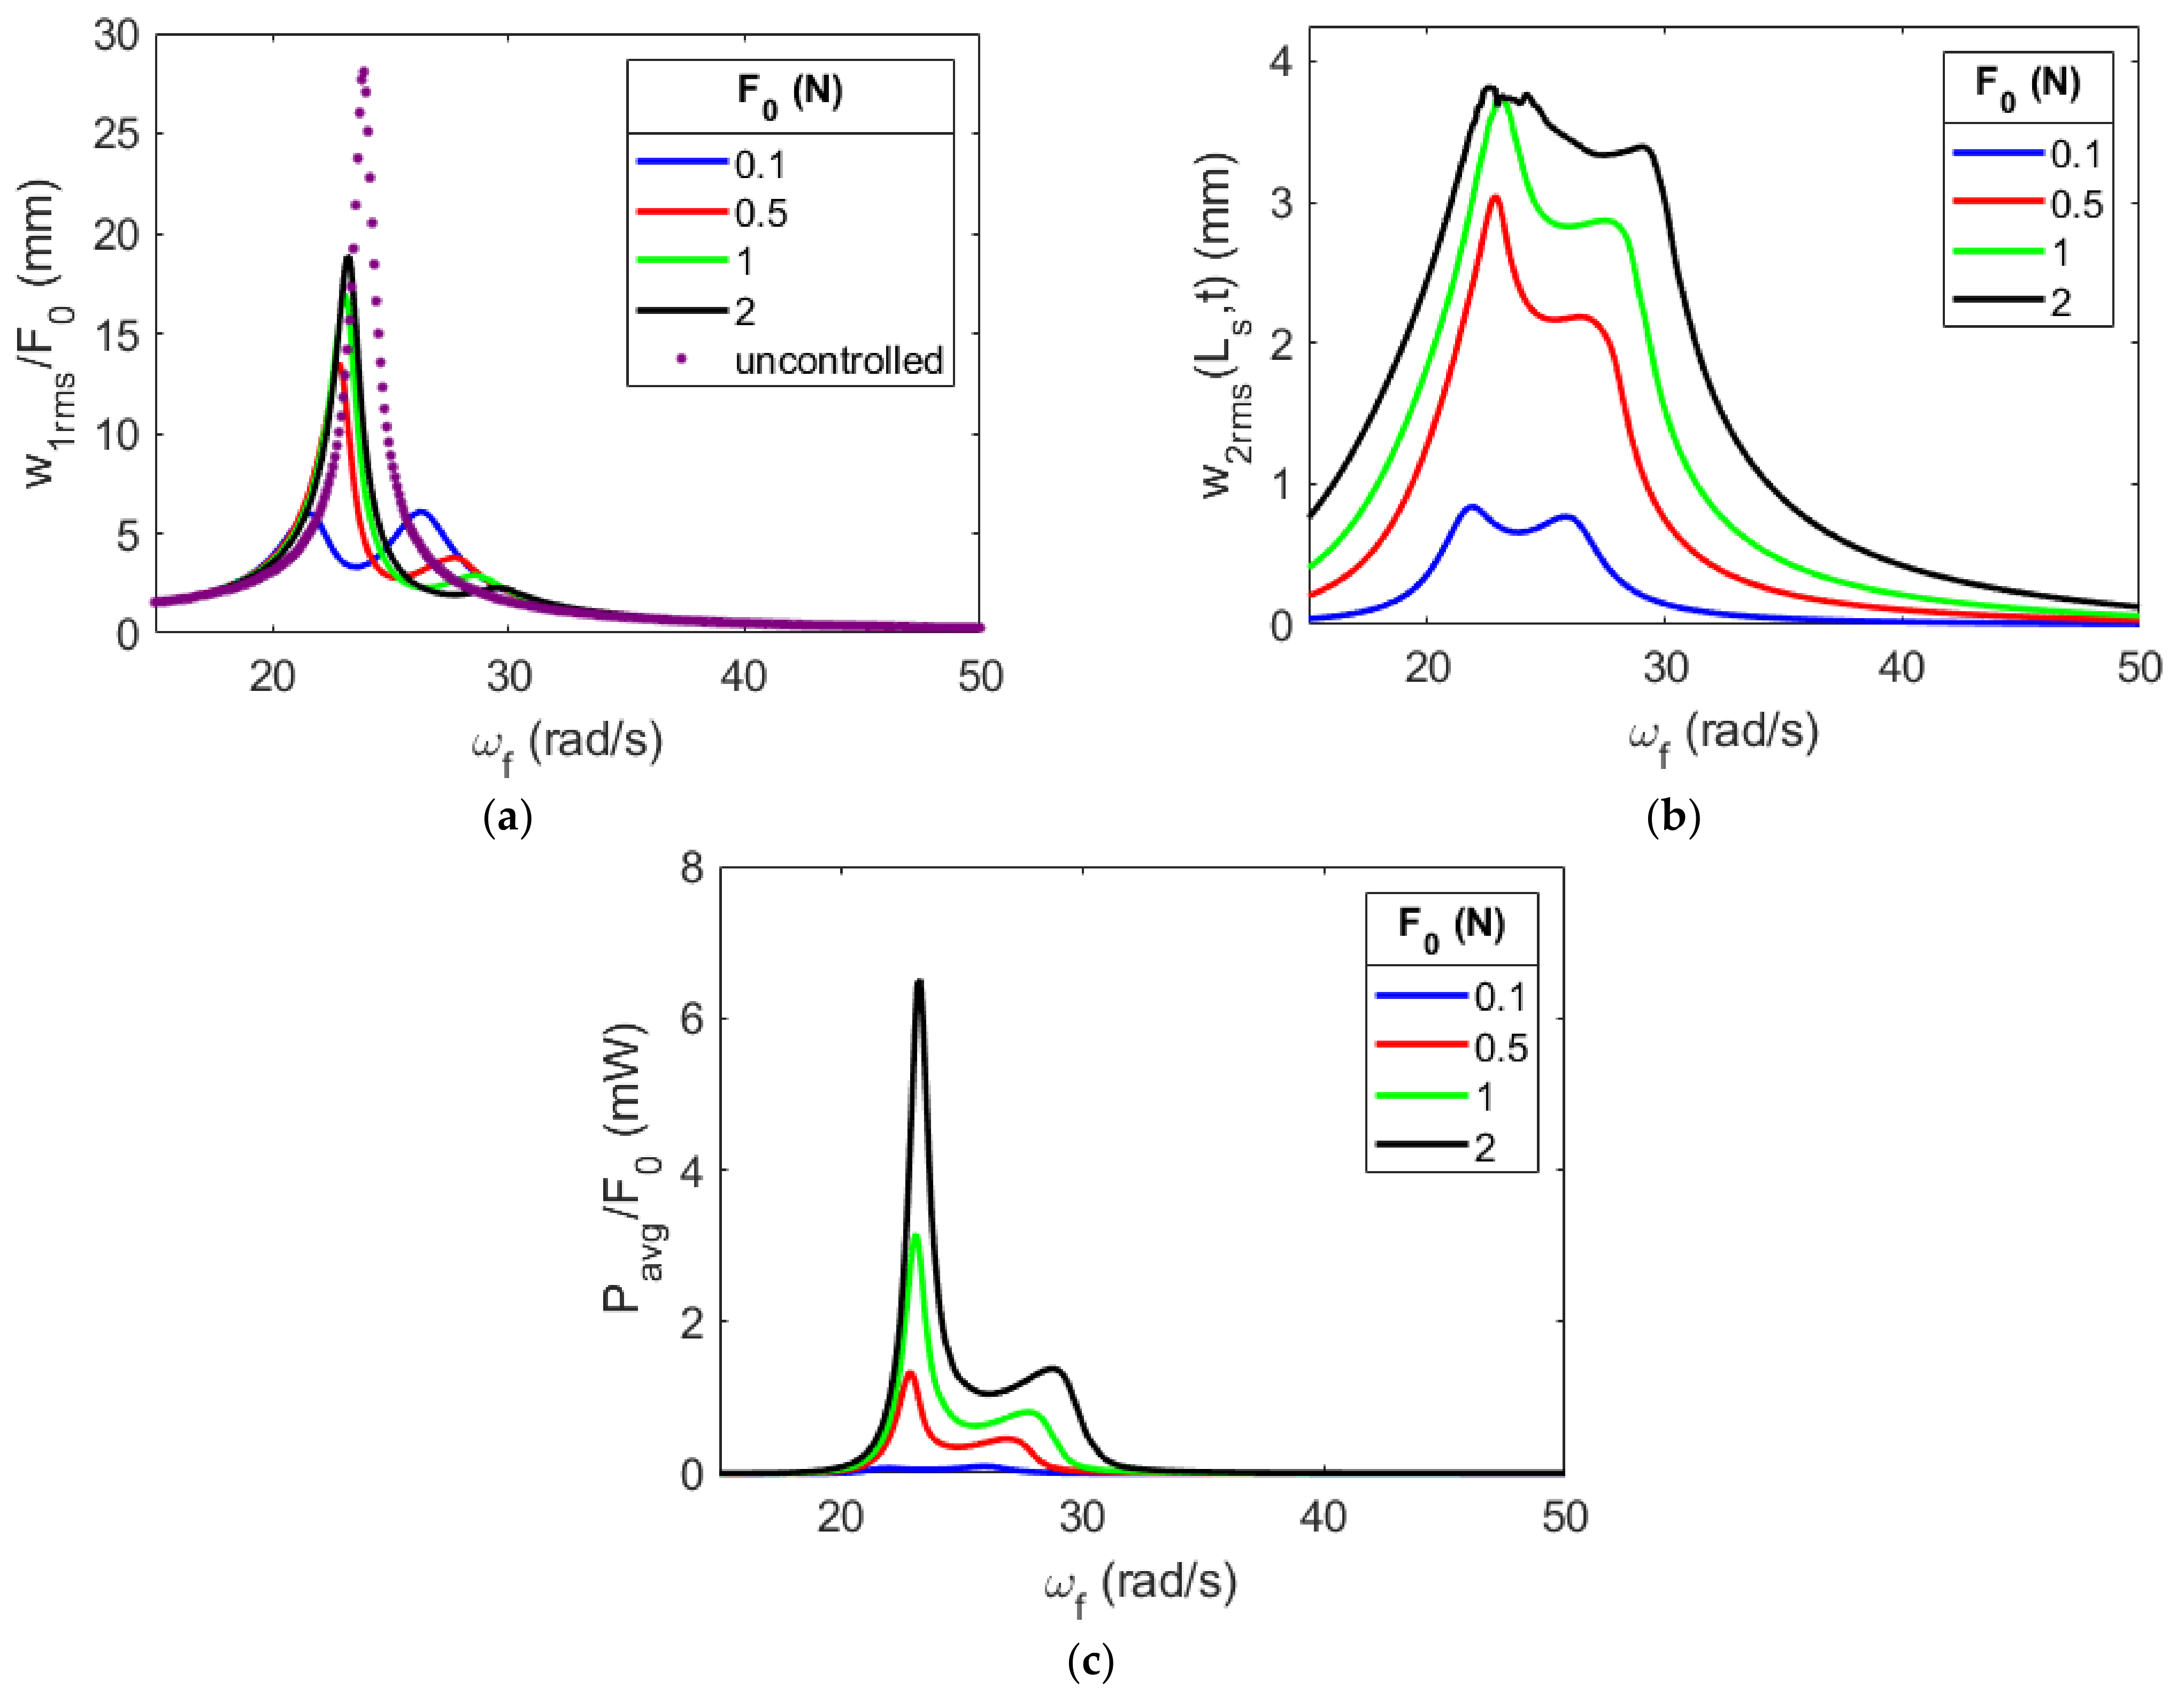
The plotted curves in Figure 32 show the influences of the forcing amplitude on the system with a gap of 5   m m , a tip mass of 0.06   k g and a substrate thickness of 0.1397   m m . This configuration does not have aperiodic regions present. In addition, a large nonlinear hardening producing a broadband region in the second resonant peak does not occur. As the forcing amplitude increases, a shift in the resonant peaks is visible, indicating the nonlinear effects’ dependence on the forcing amplitude. When looking at the normalized power in Figure 32c, a forcing amplitude of 2   N increases the peak power by 69 times over the forcing amplitude of 0.1   N . As discussed previously, this is due to this configuration causing the absorber to oscillate at a much higher frequency, greatly increasing the absorber’s velocity. Additionally, the bandwidth of frequencies increases with increasing forcing amplitude to harvest energy. The forcing amplitude of 2   N reduces the uncontrolled amplitude by 36%. This reduction might not be large enough to avoid damage, but it is a great improvement over the gap sizes of 10 and 7.5   m m . The forcing amplitude of 0.5   N controls 48% of the primary structure’s uncontrolled amplitude. Depending on the requirements of the absorber, this could be a worthwhile tradeoff between harvested energy and the control of the primary structure. Additionally, further investigations are warranted into forcing amplitudes between 0.1   N and 0.5   N to further tune the absorber to reach the desired control of the primary structure and harvest a vast amount of energy compared to lower excited systems.

Nonlinear Characterization of the Energy Harvesting Absorber for Varying Forcing Amplitudes

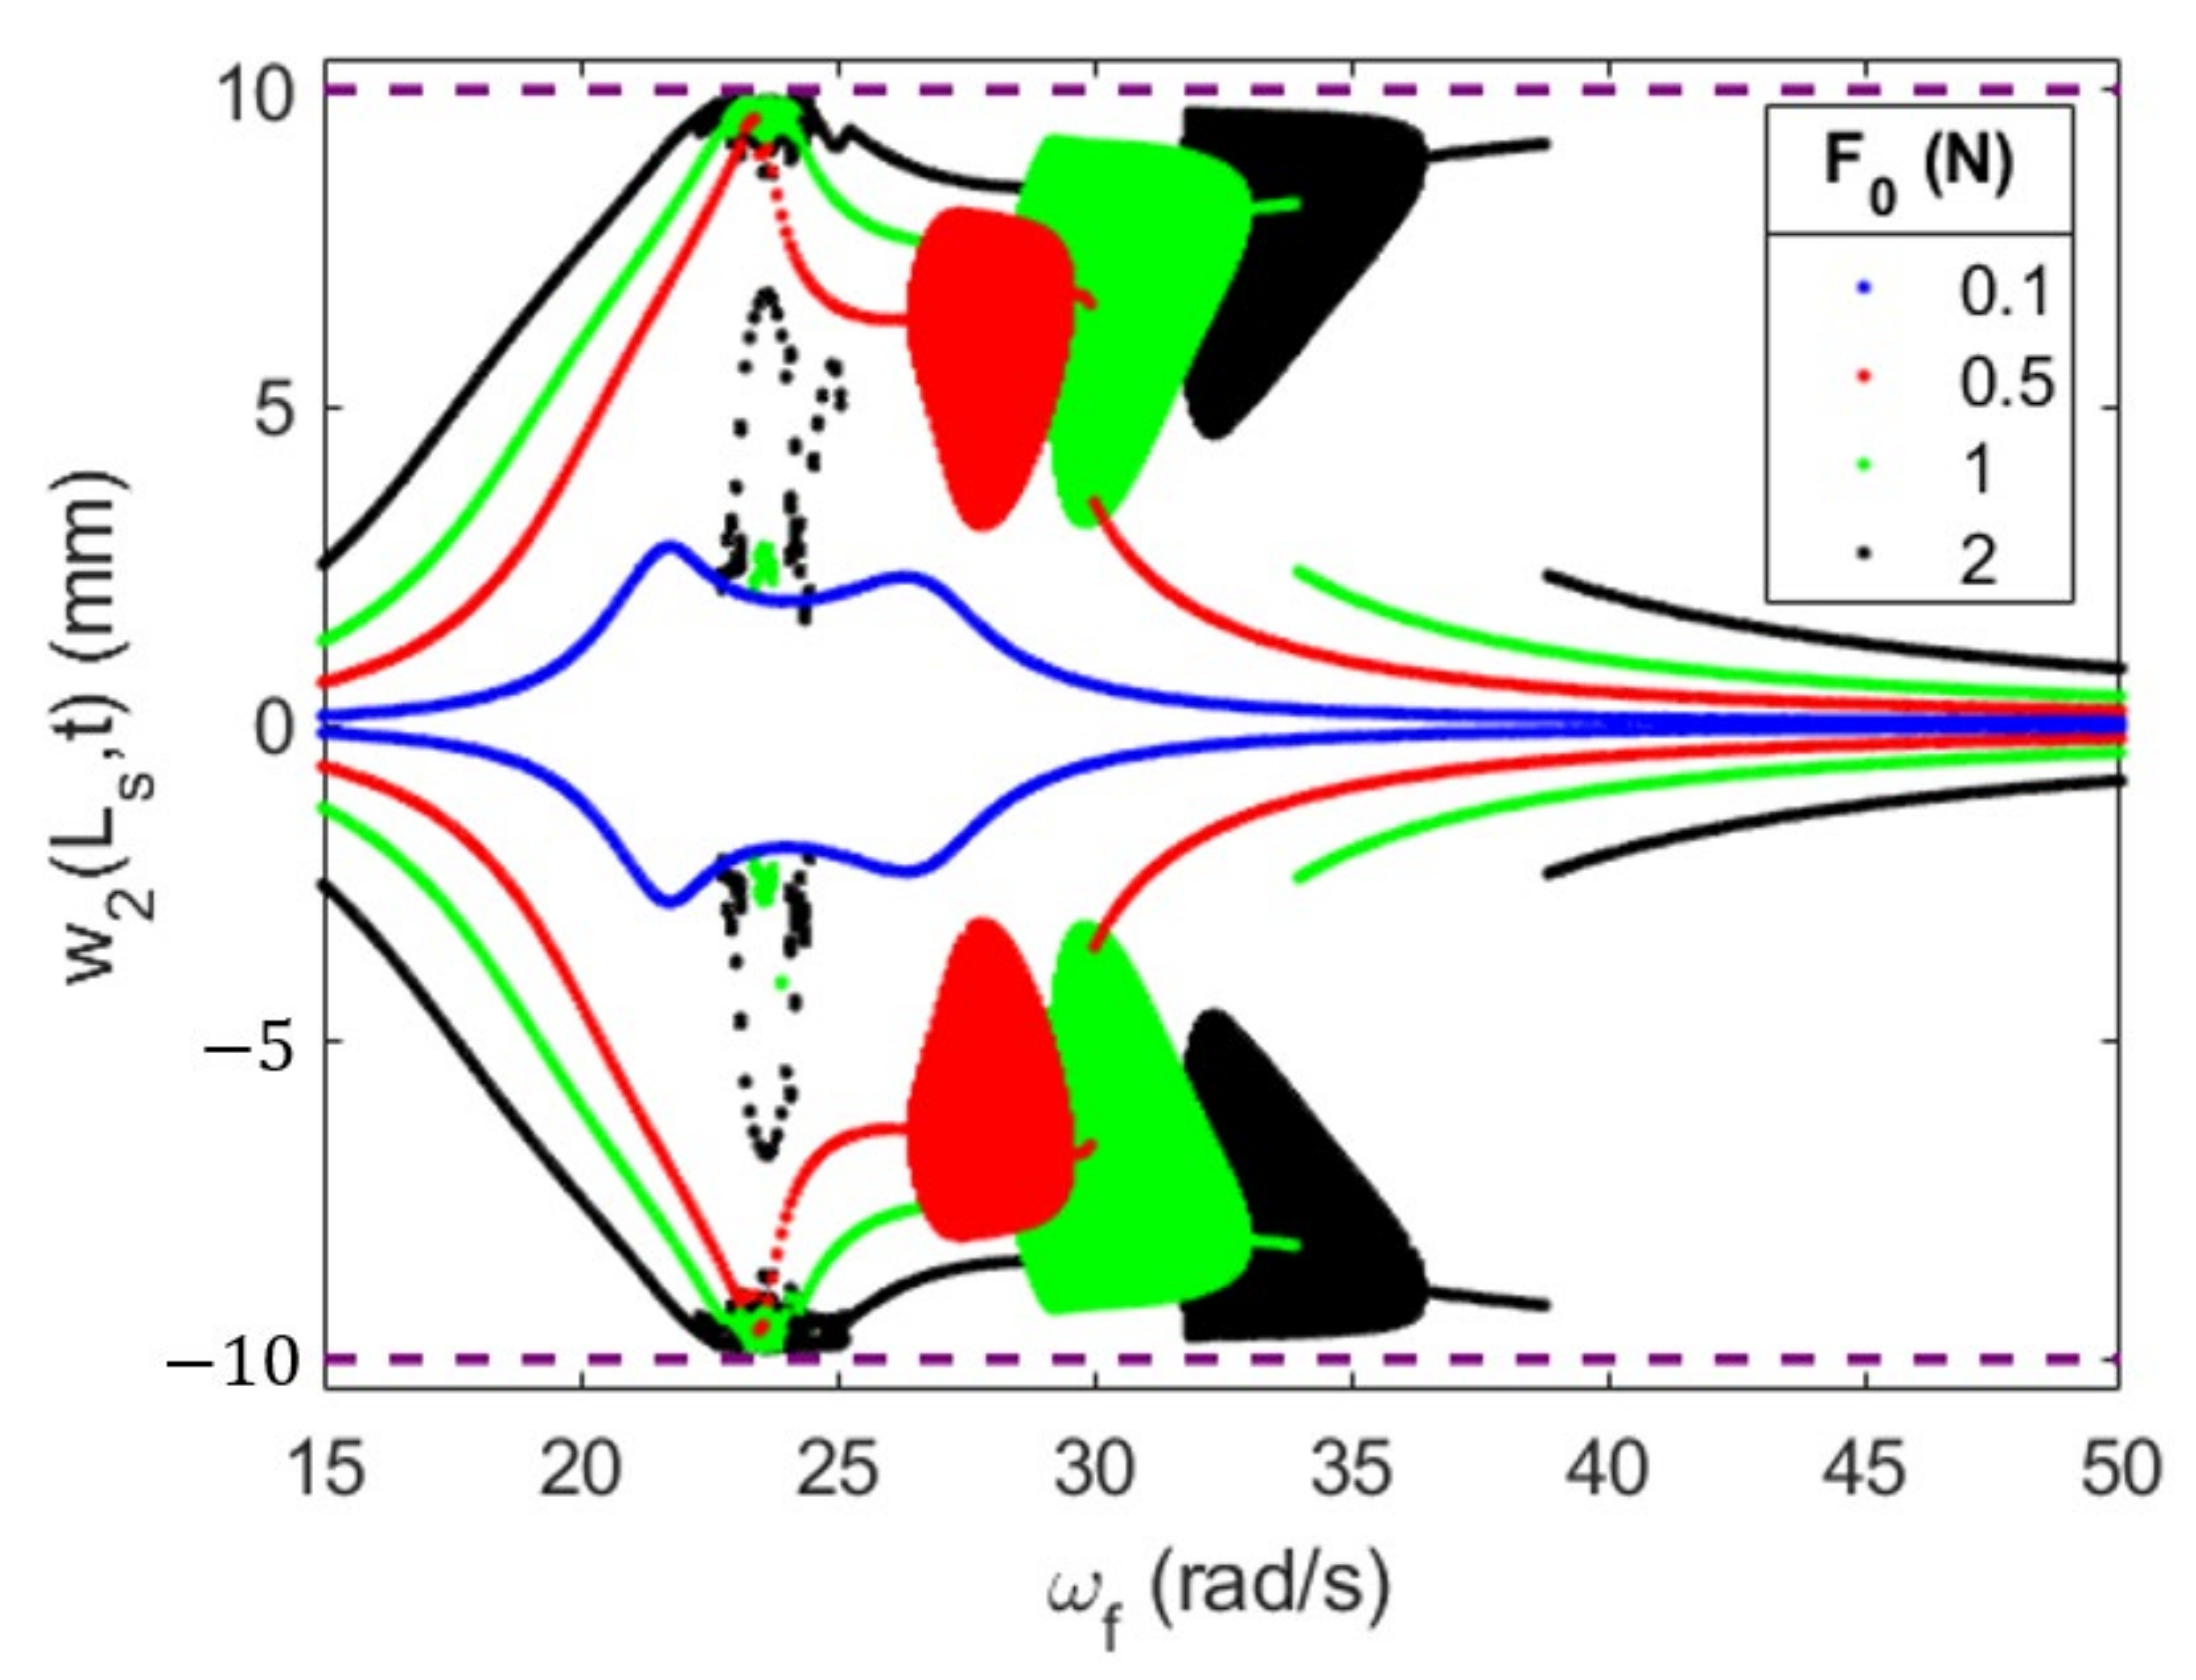
To understand the behavior of the system, a nonlinear characterization of the energy harvesting absorber is performed for each gap and forcing amplitude configuration investigated in the previous section. For each gap size, a bifurcation diagram is presented. A bifurcation diagram plots a point at each location where there is zero velocity in the time history plot, which clearly shows whether any aperiodic behavior is present. For a specific frequency, a periodic response will only have two points plotted, and aperiodic behavior will plot many non-distinct points. This method clearly shows bifurcations in behavior between different regions through the frequency domain. Next, each resonant peak is investigated using time histories, phase portraits, power spectra and Poincare maps. Each of these tools may aid in understanding the behavior of the absorber by showing periodicity, possible bifurcations and the presence of nonlinear responses.
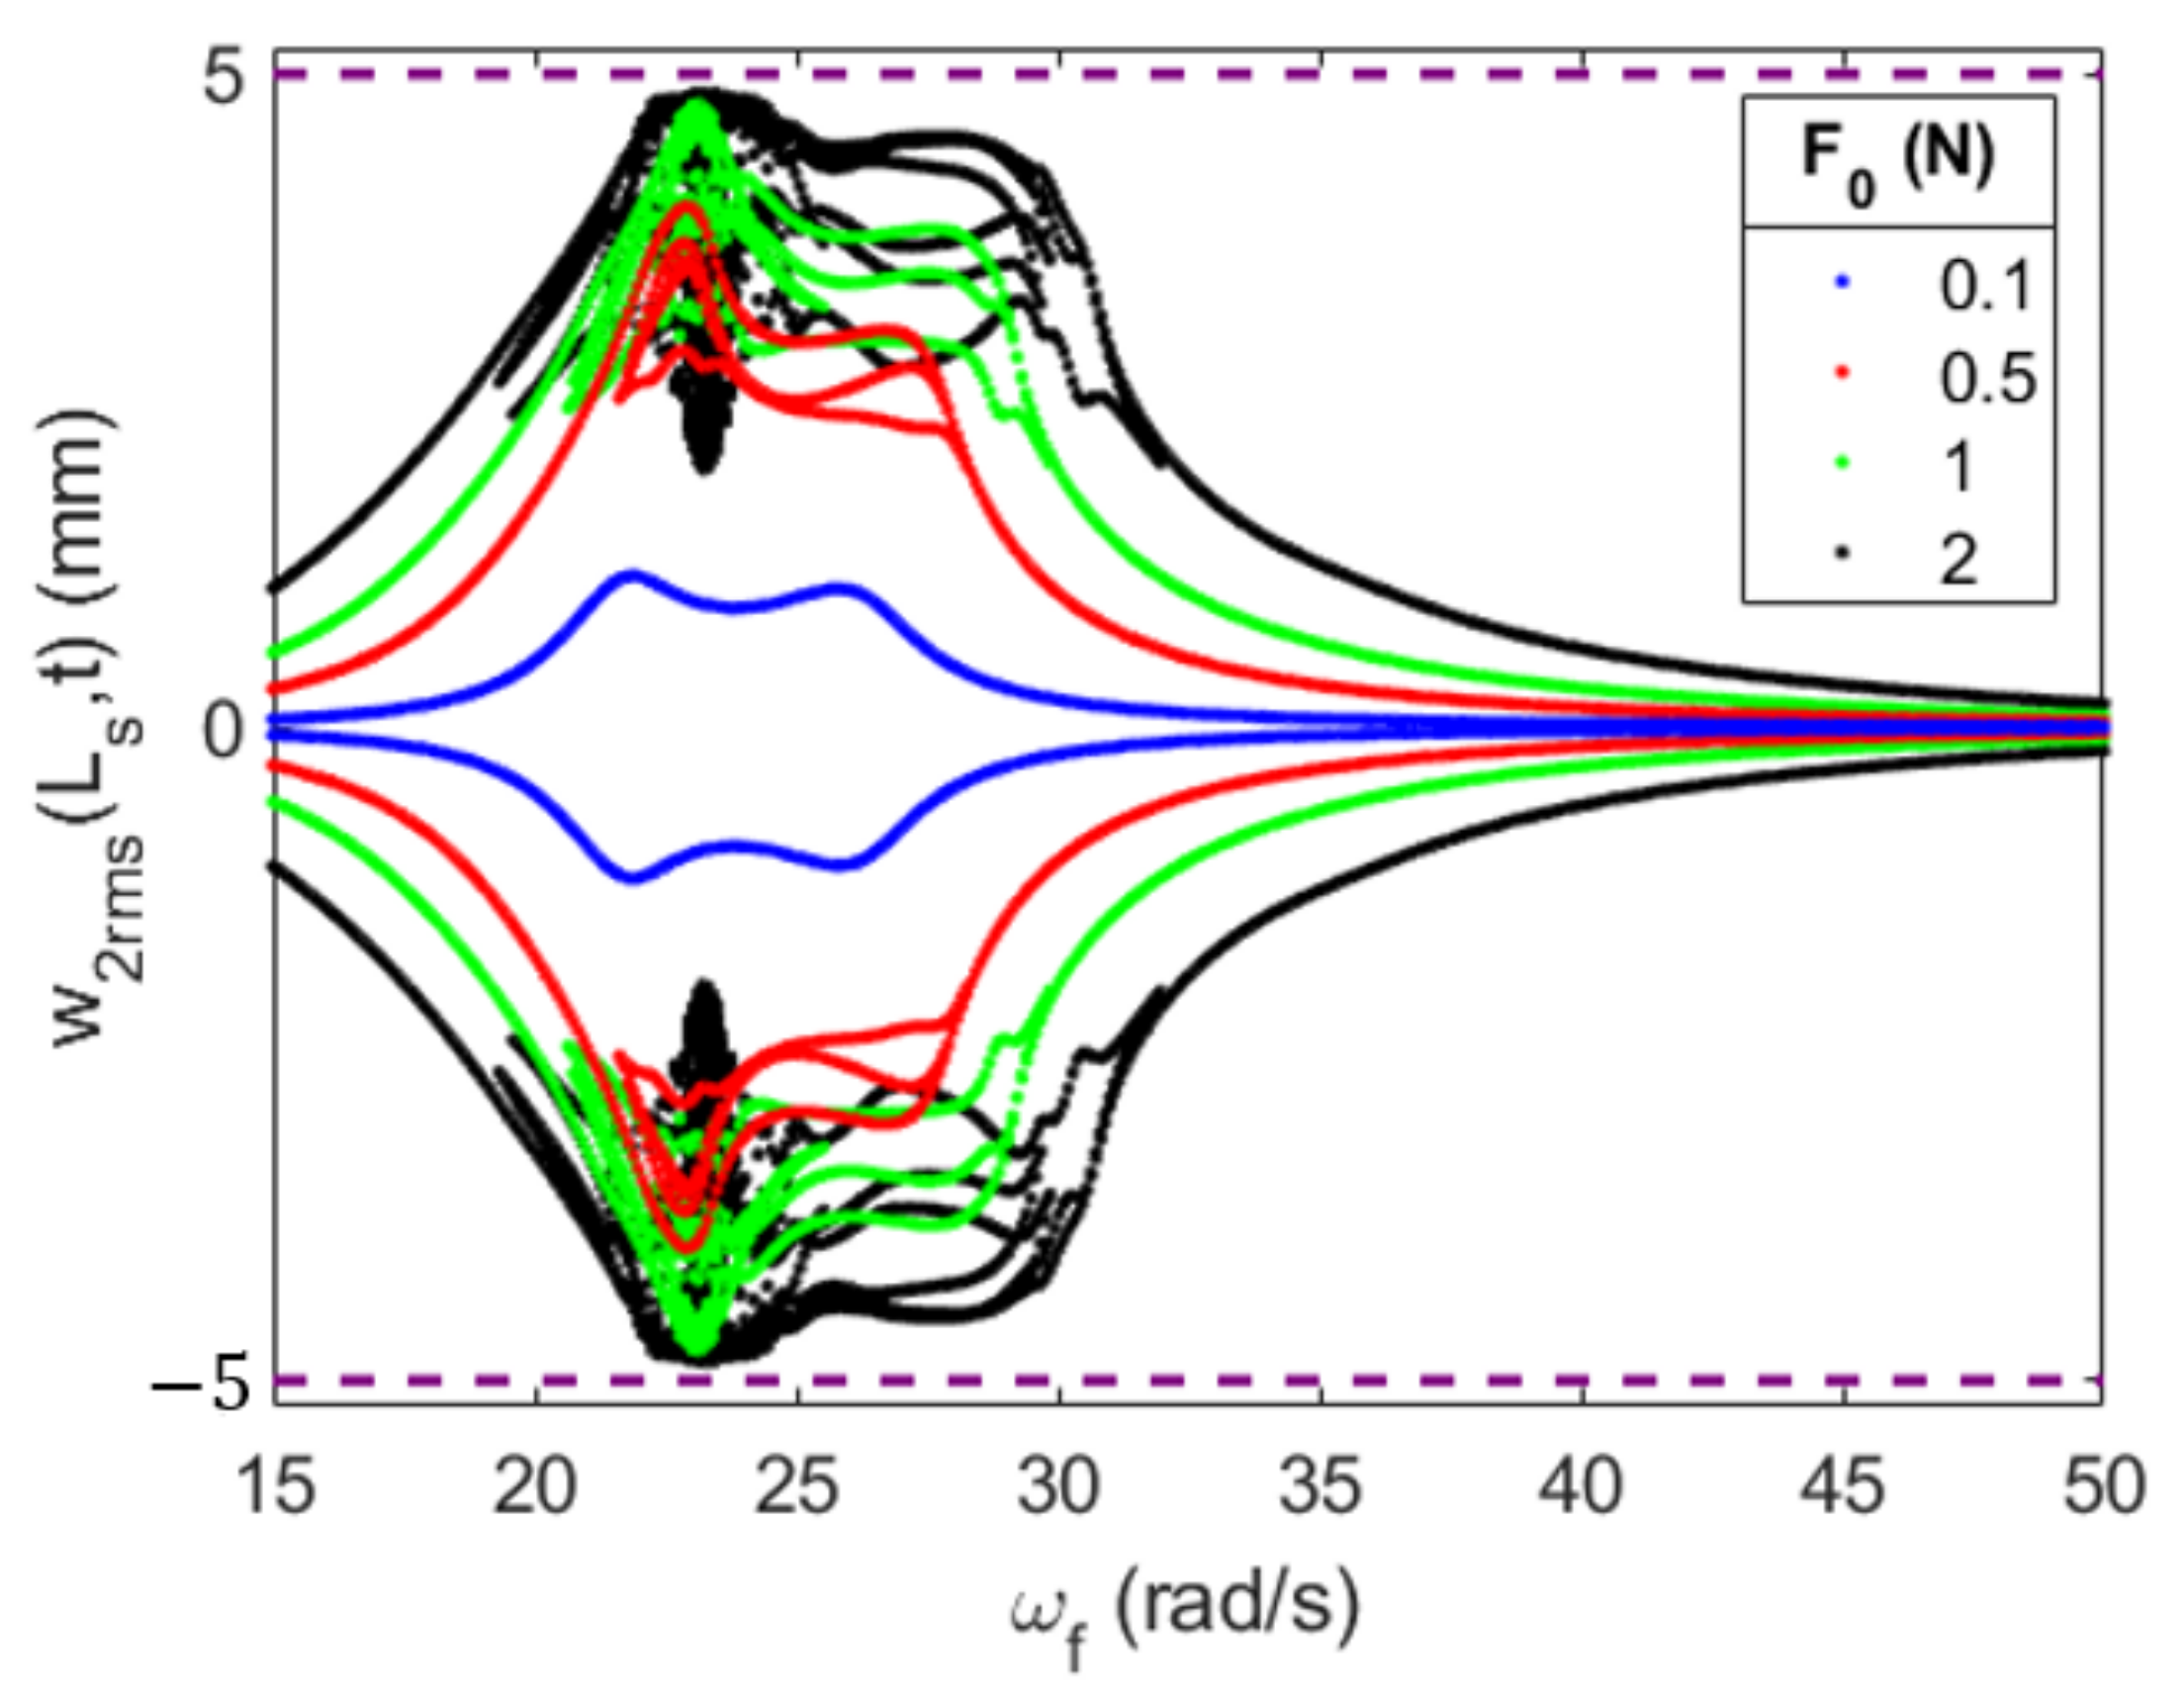
First, the gap size of 10   m m is investigated. Figure 33 shows the bifurcation diagram of the absorber’s displacement for the varying forcing amplitude. The aperiodic regions in the second resonant peak are clear, and as the forcing amplitude increases, the aperiodic regions shift to the right. Additionally, the size of the aperiodic regions increases until the forcing amplitude reaches 2   N , where the top portion of the region is limited by the magnets, thus limiting the displacement of the absorber and reducing the height of the region. The region between the resonant peaks also becomes flatter with increasing forcing amplitude. In fact, with a forcing amplitude of 2   N , the displacement of the absorber is constantly next to the magnet, although it behaves periodically between the periodic peaks. The first resonant peak also shows aperiodic behavior for the large forcing amplitudes. However, these points are distinct, unlike the aperiodic behavior in the second peak.
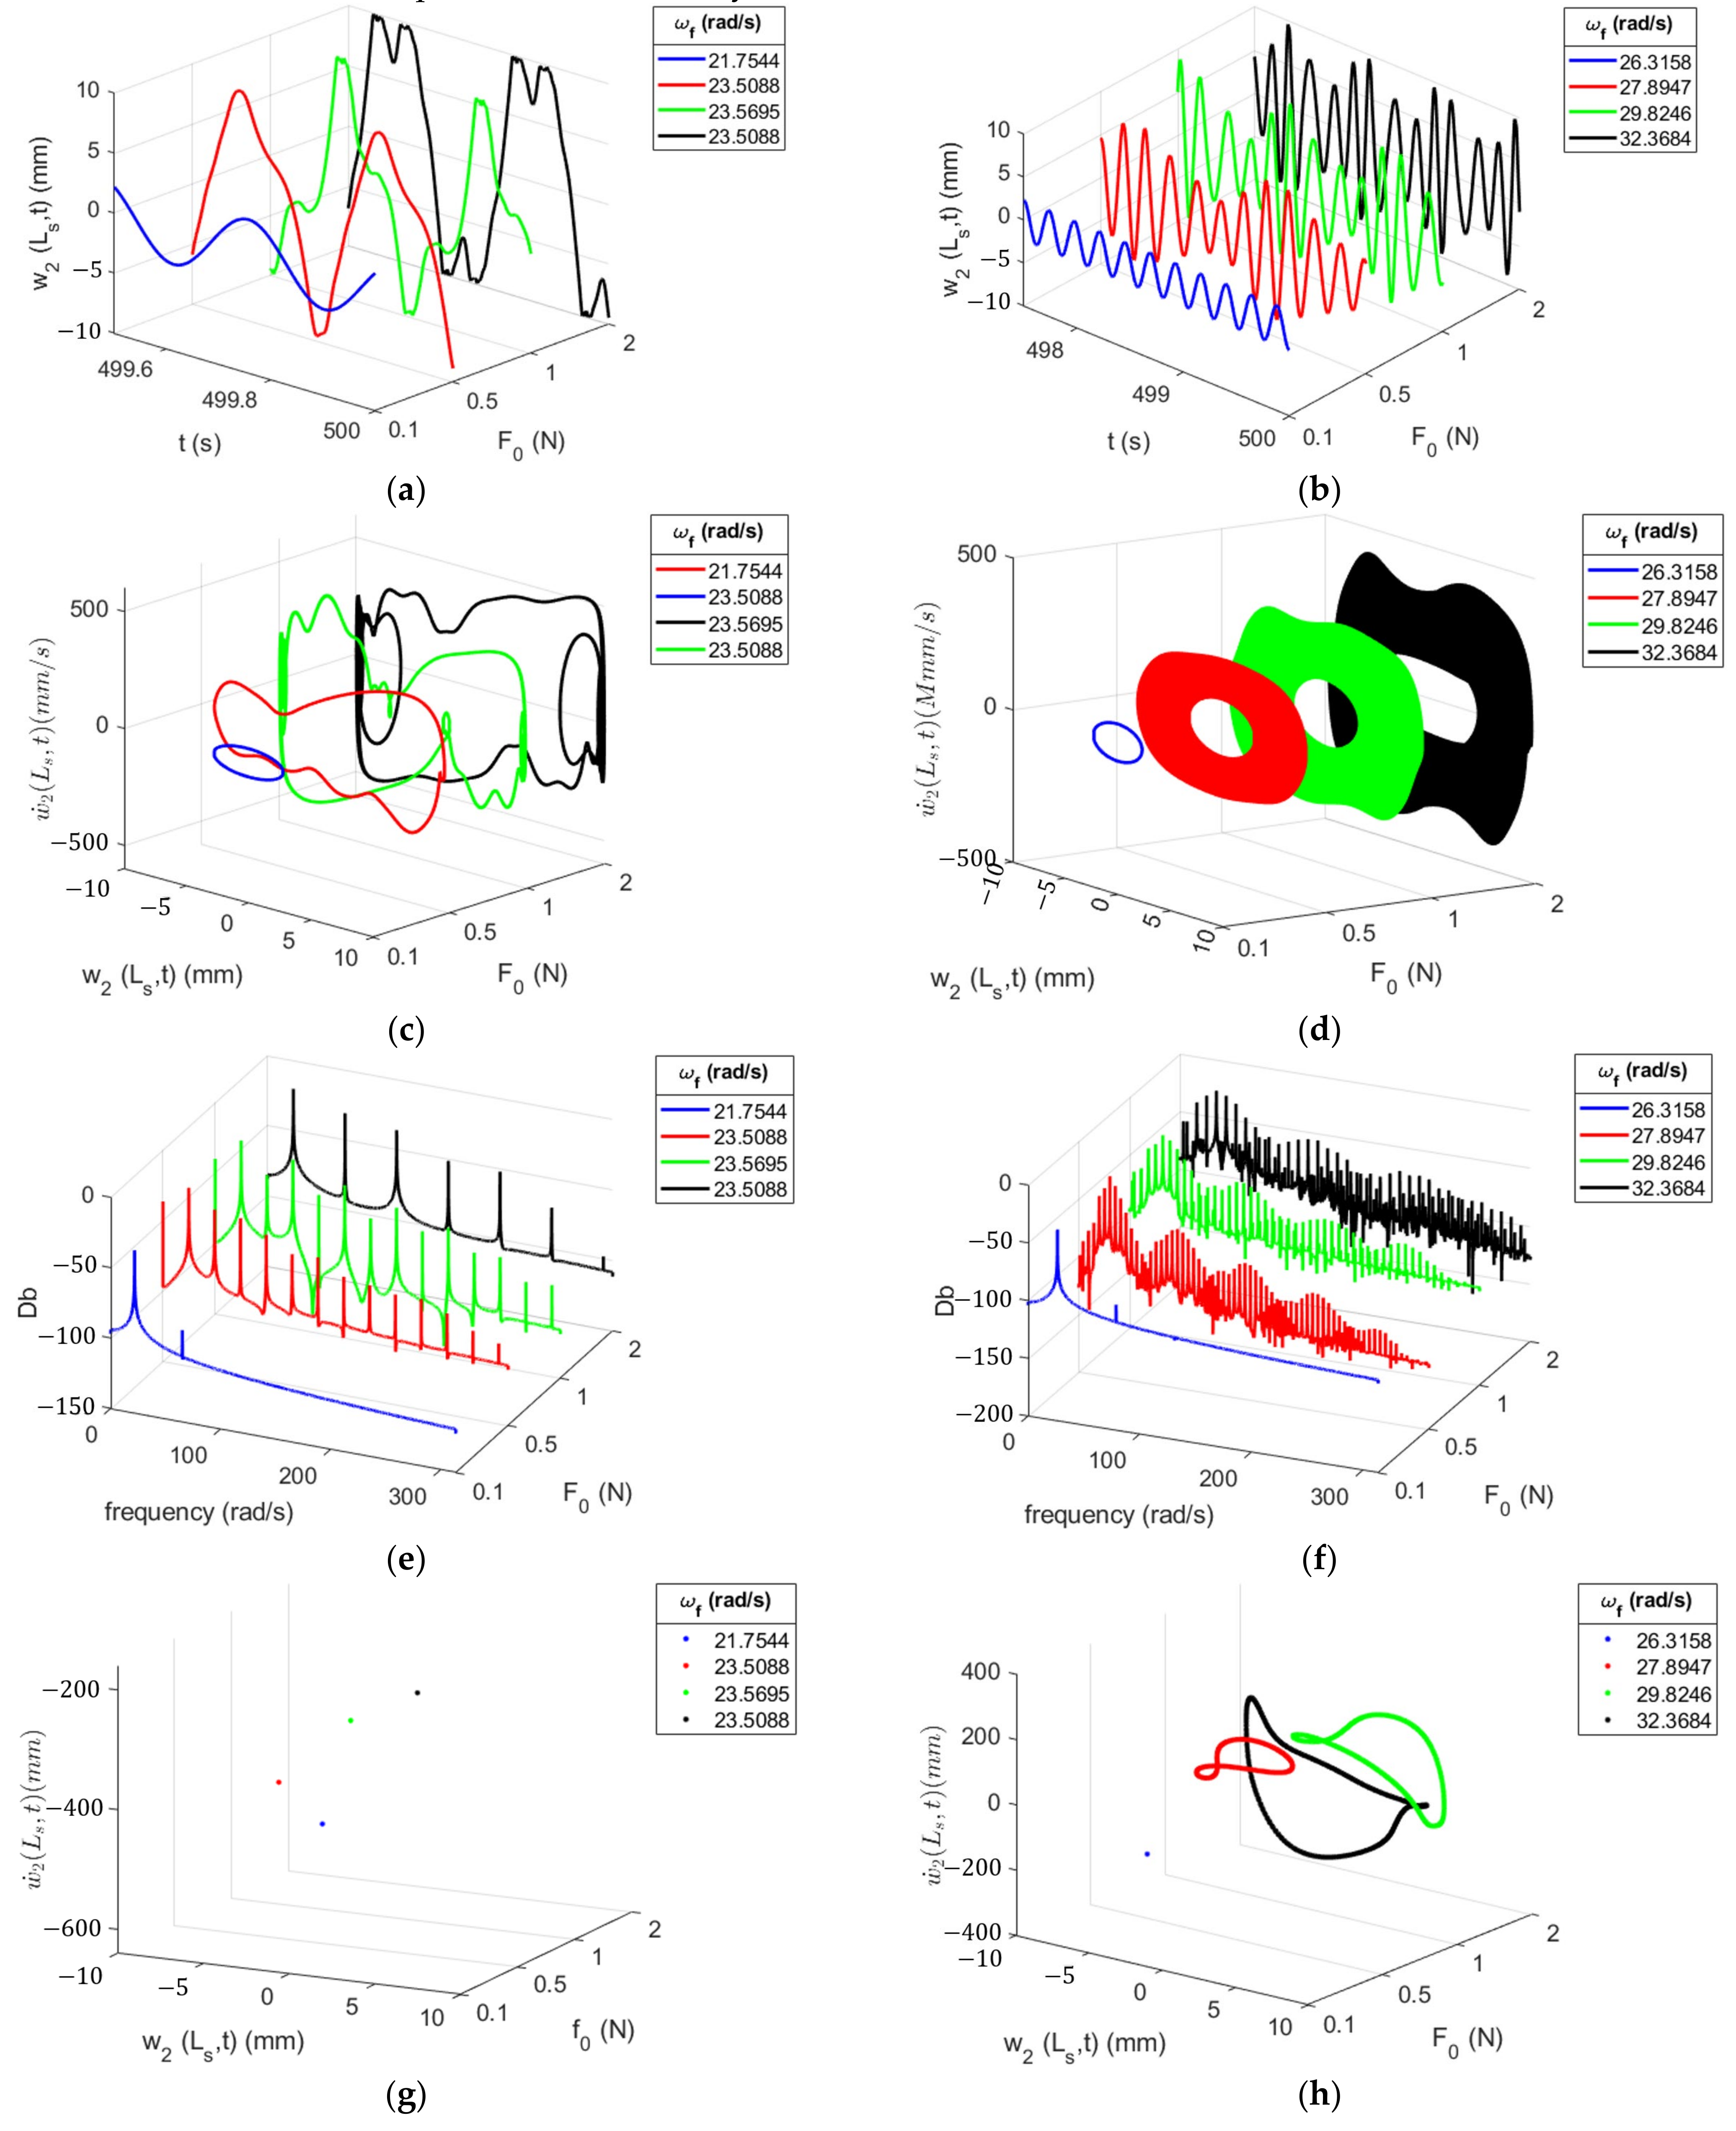
Next, the two resonant peaks are investigated for the varying forcing amplitudes in order to determine the effects of the forcing amplitude on the absorber’s behavior. The responses of the two peaks are shown in the first and second columns of Figure 34. Since the forcing amplitude inherently produces a nonlinear hardening, the individual frequencies for each peak are seen in the legends. The time histories of the absorber are depicted in Figure 34a,b. Looking at the first peak, periodic behavior is clear in the low forcing amplitudes. As the forcing amplitude increases, the interaction with the magnets becomes clear. Although there are clear nonlinear behaviors, the waves appear to repeat. Additionally, when we look at the Poincare maps in Figure 34g, each forcing amplitude has a single distinct point. This indicates that each forcing amplitude is behaving periodically for its respective forcing frequency. This is again clear in the power spectrum in Figure 34e, where it contains peaks of the forcing frequency Ω and k Ω n , where k is an integer, and n represents the number of periods. When we divide the forcing frequency by the frequency of the second peak, n is one, reinforcing the determination of the periodic behavior. Additionally, these peaks represent the presence of nonlinearities in the system. The forcing amplitude of 0.1   N only has one peak at three times the forcing frequency, indicating the presence of cubic nonlinearities in the system. Interestingly, the forcing amplitudes of 0.5   N and 1   N also have the presence of quadratic nonlinearities, whereas the forcing amplitude of 2   N only has the presence of cubic nonlinearities. This indicates that the forcing amplitudes that do not induce extreme interactions with the magnets produce a quadratic nonlinearity.
When looking at the second peak in the second column of Figure 34, the aperiodic regions are clear in the forcing amplitudes larger than 0.1   N . The time histories show a clear change in the amplitude of the peaks, but it is unclear whether this behavior is of a high-order periodicity or chaos. The phase portrait in Figure 34d indicates that the absorber is not behaving with a higher order periodicity, since there is no distinct number of orbits. The Poincare map shows a closed loop of infinite points. This indicates that the system has quasiperiodic behavior. This is also clear in the power spectrum, where n is 2 when calculating the ratio of the frequencies of the first and second resonant peaks.
As seen in Figure 30 and Figure 31, the system responds quite similarly with the two gaps. In fact, the nonlinear characterization of the system with a gap of 7.5   m m results in similar results, including the medium forcing amplitudes exhibiting cubic nonlinearities, while the amplitudes of 0.1   N and 2   N only exhibit quadratic nonlinearities. An in-depth analysis of the nonlinear characterization for the 7.5   m m gap and associated bifurcation diagram, time histories, phase portraits, power spectra and Poincare maps can be found in Appendix C.
The configuration with a gap size of 5   m m is studied, and Figure 35 depicts the bifurcation diagram of the absorber’s displacement. The large aperiodic region is no longer present in the second resonant peak. However, multiple continuous branches are present in the entire resonant region for the forcing amplitudes larger than 0.1   N . Additionally, the large forcing amplitudes have a small range of points for a specific frequency during the first peak instead of having a single point, which could indicate aperiodic behavior. One important factor with increasing forcing amplitude is an increase in the broadband width, allowing for more energy to be harvested over the range of frequencies. Further, the decrease in amplitude between the resonant peaks is reduced as the forcing amplitude increases, allowing for more consistent power to be harvested.
Figure 36 depicts the time histories, phase portraits, power spectra and Poincare maps to characterize the nonlinear behavior of the system with the gap of 5   m m at each resonant peak. Since the presence of the large quasiperiodic regions is not noted in the second resonant peak, the two resonant peaks are behaving similarly. One immediate difference for the large forcing frequencies between the two is that the second peak has a lower amplitude, which reduces the number of oscillations that occur close to the magnet. This also greatly simplifies the phase portraits. Looking at the power spectra, it appears that each configuration is behaving periodically. Additionally, each configuration has a quadratic nonlinear response and does not have a cubic nonlinear response similar to the larger gaps. The Poincare maps also confirm that the system is behaving periodically. The small gap of 5   m m contains the energy of the absorber in a way that keeps the system behaving periodically and does not induce quadratic nonlinearities. The small gap also induces high absorber velocities, which allow for large levels of energy to be harvested.

5. Conclusions

Magnetic constraints were incorporated into a piezoelectric energy harvesting absorber to improve its capabilities of harvesting energy while simultaneously reducing the primary structure’s displacement. The Euler–Lagrange equations were used to develop the reduced-order model of the system. The modeling of the piezoelectric energy harvester was verified in the literature, and previous work presented accurate representations of the magnetic force through the COMSOL software. This study incorporated these data with other models and forcing expressions to accurately model the force exerted by the magnets. This model accurately represents a magnetic force for gaps larger than 1   m m , and logical assessments were considered for smaller gaps. High amplitude excitations produce extremely small gaps with the magnets, which increases the uncertainty in the magnetic force. The reduced-order model of the primary structure is excellent for simple applications, but a system of these energy harvesting absorbers might need to be utilized for large, complex structures. This study investigated both attractive and repulsive magnetic configurations. The attractive configurations showed minimal improvements before pull-in occurred between the magnets. The repulsive configurations generated more power with medium-sized gaps while maintaining adequate control of the primary structure’s amplitude. Small gaps induced a hardening in the coupled natural frequencies; therefore, in-depth analyses were performed to effectively design the absorber for the small gaps. Increasing the forcing amplitude indicated that quasiperiodic regions develop in the system due to quadratic nonlinearities. The small gap of 5   m m prevented the development of quadratic nonlinearities and quasiperiodic regions, greatly increasing the amount of energy being harvested by the absorber.
Overall, the addition of magnets improved the energy harvested for large gaps, which enhanced the amount of energy harvested without large impacts on the control of the primary structure, and great insights into the effects of the magnets were gained. The theoretical system produces comparable energy to other piezoelectric systems [49]. Due to the system being theoretical, exact comparisons or assessing whether the system is ideal cannot be performed. When compared to similar systems [46,47], this system appears to produce lower power due to the high nonlinear forces the magnets produce and its inability to tune the strength of the magnetic force. An electromagnet could aid the tuning of the force, as well as acting as an additional electromagnetic energy harvester for the system. Additionally, this system can be incorporated into a nonlinear energy sink, which could amplify the nonlinear effects of the harvester and further increase the amounts of energy harvested, but this proposal requires further investigations.

Author Contributions

Conceptualization, T.A., M.M. and A.A.; Methodology, T.A., M.M. and A.A.; Formal Analysis, T.A.; Investigation, T.A. and A.A.; Resources, M.M. and A.A.; Data Curation, T.A.; Writing—Original Draft Preparation, T.A.; Writing—Review and Editing, M.M and A.A.; Visualization, T.A. and A.A.; Supervision, M.M. and A.A.; Project Administration, A.A. All authors have read and agreed to the published version of the manuscript.

Funding

The authors would like to thank Sandia National Laboratories for their continued support and funding of this research. Sandia National Laboratories is a multi-mission laboratory managed and operated by National Technology and Engineering Solutions of Sandia, LLC., a wholly owned subsidiary of Honeywell International Inc., for the U.S. Department of Energy’s National Nuclear Security Administration under contract DE-NA0003525. This paper describes objective technical results and analysis. Any subjective views or opinions that might be expressed in the paper do not necessarily represent the views of the US Department of Energy or the United States Government.

Data Availability Statement

Data is contained within the article.

Acknowledgments

The authors would like to thank Brian Saunders for his continued support and guidance throughout the nonlinear characterizations of the system.

Conflicts of Interest

The authors declare no conflict of interest.

Appendix A. Summary Table of Section 3 Frequency Response

Table A1 shows the quantities of interest for the various configurations of the system without tuning the absorber for small gaps between the magnets. It is clear that with small gaps in the repulsive configurations, the system needs additional tuning to adequately mitigate the primary structure’s displacement because the 5   m m gaps only reduce the uncontrolled amplitude by 4.8% and 30% for the double and single magnet configurations, respectively. The attractive cases only have data available down to 15   m m because dynamic pull-in occurs at smaller gaps. With these large gaps, no change to the bandwidth is present.
Table A1. Summary of quantities of interest for attractive and repulsive configurations.
Config. d   m m First   Resonant   Peak   m W Sec ond   Resonant   Peak   m W Bandwidth   of   Energy   Harvested   m / s   @   0.01   m W Percent of Amplitude Controlled
Single attractive1000.05340.06368.4279.5347
200.05220.06518.4279.0833
150.04770.07038.4277.2893
Double attractive1000.05340.06368.4279.5345
200.05100.06648.4278.6168
150.04290.07658.4274.9828
Single repulsive1000.05340.06368.4279.5350
200.05450.06238.4279.1360
150.05860.05808.4277.6077
100.07620.03998.4268.1798
50.06420.01008.6030.0985
Double repulsive1000.05400.06368.4279.5351
200.05580.06108.4278.6908
150.06440.05248.4275.1193
100.08560.02188.6848.9190
50.00900.0010---4.7916

Appendix B. Effective Design: Absorber’s Substrate Thickness
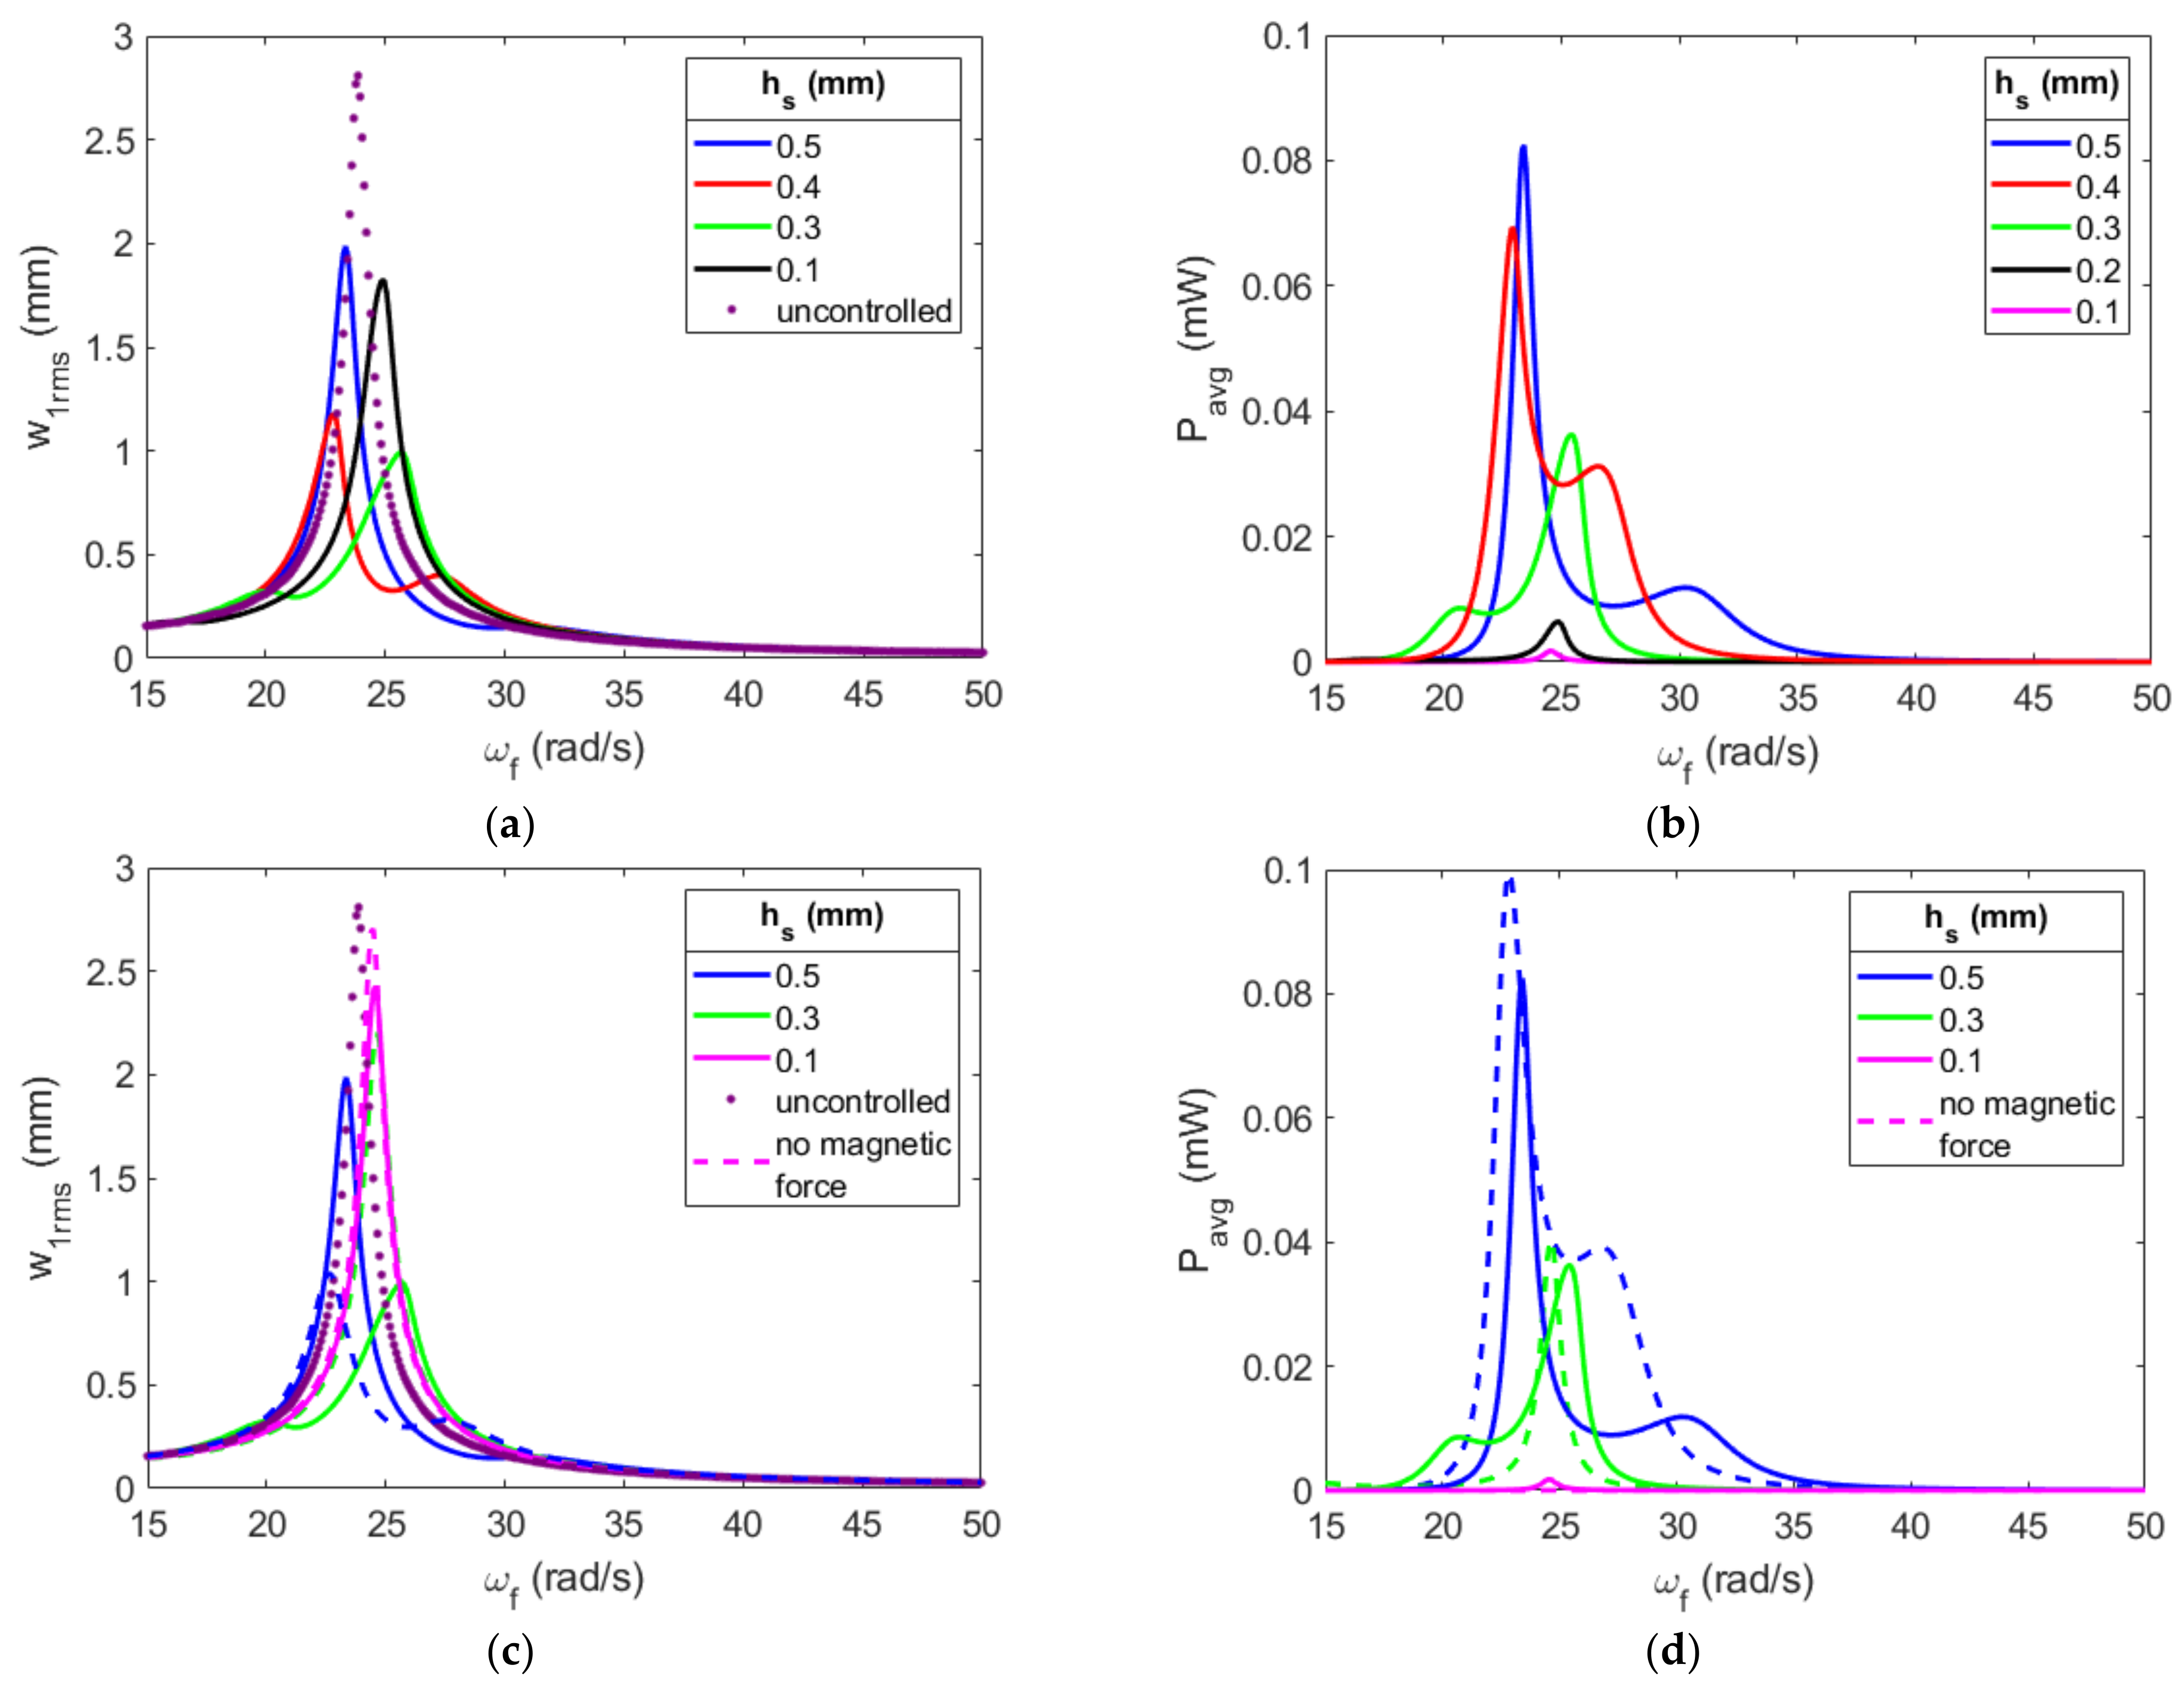
Figure A1 depicts the effect of the tip mass on the coupled natural frequency with varying substrate thickness and an initial gap of (a) 10   m m , (b) 7.5   m m and (c) 5   m m . The veering phenomenon is quite clear in Figure A1b with a substrate thickness of 0.2   m m , where the decoupled natural frequency of the absorber matches the upper coupled natural frequency with small tip masses, and with large tip masses, it matches the lower coupled natural frequency. At a tip mass of 0.035   k g , the decoupled natural frequency of the absorber falls in between the two coupled frequencies, showing the interaction between the two coupled frequencies and the veering phenomenon. In fact, this tip mass would be a convenient selection for enforcing a strong coupling for this initial gap size. However, the gap size has a strong effect on the coupling of the system, so each gap requires its own investigation. An initial gap size of 10   m m only has strong coupling present for the substrate thicknesses of 0.3 ,   0.4 and 0.5   m m . The tip mass that ensures strong coupling is far apart for each of these gap sizes, where these tip masses are 0.029   k g ,   0.041   k g and 0.055   k g respectively. Conversely, a gap size of 5   m m requires a substrate thickness of 0.1   m m and a tip mass of 0.028   k g to ensure strong coupling. Other substrate thicknesses could enforce strong coupling, but it would require a heavier tip mass.
Figure A1. Tip mass effects on the coupled natural frequencies with various substrate thicknesses for an initial gap size of (a) 10 mm, (b) 7.5 mm and (c) 5 mm.
Energies 16 01272 g0a1
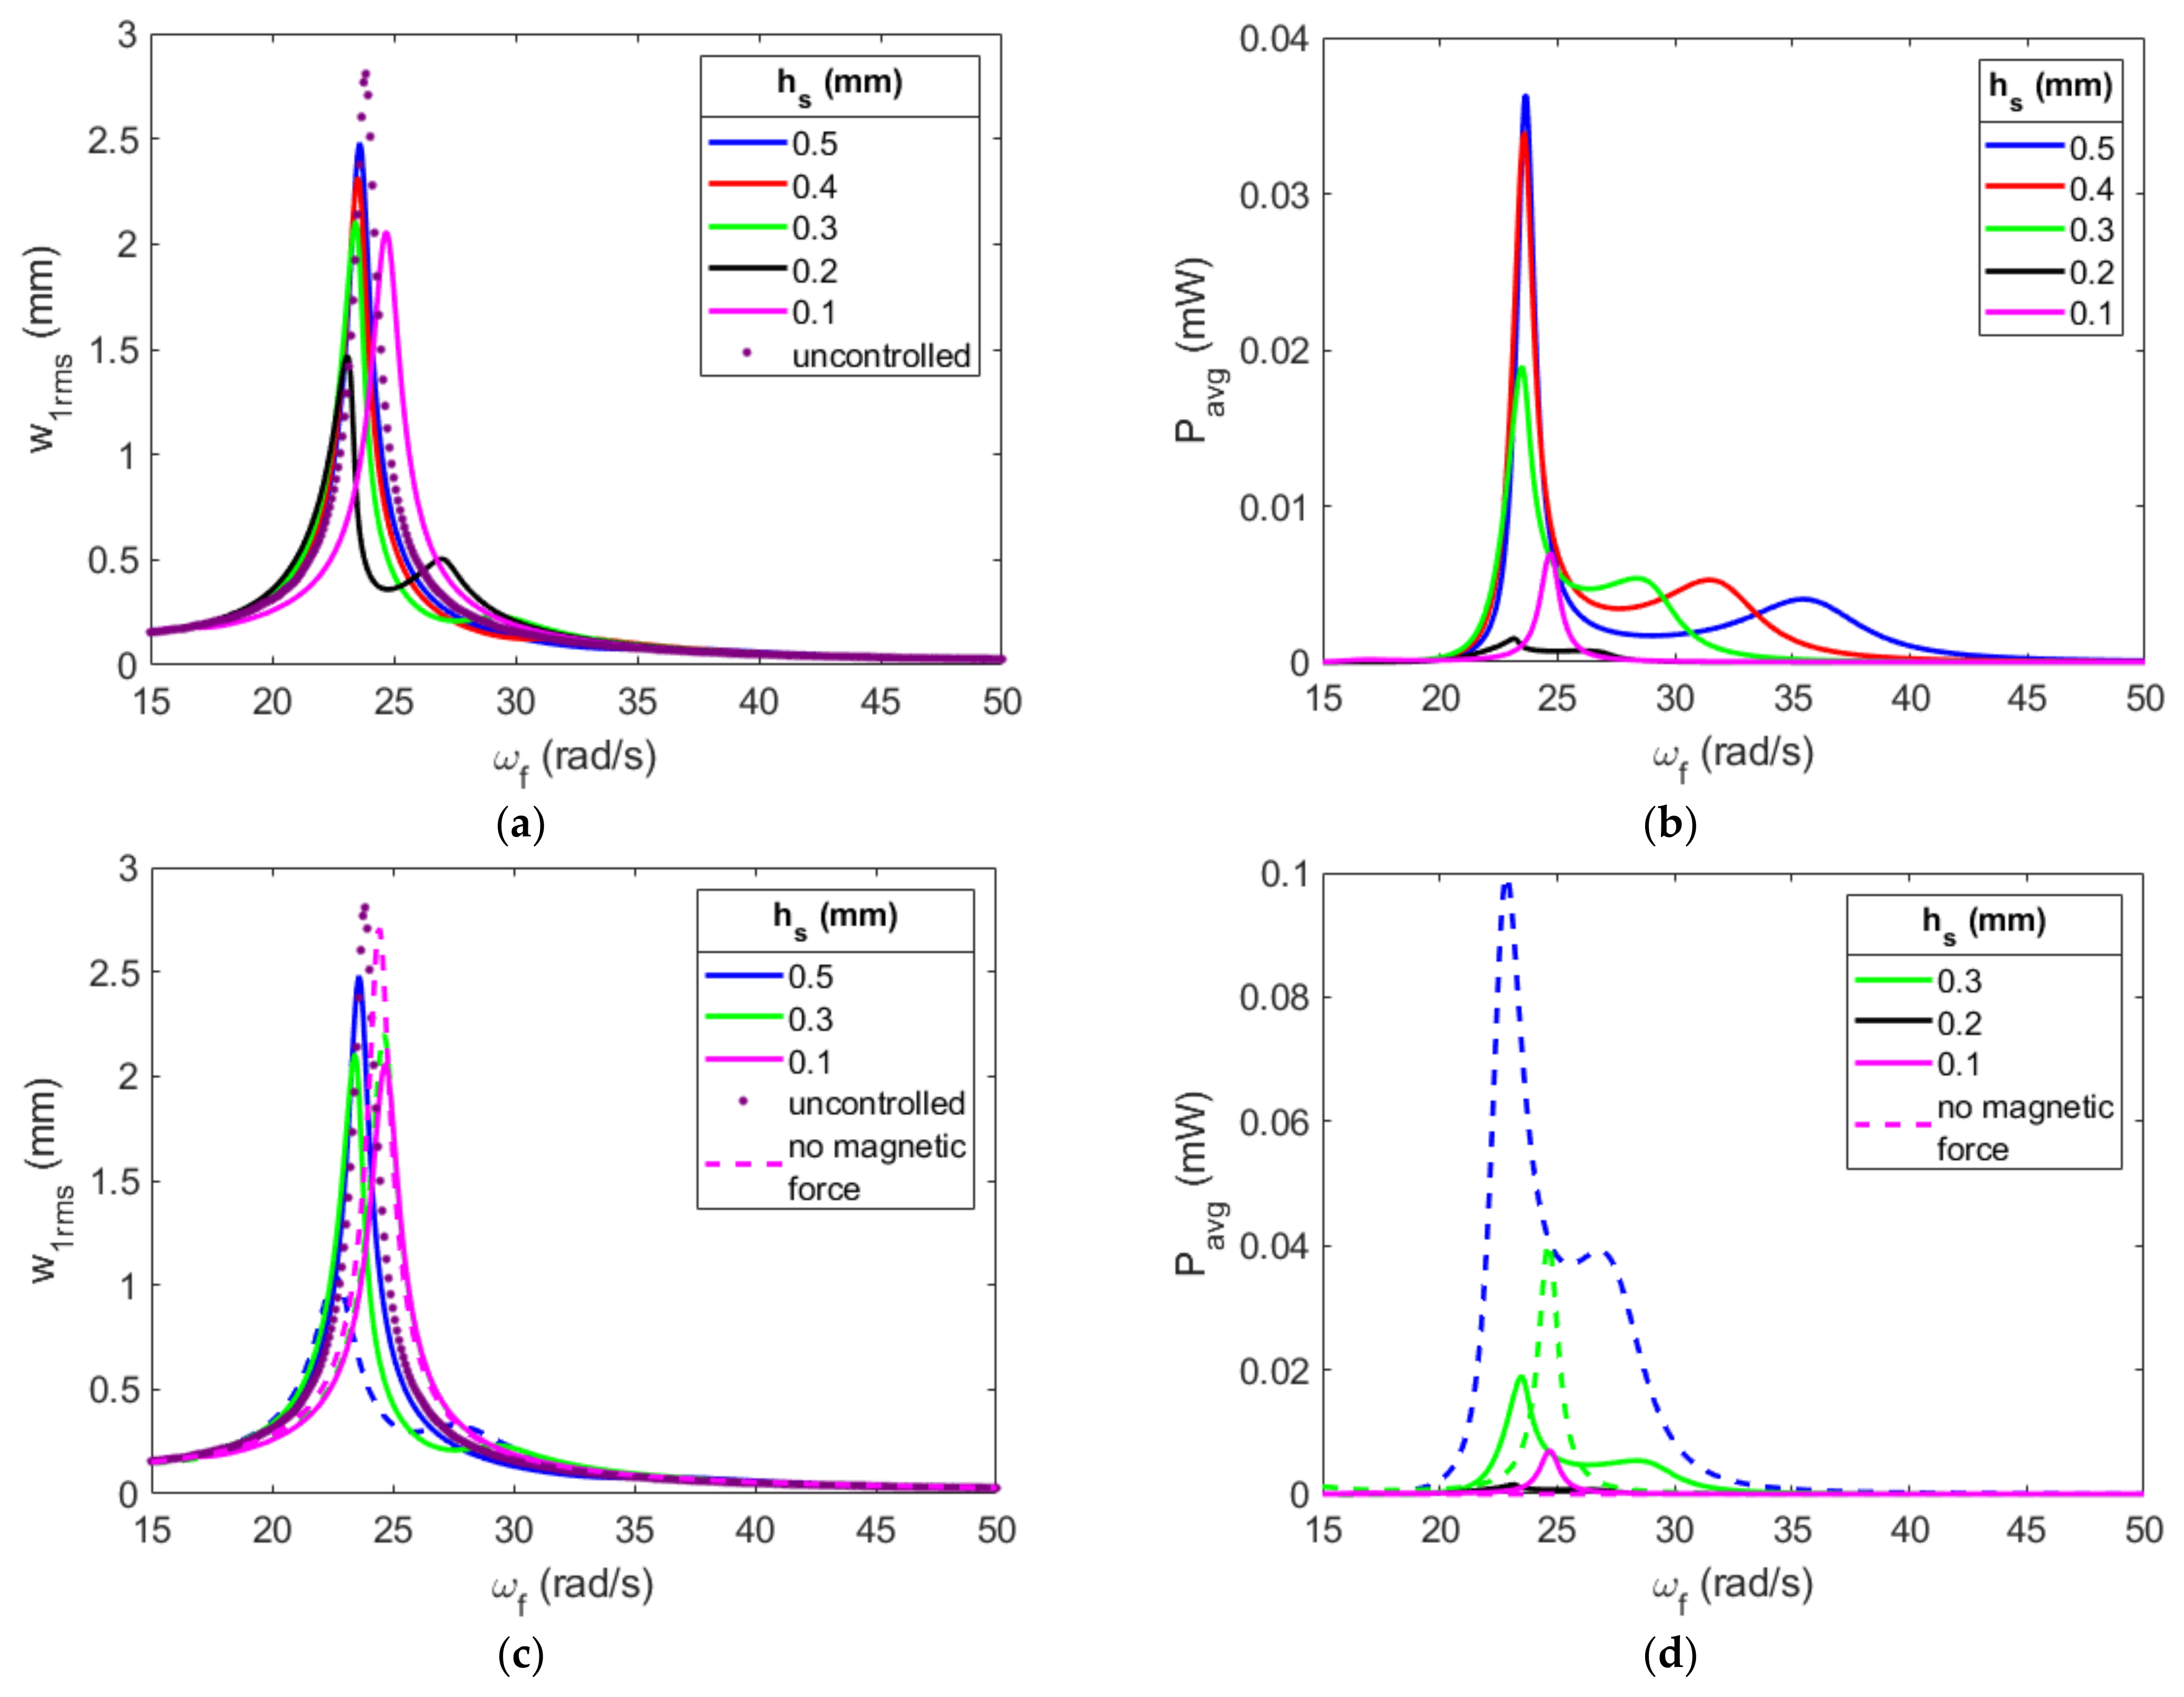
First, a single tip mass of 0.04   k g that couples with the most substrate thicknesses for each gap is selected to correlate the previous eigenvalue analysis results with results in the domain of the forcing frequency. The primary structure’s displacement and the average power harvested for all substrate thicknesses are shown in Figure A2a,b, respectively, and a few substrate thicknesses along with their no-magnet configuration results are also presented in Figure A2c,d. Based on Figure A1a, the substrate thickness of 0.4   m m is expected to enforce the best coupling. In fact, this thickness generates the largest average energy over the frequency range, with 7.44 × 10 3   m W . Even though the thickness of 0.5   m m has the largest peak power of 0.0824   m W , compared to 0.0691   m W for the thickness of 0.4, it only has an average generated power of 6 × 10 3   m W over the frequency range. Additionally, a thickness of 4   m m nearly doubles the reduction in the uncontrolled amplitude of the primary structure versus that of the substrate thickness of 0.5   m m , with total reductions of 59% and 30%, respectively. Looking at the responses compared to the no-magnet cases, the hardening of the coupled natural frequencies is evident.
Figure A2. The effects of varying substrate thicknesses with a tip mass of 0.04   k g and an initial gap of 10   m m on the amplitude of the (a) primary structure and (b) absorber, as well as a comparison with configurations with no magnets (c,d).
Energies 16 01272 g0a2
A substrate thickness of 0.5   m m has the first coupled natural frequency closer to the uncontrolled natural frequency of the primary structure. Therefore, when the magnets induce an increase in the coupled natural frequency, the reduction in the uncontrolled behavior is worsened, with a reduction of 63% for the no-magnet case and 30% for the case with magnets. This also causes the case with magnets to reduce the amount of energy harvested, which produces 17% less power, on average, over the frequency range than the no-magnet case. On the other hand, this hardening behavior benefits the configuration with a substrate thickness of 0.3   m m . Looking at the no-magnet case, the second resonant peak is closer to that of the uncontrolled natural frequency, causing a small reduction in the primary structure of only 22% and very low power generation with a tight band of frequencies that generates power. The hardening behavior of the magnets moves the second resonant peak farther away from the uncontrolled natural frequency, greatly improving the reduction in the primary structure to 65% and increasing the average power generated over the frequency range from 1.9 × 10 3   m W to 3.4 × 10 3   m W . Clearly, this hardening effect improves the performance of the substrate thickness of 0.1   m m , but the system is strongly decoupled, so that the shift in frequency only reduces the uncontrolled amplitude of the primary structure by 14%, and the energy harvested is negligible.
Figure A3 depicts the primary structure’s displacement and the average power generated and compares them to the cases without magnets with an initial gap of 7.5   m m . All the substrate thicknesses do not significantly control the primary structure’s uncontrolled displacement, except for the thickness of 0.2   m m , which has a reduction of 46%, which is still not ideal. This gap should produce the strongest coupling between the primary structure and the absorber, although it is clear in Figure A1 that the lower coupled natural frequency is closer to the uncontrolled natural frequency, which is exacerbated by the hardening behavior of the magnets, resulting in the first resonant peak of the primary structure’s displacement being quite large. Interestingly, the gap of 0.2   m m has the lowest power generation.
Figure A3. The effects of varying substrate thicknesses with a tip mass of 0.04   k g and an initial gap of 7.5   m m on the amplitude of the (a) primary structure and (b) absorber, as well as a comparison with configurations with no magnets (c,d).
Energies 16 01272 g0a3
The plotted curves in Figure A4 show the effects of varying substrate thicknesses with a tip mass of 0.04   k g and an initial gap of 5   m m on the primary structure’s displacement and the power generated and compares them to their no-magnet configurations. As expected, all the gaps are practically decoupled, except for the substrate thickness of 0.1   m m . Even though this gap does not enforce a strong coupling, it can be seen that it is still able to reduce the primary structure’s amplitude by 50%. A properly tuned tip mass can significantly improve this reduction. Additionally, the thickness of 0.1   m m generates the most power of the thicknesses investigated. However, the peak power harvested is only 0.0164   m W , which is nearly a third of the size of the peak power of the thickness of 0.3   m m and a gap size of 10   m m . Even though the thickness of 1   m m greatly improves the control of the primary structure’s displacement and the amount of power generated over the no-magnet configuration, it is clear that this small gap configuration is not ideal for the current forcing characteristics.
Figure A4. The effects of varying substrate thicknesses with a tip mass of 0.04 kg and an initial gap of 5 mm on the amplitude of the (a) primary structure and (b) absorber, as well as a comparison with configurations with no magnets (c,d).
Energies 16 01272 g0a4
It was shown that it is important to choose a tip mass that enforces strong coupling between the primary structure and the absorber for the given substrate thickness for each gap considered. However, the initial gap between the magnets also affects the coupling of the system. Figure A5 depicts the initial gap effects on the natural frequencies for a constant tip mass of 0.04   k g . Each substrate thickness has its optimal gap for strong coupling, and as the substrate thickness decreases, so does the location of the veering phenomenon. When we look at the gap size of 7.5   m m , it is clear that as the substrate thickness increases, the coupled natural frequency dominated by the absorber switches from the lower frequency to the higher frequency. Interestingly, this behavior indicates that whichever coupled natural frequency is dominated by the absorber generates higher peaks in the previous results.
Figure A5. The initial gap’s effects on the coupled natural frequencies for varying substrate thicknesses.
Energies 16 01272 g0a5

Appendix C. Nonlinear Characterization of Excitation Amplitude’s Effects on the System with a 7.5   m m Gap

The configuration with a gap size of 7.5   m m is explored, and Figure A6 depicts the bifurcation diagram of the absorber’s displacement. The response of the system is very similar to when the gap is 10   m m . Forcing amplitudes larger than 0.1   N have an aperiodic region in the second peak with a clear shift to the right with increasing forcing amplitude. Interestingly, the aperiodic region in the forcing amplitude of 2   N is the smallest of the three regions. Additionally, this peak is not reaching the same amplitude as the first peak, which reaches the limits that the magnets allow; thus, the region does not have a flat top similar to the 10   m m configuration. Again, large forcing amplitudes induce aperiodic behavior in the first resonant peak, as well as a forcing amplitude of 0.5   N , where a distinct point occurs at 23.8   r a d / s and 3.6   m m . Although this frequency is not explicitly investigated, this does indicate the presence of more nonlinear behaviors occurring in the smaller gap over those in the gap of 10   m m .
Figure A6. Bifurcation diagram of the absorber’s position with a gap of 7.5 mm, tip mass of 0.06 kg and a substrate thickness of 0.3638 mm.
Energies 16 01272 g0a6
The nonlinear characterization of the energy harvesting absorber at the two resonant peaks is presented in Figure A7. Again, it is clear that the behavior is very similar to that of the 10   m m gap configurations. The Poincare maps indicate that the system is behaving periodically for each forcing amplitude in the first resonant peak. Additionally, the middle forcing amplitudes have quadratic and cubic nonlinearities present in the power spectrum, but the forcing amplitudes of 0.1   N and 2   N only have cubic nonlinearities present. One difference in the time histories is that the forcing amplitude of 0.5   N interacts with the magnet more than the 10   m m configuration, nearly oscillating along the magnet boundary similarly to the higher forcing functions. Quasiperiodic behavior is the source of the aperiodic regions in the second resonant peak. Interestingly, in the power spectrum seen in Figure A7f, the forcing amplitudes that induce quasiperiodic behavior have a higher neutral amplitude over the forcing amplitude of 0.1   N . This indicates the increased energy in the system during the second resonant peak, which causes the absorber to be unable to control the primary structure’s displacement.
Figure A7. Nonlinear characterization of the absorber’s first (first column) and second peaks (second column) utilizing time histories (a,b), phase portraits (c,d), power spectra (e,f) and Poincare maps (g,h).
Energies 16 01272 g0a7aEnergies 16 01272 g0a7b

References

  1. Kaynia, A.M.; Veneziano, D.; Biggs, J.M. Seismic effectiveness of tuned mass dampers. Am. Soc. Civ. Eng. 1982, 107, 1465–1484. [Google Scholar] [CrossRef]
  2. Rahimi, F.; Aghayari, R.; Samali, B. Application of Tuned Mass Dampers for Structural Vibration Control: A State-of-the-art Review. Civ. Eng. J. 2020, 6, 1622–1651. [Google Scholar] [CrossRef]
  3. Thenozhi, S.; Yu, W. Advances in modeling and vibration control of building structures. Annu. Rev. Control. 2013, 37, 346–364. [Google Scholar] [CrossRef]
  4. Rahman, M.; Ong, Z.C.; Chong, W.T.; Julai, S.; Khoo, S.Y. Performance enhancement of wind turbine systems with vibration control: A review. Renew. Sustain. Energy Rev. 2015, 51, 43–54. [Google Scholar] [CrossRef]
  5. Yao, J.T.P. Concept of structural control. J. Struct. Div. 1972, 98, 1567–1574. [Google Scholar] [CrossRef]
  6. Zhang, C.; Ou, J. Control Structure Interaction of Electromagnetic Mass Damper System for Structural Vibration Control. Am. Soc. Civ. Eng. 2008, 134, 428–437. [Google Scholar] [CrossRef]
  7. Daie, M.; Jalali, A.; Suhatril, M.; Shariati, M.; Khanouki, M.A.; Shariati, A.; Kazemi-Arbat, P. A new finite element investigation on pre-bent steel strips as damper for vibrational control. Int. J. Phys. Sci. 2011, 6, 8044–8050. [Google Scholar]
  8. Høgsberg, J.; Brodersen, M.L. Hybrid viscous damper with filtered integral force feedback control. J. Vib. Control. 2016, 22, 1645–1656. [Google Scholar] [CrossRef] [Green Version]
  9. Begdeli, Y.; Kim, D. Damping effects of the passive control devices on structural vibration control: TMD, TLC and TLCD for varying total masses. KSCE J. Civ. Eng. 2016, 20, 301–308. [Google Scholar] [CrossRef]
  10. Fischer, O. Wind-excited vibrations—Solution by passive dynamic vibration absorbers of different types. J. Wind. Eng. Ind. Aerodyn. 2007, 95, 1028–1039. [Google Scholar] [CrossRef]
  11. Shu, Z.; Li, S.; Zhang, J.; He, M. Optimum seismic design of a power plant building with pendulum tuned mass damper system by its heavy suspended buckets. Eng. Struct. 2017, 136, 114–132. [Google Scholar] [CrossRef]
  12. Sun, C.; Jahangiri, V. Bi-directional vibration control of offshore windturbines using 3D pendulum tuned mass damper. Mech. Syst. Signal Process. 2018, 105, 338–360. [Google Scholar] [CrossRef]
  13. Haxton, R.S.; Barr, A.D.S. The Autoparametric Vibration Absorber. Trans. ASME 1972, 94, 119–125. [Google Scholar] [CrossRef]
  14. Silva-Navarro, G.; Abundis-Fong, H.F. Passive/Active Autoparametric Cantilever Beam Absorber With Piezoelectric Actuator for a Two-Story Building-Like Structure. J. Vib. Acoust. 2015, 137, 011012. [Google Scholar] [CrossRef]
  15. Jacquot, R.G.; Foster, J.E. Optimal Cantilever Dynamic Vibration Absorbers. Trans. ASME 1977, 99, 138–141. [Google Scholar] [CrossRef]
  16. Crovetto, A.; Wang, F.; Hansen, O. Modeling and Optimization of an Electrostatic Energy Harvesting Device. J. Microelectromech. Syst. 2014, 23, 1141–1155. [Google Scholar] [CrossRef] [Green Version]
  17. Khan, F.U.; Qadir, M.U. State-of-the-art in vibration-based electrostatic energy harvesting. J. Micromech. Microeng. 2016, 26, 103001. [Google Scholar] [CrossRef]
  18. Palagummi, S.; Yuan, F. An optimal design of a mono-stable vertical diamagnetic levitation based electromagnetic vibration energy harvester. J. Sound Vib. 2015, 342, 330–345. [Google Scholar] [CrossRef]
  19. Mann, B.; Sims, N. Energy harvesting from the nonlinear oscillations of magnetic levitation. J. Sound Vib. 2009, 319, 515–530. [Google Scholar] [CrossRef] [Green Version]
  20. Liu, H.; Gudla, S.; Hassani, F.A.; Heng, C.H.; Lian, Y.; Lee, C. Investigation of the Nonlinear Electromagnetic Energy Harvesters From Hand Shaking. IEEE Sensors J. 2014, 15, 2356–2364. [Google Scholar] [CrossRef]
  21. Aouali, K.; Kacem, N.; Bouhaddi, N.; Mrabet, E.; Haddar, M. Efficient broadband vibration energy harvesting based on tuned non-linearity and energy localization. Smart Mater. Struct. 2020, 29, 10LT01. [Google Scholar] [CrossRef]
  22. Anton, S.R.; Sodano, H.A. A review of power harvesting using piezoelectric materials (2003–2006). Smart Mater. Struct. 2007, 16, R1. [Google Scholar] [CrossRef]
  23. Kim, H.S.; Kim, J.H.; Kim, J. A review of piezoelectric energy harvesting based on vibration. Int. J. Precis. Eng. Manuf. 2011, 12, 1129–1141. [Google Scholar] [CrossRef]
  24. Erturk, A.; Inman, D.J. Piezoelectric Energy Harvesting; Wiley: New York, NY, USA, 2011. [Google Scholar]
  25. Caliò, R.; Rongala, U.B.; Camboni, D.; Milazzo, M.; Stefanini, C.; De Petris, G.; Oddo, C.M. Piezoelectric Energy Harvesting Solutions. Sensors 2014, 14, 4755–4790. [Google Scholar] [CrossRef] [Green Version]
  26. Toyabur, R.; Salauddin, M.; Cho, H.; Park, J.Y. A multimodal hybrid energy harvester based on piezoelectric-electromagnetic mechanisms for low-frequency ambient vibrations. Energy Convers. Manag. 2018, 168, 454–466. [Google Scholar] [CrossRef]
  27. Zhao, L.-C.; Zou, H.-X.; Yan, G.; Liu, F.-R.; Tan, T.; Zhang, W.-M.; Peng, Z.-K.; Meng, G. A water-proof magnetically coupled piezoelectric-electromagnetic hybrid wind energy harvester. Appl. Energy 2019, 239, 735–746. [Google Scholar] [CrossRef]
  28. Mahmoudi, S.; Kacem, N.; Bouhaddi, N. Enhancement of the performance of a hybrid nonlinear vibration energy harvester based on piezoelectric and electromagnetic transductions. Smart Mater. Struct. 2014, 23, 075024. [Google Scholar] [CrossRef]
  29. Xia, H.; Chen, R.; Ren, L. Analysis of piezoelectric–electromagnetic hybrid vibration energy harvester under different electrical boundary conditions. Sens. Actuators A Phys. 2015, 234, 87–98. [Google Scholar] [CrossRef]
  30. Zhao, D.; Liu, S.; Xu, Q.; Sun, W.; Wang, T.; Cheng, Q. Theoretical modelng and analysis of a 2-degree-of-freedom hybrid piezoelectric-electromagnetic vibration energy harvester with a driven beam. J. Intell. Mater. Syst. Struct. 2018, 29, 2465–2476. [Google Scholar] [CrossRef]
  31. Dai, H.L.; Abdelmoula, H.; Abdelkefi, A.; Wang, L. Towards control of cross-flow-induced vibrations based on energy harvesting. Nonlinear Dyn. 2017, 88, 2329–2346. [Google Scholar] [CrossRef]
  32. Abdelmoula, H.; Abdelkefi, A. The potential of electrical impedance on the performance of galloping systems for energy harvesting and control applications. J. Sound Vib. 2016, 370, 191–208. [Google Scholar] [CrossRef]
  33. Abdelmoula, H.; Dai, H.L.; Abdelkefi, A.; Wang, L. Control of base-excited dynamical systems through piezoelectric energy harvesting absorber. Smart Mater. Struct. 2017, 26, 095013. [Google Scholar] [CrossRef]
  34. McNeil, I.; Abdelkefi, A. Nonlinear modeling and vibration mitigation of combined vortex-induced and base vibrations through energy harvesting absorbers. Commun. Nonlinear Sci. Numer. Simul. 2020, 95, 105655. [Google Scholar] [CrossRef]
  35. Ali, S.F.; Adhikari, S. Engerry harvesting dynamic vibration absorbers. J. Appl. Mech. 2013, 80, 041004. [Google Scholar] [CrossRef]
  36. Yan, Z.; Hajj, M.R. Energy harvesting from an autoparametric vibration absorber. Smart Mater. Struct. 2015, 24, 115012. [Google Scholar] [CrossRef]
  37. Felix, J.L.P.; Balthazar, J.M.; Rocha, R.T.; Tusset, A.M.; Janzen, F.C. On vibration mitigation and energy harvesting of a non-ideal system with autoparametric vibration absorber system. Meccanica 2018, 53, 3177–3188. [Google Scholar] [CrossRef] [Green Version]
  38. Tang, L.; Yang, Y.; Soh, C.-K. Improving functionality of vibration energy harvesters using magnets. J. Intell. Mater. Syst. Struct. 2012, 23, 1433–1449. [Google Scholar] [CrossRef]
  39. Haitao, L.; Qin, W.; Chunbo, L.; Deng, W.; Zhou, Z. Dynamics and coherence resonance of tri-stable energy harvesting system. Smart Mater. Struct. 2015, 25, 015001. [Google Scholar] [CrossRef]
  40. Kim, P.; Seok, J. A multi-stable eneregy harvester: Dynamic modeling and bifurcation analysis. J. Sound Vib. 2014, 333, 5525–5547. [Google Scholar] [CrossRef]
  41. Zhou, S.; Cao, J.; Inman, D.J.; Lin, J.; Liu, S.; Wang, Z. Broadband tristable energy harvester: Modeling and experiment verification. Appl. Energy 2014, 133, 33–39. [Google Scholar] [CrossRef]
  42. Wang, W.; Cao, J.; Bowen, C.R.; Zhang, Y.; Lin, J. Nonlinear dynamics and performance enhancement of asymmetric potential bistable eneregy harvesters. Nonlinear Dyn. 2018, 94, 1183–1194. [Google Scholar] [CrossRef]
  43. Tang, L.; Yang, Y. A nonlinear piezoelectric energy harvester with magnetic oscillator. Appl. Phys. Lett. 2012, 101, 094102. [Google Scholar] [CrossRef]
  44. Abdelkefi, A.; Barsallo, N. Comparative modeling of low-frequency piezomagnetoelastic energy harvesters. J. Intell. Mater. Syst. Struct. 2014, 25, 1771–1785. [Google Scholar] [CrossRef]
  45. Abdelmoula, H.; Zimmerman, S.; Abdelkefi, A. Accurate modeling, comparative analysis, and performance enhancement of broadband piezoelectric energy harvesters with single and dual magnetic forces. Int. J. Non-linear Mech. 2017, 95, 355–363. [Google Scholar] [CrossRef]
  46. Alvis, T.; Abdelkefi, A. Effectiveness and nonlinear characterization of vibro-impact energy harvesting absorbers in controlling base-excited systems. Smart Mater. Struct. 2021, 30, 095028. [Google Scholar] [CrossRef]
  47. Alvis, T.; Abdelkefi, A. Effective design of vibro-impact energy harvesting absorbers with asymmetric stoppers. Eur. Phys. J. Spéc. Top. 2022, 231, 1567–1586. [Google Scholar] [CrossRef]
  48. Upadrashta, D.; Yang, Y.; Tang, L. Material strength consideration in the design optimization of nonlinear energy harvester. J. Intell. Mater. Syst. Struct. 2015, 26, 1980–1994. [Google Scholar] [CrossRef]
  49. Sezer, N.; Koç, M. A comprehensive review on the state-of-the-art of piezoelectric energy harvesting. Nano Energy 2021, 80, 105567. [Google Scholar] [CrossRef]
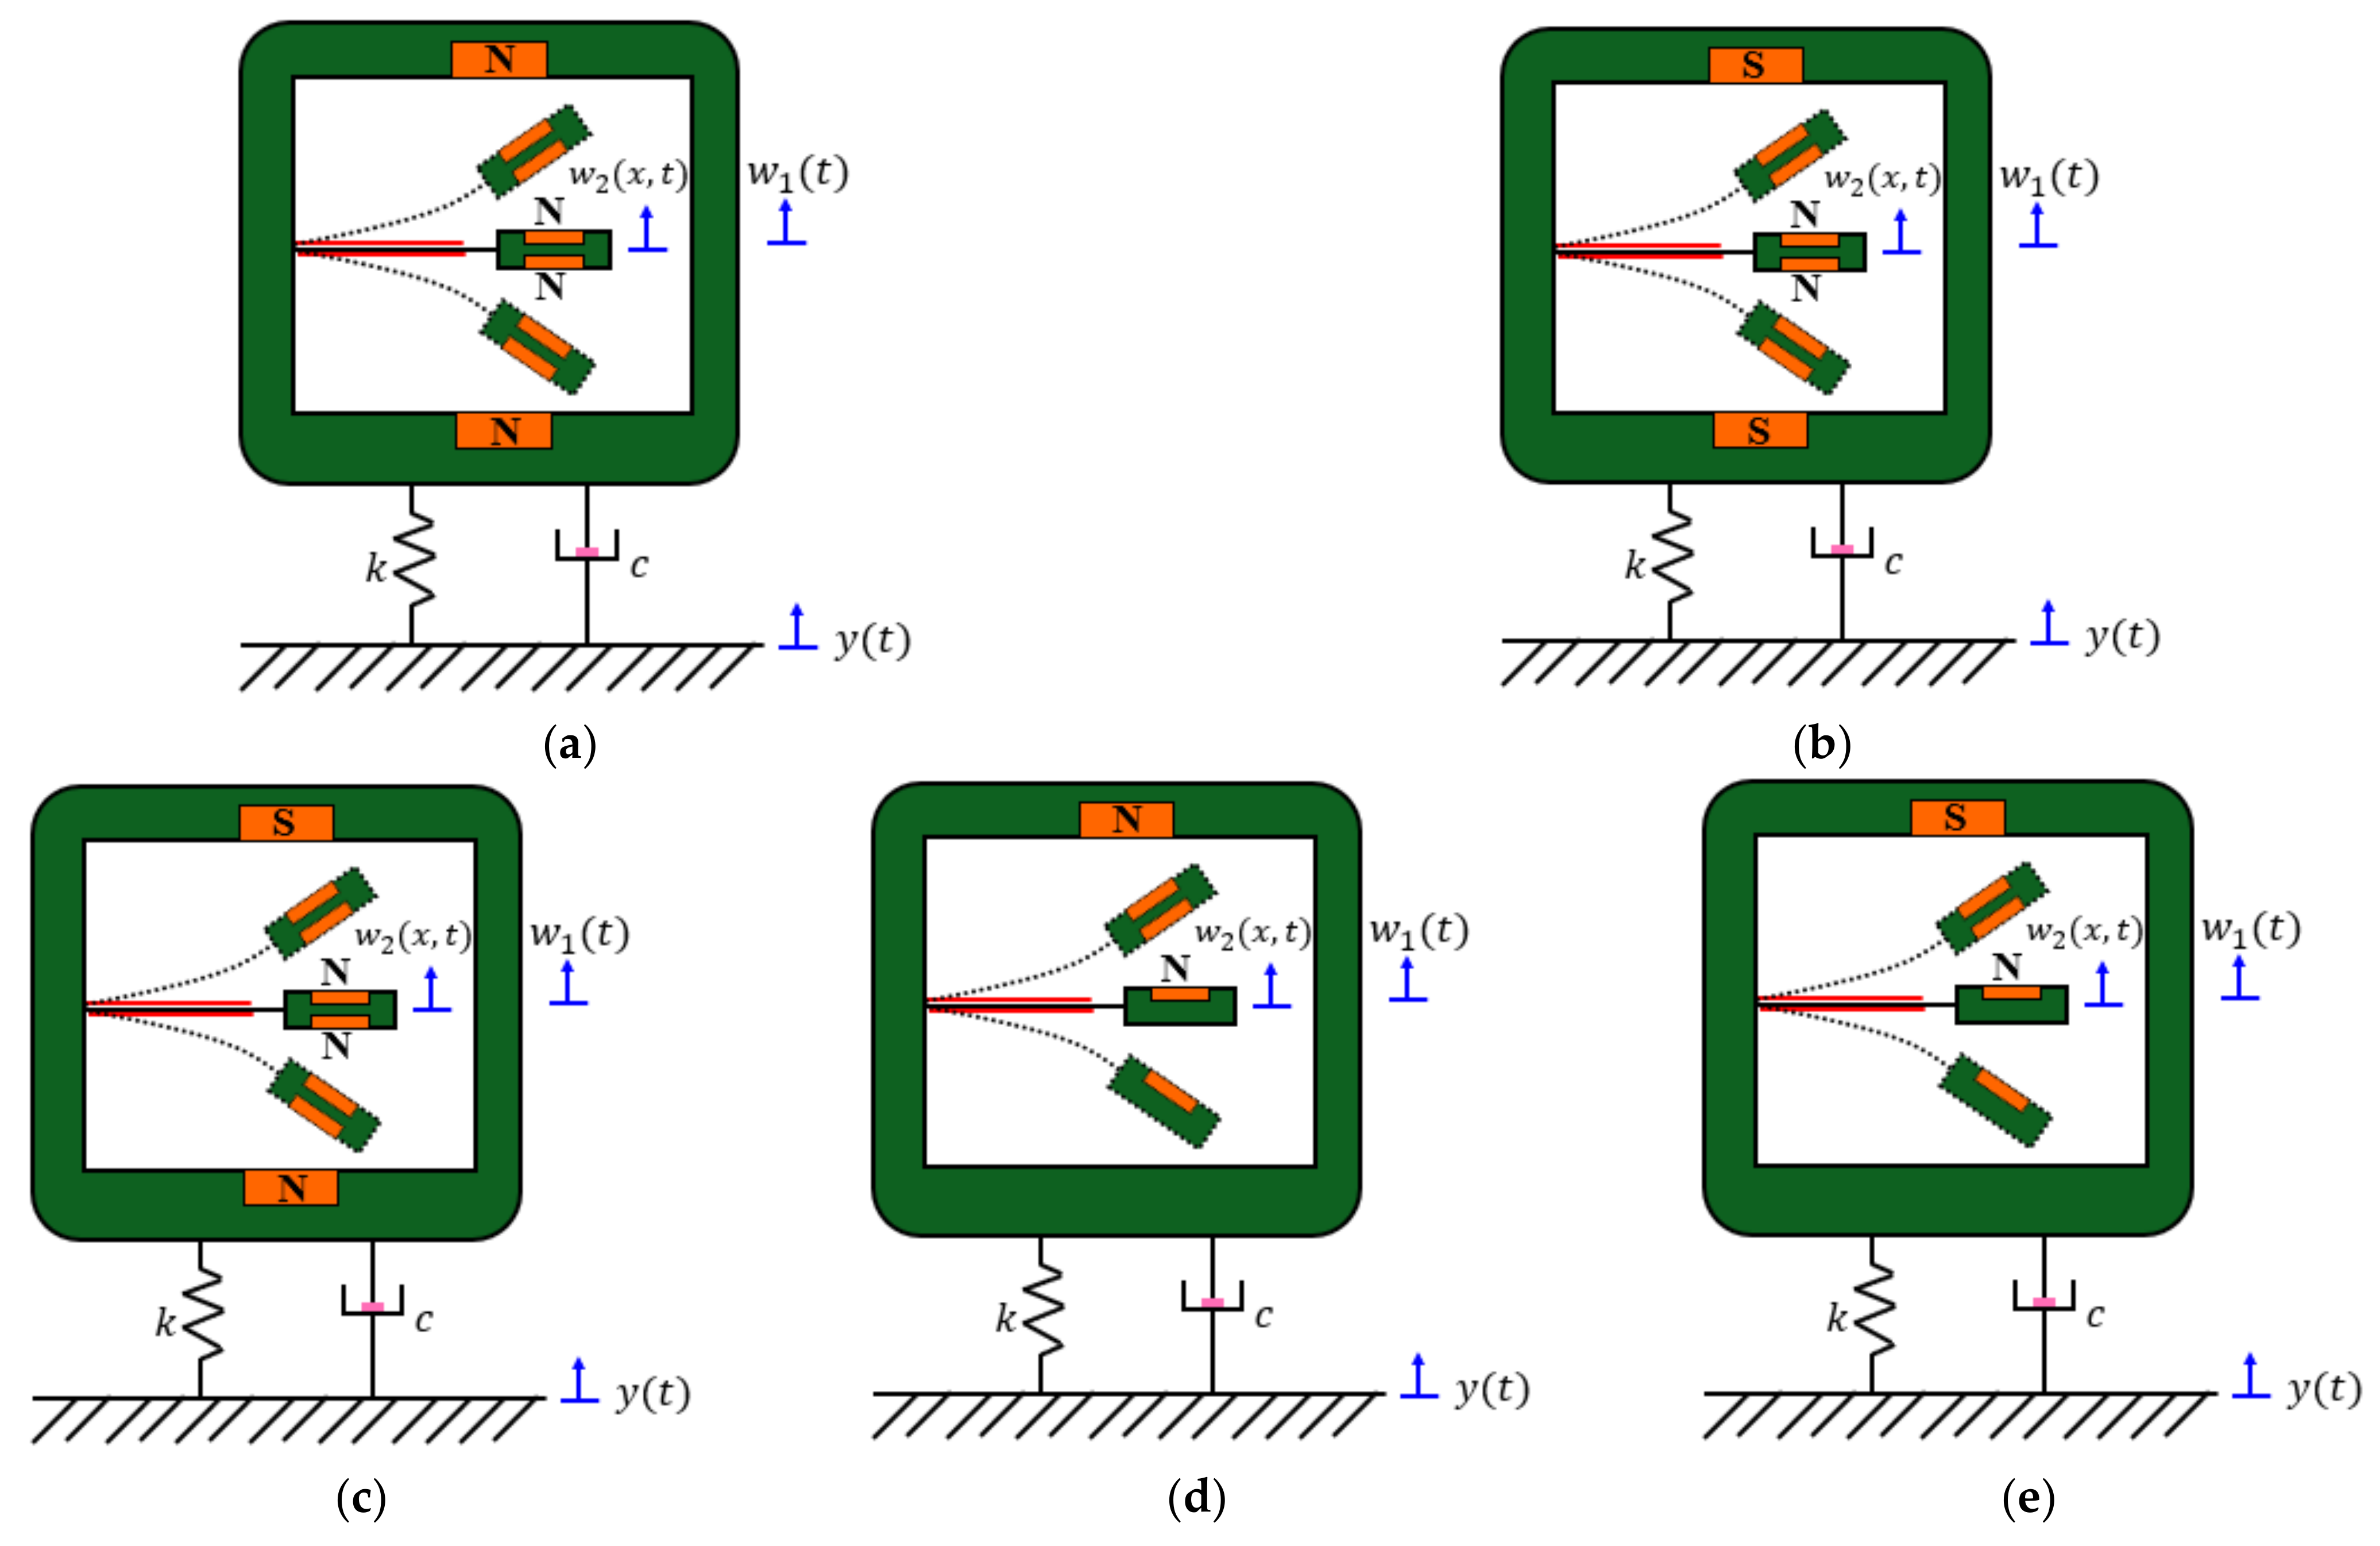
Figure 1. A representation of the coupled system under investigation with two magnet constraints with (a) repulsive and (b) attractive configurations that generate neutral static positions. Configurations that generate a change in static position are (c) two magnet constraints with opposite polarities and single magnet constraints of (d) repulsive and (e) attractive configurations.
Energies 16 01272 g001
Figure 2. A comparison between the dipole–dipole approximation and the COMSOL data [48].
Energies 16 01272 g002
Figure 3. The effects of the magnetic forces on the static position of the absorber when the magnets are attractive in (a) linear and (b) log scale, and (c) repulsive.
Energies 16 01272 g003
Figure 4. The effects of the magnetic forces on the coupled natural frequencies of the system when the magnets are (a) attractive and (b) repulsive.
Energies 16 01272 g004
Figure 5. A comparison of magnetic force expressions versus gap size between the magnets.
Energies 16 01272 g005
Figure 6. Various forcing methods for dynamic gaps smaller than 1 mm during the (a) transient and (b) steady states.
Energies 16 01272 g006
Figure 7. Convergence analysis of the repulsive–repulsive configuration for the (a) displacement of the primary structure, (b) absorber’s displacement and (c) power generated.
Energies 16 01272 g007
Figure 8. Potential energy for the attractive configurations with (a) single magnet and (b) double magnets.
Energies 16 01272 g008
Figure 9. Phase portraits for a single magnet case (a,b) and double magnet case (c,d) for a gap size of (a) 10   m m , (b) 8.113   m m , (c) 10   m m and (d) 7.12   m m .
Energies 16 01272 g009
Figure 10. Response of the single attractive configuration for the (a) primary structure, (b) absorber’s displacement (c) and average power generated.
Energies 16 01272 g010
Figure 11. Response of the attractive–attractive configuration for the (a) primary structure, (b) absorber’s displacement (c) and average power generated.
Energies 16 01272 g011
Figure 12. Potential energy for the repulsive configurations with (a) single magnet and (b) double magnets.
Energies 16 01272 g012
Figure 13. Phase portraits for a single magnet case (a,b) and double magnet case (c,d) for a gap size of (a,c) 6 mm and (b,d) 5.66 mm.
Energies 16 01272 g013
Figure 14. Response of the single repulsive configuration for the (a) primary structure, (b) absorber’s displacement (c) and average power generated.
Energies 16 01272 g014
Figure 15. Response of the double repulsive configuration for the (a) primary structure, (b) absorber’s displacement (c) and average power generated.
Energies 16 01272 g015
Figure 16. The load resistance effects with varying initial gap sizes on the (a) real and (b) imaginary eigenvalues.
Energies 16 01272 g016
Figure 17. The substrate thickness’s effects on the natural frequencies for varying tip masses for a gap size of (a) 10 mm, (b) 7.5 mm and (c) 5 mm.
Energies 16 01272 g017
Figure 18. The effects of varying tip masses with a substrate thickness of 0.3 mm and an initial gap of 10 mm on the amplitude of the (a) primary structure and (b) absorber, as well as a comparison with configurations with no magnets (c,d).
Energies 16 01272 g018
Figure 19. The effects of varying tip masses with a substrate thickness of 0.3 mm and an initial gap of 7.5 mm on the amplitude of the (a) primary structure and (b) absorber, as well as a comparison with configurations with no magnets (c,d).
Energies 16 01272 g019
Figure 20. The effects of varying tip masses with a substrate thickness of 0.3 mm and an initial gap of 5 mm on the amplitude of the (a) primary structure and (b) absorber, as well as a comparison with configurations with no magnets (c,d).
Energies 16 01272 g020
Figure 21. The initial gap’s effects on the coupled natural frequency of varying tip masses.
Energies 16 01272 g021
Figure 22. The effects of paired substrate thicknesses and tip masses that induce strong coupling and an initial gap of 10 mm on the amplitude of the (a) primary structure and (b) absorber, as well as a comparison with configurations with no magnets (c,d).
Energies 16 01272 g022
Figure 23. The initial gap’s effects on the coupled natural frequency of varying tip masses with its paired substrate thickness.
Energies 16 01272 g023
Figure 24. The effects of paired substrate thicknesses and tip masses that induce strong coupling and an initial gap of 7.5 mm on the amplitude of the (a) primary structure and (b) absorber, as well as a comparison with configurations with no magnets (c,d).
Energies 16 01272 g024aEnergies 16 01272 g024b
Figure 25. The initial gap’s effects on the coupled natural frequency of varying tip masses with its paired substrate thickness.
Energies 16 01272 g025
Figure 26. The effects of paired substrate thicknesses and tip masses that induce strong coupling and an initial gap of 5 mm on the amplitude of the (a) primary structure and (b) absorber, as well as a comparison with configurations with no magnets (c,d).
Energies 16 01272 g026
Figure 27. The initial gap’s effects on the coupled natural frequency of varying tip masses with its paired substrate thickness.
Energies 16 01272 g027
Figure 28. Modal convergence analysis for a forcing amplitude F 0 of 2   N , gap of M t of 5   m m , h s of 0.1397   m m and M t of 0.06   K g for the (a) primary structure’s displacement, (b) absorber’s displacement and (c) energy harvested.
Energies 16 01272 g028aEnergies 16 01272 g028b
Figure 29. Time history of the absorber’s velocity at 29.2982   r a d / s .
Energies 16 01272 g029
Figure 30. Forcing amplitude effects with a gap of 10 mm on the (a) primary structure’s normalized displacement, (b) the absorber’s displacement and (c) the normalized power generated.
Energies 16 01272 g030
Figure 31. Forcing amplitude effects with a gap of 7.5 mm on the (a) primary structure’s normalized displacement, (b) the absorber’s displacement and (c) the normalized power generated.
Energies 16 01272 g031
Figure 32. Forcing amplitude effects with a gap of 5 mm on the (a) primary structure’s normalized displacement, (b) the absorber’s displacement and (c) the normalized power generated.
Energies 16 01272 g032
Figure 33. Bifurcation diagram of the absorber’s position with a gap of 10 mm, tip mass of 0.06 kg and substrate thickness of 0.4759 mm.
Energies 16 01272 g033
Figure 34. Nonlinear characterization of the absorber’s first (first column) and second peaks (second column) utilizing time histories (a,b), phase portraits (c,d), power spectra (e,f) and Poincare maps (g,h).
Energies 16 01272 g034
Figure 35. Bifurcation diagram of the absorber’s position with a gap of 5 mm, tip mass of 0.06 kg and substrate thickness of 0.1397 mm.
Energies 16 01272 g035
Figure 36. Nonlinear characterization of the absorber’s first (first column) and second peaks (second column) utilizing time histories (a,b), phase portraits (c,d), power spectra (e,f) and Poincare maps (g,h).
Energies 16 01272 g036
Table 1. Polynomial coefficients p j .
p 0   p 1 p 2 p 3 p 4 p 5 p 6 p 7 p 8 p 9 p 10 p 11
3.244 2.59 × 10 3 1.072 × 10 6 2.87 × 10 8 5.33 × 10 10 7.07 × 10 12 6.72 × 10 14 4.52 × 10 14 2.1 × 10 18 6.39 × 10 19 1.14 × 10 21 9.09 × 10 21
N N m N m 2 N m 3 N m 4 N m 5 N m 6 N m 7 N m 8 N m 9 N m 10 N m 11
Table 2. Reduced-order model’s parametric values.
ParameterParameter’s SymbolParameter’s Value
Young’s modulus of the absorber substrate E s 190 × 10 9   N / m 2  
Young’s modulus of the piezoelectric layers E p 30.3366 × 10 9 N / m 2
Height of the substrate h s 0.5   m m
Height of the piezoelectric layers h p 0.267   m m
Length of the substrate L 18   c m
Length of the piezoelectric layers L 1 9   c m
Critical length of the tip mass L c 2   c m
Width of the substrate and piezoelectric layers b 2   c m
Density of the substrate ρ s 7800   k g / m 3
Density of the piezoelectric layers ρ p 2730   k g / m 3
Tip mass M t 0.049   k g
Mass of the primary structure M 1.2   k g
Damping coefficient of the structure c 1   N s / m
Damping ratio of the absorber ξ 0.08
Stiffness of the primary structure k 720   N / m
Piezoelectric strain coefficient d 31 320 × 10 12 C / N
Piezoelectric permittivity component ε 33 27.3 × 10 9   F / m
Electric load resistance of the piezoelectric layers R 10 4.73   Ω
Disclaimer/Publisher’s Note: The statements, opinions and data contained in all publications are solely those of the individual author(s) and contributor(s) and not of MDPI and/or the editor(s). MDPI and/or the editor(s) disclaim responsibility for any injury to people or property resulting from any ideas, methods, instructions or products referred to in the content.