1. Introduction
Each day the technology of renewable energy sources improves and favors the evolution of distributed generators, especially photovoltaic ones, facilitating their massive connection to the electrical distribution network. When connected to the grid, they can cause changes in the normal state of operation, causing variations in the voltage levels of the grid [
1]. These variations are intensified by the high intermittency of the local solar radiation and due to the massive connection of the generators to the feeder [
2,
3,
4,
5,
6].
The problems with the voltage levels and elevation of technical losses of the low voltage distribution grid can be intensified when the interaction between the grid and the small PV generators happens, as seen in [
7,
8,
9,
10]. This occurs when a massive connection to the grid of PV generators occurs in a distributed and/or concentrated manner in a single phase. It causes significant impacts on voltage levels, with the appearance of short-duration voltage variations, in addition to excessive voltage unbalance in the power grid.
It was observed in [
11] that the massive connection of centralized or distributed PV generators along the low and medium-voltage electrical distribution networks could cause rapid power variations in the feeder, affecting the behavior of voltage regulators, capacitor banks, and the load tap changer—LTC. The equipment is important for grid operation and essential to perform the control and maneuvers to correct the feeder voltage levels during the system operation [
12].
The voltage regulator equipment inserted in the distribution system faces difficulties in maintaining the normative voltage limits of the electrical grid when interacting with distributed photovoltaic generators. This presents itself as a “power quality” problem faced by the utilities. The relentless pursuit of consumer units for increased electricity consumption, coupled with more expensive energy tariffs, increases the demand for the installation of distributed photovoltaic generators on the electrical grid. This massive connection makes the grid more complex and, consequently, harder to maintain control of the normative voltage limits, making it difficult to operate the voltage regulator equipment inserted in the feeder [
13] due to short duration voltage variation (SDVV), which is also a problem generated by the connection of PV generators to the electrical grids. According to PRODIST module 3 [
14], these problems are expressed as the network responds to critical sags or rises in the feeder’s effective voltage value.
If the power utility uses technical operation artifices, such as adjusting the transformer ratio via the transformer’s TAP, it increases the voltage in the secondary to reverse the sags caused by the line impedance. This type of procedure offers benefits to the consumer units connected at the end of the feeder. However, it can result in the appearance of overvoltages on the feeder, especially when the loads connected to it are idle at the moment of the effective contribution of the connected PV-distributed generators. To correct the problems of deregulation of voltage levels, devices such as TAP changers are used, allowing a physical or automatic change in the transformation ratio of transformer equipment, regulating the voltage levels in the secondary service network to the limits established by the National Electric Energy Agency [
15].
4. Methodology
For the simulations, the software OpenDSS (Open Distribution System Simulator) was used, developed by Electric Power Research Institute (EPRI), to carry out the analysis of the electric power system in a steady state in a Permanent sinusoidal regime—RMS.
The program performs most of the analyses in a Permanent sinusoidal regime (RMS), which is widely used to carry out the planning studies of electric energy distribution systems [
32,
34]. OpenDSS performs studies related to the electrical system, for load flow, a connection of distributed generators, and in the study of smart grid solutions and practices (Smart Grid).
The real MV and LV distribution network was modeled in the OpenDSS software through the normative technical parameters, characteristics of the real demand curves of the feeder in question, the loads (consumer units) allocated and configured for each connected transformer, in addition to the connection of photovoltaic systems.
Figure 7 represents the modeled curve for the connected photovoltaic systems, obeying a solar irradiation profile with high variability and, for the loads, a load curve (demand) with average load was inserted, of the actual feeder in question, with the objective of configuring the software with technical and operational data and thus conducting the analyses as close to normality as possible.
The prosumers and traditional consumer units were allocated to their buses, and their load consumptions were assigned considering the regulations of the local utility in case of installation of distributed photovoltaic—PV microgenerators and minigenerators. Thus, it was possible to analyze the behavior of voltage levels through responses from monitors implemented at strategic points of the lines, transformers, and voltage regulators installed when large medium and low-scale voltage PV systems are connected to the feeder.
4.1. Description of Scenarios
4.1.1. Scenario 1 (Base)—Distribution System without PV Distributed Generation
In this scenario, a simulation of the electrical distribution network was performed in the absence of power from the photovoltaic generators. Energy analyzers (Monitors) were modeled and allocated in strategic positions to record the behavior of the power flow in the lines, voltage unbalance levels, and variation of the voltage regulator TAP position levels, in addition to other technical parameters that support the system analysis. It is worth noting that the demand curves were submitted to the feeder, varying the carrying percentage and framing it in conventional (nominal) loading and high loading according to the profile of the consumers connected to the feeder.
4.1.2. Scenario 2—Insertion of Single-Phase and Three-Phase PV Systems with Power Demands Varying with the Daily Profile
In this scenario, the PV generators were introduced at the system busbars, separating them between three-phase and single-phase cases. For both cases, the simulations performed were divided into the variation of load demand and photovoltaic power with daily profile curves. The separation between the cases of three-phase and single-phase connections aimed to separate the effects of both since unbalanced connections tend to increase voltage unbalance rates. Subsequently, both situations will be considered simultaneously. The active power supplied by the photovoltaic systems massively connected to the feeder was parameterized at 20% (single-phase), 35% (three-phase), and 55% (three-phase and single-phase) with the feeder demand curve at average load.
In
Table 7, it is possible to identify the PV generators that were introduced to the feeders and other characteristics such as phase, connected transformer, operating voltage level, and installed power. It is worth noting that the power of the generators followed a variation profile according to the percentages mentioned in the previous paragraph, making it possible to extract the maximum from the feeders to which these PV generators were connected.
5. Results
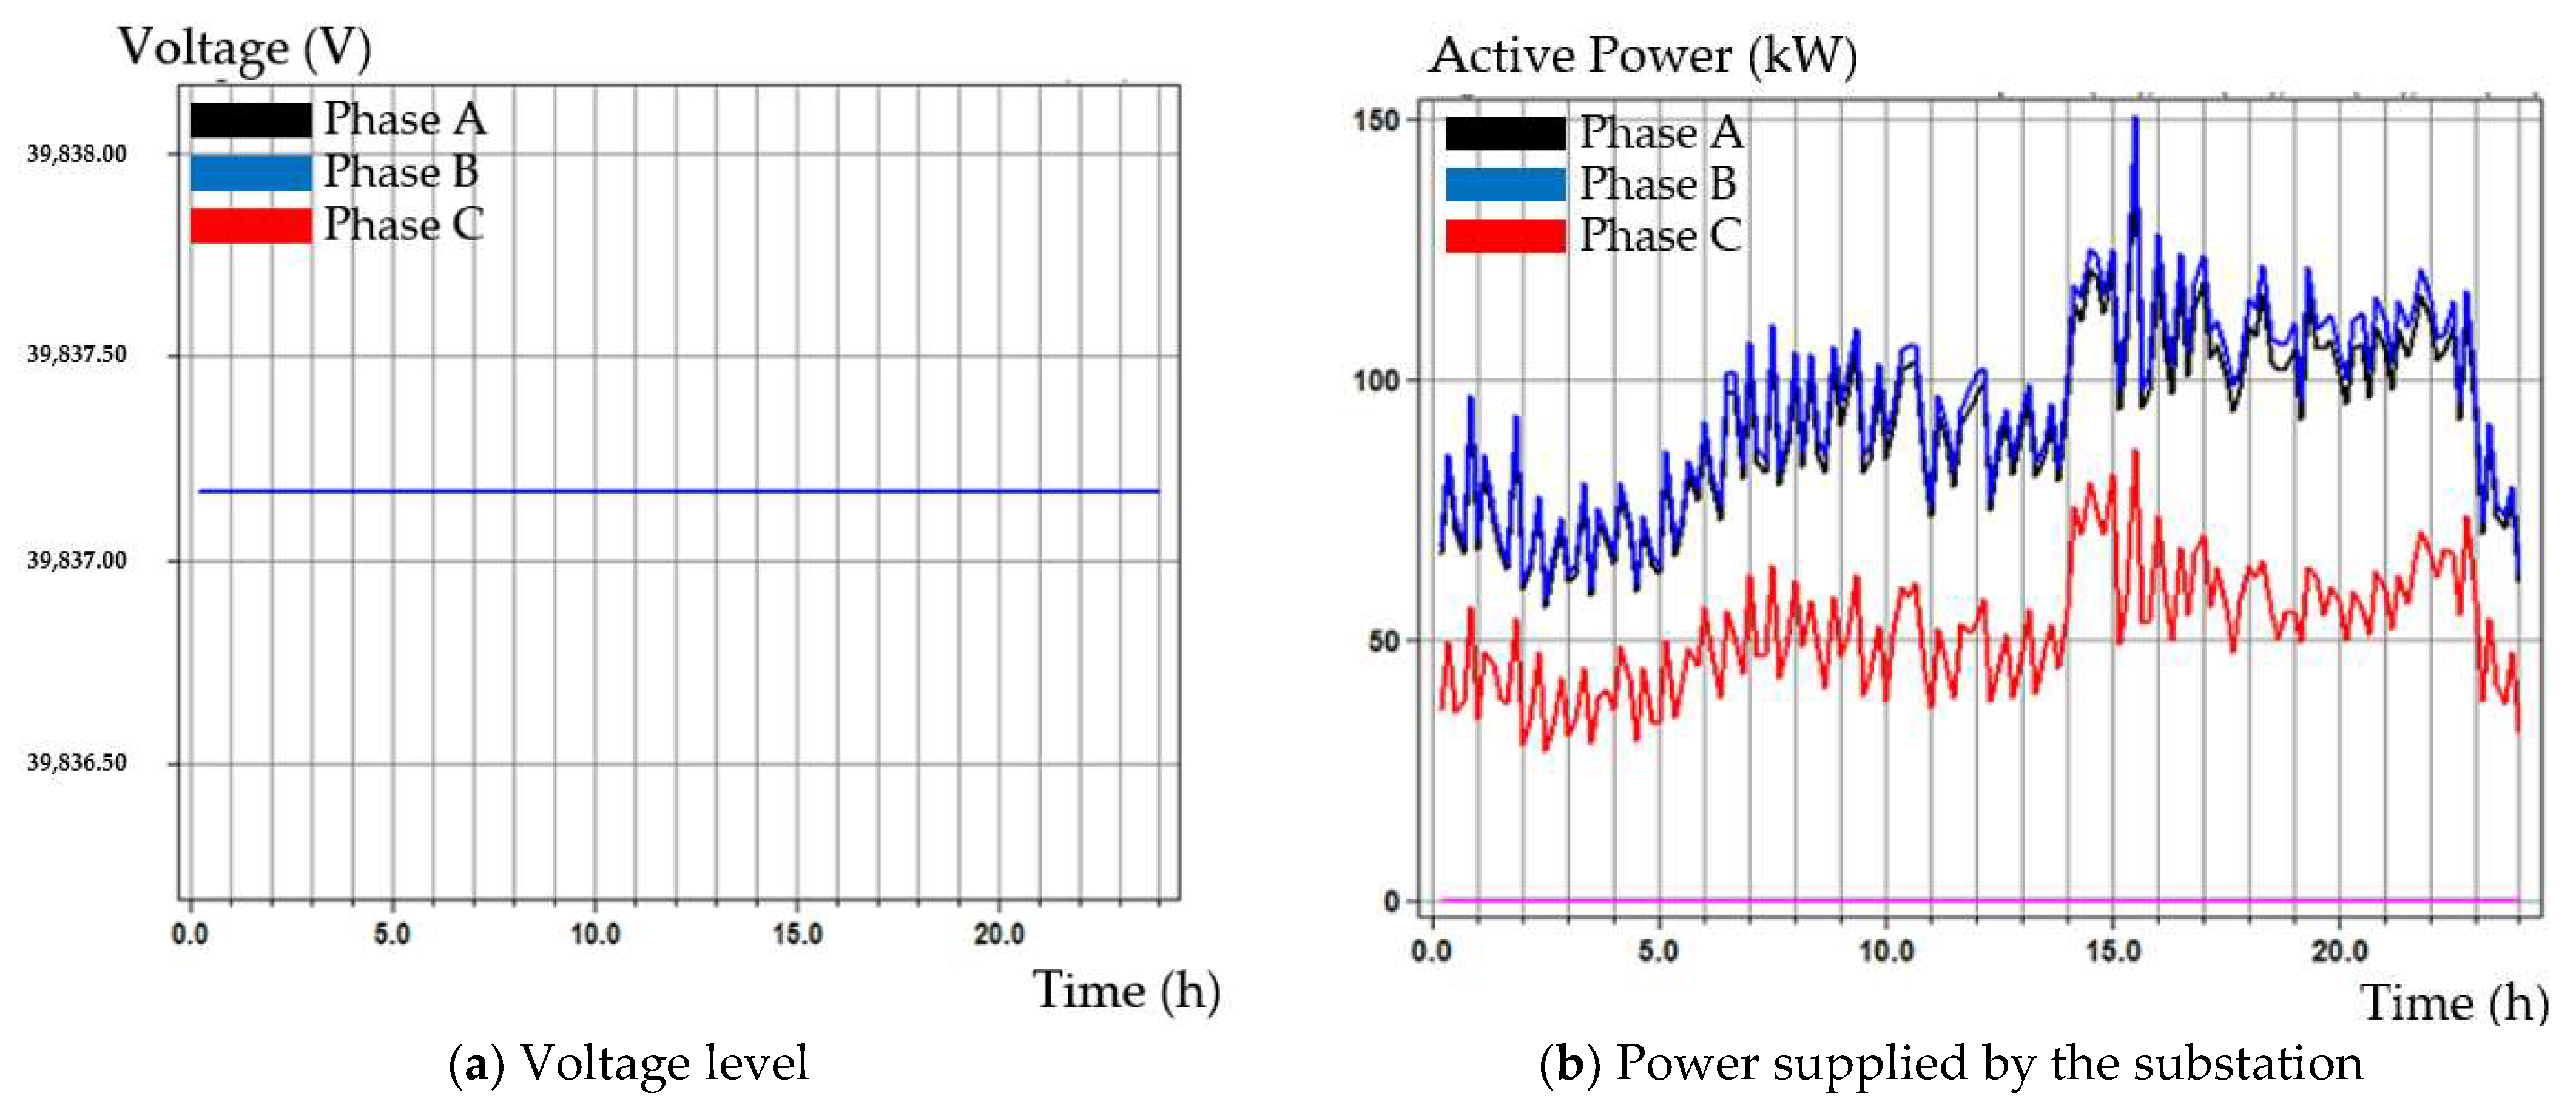
When analyzing the results, it was possible to observe electrical parameters close to the real operating characteristics, in voltage levels, active and reactive power, as can be seen in
Figure 8a–c. As it is an unbalanced circuit, as seen in
Table 6, where most of the loads connected to low voltage radiating circuits are concentrated in phases A and B, it was expected that the simulated results projected this high imbalance between the phases.
Figure 8b,c highlight the values of active and reactive demand “requested” by the consumer units to the electrical substation, respectively.
Figure 8c shows the values of reactive power contained in the system since, at low voltage, the consumers are connected to the feeder through a power factor of 0.92, justifying the unbalance contained in the circuit and the prevalence of reactive power in Phase A of the electrical network.
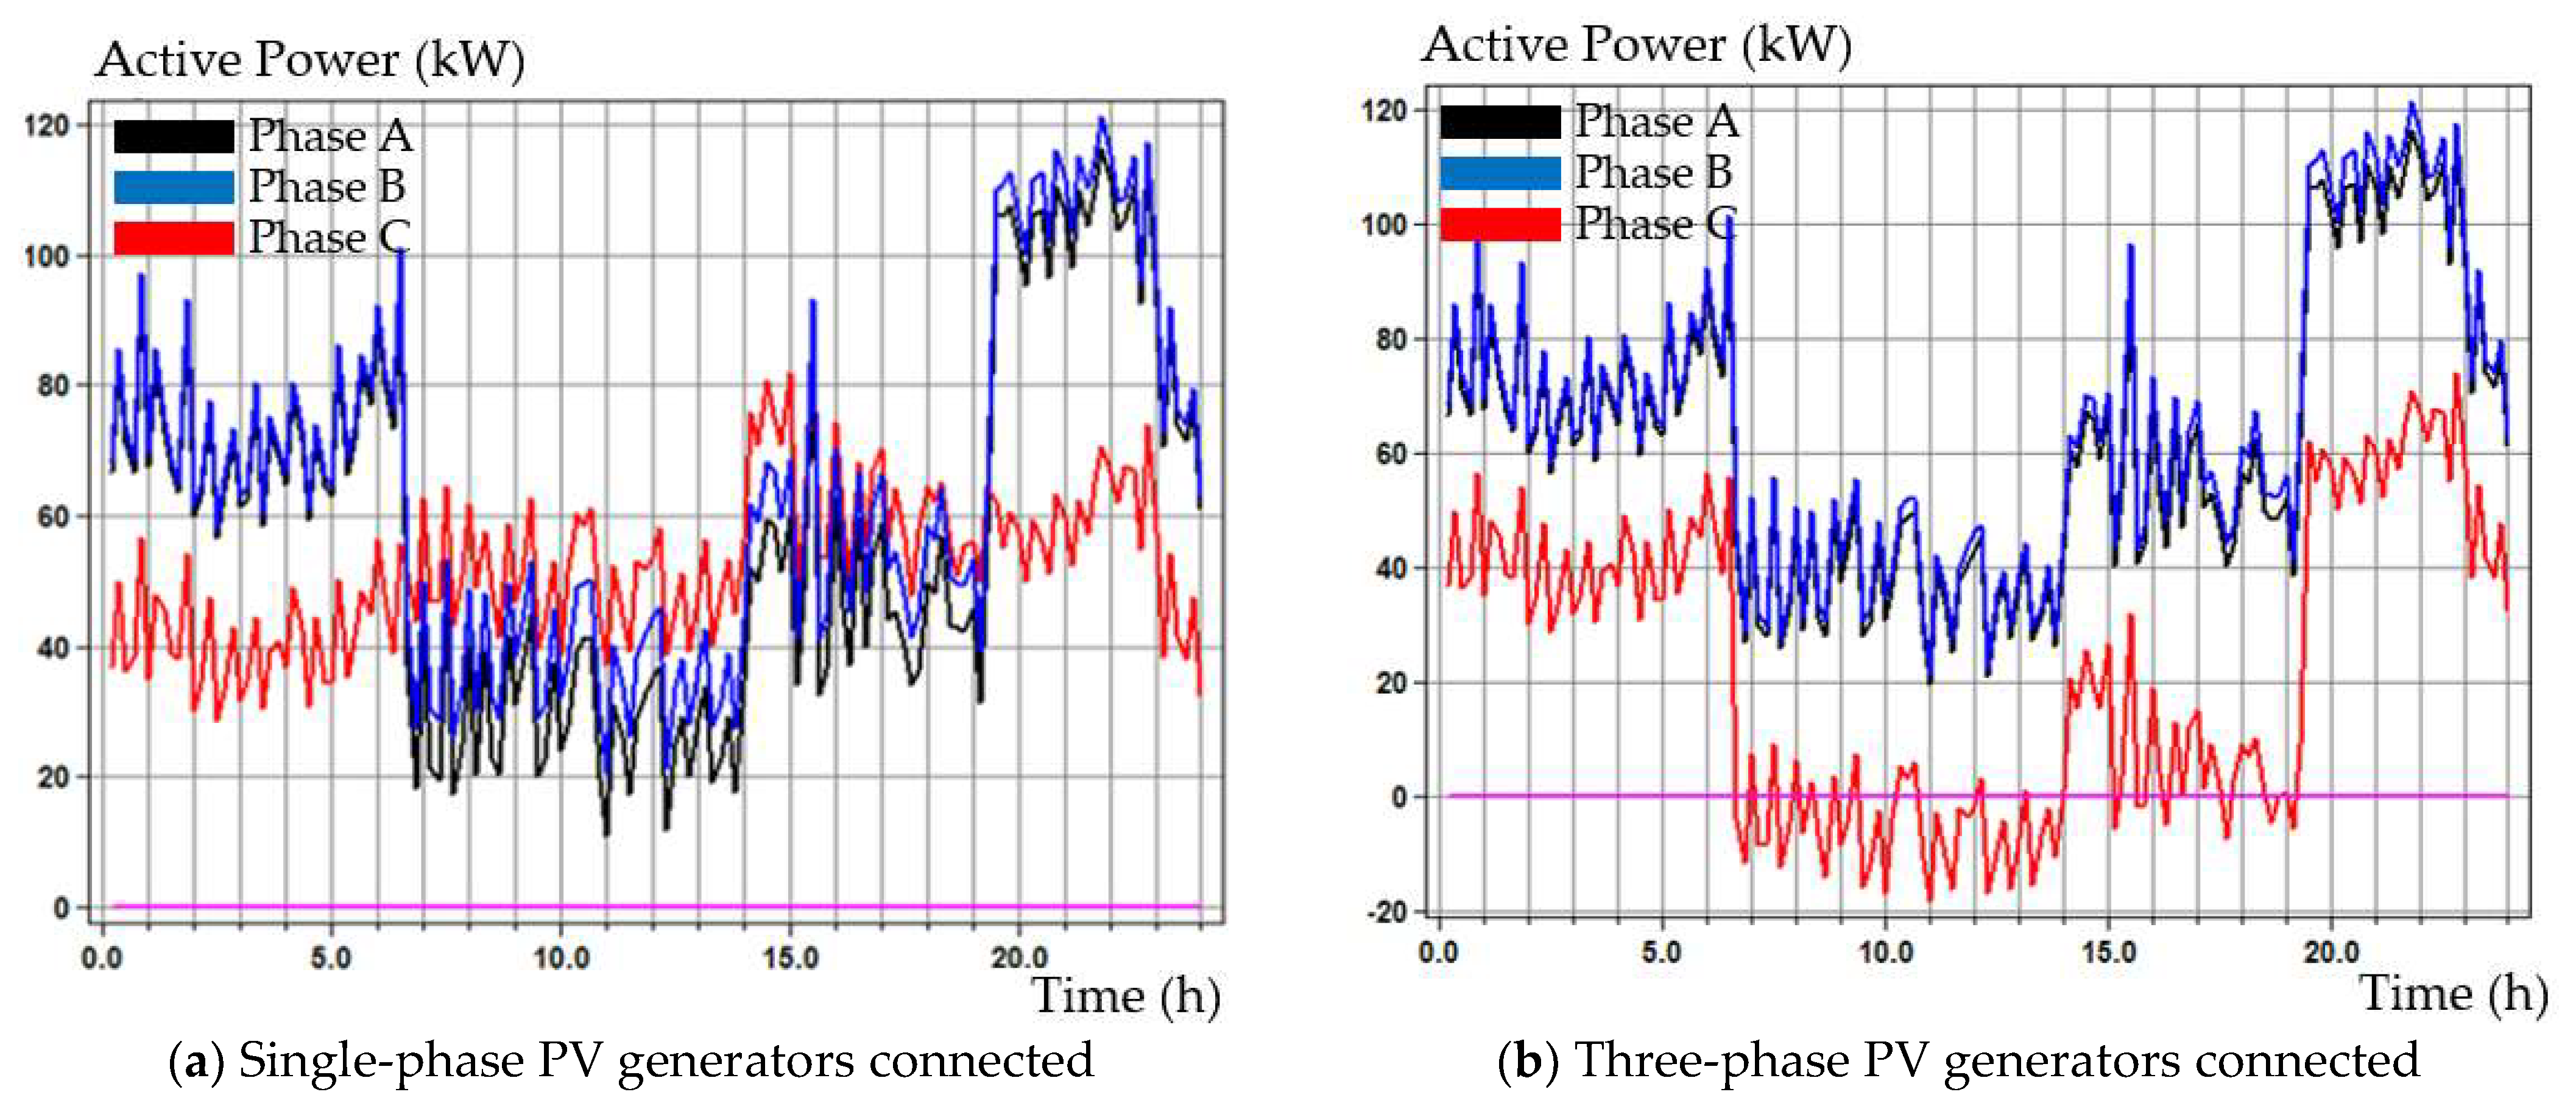
Figure 9a–c graphically present the active powers of the feeder observed by a monitor allocated at the output of the electrical substation when single-phase, three-phase, and two-phase distributed PV generators were connected to the circuit simultaneously. The installation of PV generators in consumer units followed an asymmetrical distribution profile, focusing on each prosumer’s power availability and compatibility. Even with the real unbalance of the feeder, it was possible to connect the PV generators without altering the technical parameters of the network, i.e., the voltage limits and the power quality profile established by the normative characteristics. Thus, the limits were not exceeded during the network operation, demonstrating that the voltage regulators were sufficient to maintain the voltage within the adequate energy supply levels.
In
Figure 9a–c, it was observed that during the contribution period of the PV-distributed generators connected to the feeder between 5 am and 5 pm, there was power compensation from the substation compared to the base case. An unbalance between phases was observed, caused by the massive connection of PV generators to Phase A of the feeder since it has many consumer units connected. In Phase C, however, relatively few changes were observed throughout the day, remaining practically unchanged from the base case seen in
Figure 8b.
Figure 9b, with only the installation of three-phase PV generators, the expected naturally occurred; all phases received balanced, active power, which caused an imbalance between phase C in relation to phases A and B, an unexpected situation when it occurs the connection of three-phase systems to the electrical grid. In this particular case, this discrepancy occurred due to the load distribution characteristics along the feeder; as seen in
Table 5, phase C has the fewest connected consumer units, making it idler compared to the other phases. Justifying the reverse power flow in the line that occurs between 7 am to 2 pm and at varying peaks at 3 pm and 4 pm, portraying that during the operation of PV generators, there was excess active power in this phase.
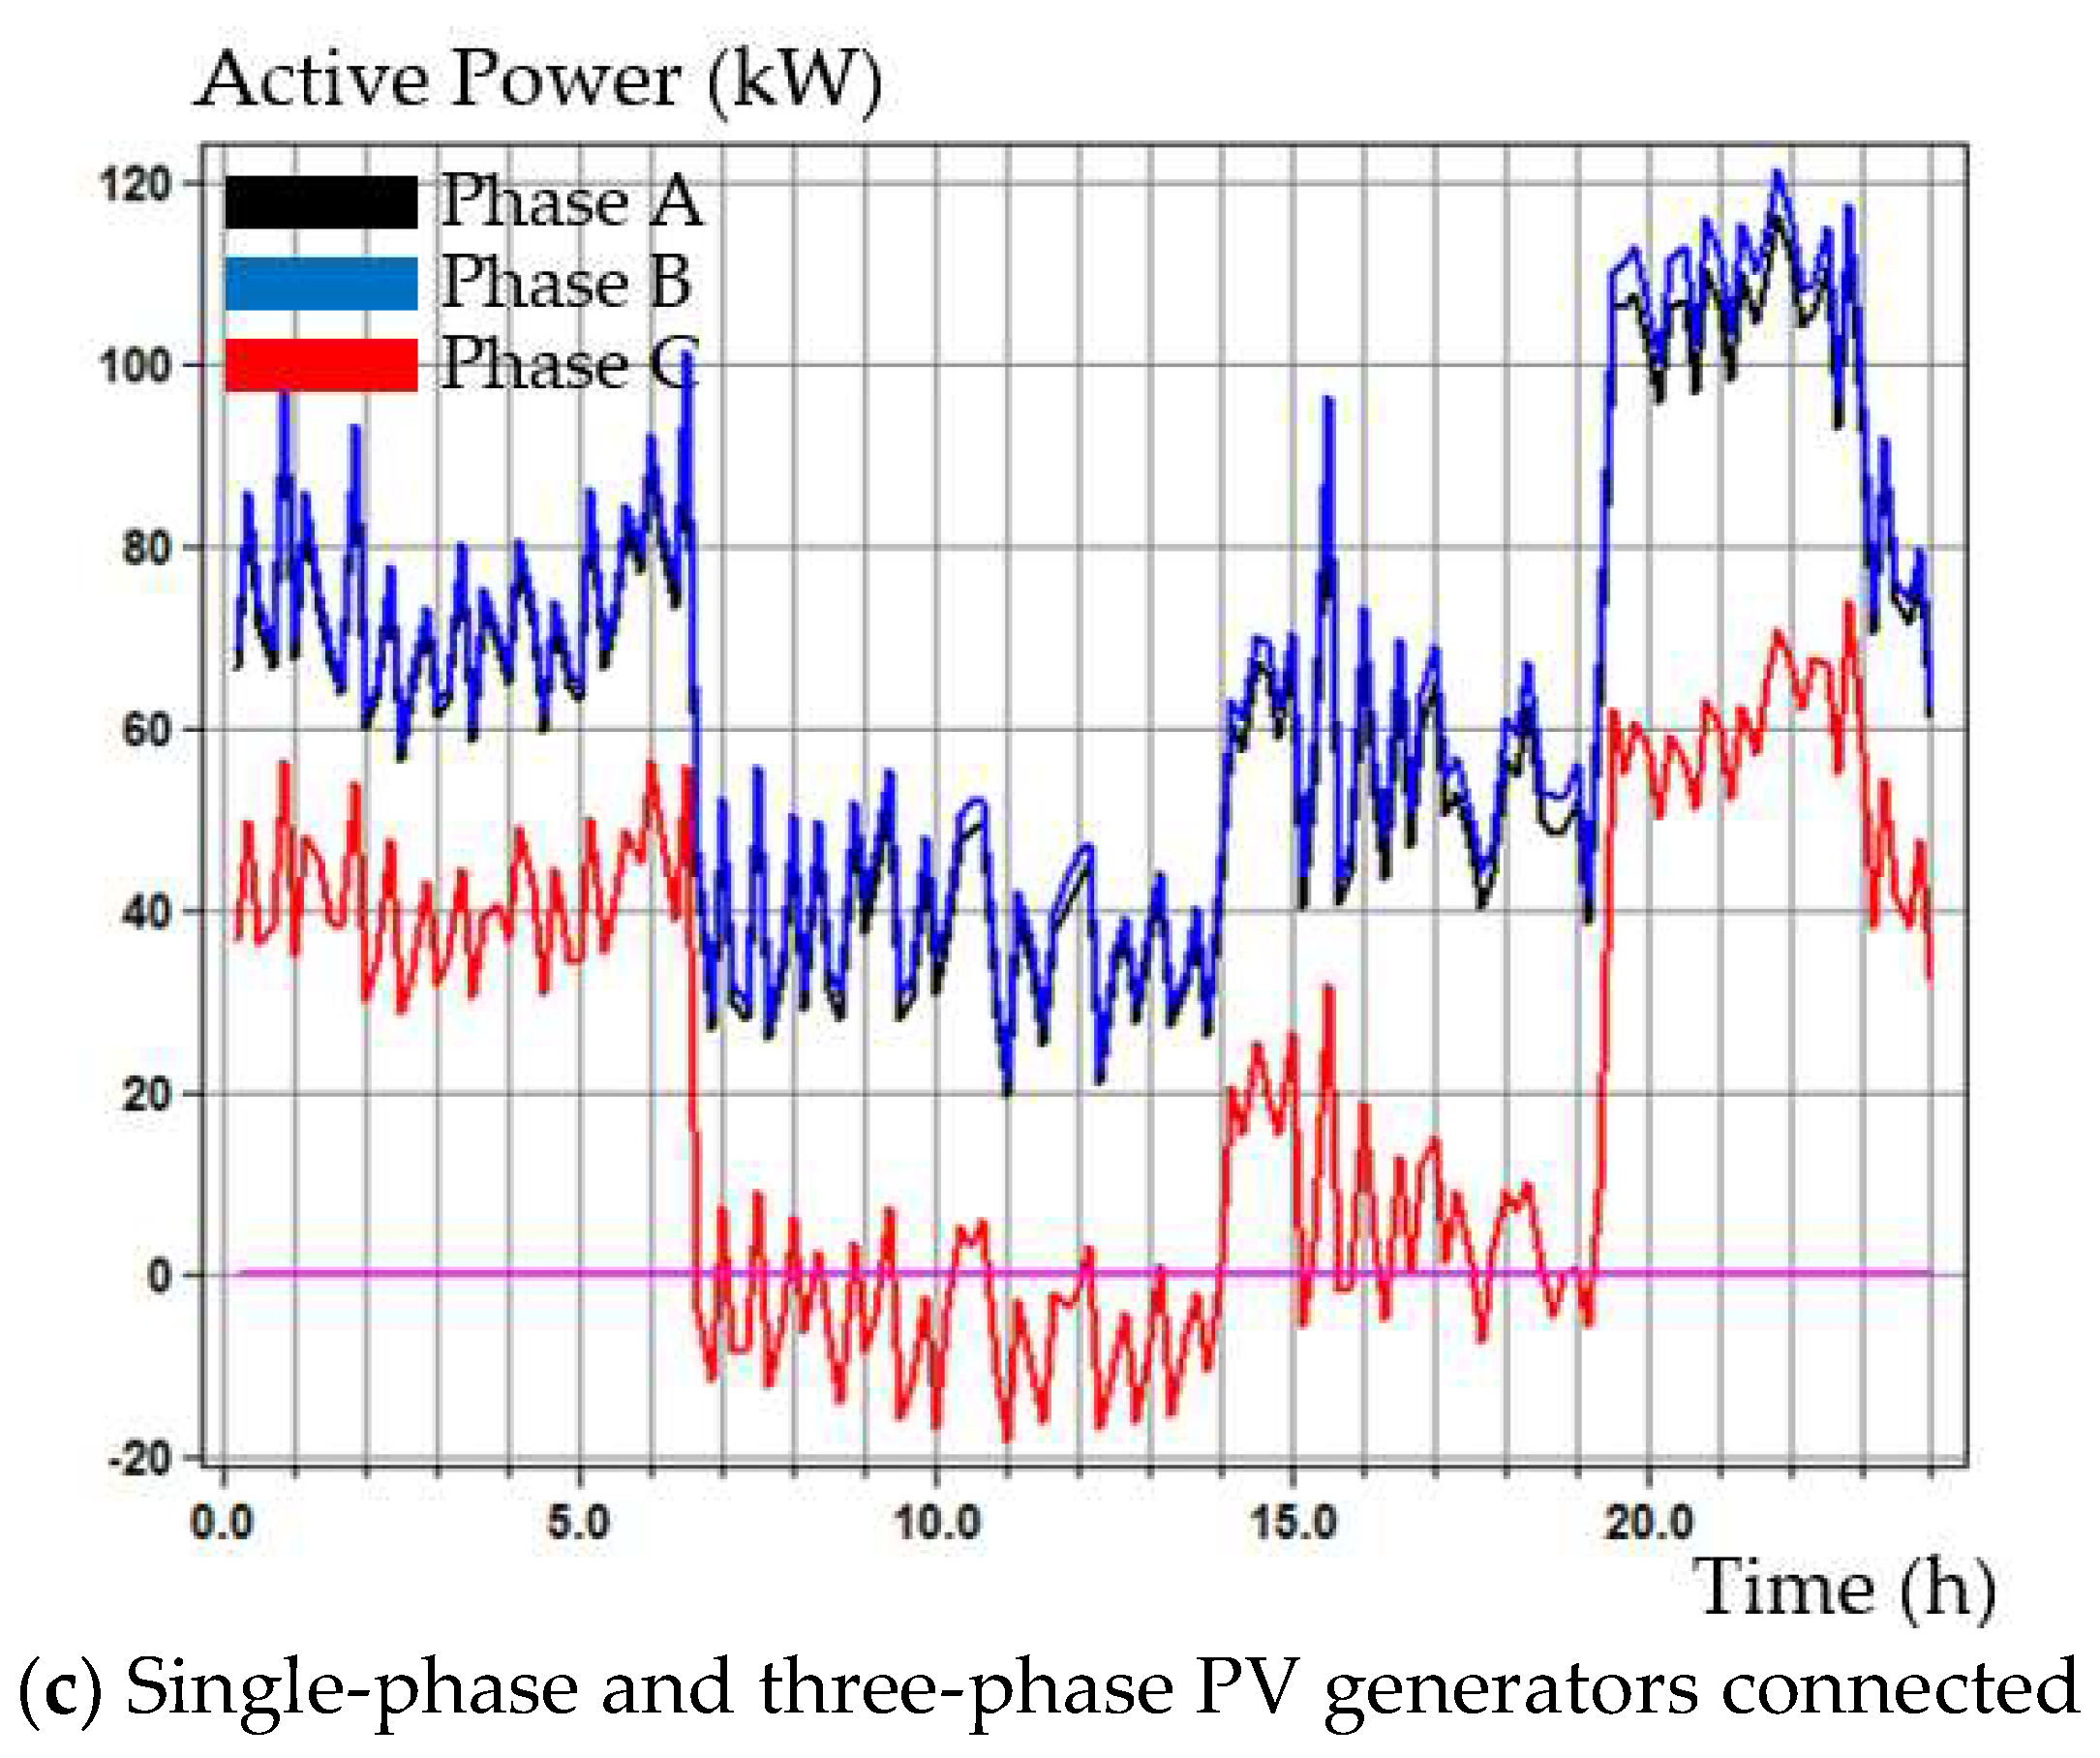
In
Figure 9c, it can be observed through the results of the behavior of the power flow in the feeder when single-phase and three-phase PV generators are connected to it simultaneously. In the period of the contribution of the generators, between 5:00 am to 5:30 pm, it is seen that there was excess power flow in the three phases of the circuit, highlighted in
Figure 9c, with the presence of reverse power flow in phases A (−50 kW), B (−40 kW) and C (−15 kW) approximately. Furthermore, during the grid operation, unbalance between phases was observed between the period of the PV generator’s contributions, and the amplitude of the reverse power flow between phases decreased. System response signals the power contribution from the PV generators in this period.
The significant presence of reverse power flow reflects the excess power in the feeder’s distribution lines, linked to the demand profile with average load, influencing the grid’s electric power quality parameters. The unbalance in the voltage levels, which directly affected the functioning of the voltage regulators installed in the feeder, had to increase during the operation, and the adjustments in the transformer TAP to keep these variations in the voltage profile regularized. Coupled with this unbalance, the presence of short-duration voltage variations was concluded by the numerous attempts of regulators to regularize the voltage levels. When PV generators are included in a distribution network, the taps of voltage regulating devices automatically adjust to accommodate the voltage increase caused by these generators. However, suppose the PV systems are disconnected from the grid. The new tap positions may cause voltage drops, impairing the quality of power supplied to the loads since the voltage regulator actuation is slow, taking tens of seconds to recover the voltage to the desired value.
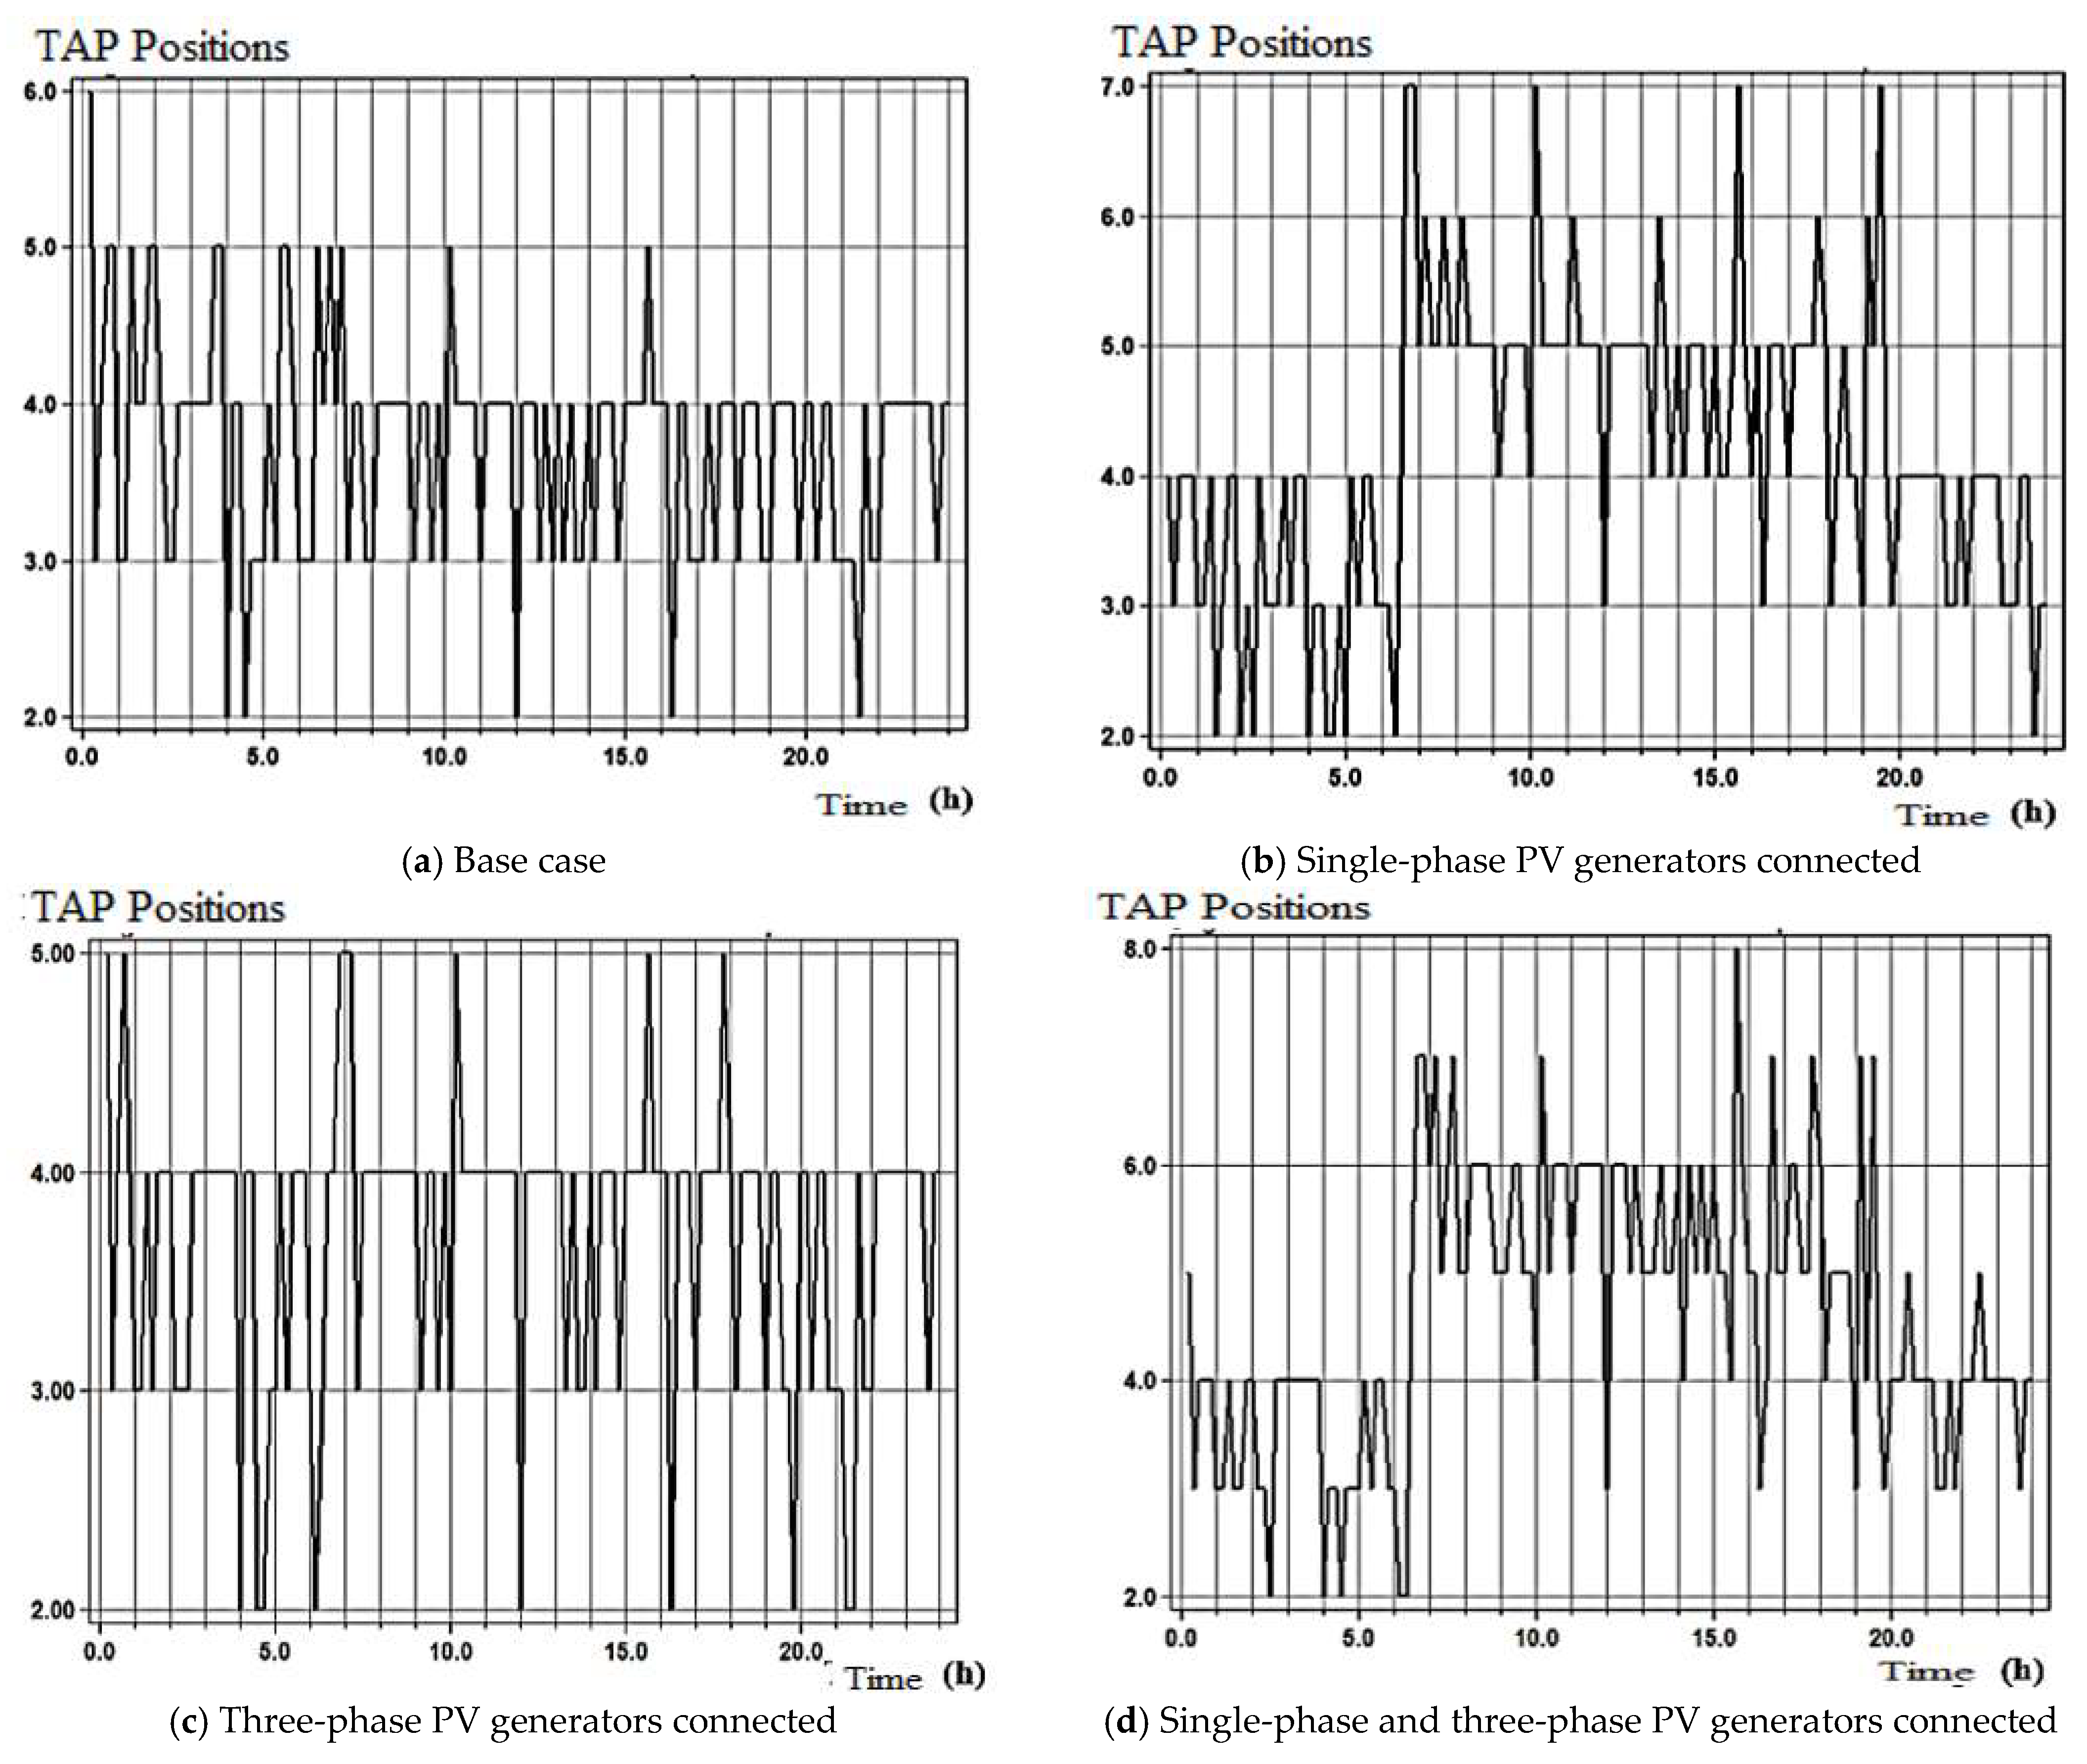
In
Figure 10a–d, the behavior of the voltage regulators can be observed through the transformer TAP’s maneuvers for the base case without the connection of PV generators, only with single-phase generators connected, only three-phase and both simultaneously, respectively. For the base case, the TAP adjustment maneuvers that occurred during the daily period were justified by the natural voltage imbalance present in the feeder and remained at levels with more stable levels without characteristic changes. The greatest requests for adjustments occurred in the period of greatest load demand request to the feeder, observed at night.
When comparing
Figure 10b to the base case, it is seen that the insertion of only single-phase PV generators caused high impacts when related to changes in transformer tap positions, since the tap adjustment maneuvers during the solar contribution period reached levels with high levels of regulation. When connecting three-phase PV distributed generators,
Figure 10c, there were changes in TAPs, however, with less demand for adjustment requests, varying their positions between +3 and +4. Peaks were observed at 7 am, 10 am, and 3 pm, and regression to their positions was verified in the base case, demonstrating that there was a short-term voltage imbalance.
Figure 10d, on the other hand, shows the results when there was a massive connection of single and three-phase PV distributed generators simultaneously, highlighting the high rate of requests to voltage regulators to perform the adjustment maneuvers in the transformer’s TAP in order to regularize the changes in the grid voltage levels. This problem was caused by the excess of circulating power coming from the injection of power by the connected PV generators, contributing to the voltage unbalance in the lines and consequently increasing the number of operations of the voltage regulators.
However, it was possible to conclude that the impact generated by the photovoltaic systems connected to voltage regulation was small. This is due to the high three-phase short-circuit power of the electrical substation, in accordance with the fact that the automatic voltage regulator portrayed in the results of this article is located in the electrical substation identified in
Table 6 as REGFASE_A, REGFASE_B, and REGAFASE_C. Thus, more intense PV generation variations would be necessary to change the tap position of the automatic voltage regulator until inferring a significant change in the patterns of threshold voltage levels.
Therefore, with the objective of portraying the high changes of operations in the positions of the TAPs of the other voltage regulator equipment of this feeder, it was necessary to carry out the simulations not only considering the insertion of distributed PV generators but also for different variations in the demand curve of the feeder. In addition to the scenarios assigned in
Section 4.1, load demand curves were used, varying between low and medium loading, projecting a consumption of 20% and 40%, respectively, for each system evaluation period. In this way, the possibilities of simulations were increased, meeting the objectives of the study, seeking to verify the “stress” in the regulation of the voltage level in the distribution network caused by the massive insertion of PV generators distributed along the feeder.
Table 8 depicts the number of operations performed by each voltage regulator connected to the distribution network in question. Through it, it is possible to verify the different behavior of the voltage regulators in view of the responses of the electrical system through the operations carried out to accommodate the profiles of PV generators connected to the network. In addition to the behavior, it is seen the importance of regulatory equipment for an electrical distribution network.
Based on the results of
Figure 10, it was concluded that the largest number of operations carried out for voltage regulation by the regulating equipment occurred more effectively in the daytime, with the largest insertion of distributed PV generators with great oscillation in the generation. By merging the established scenarios with the variation of the load curves of each prosumer connected to the powered one, it was possible to obtain the results of the voltage regulators contained in
Table 8.
However, it is worth mentioning that during the simulations, operations performed by some voltage regulator equipment were observed that are not related to the increase in the penetration of distributed PV generators to the grid—verified when the load demand curve of the feeder was 20% more than its installed power, being equivalent to the base case in question, during some periods of the day. In turn, the long-term voltage variation cannot be observed through the responses of the voltage regulators in question because it was attenuated by the injection of active power from the connected photovoltaic distributed generators and presents similar numbers of regulation operations.
However, as there was a progressive increase in the connection of distributed generators and the change in the behavior of the demand curve (average), the short-term voltage variation became quite significant. This fact occurred due to the great intermittence contained in the local solar irradiation curve, which provided the superposition of long-term voltage variations, directly contributing to the increase in the number of adjustment operations by the regulatory equipment. It is observed in
Table 8 that mainly there was an increasing rate of installations of distributed generators with different single-phase and three-phase power levels simultaneously to PHASE A.
6. Conclusions
The injection of active power by photovoltaic generators causes an increase in nodal voltages in all phases if it is performed in a balanced way between the phases of the electrical system. These findings can be justified by the facts portrayed in this article, firstly by the special characteristic of this feeder under study, as it is an unbalanced network, with phase A being significantly more loaded than the others. For this reason, voltage regulators connected to Phase A are the most affected by voltage variations on the feeder.
For the case of connecting single-phase generators, it was possible to conclude that the voltages of the three phases of the system are affected, and not only the voltage of the phase in which they are installed. This happens due to the displacement of the neutral position, caused by the variation in the level of unbalance and the existence of mutual coupling between the phases. An aspect of great relevance is that the increase in the distributed generation in one of the phases can provoke the reduction in the voltage in another phase.
Distributed generators influence the actuation of automatic voltage regulators, causing additional device tap changes. The relevant positive point is that the action of the voltage regulator avoided the violation of the steady-state voltage limits as the active power injected by the generators increased. Therefore, in general, voltage regulators can allow an increase in the penetration level of distributed generation without violating the steady-state voltage limits.
The power increase in the photovoltaic generation reduced the voltage unbalance index when the three-phase generators and maximum load were considered. For single-phase generators, the voltage unbalance index increased significantly, reaching values very close to the normative limits. However, when multiple generators distributed on different buses and phases were considered, the increase in the level of unbalance was more modest when compared to the value calculated when the generators were concentrated in a single-phase bus. This shows, once again, the benefit of providing a balance between the phases when connecting the photovoltaic generators. In the period when the PV system provides maximum active power, there is an average load demand on the distribution system. In this way, reverse power flow situations are possible when the degree of penetration of photovoltaic generators is high.


 and
and 


