Abstract
In recent times, wireless power transfer systems have been identified as a reliable option to supply power to medical implants. Up to now, Wireless Power Transfer Systems (WPTS) have only been used to charge batteries of low-power medical implants. However, for medical implants requiring a relatively higher power, such as a ventricular assist device, which is an implanted blood pump in the patient’s abdominal cavity, an external power supply has been used. When WPTS is used for medical implants, it increases the number of required power converter stages and hardware complexity along with the volume, which tends to reduce the overall efficiency. In addition, the existence of uncertainties in WPTS-based medical implants, such as load and mutual inductance variations, can lead to system instability or poor performance. The focus of this paper is to design a WPTS to supply power to the pump motor directly through its inverter based on the requirements of the motor drive system (MDS) without resorting to an additional DC-to-DC converter stage. To this end, the constraints that the drive system imposes upon WPTS have been identified. In addition, to make a reliable closed-loop operation, a µ-synthesis robust controller is designed to make sure the system maintains its stability and performance with respect to the system’s existing uncertainties. A number of experimental results are provided to verify the effectiveness of the adopted WPTS design approach and the corresponding closed-loop controller for WPTS. Furthermore, the experimental findings for the maximum efficiency tracking (MET) approach (to minimize WPTS coil losses) and constant DC link voltage control approach are shown and compared. According to experimental results and system efficiency analysis, the former appears to perform better. The system dynamic performance analysis, on the other hand, demonstrates the latter’s advantage.
1. Introduction
The number of patients with serious heart failure has been steadily increasing, especially since the recent pandemic. When a patient’s condition has progressed to the point that no other treatment option is available, a heart transplant is considered to be the best option. However, there are a limited number of suitable heart donors. Due to the scarcity of donors, therapies based on Ventricular Assist Device Systems (VADS) have become the standard stop-gap treatment option for patients with severe heart failure [1,2]. In general, VADS can be defined as a motor (heart pump) that is developed to help the heart to compensate for the lack of blood circulation in the body. This therapy could be utilized as a temporary bridge to heart transplantation or as a permanent substitute for heart transplantation if necessary.
The power consumption of conventional VADSs varies between 4 and 12 W [3,4], while for the most recent generations of VADS, this value has reduced to between 2.5 and 5 W [5,6]. Due to the continuous operation of the motor with this relatively high power consumption, a power supply external to the patient’s body is required. Accordingly, a percutaneous driveline has been used to connect the implanted VADS to the external power source. The potential of serious infections associated with the percutaneous driveline is a major issue with the current VADS. Wireless Power Transfer Systems (WPTS) are proposed as a potential solution to eliminate the through-skin driveline [7,8,9].
A typical WPTS consists of an inverter, a rectifier, and a resonant circuit with energy transmission coils and a compensation circuit. The WPTS coils can be represented as a transformer with low magnetizing inductance and high leakage inductance. Compensation networks must be incorporated into the system to cancel the effect of leakage inductances. Various compensation methods have been covered extensively in the past literature, for example, low order compensation circuits such as Series/Series (SS), Series/Parallel (SP), Parallel/Series (PS), Parallel/Parallel (PP) [10,11] and higher order compensation circuits such as LCC, LCL and S/SP compensation topologies, to name a few [12,13,14]. The desirable features of a compensation technique include high efficiency, reliability, load-independent output voltage or current, and mutual independence of output current or voltage [15]. However, each circuit may only offer one or two of these desirable characteristics. Amongst all such circuits, SS compensation has been widely used for medical applications due to its simplicity and desirable features such as load and mutual inductance independent resonance frequency tuning [7,16].
For SS compensation, the load and the mutual inductance, which can be modeled as sources of uncertainty, may vary independently in an arbitrary manner within a particular range. This variation can significantly affect output capability, efficiency, and dynamics. In this regard, closed-loop systems based on linear controllers such as the Proportional and Integral (PI) controller have been widely applied to regulate the output voltage or output current to the desired value. However, as shown in [17,18], conventional linear controllers may not be the best option for a system with variable dynamics and uncertainties. For a motor drive system (MDS) supplied with a WPTS, two main uncertainty sources are the load (the equivalent load value of MDS which can be seen from WPTS perspective) and the mutual inductance of the WPTS. These parameters can vary independently and each of them could highly impact the dynamics of the WPTS. Usually, WPTS controllers are designed for their nominal conditions. Such a design is prone to instability or poor performance when the system operates at a different operating point within the uncertainty range.
Robust controllers are developed to guarantee the Robust Stability (RS) and the Robust Performance (RP) of the system with one or more sources of uncertainty. The former means the closed-loop system remains stable within the range of uncertainties and the latter means the closed-loop system maintains its performance with respect to the system uncertainties. To date, a number of robust controller design methods have been developed. The singular value optimization problem is one of the most powerful tools to design a robust controller which is known as a µ-synthesis robust controller. A controller based on µ-synthesis is designed in [19] for SP compensated WPTS with mutual inductance variation, and, for the same network, a robust controller is designed to deal with load variations [20]. In some references, robust controller design for other types of compensation networks with one or more uncertainty sources have been investigated [21,22]. A common objective for all robust controller design approaches for WPTS is designing a closed-loop system that can offer RS and RP for a system with parameter uncertainties.
The closed-loop system can be used not only to precisely regulate the output voltage or current, but also to maximize the efficiency of the WPTS coils. The Maximum Efficiency Tracking (MET) method helps to minimize the generated reactive power by tracking the optimum load value seen from the WPTS rectifier perspective. As shown in [23] for an SS compensation network, MET can help to reduce the corresponding losses of WPTS coils and minimize the generated corresponding heat. In addition, the power losses of the primary and the secondary coils are equally distributed leading to uniform heat dissipation. In [23], the authors have designed a battery charger for a VADS with the help of a PI controller to perform MET with an extra DC-to-DC converter to regulate the desired output voltage. However, for lower power ratings, the DC-to-DC converter appears to be the main source of power losses.
To the best of the authors’ knowledge, a motor drive system (MDS) as a direct load for the WPTS has never been explored comprehensively in literature. Mostly, the WPTSs are optimized for a specific output power, and the voltage/current regulation of the load (mostly battery or resistor) is handled with an additional DC-to-DC converter. Direct connection of a MDS to a WPTS imposes extra constraints upon the system, such as maintaining the voltage in a range that is suitable for the MDS. Once the voltage constraints of MDS are identified, it is possible to perform the MET using the WPTS and the inverter of MDS alone without resorting to an external DC-to-DC converter stage. In this work, firstly, the required constraints for the proper operation of MDS are explored. Then a WPTS design recommendation is proposed based on the constraints of the MDS and the requirements for the MET method. Next, a µ-synthesis robust controller is designed to perform MET and regulate the DC link voltage of the MDS. Finally, the dynamic behavior of the closed-loop system and the system efficiency analysis at steady-state with the MET method and conventional constant DC link voltage method are experimentally explored.
2. Heart Pump Operation and Motor Drive
The general configuration of the WPTS as a power supply for the MDS is shown in Figure 1. In this setup, the MDS is directly connected to the output of the WPTS rectifier. Constant speed control of the motor is the most common clinically approved method for a VADS [24]. On the other hand, as discussed in [25], the load pressure on the output of the heart pump is significantly varied in each cardiac cycle leading to significant shaft torque variations. As a result, the motor power consumption varies greatly with the constant speed control of the motor and the fluctuating torque on the shaft. In order to simplify system modeling, it is assumed that the DC-link capacitor is sufficiently large to slow the DC bus dynamics such that the MDS can achieve near perfect DC-bus disturbance rejection. In addition, it is assumed that the MDS has a perfect disturbance rejection. Accordingly, the motor and the drive system (the electrical load after DC-link capacitor) from the WPT perspective can be modeled as an equivalent variable resistor (RL,eq) [26,27], as shown in Figure 2.
where VDC is the DC-link voltage and Po is the consumed power by the motor and the drive system.
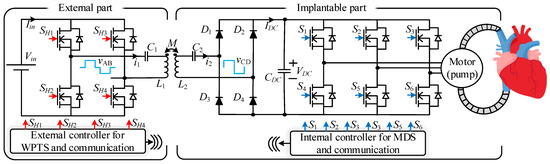
Figure 1.
General Schematic of MDS supplied by WPTS for a VADS.

Figure 2.
Equivalent load seen from the DC-link.
Voltage Limitation of Field Oriented Control (FOC)
In order to design a WPTS to supply a motor, it is crucial to design a system in a way that it could fulfil the voltage requirement of the drive system at the required speed and power. As a result, the variation of the motor drive characteristic from the WPTS perspective must be studied first. The governing equations of PMSMs are well-explained in literature [28,29]. A brief review of the required equations for non-salient PMSM (Ld = Lq = Ls) is provided here for the sake of completeness. Stator voltage equations in the dq coordinate system can be written as
where Rs and Ls are the rotor resistance and rotor inductance and Ld and Lq are d-axis and q-axis inductances, respectively. In addition, λaf and ωe are magnet mutual flux linkage and angular electrical velocity of the motor, respectively. The generated torque (Te) can be calculated as:
where, P is the number of poles. From (3), it is evident that the generated torque only depends on iq. The relation between the stator current/voltage magnitude and the current/voltage magnitude in d–q frame can be written as:
In steady-state conditions and by ignoring the resistive voltage drop of the motor windings, (2) can be rewritten as:
With respect to (2), (4) and (5), one can find the relationship between ωe, id, iq, and stator phase voltage (vs) as
Equations (4) and (6) show the limitations of the stator current, the stator voltage and the achievable speed. It must be noted that vs limitation is due to VDC value. With the assumption of employing Space Vector Modulation (SVM) for the MDS, the relation between maximum required stator voltage (vs,max) and minimum required VDC can be written as
These constraints are shown in Figure 3. It must be noted that (6) describes the limitations of stator current imposed by flux linkage. Consequently, it is represented by a circle with the origin at (0, λaf/Ld) and the radius of vs/ωeLd. In order to minimize ohmic losses in the machine, the demanded torque from the load must be satisfied with the minimum stator current amplitude. This goal can be achieved with the help of the Maximum Torque Per Ampere (MTPA) strategy [29] (in some references it is known as zero-direct-axis-current control [28]), as shown in Figure 3.

Figure 3.
PMSM drive constraints.
Accordingly, Equation (3) can be rewritten as:
As it is shown in the next section, for a WPTS with a particular set of parameters, there is an optimum load value RL,opt that can maximize the WPTS efficiency. From (1), since Po varies significantly, VDC must be regulated in a way that RL,opt is always maintained. Accordingly, the lower limit of VDC to maintain MTPA control strategy (VDC,min), based on the required speed and maximum torque for steady-state conditions, can be found as follows:
Below this voltage, with respect to the required speed and torque demand, MTPA control cannot be achieved. Thus, it must be considered before the design of the WPTS.
3. SS Compensated WPTS Design
3.1. Series-Series Compensation
The SS compensation network, as shown in Figure 4, is the most typical compensation topology used in implanted medical devices. Mostly, the SS compensation network is tuned to operate in the load-independent constant output current (COC) mode.

Figure 4.
WPTS with the equivalent load.
To achieve COC operating mode, the self-inductance of the primary and the secondary coils must be compensated as:
where L1, L2, C1 and C2 are the primary inductance, secondary inductance, primary compensation capacitor, and secondary compensation capacitor, respectively. In addition, ωo is the resonance frequency of the compensation network. The corresponding voltage gain equation of COC mode, with respect to Figure 5a, can be found as
where M is the mutual inductance between L1 and L2 and:
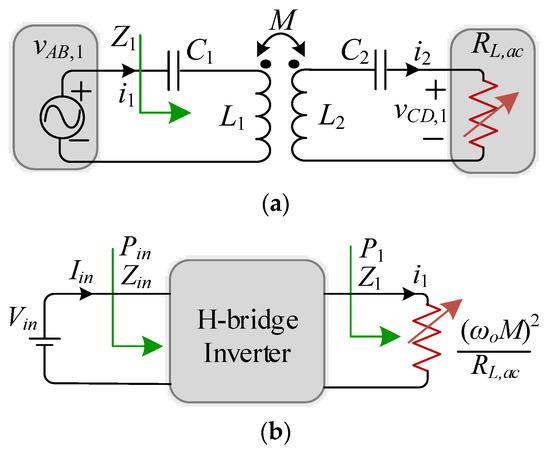
Figure 5.
(a) WPTS model with the fundamental approximation (b) Load seen from the inverter output terminals.
With respect to Figure 4 and Figure 5a, one can see that RL,ac is the equivalent transferred RL,eq from the DC side to the AC side of the rectifier. In addition, D is the duty cycle of the phase-shift modulation. Since the system operates at the resonance frequency, in (11) and (12), it is assumed that all voltage harmonics except the fundamental component (vAB,1 and vCD,1) are suppressed and all the waveforms are assumed to be purely sinusoidal. In addition, the magnitude of vAB,1, using phase-shift modulation for the H-bridge converter, can be controlled by changing Vin and D. To simplify the rest of the equations in this paper, it is assumed that L1 = L2 (and consequently C1 = C2).
3.2. WPTS Maximum Efficiency Tracking
The WPTS resonant tank efficiency can be maximized or, equivalently, the total generated reactive power in the primary and secondary compensation capacitors can be minimized, as explored in detail in [23], if the load with a specific value is acquired:
where RL,ac,opt is the optimal load value that maximizes efficiency and the coupling coefficient (K) can be found as:
The condition (13) is valid for the coils with a high-quality factor (Q > 100). Satisfying (13) leads to minimum RMS current value of primary and secondary coils. For applications where the power losses of coils, and the corresponding generated heat, are important, as in the case of medical implants where generated heat can damage the surrounding tissue of the coils, the maximum efficiency tracking is very desirable. Equation (13) indicates that the WPTS can operate with the maximum efficiency at any K and Po if RL,ac equals to RL,ac,opt. Consequently, to set RL,ac,opt constant for different operating conditions, VDC must be set as
The symbol “*” shows the required VDC for maximum efficiency tracking. From (15) it is apparent that setpoint depends on Po and K. The value of Po is determined by the load demand which can be measured. On the other hand, K is variable in practice, and its value must be approximated based on the known parameters. Since the WPTS operates at the resonance frequency, the reflected impedance to the primary side (Z1), as shown in Figure 5, is purely resistive and is given by [30]:
By using (14) and (17), K can be estimated based on Vin and Iin as
In (18), RL,ac can be found by measuring the current and the voltage of the DC-link to calculate the estimated power consumption of the motor. It must be noted that coils relative displacement happens slowly compared with the motor power variation and, consequently from (18), it is possible to use the motor power consumption along with the knowledge of Vin and D to estimate K variations.
3.3. Wireless Power Transfer Network Design
In this work, the WPTS is used to supply the PMSM and the drive system. The MDS lower DC link voltage limit (VDC,min) is determined by (9). In addition, the upper limit of the DC link voltage VDC,max is governed by the upper voltage limit of the drive system power devices and the motor drive controller. One important point that should be emphasized is the role of the motor drive inverter in adjustment of RL,ac,opt. The motor drive system can provide the required vs by adjusting the inverter modulation index (m) for the SVM as:
With the assumption of the lossless operation of the MDS, the motor power equals to Po. Since the motor drive can adjust the relation of vs and VDC, with respect to (1) and (19), it is possible to set VDC in a way that the motor and the drive system model become equivalent to RL,ac,opt from the WPTS perspective.
In this regard, the SS compensated WPTS must be capable of providing the required VDC within the required range (VDC,min ≤ VDC ≤ VDC,max). Consequently, the following WPTS design procedure is suggested and the system is designed based on Table 1.

Table 1.
System parameters.
Step 1. Find the maximum equivalent resistance (RL,eq,max) seen from the WPTS rectifier perspective. This value can be found from the estimated Po and the corresponding VDC,min. One can use (4), (8), and the well-known relation between motor torque, mechanical speed ωm, and Po to find RL,eq,max.
Figure 6 shows the relation between the required VDC,min at any Po and motor speed. In addition, the point where RL,eq,max can be found from the designated point within a circle in Figure 6.

Figure 6.
Voltage requirements for MET and constant DC-link voltage control with respect to power demand and speed. Parameters are selected based on values in Table 1.
Step 2. Select the design load value (RL,ac,d) as
where RL,DC,d is the equivalent value of RL,ac,d transferred to the DC side of the rectifier. It must be noted that for the final designed system, RL,DC,d implicitly shows the relation between and Po. If RL,DC,d is selected to be very large, the motor drive modulation index reduces significantly and, consequently, it leads to poor performance of the motor drive system. In practice, we recommend selecting RL,DC,d two or three times more than RL,eq,max to provide extra headroom for the motor controller modulation index to avoid saturation at transitions or sudden load changes. It must be noted that by selecting RL,DC,d as the load value, WPTS must be able to regulate VDC within the following range:
where Po,min and Po,max are the minimum and maximum required power from the motor and MDS. The modified required DC link voltage (VDC,mod) to maintain MET can be found as:
Step 3. Approximate K range variations [Kmin, Kmax] and select Kmax to determine the inductor value from:
It must be noted that, at this stage, several iterations might be needed since K variation range is not exactly known before the design of the inductor. Moreover, the selection of K as Kmax in (24) helps to decrease the required Vin level.
Step 4. From (11), (12), and (24), one can determine the minimum possible Vin (Vin,min) to provide the required voltage (at different output voltage values and K) as:
where the phase-shift duty cycle is assumed to be maximum (D = 1). It is recommended to set Vin, 20–25% more than Vin,min to ensure the duty cycle does not reach to the saturation level (i.e., D > 1) at transitions. This practical design procedure is summarized in Figure 7.

Figure 7.
Adopted WPTS design procedure for MDS.
4. Robust Controller
4.1. System Model and System Uncertainties
As previously stated, WPTSs are prone to system parameter variations such as K and RLoad variations. Accordingly, the system dynamics can be affected significantly. To investigate the system dynamics, firstly, the state-space equations and the small-signal model of the system must be formulated. The derivation of the state-space equations and the small-signal model of the SS compensated WPTS, as it is shown in Figure 4, based on Extended Describing Functions (EDFs), is given in [31].
That model is used in this work for the controller design. The state-space equations and the small-signal equations are given as:
where Xss, Ass, and Bss form the steady-state equations and , , A, B, C, and D form the small-signal model. Interested readers are referred to [31] to find the corresponding coefficients of (26) (Ass, Bss, A, B, C, and D).
Mostly, WPTS plants are investigated under nominal K and RL,eq values and, accordingly, the corresponding system transfer function can be found. However, in practice, one or several parameters of the system vary in a particular range.
For example, K and RL,eq might vary with respect to the position of coils and the equivalent load demand, respectively. Thus, the system transfer function is not unique anymore, and it is changed accordingly. There are several methods to model the plant of such a system. One of the most common methods is the multiplicative lumped uncertainty representation, which describes the system plant with uncertainties as
where the nominal transfer function, Gnom(s), is the system transfer function with nominal parameters. In addition, ΔI(s) is any stable norm bounded transfer function with magnitude less than one which represents all the system uncertainties as a lumped block and can be represented mathematically as
where operator gives the infinite norm of the signal [32]. In addition, wI(s) represents the available information about the weight of uncertainty distribution at each frequency. The multiplicative representation of the plant is shown in Figure 8.

Figure 8.
Description of a system with multiplicative uncertainty representation.
From Table 1, Knom is chosen to be 0.45. However, in practice, it is assumed that the coupling coefficient may change from 0.4 to 0.5 for medical implants. Another important point is that for the maximum efficiency tracking of the WPTS, the value of RL,eq should remain constant (=RL,DC,d) to get to the maximum efficiency of the WPTS, as discussed in the WPT design section. However, this assumption is correct only for steady-state conditions. For transitions, when the torque in the motor changes, RL,eq may deviate from the desired setpoint and this variation depends on the motor dynamics and the motor drive controller performance. Consequently, RL,eq can be assumed as a source of uncertainty in the system during transitions. Therefore, to make sure RL,eq variation at transitions are included in the parameter uncertainties, it is assumed that RL,eq, might deviate up to 50% from RL,DC,d within the following range:
It must be noted that the assumption of ±50% RL,eq variation (as it is found in practice) provides a reliable margin to make sure all load dynamic variations are taken into consideration for the controller design process. To investigate the effect of parameter variation, it is possible to define the relative error (eR) as
which shows the relative frequency response deviation of the systems with uncertainty from the frequency response of the system with nominal parameters. The eR variations for several plants for a range of parameter variations that are randomly selected are shown in Figure 9.

Figure 9.
Relative error and wI.
K and RL,eq variations lead to the considerable frequency response deviation from the nominal plant. To be able to describe a system with a single transfer function G(s) as it is shown in (27), wI must be calculated. By using (30) and considering (27) and (28), one can select wI as:
Thus, it can be concluded that wI must be selected in a way to cover the eR region. In addition, to simplify the uncertainty representation and avoid the unnecessary expansion of the uncertainty region, it is preferable to use a low-order high-pass transfer function. As such, in Figure 9, wI is selected as a first-order high-pass transfer function which fully covers the eR region.
4.2. Controller Design
Robust controller methods are developed to deal with system uncertainties similar to those that are presented in the WPTS in hand. The principles underpinning robust controller design are well-investigated in [32,33], and only an overview is provided here. Robust controllers can offer RS and RP for a range of parameter variations. It is worth mentioning that RS means the closed-loop system stability is guaranteed under the whole range of parameter variations, and RP means the system performance is guaranteed for all possible plants in the range of parameter variations. To find such a controller, one can assume Figure 10 as the general configuration of the closed-loop WPTS. The system plant is shown with the multiplicative representation, and the robust controller is shown with Cµ. In addition, wP and wU are two weighting functions that determine the closed-loop system performance and the controller effort performance, respectively [32], which are discussed in the following section. To formulate the robust controller design problem, Figure 8 can be rearranged to the well-known M-Δ configuration or P–Δ–Cµ configuration, as shown in Figure 10. For the former, Δ (which is equivalent to ΔI in Figure 8 and contains the system uncertainties) can be pulled out from the rest of the system, and, for the latter, Δ and Cµ are pulled out from the rest of the system. It is worth mentioning that P consists of wI, wp, wU, and Gnom, and M contains P and Cµ. With respect to Figure 10, one can express the robust controller design problem as finding Cµ that can guarantee RS and RP for the nominal system and the system in the presence of Δ.

Figure 10.
M–Δ and P–Δ–Cµ configuration.
One of the most powerful tools to find Cµ is the structured singular value µ which is expressed mathematically as:
where (.) is the maximum singular value and M is the transfer function from the output (uΔ) to the input (yΔ) of Δ. As it is proved in [32,34], a controller that can provide RS and RP conditions must satisfy the following criterion:
In (33), M(P, Cµ) is a lower linear fractional transformation and explicitly emphasizes that M is formed by P and Cµ. Alternatively, to define the robust controller design as an optimization problem, (33) can be expressed as:
This optimization problem determines Cµ that can minimize the peak value of µ of the closed-loop transfer function, M. The designed controller based on this approach is called a µ-synthesis robust controller, and the index of Cµ emphasizes the acquired approach for the controller design. One of the methods to solve (34) is the DK-iteration algorithm, which is used in this work to design the required controller for the WPTS. This algorithm is based on a numerical solution method, and it is readily available in MATLAB software. It is important to note that the DK-iteration algorithm does not lead to a globally optimized solution. Thus, several iterations should be performed to obtain the desirable controller performance. Further explanations about this algorithm is outside of the scope of this paper, and interested readers are referred to [32,33] for further information.
4.3. Selection of Weighting Factors
As mentioned before, wP and wU are weighting factors associated with the performance specifications and the controller effort specifications of the system which must be determined along with wI. In the process of designing a µ-synthesis robust controller, both weighting factors are absorbed into P block in Figure 10 (and consequently M). Thus, it is essential to define them. References [32,34,35] provide a guideline for the selection of these weighting factors. For the case of wP, it is recommended to select it as a low pass filter.
Here ωB, α and β are related to the required bandwidth, overshoot of the time response (mostly selected between 1.5 and 2), and the maximum permissible steady-state error of the system. Ideally, the steady-state error should be zero, however, in practice, it is selected as a small value to make the process of controller optimization easier for the DK-iteration algorithm. The reason for selecting wP as a low pass filter can be explained with respect to the outcomes of (33). By satisfying (33), as it is proved in [32], the following equations hold true:
where the sensitivity function S, with respect to Figure 8, is the closed-loop transfer function from r to e, or from d to e, and it is defined as:
The closed-loop system exhibits good reference tracking and disturbance rejection characteristics if S ≈ 0. On the other hand, the system shows a good noise rejection ability if S ≈ I. It might seem there is a conflict between good reference tracking and good noise rejection criteria. However, it must be noted that the noise is prominent in higher frequency ranges compared to the reference tracking requirement, which is handled in low frequency ranges. This feature requires shaping of S as a transfer function with low gain at low frequencies and high gain at high frequencies. Consequently, by selecting wP as a low pass filter shaped function, with respect to (35), the controller is designed in a way to provide the desired S shape as .
The other weighting function, wU, affects the controller effort. Mostly, as the first choice, it is preferable to select wU as a constant value. However, if the controller effort shows a significant overshoot or rapid changes, it is possible to smooth it by selecting wU as a differentiator [34]. The selected weighting factors with respect to the parameters in Table 1 are given in Table 2.
Table 2.
µ-Synthesis Controller Parameters.
5. Experimental Results
In order to show the efficacy of the proposed WPTS design method and verify the effectiveness of µ-synthesis controller to perform maximum efficiency tracking, the experimental system is established with the design parameters of Table 1. Based on the rate of load change in a VADS and the DC- link capacitor value of the MDS, the settling time of 100 ms and 10% overshoot in step response are chosen as the closed-loop step response of WPTS. Accordingly, Cµ is designed with the weighting factors provided in Table 2 and the step responses of the closed-loop system for a number of plants with random parameters that lie within uncertainty ranges of WPTS are shown in Figure 11.
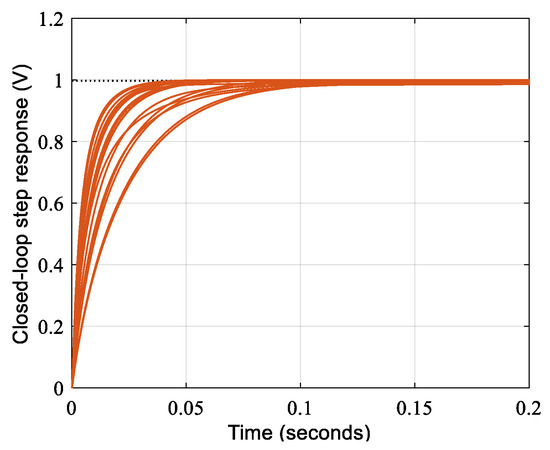
Figure 11.
Step response of the closed loop system for a random selection of plant parameters.
In addition, the schematic and the picture of the experimental setup are shown in Figure 12 and Figure 13, respectively. To investigate the performance of the proposed system, it is evaluated at the maximum coupling coefficient (Kmax = 0.5) and the minimum coupling coefficient (Kmin = 0.4) values, and for each K value, the motor power demand with a step change varies from minimum to maximum values (2.5 W to 5 W). It must be noted that Kmax and Kmin are selected based on discussion with our medical team and simulation of body tissue in ANSYS MAXWELL software for a 10–15 mm coil distance. However, the methodology presented is applicable for other coupling factor ranges. The motor drive controller and Cµ are implemented on CPU 1 and CPU 2 of the F28379D TI microcontroller, respectively, and they share data via inter-processor communication (IPC).

Figure 12.
Control block diagram of the system, including the motor driver and WPT system.

Figure 13.
Experimental setup.
For example, VDC and IDC are measured with CPU 1 and their values are transferred to CPU 2 for calculations. It is worth mentioning that 20 kHz discretization is used for Cµ and it is digitally implemented with the approach proposed in [21]. In addition, L1 and L2 are composed of 23 turn litz wire (330 strands and 46 AWG) to decrease skin effect. The inner diameter of 35 mm and outer diameter of 87 mm are chosen for coils that are deemed suitable for VADS applications [23]. The corresponding resistance values are measured with a network analyzer (R&S ZVL13) at 1 MHz and give 891 mΩ and 853 mΩ, respectively.
In order to investigate the proposed controller design and the WPTS design, various steady-state and dynamic analyses are performed for both the maximum efficiency tracking and constant voltage control of the DC-link. For the latter, VDC is kept constant at 24 V. The steady-state waveforms of the maximum efficiency tracking corresponding to Kmin and Kmax are shown in Figure 14a,b and Figure 15a,b.
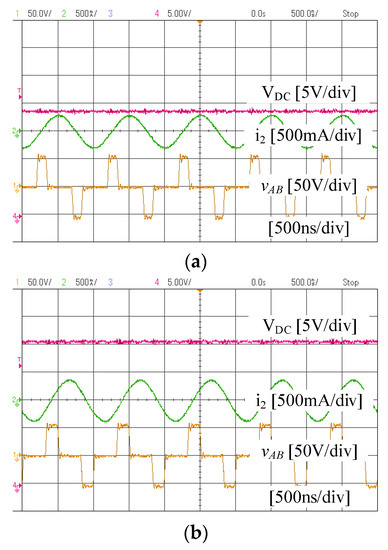

Figure 14.
MET strategy for K = 0.4 (a) steady-state waveforms of the WPTS at Po = 2.5 W (b) steady-state waveforms of the WPTS at Po = 5 W (c) transient waveform of the system at Po step change from 2.5 W to 5 W.

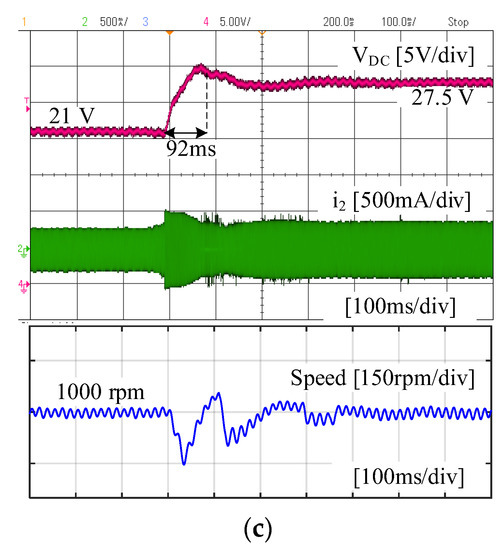
Figure 15.
MET strategy for K = 0.5 (a) steady-state waveforms of the WPTS at Po = 2.5 W (b) steady-state waveforms of the WPTS at Po = 5 W (c) transient waveform of the system at Po step change from 2.5 W to 5 W.
As can be seen, the output voltage has been controlled with the help of H-bridge duty-cycle adjustment (phase-shift modulation) at 1 MHz switching frequency. In addition, the output voltage is successfully adjusted with respect to Po and K. Since the calculation of depends on K, and K calculation depends on the output power, it is recommended to take the average over a few samples of K to find its value. The average operation does not pose any considerable restriction over the controller since K variations are mostly due to mechanical movement, and its time constant is much larger than the electrical time constant of the system.
The waveforms of VDC and i2 to evaluate the dynamic performance of Cµ for a sudden step change of the motor load for maximum efficiency tracking and constant DC-link voltage control are shown in Figure 14c, Figure 15c, Figure 16 and Figure 17. Since a conventional sensorless FOC algorithm is used for the drive system, only the speed of the motor as an indicator of motor dynamics is presented here. When applying the maximum load over the motor, the speed of the motor drops; however, the power demand from the motor increases leading to an increase in . For both maximum efficiency tracking and constant DC-link voltage control, Cµ successfully regulates the output voltage within the defined settling time. However, the settling time of constant output voltage control shows better performance (50 ms for K = 0.5) compared with the maximum efficiency tracking strategy (98 ms for K = 0.5).

Figure 16.
Transient waveform of the system at K = 0.4, Po step change from 2.5 W to 5 W for constant DC-link voltage strategy.

Figure 17.
Transient waveform of the system at K = 0.5, Po step change from 2.5 W to 5 W for constant DC-link voltage strategy.
The main reason for this difference is the effect of the motor dynamic as a load on the DC-link. By changing VDC, the motor controller requires more time to return the speed to the reference value. One of the potential solutions to improve the response time of the motor controller is to use the speed drives based on variable DC-link [36]. However, these methods are beyond the scope of this paper, and they are not discussed. It is worth mentioning that the motor driver remains unchanged for all cases. The power loss analysis of the system is provided in Figure 18. The equations given in [1] for coil and rectifier power losses and the equations given in [37] for H-bridge power losses are used here. The total power loss of the rectifier stage PLoss,rec can be calculated as:
where RDR,0 is the differential resistance value of the diode and VDR,0 is the voltage drop across the diode. The power losses of the primary coil (PL1) and secondary coil (PL2) of the WPTS are obtained from:

Figure 18.
Efficiency analysis of the WPTS with MET and constant voltage strategies under the conditions of (a) K = 0.4 and Po = 2.5 W (b) K = 0.5 and Po = 2.5 W (c) K = 0.4 and Po = 5 W (d) K = 0.5 and Po = 5 W.
The total power loss of GaN based H-bridge inverter (PLoss,HB) can be calculated as:
where RDS is the GaN on-resistance and TTR is the switch transition time from on mode to off mode and vice versa.
As it can be seen from (38)–(40), the global optimization of the total power loss is a complicated problem since it depends on many factors, and, for the application under-study, the system dynamic varies significantly. On the other hand, due to the location of coils and the sensitivity of body tissue to the generated heat from them, it is desirable to use a maximum efficiency tracking algorithm.
The analysis of the power loss distribution in Figure 18 shows that, for all scenarios, the majority of power losses occur in the motor and drive system. The total power loss of the MDS depends on many factors, such as the switching frequency of the drive system, type of modulation, DC link voltage, type of the motor, etc. Thus, further investigation on the effect of maximum efficiency tracking of the WPTS on the MDS remains as future work. However, in this study, we only focus on the WPTS coil losses. The target of the maximum efficiency tracking is to minimize and share the power losses equally between two coils. As it can be seen, with optimum efficiency tracking, the power losses of coils (RL1 and RL2) are equal, and their total power loss is less than that of the non-optimized control system. For low power operation of the system, the share of coil power loss in the total power loss distribution is lower compared to that in high-power operation. The reason is simply that the lower current in the coils in low power operation results in comparatively lower losses. Figure 18b shows almost equal power losses since the desired is almost the same as VDC reference voltage for the non-optimized scenario. Thus, the two systems show almost identical power loss characteristics.
6. Conclusions
In this paper, a WPTS is used to directly supply power to a MDS in a VADS without resorting to an intermediate DC-to-DC converter. A major hurdle with the implementation of such a system is the parameter variations in the WPTS, such as motor power demand and mutual inductance variations, which can lead to a significant dynamic stability issue. In addition, the required constraints to ensure the MDS remains stable with the defined power and speed are identified. Thereafter, these constraints are extended to the MET method to be able to achieve minimum coil power losses. Accordingly, a design methodology for a WPTS is suggested which takes the limitations into consideration. In addition, a robust controller based on a µ-synthesis controller is designed which can guarantee RS and RP of the WPTS within the parameter uncertainty ranges. A number of experiments are performed and evaluated to verify and compare the MET and constant output voltage control methods. As it is shown in this paper, MET control leads to a better efficiency performance. In contrast, the constant DC-link voltage control offers the better dynamic performance in comparison with MET.
Author Contributions
Conceptualization, A.H.; Validation, A.H.; Writing—original draft, A.H.; Writing—review & editing, D.J., M.V. and G.R.W.; Supervision, M.V. All authors have read and agreed to the published version of the manuscript.
Funding
This research received no external funding.
Conflicts of Interest
The authors declare no conflict of interest.
References
- Knecht, O.; Bosshard, R.; Kolar, J.W. High-Efficiency Transcutaneous Energy Transfer for Implantable Mechanical Heart Support Systems. IEEE Trans. Power Electron. 2015, 30, 6221–6236. [Google Scholar] [CrossRef]
- Kirklin, J.K.; Pagani, F.D.; Kormos, R.L.; Stevenson, L.W.; Blume, E.D.; Myers, S.L.; Miller, M.A.; Baldwin, J.T.; Young, J.B.; Naftel, D.C. Eighth annual INTERMACS report: Special focus on framing the impact of adverse events. J. Heart Lung Transplant. 2017, 36, 1080–1086. [Google Scholar] [CrossRef] [PubMed]
- Hosseinipour, M.; Gupta, R.; Bonnell, M.; Elahinia, M. Rotary mechanical circulatory support systems. J. Rehabil. Assist. Technol. Eng. 2017, 4, 205566831772599. [Google Scholar] [CrossRef]
- Slaughter, M.S.; Myers, T.J. Transcutaneous Energy Transmission for Mechanical Circulatory Support Systems: History, Current Status, and Future Prospects. J. Card. Surg. 2010, 25, 484–489. [Google Scholar] [CrossRef]
- Pagani, F.D. Continuous-Flow Rotary Left Ventricular Assist Devices with ‘3rd Generation’ Design. Semin. Thorac. Cardiovasc. Surg. 2008, 20, 255–263. [Google Scholar]
- Letzen, B.; Park, J.; Tuzun, Z.; Bonde, P. Design and Development of a Miniaturized Percutaneously Deployable Wireless Left Ventricular Assist Device: Early Prototypes and Feasibility Testing. ASAIO J. 2018, 64, 147–153. [Google Scholar] [CrossRef]
- Knecht, O.; Kolar, J.W. Impact of Transcutaneous Energy Transfer on the electric field and specific absorption rate in the human tissue. In Proceedings of the IECON 2015—41st Annual Conference of the IEEE Industrial Electronics Society, Yokohama, Japan, 9–12 November 2015; pp. 004977–004983. [Google Scholar]
- Chen, Q.; Wong, S.C.; Tse, C.K.; Ruan, X. Analysis, Design, and Control of a Transcutaneous Power Regulator for Artificial Hearts. IEEE Trans. Biomed. Circuits Syst. 2009, 3, 23–31. [Google Scholar] [CrossRef]
- Dunn, J.L.; Nusem, E.; Straker, K.; Gregory, S.; Wrigley, C. Human Factors and User Experience Issues with Ventricular Assist Device Wearable Components: A Systematic Review. Ann. Biomed. Eng. 2019, 47, 2431–2488. [Google Scholar] [CrossRef] [PubMed]
- Zhang, Z.; Pang, H.; Georgiadis, A.; Cecati, C. Wireless Power Transfer—An Overview. IEEE Trans. Ind. Electron. 2019, 66, 1044–1058. [Google Scholar] [CrossRef]
- Zhang, W.; Wong, S.-C.; Tse, C.K.; Chen, Q. Analysis and Comparison of Secondary Series- and Parallel-Compensated Inductive Power Transfer Systems Operating for Optimal Efficiency and Load-Independent Voltage-Transfer Ratio. IEEE Trans. Power Electron. 2014, 29, 2979–2990. [Google Scholar] [CrossRef]
- Zhang, W.; Mi, C.C. Compensation Topologies of High-Power Wireless Power Transfer Systems. IEEE Trans. Veh. Technol. 2016, 65, 4768–4778. [Google Scholar] [CrossRef]
- Hou, J.; Chen, Q.; Zhang, Z.; Wong, S.-C.; Tse, C.K. Analysis of Output Current Characteristics for Higher Order Primary Compensation in Inductive Power Transfer Systems. IEEE Trans. Power Electron. 2017, 33, 6807–6821. [Google Scholar] [CrossRef]
- Meng, X.; Qiu, D.; Lin, M.; Tang, S.C.; Zhang, B. Output Voltage Identification Based on Transmitting Side Information for Implantable Wireless Power Transfer System. IEEE Access 2019, 7, 2938–2946. [Google Scholar] [CrossRef]
- Sohn, Y.H.; Choi, B.H.; Lee, E.S.; Lim, G.C.; Cho, G.-H.; Rim, C.T. General Unified Analyses of Two-Capacitor Inductive Power Transfer Systems: Equivalence of Current-Source SS and SP Compensations. IEEE Trans. Power Electron. 2015, 30, 6030–6045. [Google Scholar] [CrossRef]
- Zeng, Y.; Qiu, D.; Meng, X.; Zhang, B.; Tang, S.C. Optimized Design of Coils for Wireless Power Transfer in Implanted Medical Devices. IEEE J. Electromagn. RF Microwaves Med. Biol. 2018, 2, 277–285. [Google Scholar] [CrossRef]
- Li, Y.; Sun, Y.; Dai, X. μ-Synthesis for Frequency Uncertainty of the ICPT System. IEEE Trans. Ind. Electron. 2013, 60, 291–300. [Google Scholar] [CrossRef]
- Li, Y.; Du, H.; Yang, M.; He, Z. Two-Degree-of-Freedom H∞ Robust Control Optimization for the IPT System with Parameter Perturbations. IEEE Trans. Power Electron. 2018, 33, 10954–10969. [Google Scholar] [CrossRef]
- Xia, C.; Wang, W.; Ren, S.; Wu, X.; Sun, Y. Robust Control for Inductively Coupled Power Transfer Systems with Coil Misalignment. IEEE Trans. Power Electron. 2018, 33, 8110–8122. [Google Scholar] [CrossRef]
- Xia, C.; Wang, W.; Chen, G.; Wu, X.; Zhou, S.; Sun, Y. Robust Control for the Relay ICPT System under External Disturbance and Parametric Uncertainty. IEEE Trans. Control Syst. Technol. 2017, 25, 2168–2175. [Google Scholar] [CrossRef]
- Hakemi, A.; Jovanovic, D.; Vilathgamuwa, D.M.; Walker, G.R.; Pauls, J. Generic Uncertainty Parameter Analysis and Optimization of Series-Series Wireless Power Transfer System for Robust Controller Design. IEEE Trans. Ind. Electron. 2021, 69, 4107–4118. [Google Scholar] [CrossRef]
- Xia, C.; Sun, Q.; Li, X.; Hu, A.P. Robust μ-Synthesis Control of Dual LCL Type IPT System Considering Load and Mutual Inductance Uncertainty. IEEE Access 2019, 7, 72770–72782. [Google Scholar] [CrossRef]
- Knecht, O.; Kolar, J.W. Performance Evaluation of Series-Compensated IPT Systems for Transcutaneous Energy Transfer. IEEE Trans. Power Electron. 2019, 34, 438–451. [Google Scholar] [CrossRef]
- Pirbodaghi, T.; Asgari, S.; Cotter, C.; Bourque, K. Physiologic and hematologic concerns of rotary blood pumps: What needs to be improved? Heart Fail. Rev. 2014, 19, 259–266. [Google Scholar] [CrossRef]
- Moazami, N.; Fukamachi, K.; Kobayashi, M.; Smedira, N.G.; Hoercher, K.J.; Massiello, A.; Lee, S.; Horvath, D.J.; Starling, R.C. Axial and centrifugal continuous-flow rotary pumps: A translation from pump mechanics to clinical practice. J. Heart Lung Transplant. 2013, 32, 1–11. [Google Scholar] [CrossRef] [PubMed]
- Mosskull, H.; Galic, J.; Wahlberg, B. Stabilization of Induction Motor Drives with Poorly Damped Input Filters. IEEE Trans. Ind. Electron. 2007, 54, 2724–2734. [Google Scholar] [CrossRef]
- Zare, F.; Soltani, H.; Kumar, D.; Davari, P.; Delpino, H.A.M.; Blaabjerg, F. Harmonic Emissions of Three-Phase Diode Rectifiers in Distribution Networks. IEEE Access 2017, 5, 2819–2833. [Google Scholar] [CrossRef]
- Krishnan, R. Permanent Magnet Synchronous and Brushless DC Motor Drives, 1st ed.; CRC Press: Boca Raton, FL, USA, 2010. [Google Scholar]
- Veltman, A.; Pulle, D.; de Doncker, R.W. Fundamentals of Electrical Drives; Springer: Berlin/Heidelberg, Germany, 2007. [Google Scholar]
- Wang, C.-S.; Stielau, O.H.; Covic, G.A. Design Considerations for a Contactless Electric Vehicle Battery Charger. IEEE Trans. Ind. Electron. 2005, 52, 1308–1314. [Google Scholar] [CrossRef]
- Zahid, Z.U.; Dalala, Z.M.; Zheng, C.; Chen, R.; Faraci, W.E.; Lai, J.-S.J.; Lisi, G.; Anderson, D. Modeling and control of series-series compensated inductive power transfer system. IEEE J. Emerg. Sel. Top. Power Electron. 2015, 3, 111–123. [Google Scholar] [CrossRef]
- Skogestad, I.P.S. Multivariable Feedback Control: Analysis and Design, 2nd ed.; John Wiley & Sons: Hoboken, NJ, USA, 2005. [Google Scholar]
- Gu, D.-W.; Petkov, P.H.; Konstantinov, M.M. Robust Control Design with MATLAB®; Springer: London, UK, 2013. [Google Scholar]
- Wang, Z.-Q.; Sznaier, I.; Batarseh, I.; Bu, J. Robust controller design for a series resonant converter. IEEE Trans. Aerosp. Electron. Syst. 1996, 32, 221–233. [Google Scholar] [CrossRef]
- Lundström, P.; Skogestad, S.; Wang, Z.-Q. Performance weight selection for H-infinity and μ-control methods. Trans. Inst. Meas. Control 1991, 13, 241–252. [Google Scholar] [CrossRef]
- Yu, C.Y.; Tamura, J.; Lorenz, R.D. Optimum dc bus voltage analysis and calculation method for inverters/motors with variable dc bus voltage. IEEE Trans. Ind. Appl. 2013, 49, 2619–2627. [Google Scholar] [CrossRef]
- Jones, E.A.; Wang, F.F.; Costinett, D. Review of Commercial GaN Power Devices and GaN-Based Converter Design Challenges. IEEE J. Emerg. Sel. Top. Power Electron. 2016, 4, 707–719. [Google Scholar] [CrossRef]


Disclaimer/Publisher’s Note: The statements, opinions and data contained in all publications are solely those of the individual author(s) and contributor(s) and not of MDPI and/or the editor(s). MDPI and/or the editor(s) disclaim responsibility for any injury to people or property resulting from any ideas, methods, instructions or products referred to in the content. |
© 2023 by the authors. Licensee MDPI, Basel, Switzerland. This article is an open access article distributed under the terms and conditions of the Creative Commons Attribution (CC BY) license (https://creativecommons.org/licenses/by/4.0/).