Article

Temperature Field Analysis and Cooling Structure Optimization for Integrated Permanent Magnet In-Wheel Motor Based on Electromagnetic-Thermal Coupling

1
School of Transportation, Shandong University of Science and Technology, Qingdao 266590, China
2
Zhongtong Bus Holding Co., Ltd., Liaocheng 252000, China
3
College of Chemical and Biological Engineering, Shandong University of Science and Technology, Qingdao 266590, China
*
Author to whom correspondence should be addressed.
Energies 2023, 16(3), 1527; https://doi.org/10.3390/en16031527
Submission received: 9 December 2022 / Revised: 15 January 2023 / Accepted: 27 January 2023 / Published: 3 February 2023
(This article belongs to the Topic Advanced Electric Vehicle Technology)

Abstract

:
Aiming at the impact of heat generation and temperature rise on the driving performance of a permanent magnet (PM) motor, taking the PM in-wheel motor (IWM) for electric vehicles as an object, research is conducted into the temperature distribution of the electromagnetic–thermal effect and cooling structure optimization. Firstly, the electromagnetic–thermal coupling model considering electromagnetic harmonics is established using the subdomain model and Bertotti’s iron loss separation theory. Combined with the finite element (FE) simulation model established by Ansoft Maxwell software platform, the winding copper loss, stator core loss and PM eddy current loss under the action of complex magnetic flux are analyzed, and the transient temperature distribution of each component is obtained through coupling. Secondarily, the influence of the waterway structure parameters on the heat dissipation effect of the PM-IWM is analyzed by the thermal-fluid coupled relationship. On the basis, the optimization design of waterway structure parameters is carried out to improve the heat dissipation effect of the cooling system based on the proposed chaotic mapping ant colony algorithm with metropolis criterion. The comparison before and after optimization shows that the temperature of key components is significantly improved, the average convection heat transfer coefficient (CHTC) is increased by 23.57%, the peak temperature of stator is reduced from 95.47 °C to 82.73 °C, and the peak temperature of PM is decreased by 14.26%, thus the demagnetization risk in the PM is improved comprehensively. The research results can provide some theoretical and technical support for the structural optimization of water-cooled dissipation in the PM motor.

1. Introduction

In recent years, new-energy vehicles have been widely promoted, and the PM synchronous motor has been widely used in the development of IWM driving system for electric vehicles due to its high specific power, compact structure, strong overload capacity and other outstanding advantages. However, most of the IWM are highly integrated with the structure of motor, controller, brake, etc., and are directly introduced into the hub. Then the narrow assembly space and complex operating conditions will lead to more prominent heat generation, and the resulting high temperature will cause thermal demagnetization of the PM motor, which will affect the driving performance of the PM-IWM. Therefore, the accurate prediction of the temperature field and the optimization of the cooling system are of great significance to the design and control of the PM-IWM.
The importance of electromagnetic loss and thermal analysis has been discussed by many references in recent years. Above all, scholars have conducted a lot of work on electromagnetic field distribution by using the relative magnetic conductivity [1,2], Schwarz-Christoffel mapping [3,4], subdomain technique [5,6,7], FE analysis and so on, and the magnetic flux and non-uniformity distribution of stator core under no-load and on-load conditions are given [8,9]. On this basis, Liang et al. [10] analyzed the stator core loss under no-load and on-load conditions according to the Bertotti model considering magnetic field harmonics. Tao et al. [11] utilized the time stepping FE method to reveal the variation in stator core loss of the PM motor under multi-load conditions. Ni et al. [12] investigated the variation of PM eddy current loss under the action of high-frequency magnetic harmonics. As a main reason for motor temperature rise, the change of heat source directly affects the temperature field distribution, Li et al. [13] clarified the coupled relationship between heat source location and node temperature by using the improved equivalent thermal-network model, and the peak temperature distribution of the U-type core was obtained. Chen et al. [14] introduced the temperature distribution of stator core, winding copper and PM under different heat transfer conditions by the equivalent thermal-circuit model. Tong et al. [15] calculated the iron loss and temperature rise of PM motor under rated load and different power supply conditions through electromagnetic-thermal coupling three-dimensional (3-D) FE model. Chai et al. [16] discussed the temperature field distribution under the heat conduction and convection of windings copper based on the established 3-D multi-block model of windings in slots and end windings. Hu et al. [17] further investigated the temperature field distribution of the motor according to the established bidirectional coupling model of multi-physical field. Although the above method clarified the temperature field distribution under the balance of heat generation and heat dissipation to a certain extent, the transient temperature field considering electromagnetic harmonics had not been paid enough attention. Therefore, enlightened by the basic theory of the above research, it is necessary to further discuss the transient and stable distribution of the temperature field incorporating electromagnetic harmonics.
As the main part affecting heat dissipation of PM motor, a reasonable design of cooling structure has rapidly attracted the widespread attention of scholars. Chen et al. [18] utilized the FE simulation model to calculate the temperature field distribution of stator core, winding copper, PM and other components under the action of the cooling system. Yu et al. [19] clarified the temperature distribution of the winding copper according to the established 3-D electromagnetic-simplified fluid-thermal coupled model. Chang et al. [20] introduced the heat dissipation performance of the IWM under different cooling configurations through the coupling effect between thermal, fluid and solid. Liang et al. [21] comparative analyzed the influence of the circumferential and axial water jackets configuration on the heat dissipation effect. References [22,23] discussed the influence of different flow velocity, cooling channel configuration and number of channels on the CHTC and stator temperature rise. To further improve the heat dissipation performance of the cooling structure, Chen et al. [24] presented the response surface method to optimize the channel diameter and channel spacing of the cooling structure. Li et al. [25] applied the Taguchi method to optimize the axial and radial width of the self-circulated cooling channel. Roy et al. [26] optimized the section width, number and layout of cooling channels by using the cyclic iterative optimization method. Li et al. [27] proposed the back propagation neural network model and multi-objective particle swarm optimization algorithm to optimize the waterway width, connection angle, spoiler size and water velocity of the PM motor cooling system. Although the above optimization design method has improved the heat dissipation performance of PM motor to a certain extent, it takes the coupling of water pressure loss, CHTC and temperature distribution as the objective, and the specific research combined with optimization model and algorithm still needs to be further discussed.
The main contributions of this paper are as follows. Firstly, the magnetic flux densities of the integrated PM-IWM are calculated by using the subdomain model and FE numerical model. Secondly, an electromagnetic-thermal bi-directional coupling analytical model is established according to Bertotti’s iron loss separation theory, and the time-varying characteristics of stator core loss, winding copper loss and PM eddy current loss under the action of complex electromagnetic harmonics are explored. Then, combined with the FE model, the temperature distribution of each key component is investigated. Furthermore, the influence of waterway structure parameters on the convection heat transfer characteristics and heat dissipation effect are explored based on the established thermal–fluid coupled model. Finally, the multi-objective optimization design of waterway structure parameters is carried out by using the improved chaotic mapping ant colony algorithm with metropolis criterion, and the heat dissipation effect of the cooling system before and after optimization is compared.

2. Temperature Field Analysis of Integrated PM In-Wheel Motor

2.1. Prototype

The physical model of the integrated PM-IWM studied in this paper is shown in Figure 1. It is mainly composed of IWM, special hub, suspending sleeve, bearing, brake disc assembly, and so on. Notably, the hub, rotor housing and brake disc are designed in an integrated way. The stator is flexibly connected to the wheel shaft by using the suspending sleeve and annular rubber bushing, and the integrated rotor is supported on the wheel shaft through the suspending sleeve and bearing. Moreover, the U-type circulating waterway connected with the external cooling system is added inside the stator.

2.2. Magnetic Field Prediction

To more accurately simulate the actual operating conditions of PM-IWM, the collaborative simulation technology is used to calculate and analyze the electromagnetic field, loss distribution and temperature distribution in this paper, and the temperature rise of each component is obtained by the sequential coupling. Firstly, the magnetic density of air-gap and stator core are calculated by sub-domain model and FE simulation. The equivalent schematic diagram of the PM motor is shown in Figure 2. The model is divided into 4-region in the 2-D polar coordinate system, namely the PM region (Region 1), air-gap region (Region 2), slot region (Region 3) and slot opening region (Region 4), as shown in Figure 2a. Then, to further describe the magnetic field inside the stator core, the stator is divided into three parts: tooth, tip and yoke, as shown in Figure 2b. In the armature circuit, the insulated gate bipolar transistor is used as the power switch, and the upper and lower switch signals of the same bridge arm are complementary. The three bridge arms of the inverter are respectively connected to the three-phase windings of the PM motor, and the three-phase symmetrical current output is achieved through the resistance inductance unit, it is shown in Figure 2c.
Where αi is the position of the i-th slot, Rm, Rr and Rs are the radius of the magnet, rotor yoke surfaces and stator bore, respectively. R s b and R s t are the radius of the slot bottom and top, respectively. l s a and l o a are the width angle of slot and slot opening, respectively, and the prototype parameters of the PM-IWM are shown in Table 1.
According to Maxwell’s theory, the vector potential equation of each subdomain can be obtained for the radial magnetization as follows [5,6,7]:
2 A z η r 2 + 1 r A z η r + 1 r 2 2 A z η α 2 = { μ o M r r α η = 1 0 η = 2 μ 0 J η = 3 0 η = 4
with
{ M r = k = 1 , 3 , 5 , [ 4 p B r k π μ 0 s i n k π α p 2 p c o s ( k α k ω r t k α 0 ) ] J = 2 ( J i 1 J i 2 ) n π s i n ( n π / 2 ) + J i 1 + J i 2 2 n c o s [ n π l s a ( α + l s a / 2 α i ) ]
Where r and α are the radial and circumferential positions, η is the number of each region (η = 1, 2, 3, 4), B r is the remanence of magnet, αp is the pole-arc ratio, ωr is the rotor rotational speed, α0 is the rotor initial position, p is the number of pole pairs, Ji1 and Ji2 are the current density amplitudes on both sides of the i-th slot, respectively, μ0 is the permeability of vacuum.
The general expressions of the vector potential distributions of each subdomain are obtained by separating variables method, which can be expressed by:
A z η = n = 1 , 2 , 3 , [ κ 1 η r ζ η + κ 2 η r ζ η ] c o s ( ζ η α ) + n = 1 , 2 , 3 , [ κ 3 η r ζ η + κ 4 η r ζ η ] s i n ( ζ η α ) + A p η
where
ζ η = { n η = 1 , 2 n π / l s a η = 3 n π / l o a η = 4
where κ 1 η , κ 2 η , κ 3 η and κ 4 η are coefficients to be determined, Apη is the special solution, ϛη is the coefficient of each subdomain equation.
The radial and tangential components of flux density can be obtained from the vector potential distribution by:
{ B η r = 1 r A z η α B η α = A z η r
According to the continuity of radial and tangential flux density, the interface conditions between subdomains can be obtained, as shown in Table 2.
According to the vector potential of adjacent slots, the magnetic field distribution around the stator core can be obtained, where the magnetic flux density function of the stator tooth can be expressed as:
B t = Φ t l a w t
where Φt is the magnetic flux of stator tooth, wt is the width of the stator tooth:
Φ t = R s b 2 R s 2 2 ( B z 3 i B z 3 i + 1 )
where
{ B z 3 i = R s R s b S i c S i A z 3 i ( r , α ) r d r d α B z 3 i + 1 = R s R s b S i + 1 c S i + 1 A z 3 i + 1 ( r , α ) r d r d α
The yoke’s magnetic flux can be calculated as a function of the magnetic flux in a pole pitch, and the expression is:
B y = R s 2 t y 0 α p B 2 r ( R s , α ) d α
where ty is the thickness of the stator yoke.
Combined with the above analytical model and the prototype parameters of the PM-IWM in Table 1, the 3-D FE model is established by using the Ansoft Maxwell software (ANSYS, Inc., version 2021R1, Canonsburg, PA, USA) [9,18], and the meshing in the area with larger magnetic density has been carefully adjusted before satisfactory results, the number of generated elements is 148283. The magnetic flux density of the PM motor under on-load condition can be obtained through simulation calculation, and its contour is shown in Figure 3. It can be seen from the analysis that the magnetic flux lines distribution in the PMs and stator slot is roughly symmetrical, and the maximum point is located at the stator tooth tip.
Figure 4 shows the radial and tangential flux density waveforms at the center of the air-gap with rated on-load. Obviously, the comparison shows a good agreement between the analytical and FE calculation results. It can be seen that the radial and tangential peak values of air-gap magnetic density are 1.27 T and 0.57 T, respectively, and at the junction of N-S pole, the radial magnetic density is relatively smaller, the amplitude is close to zero, the tangential magnetic density is relatively larger, the amplitude is about 0.3 T.
Figure 5 shows the time-varying waveform of magnetic flux density at the center point of stator tooth, tip and yoke. It can be seen that the magnetic flux density at the three representative points is sinusoidal in the time-domain, and the peak of magnetic flux density in the radial direction are 0.90 T, 0.87 T and 0.32 T, respectively, the maximum magnetic flux densities of stator tooth and yoke in the tangential direction are relatively close, 0.14 T and 0.11 T, respectively, and the magnetic flux density of tooth tip is relatively larger. Its peak value is 1.10 T.

2.3. Loss Computation

As the main reason for PM motor temperature rise, the iron loss is mainly reflected in the coupling of hysteresis loss and eddy current loss according to the description of classical Bertotti’s iron loss separation theory [28]. There are not only rotating electromagnetic fields but also alternating electromagnetic fields in the stator iron-core position. In the process of operation, the high-order harmonic excitation current and magnetic density waveform with time-space harmonics is considered to be the important factors affecting the motor iron loss. According to the location of loss, it mainly includes stator core loss, winding copper loss, PM eddy current loss and mechanical loss. According to relevant literature [9,13], its mechanical loss accounts for a small proportion of iron loss, which can be neglected. Therefore, the above first three losses are mainly considered in this paper, that is, the total loss PZ can be expressed as:
P z = P Cu + P Fe + P me
where
{ P Fe = ( K h f B m n + K c f 2 B m 2 + K e f 1.5 B m 1.5 ) V i r o n P Cu = m I 2 R [ 1 + θ ( T w T w 0 ) ] P me = L a V k m e 2 f m e 2 B m e 2 L b 2 12 ρ p ( L a + L b )
where PFe, PCu, and Pme are the iron-core loss, winding copper loss and PM eddy current loss, respectively. Kh, Kc and Ke are the coefficient of hysteresis loss, eddy current loss and abnormal loss, respectively. F is the current frequency, Bm is the magnetic amplitude of PM motor components, Viron is the iron core volume, m is the current phase number, I is the effective value of the current per unit period, R is the winding resistance value at the current temperature, Tw is the temperature of windings, and Tw0 is the initial winding temperature, θ is the temperature coefficient of resistance. La, Lb and V are the axial length, width and volume of PM, respectively. Kme is the proportional constant of electromotance, fme is the alternating frequency of magnetic field. Bme and ρp are the maximum magnetic flux density and resistivity of PM, respectively.
According to the established 3-D transient FE model, the spatial distribution of stator core loss, winding copper loss and PM eddy current loss in the axial central section can be calculated, as shown in Figure 6. It can be seen that the above three losses are roughly symmetrical, with the peak values of 3.4465 × 10⁵ W/m3, 8.0069 × 10⁵ W/m3 and 1.5707 × 10⁵ W/m3, respectively. The core loss is mainly concentrated in the position between stator tooth, and the distribution of instantaneous copper loss is basically consistent with the winding layout. Some PMs corresponding to the main loss positions of the iron core and winding copper have concentrated eddy current losses.
Figure 7 shows the steady-state time-varying curves of the above three lost power. The winding copper loss is the largest, and the peak loss power and effective output value are 256.76 W and 247.66 W, respectively. The stator core loss is lower than the winding copper loss, the peak loss power is 142.23 W, and the effective output value is 104.64 W. The PM eddy current loss is the lowest, with the peak loss power and effective output value are 68.96 W and 39.11 W, respectively.

2.4. Temperature Field Analysis

The skin effect and thermal radiation effect of windings are ignored in the temperature field calculation. The ambient temperature and initial temperature are maintained at 25 °C in the solution process, and only the heat conduction and convection process are considered. The transient temperature field of anisotropic medium can be obtained by using the heat conduction control differential equation, and its expression is:
( λ i T s ) + q i = 0
where λi is the thermal conductivity of each component, which is determined by the material properties. Ts is the instantaneous temperature value, and qi is the heat generation rate.
The heat balance equation of the fluid-solid coupling interface is expressed as:
λ i ( T s n ) = a i ( T s T f )
where n is the normal direction of the coupling surface, ai is the CHTC of each coupling surface, and Tf is the temperature of the cooling medium.
The equivalent thermal conductivity of the insulation layer is generally calculated by using the following formula:
λ e = i = 1 n δ i i = 1 n ( δ i / λ c i )
where δi and λci are the thickness and thermal conductivity of each heat conducting body.
The air disturbance on the stator surface will be caused by the during rotation, which will strengthen the convection and heat dissipation of the end winding, and the CHTC of the stator end surface is:
a 1 = 1 + 0.04 v t 0.045
where vt is the wind speed of the stator end surface.
In view of the integrated design of rotor shell, the rotor can be regarded as natural cooling when the wind speed is about zero, and its surface CHTC can be expressed as:
a 2 = 14 T c 25 3
where Tc is the external ambient temperature.
The heat transfer in the air-gap can be equivalent to the heat conduction of static fluid, and its thermal conductivity can be expressed as [18]:
λ 1 = 19 10 4 ( R s R m ) 2.9084 ( ω r R s δ 60 v r ) 0.46141 l n ( 3.331 R s / R m )
where δ = Rm − Rs, δ is the air-gap length.
According to the above boundary conditions and the established 3-D temperature field simulation model, the thermal flux vector distribution of the PM motor can be calculated, as shown in Figure 8. It can be seen from the analysis that part of the heat is dissipated to outside of the body through the rotor housing, while the rest of heat is accumulated in the stator teeth and yoke positions instantaneously, which further aggravates the continuous rise of stator temperature.
Figure 9 shows the temperature distribution contour of main components of the PM-IWM under on-load condition. The winding copper loss is relatively larger, the upper surface temperature is higher than the lower surface, and the overall distribution is approximately symmetrical in the middle, the maximum temperature is 131.24 °C, and the stator core temperature is close to the winding, with the peak temperature of 130.14 °C, as shown in Figure 9a,b. It can be seen from Figure 9c,d that the PM temperature mainly depends on the winding temperature and internal eddy current loss, and the peak temperature is 88.01 °C. Since the rotor yoke is closest to the outside, the temperature is relatively lower, and the peak temperature is 87.55 °C.
Figure 10a shows the time-varying curves of temperature rise of the PM-IWM components. Before 2409s, the overall temperature increases approximately logarithmically, and after 5398s, the temperature of each component tends to be stable. On the whole, the winding temperature is the largest, followed by the stator core temperature, and the PM temperature is close to the rotor yoke, which is relatively lower. The time-varying curves of temperature rise of the stator tooth, tip and yoke shows an approximate logarithmic trend, as shown in Figure 10b, and the silicon steel sheet is a material with good thermal conductivity, which makes the temperature difference between the three parts of the stator smaller. Its peak temperatures are 130.14 °C, 128.92 °C and 127.53 °C, respectively.

3. Impact of Cooling Structure on Heat Dissipation of PM In-Wheel Motor

The heat generated during operation of the PM motor is mainly dissipated by the cooling medium. In the calculation process, it is usually assumed that the cooling medium is incompressible fluid, and the standard k-ε model should be used to describe the turbulent effect of coolant [26]. Meanwhile, the speed of the cooling medium should also be continuous under steady flow, and the conversion process between momentum and energy can be expressed as:
{ v = 0 ρ f d v d t = p + μ 2 v ( λ f T f ) = ρ f C f T f t + ( ρ f C f v T f )
where v, μ and p are the fluid velocity, dynamic viscosity and pressure of the cooling medium, respectively. ρf, Cf and λf are the density, specific heat capacity and thermal conductivity of the cooling medium, respectively.
According to the similarity criterion of fluids, the CHTC of the flow channel can be derived from the following equation [29]:
{ R e r = v D w v f P r = μ C f λ f N u r = 0.023 R e r 0.8 P r 0.4 h f = N u r λ f D w
where Rer is the Rayleigh number, Dw is the hydraulic diameter, vf is the kinematic viscosity of coolant, Pr is the Prandtl number, Nur is the Nusselt number, hf is the CHTC of the channel.
According to the initial design analysis and relevant literature statement, the parameters that affect the equivalent heat dissipation performance mainly include the number of waterways, inlet flow velocity, aspect ratio of the waterway section, fillet radii of U-type, etc. For the U-type waterway selected in this paper, its specific structure and design parameters are shown in Figure 11.
Assume that the initial coolant temperature is 25 °C and the inlet fluid velocity is 0.50 m/s. The coolant flow velocity, pressure and CHTC of waterway are calculated according to the established 3-D simulation model of thermal-fluid coupling, and the stator temperature field distribution under this condition is obtained, as shown in Figure 12. As shown in Figure 12a, the CHTC decreases gradually from inlet to outlet, which is due to the low temperature of the coolant entering waterway. At the section, the CHTC gradually increases from inside to outside, and the maximum is 651.21 W/(m2·K). Figure 12b shows the velocity streamline of waterway with elbows, and the vortex and backflow exist in the elbows, which causes a different velocity distribution, and the minimum flow velocity is about 0.13 m/s. The pressure in the waterway gradually decreases from inlet to outlet, with a minimum of about 2.54 × 10² Pa, as shown in Figure 12c. Based on the above conditions, the stator temperature decreases significantly, and the overall distribution is relatively uniform, with a peak of 95.47 °C, as shown in Figure 12d.
Figure 13 shows the influence of the number of waterways nw, flow velocity vin, section width of waterway bw and fillet radii of U-type structure Rc on the CHTC and the peak temperature of stator. The CHTC is proportional to nw and vin, when nw is larger than 22, it rises gently. The peak temperature of stator decreases with the increase of nw and vin, when vin is greater than 0.8 m/s, it decreases slowly, as shown in Figure 13a,b. Figure 13c shows the CHTC changes linearly with bw, and the peak temperature of stator decreases with the increase of bw. When the width is 11 mm, a turning point appears, and then it falls gently. The CHTC rises rapidly and then decreases slightly with the increase of Rc, and the peak temperature of stator decreases rapidly and then rises slowly, as shown in Figure 13d. It can be seen from the analysis that the CHTC increases in varying degrees with the increase of the main parameters, which makes the peak temperature of stator decrease, thereby improving the heat dissipation performance of the cooling system to a certain extent.

4. Optimization Design of Waterway Structure Parameters

4.1. Chaotic Mapping Ant Colony Algorithm Based on Metropolis Criterion

Ant colony algorithms analogize the social behavior of ant colonies, they are a class of meta-heuristics which are inspired from that real ants can find the shortest path from a good source to nest. It uses ants’ walking path to represent the feasible solution of the problem to be optimized. All paths of the entire ant colony constitute the solution space of the problem to be optimized. Among them, the primary means for ants to form and maintain the line is a pheromone. Ants deposit a certain amount of pheromone while walking, and each ant probabilistically prefers to follow a direction rich in pheromone. Thus, the shorter path will receive a greater amount of pheromone per time unit and in turn a larger number of ants will choose the shorter path. Due to this positive feedback (autocatalytic) process, all the ants will rapidly choose the shorter path. At this time, the path can be regarded as the optimal solution of the problem to be optimized [30].
The search process of the ant colony algorithm mainly uses two types of rules, which determine the moving rules of the next location and pheromone update rules. Under the guidance of pheromone, the ant walks in the best direction, assuming that an ant currently at the position x0 chooses to move to the next position xi by applying the following probabilistic transition rule:
p x 0 i = c 0 i α τ 0 i β
After normalization, it can be expressed as:
p x 0 i = c 0 i α τ 0 i β i = 1 n i c 0 i α τ 0 i β
where c0i is the pheromone level between position 0 and position i, τ0i is the inverse of the distance between position 0 and position i, ni is the set of positions which remain to be visited when the ant is at position i, α and β are two adjustable positive parameters that control the relative weights of the pheromone trail and heuristic visibility.
After each ant completes its tour, the pheromone amount on each path will be adjusted, σ is the pheromone decay parameter ( σ ( 0 ,   1 ) ) where it represents the trail evaporation when the ant chooses a position and decides to move, and the update equation is:
τ i = ( 1 σ ) ( τ i + Δ τ )
where τi is the pheromone level before position update, ∆τ is the increased pheromone.
The CHTC, pressure loss and peak temperature of stator are taken as the optimization target in this paper, the parameters of nw, vin, bw, and Rc are optimized. The optimization problem can be described as:
{ min F ( X ) = [ f 1 ( X ) , f 2 ( X ) , f 3 ( X ) ] s . t . { X = [ X 1 , X 2 , X 3 , X 4 ] = [ R c , n w , v i n , b w ] X i m i n X i X i m a x , i = 1 , 2 , 3 , 4
where F(X) is the fitness function of the optimization target, f1(X), f2(X), and f3(X) are the reciprocal of CHTC (1/h), the pressure loss (Δp) and the peak temperature of stator (Tm), respectively, Xi is the design variable, X i m i n and X i m a x are the upper and lower boundary values of the design variable, respectively. The initial value and preset ranges of the design variable, as shown in Table 3.
To solve the problems of large randomness and small coverage of the initial population generated in the traditional ant colony algorithm. According to the ergodicity and randomness of chaotic motion, as well as the uniform probability density of Tent mapping, the Tent chaotic-map is used to generate the initial population Xi in this paper, and to improve the convergence speed and accuracy of the algorithm. The initial random position of the ant colony can be expressed as:
X i = X min + x Δ X
with
x i + 1 = { 2 x i 0 x i 0.5 2 ( 1 x i ) 0.5 x i 1
where Xmin is the lower boundary position, ΔX is the moving range of ant colony, x is the random sequence generated by iteration of Tent chaotic-map.
In the process of accepting new paths, the traditional ant colony algorithm is selected according to the density of pheromones, which will eliminate the potential paths prematurely, resulting in too fast convergence in the early stage of the algorithm, thus causing local optimization problems. In order to make more ants search carefully in the neighborhood of high-quality path and improve the accuracy of optimization, and this paper proposes an improved ant colony path selection method based on the Metropolis criterion. The selection probability of the ants from the current path to the next path is:
p i = { 1 τ i + 1 τ i 1 exp ( τ i + 1 τ i k g E ) τ i + 1 < τ i
where E is the control coefficient of the acceptance probability, pi is the probability of ants moving from the current path i to the next path i + 1. When the pheromone density of the new path is lower than the current path, there is a certain probability of ants moving to the new path, the probability decreases with the increase of iteration number kg.

4.2. Optimization Results and Analysis

The multi-objective optimization design of waterway structure parameters is carried out by using the improved chaotic mapping ant colony algorithm with the Metropolis criterion, and the pareto frontier distribution of the obtained optimization target is shown in Figure 14. Combined with the influence of waterway structure on heat dissipation effect, each objective function is weighted through the Pareto solution of the dominated domain formed by iteration. Namely, f f i t n e s s = i = 1 3 ϕ i f i , wherein φ1 = 0.4, φ2 = 0.2 and φ3 = 0.4. The multi-objective function is reduced to a single objective, and then the optimal solution of structure parameters is obtained.
Figure 15 shows the changes of waterway structure parameters and design targets before and after optimization. The waterway structure parameters have changed to varying degrees after optimization. The number of waterways has increased to 24 after rounding, the coolant flow velocity is increased from 0.50 m/s to 0.86 m/s, which is 72.00% higher, the section width of waterway is reduced from 14.47 mm to 11.02 mm, and the fillet radii of U-type is increased from 2 mm to 5 mm after optimization and rounding, as shown in Figure 15a. Figure 15b shows the waterway pressure loss is reduced from 2.87 kPa to 2.62 kPa, a decrease of 8.71%, the peak temperature of the stator has decreased from 95.47 °C to 82.73 °C by 13.34%, and the average CHTC is increased from 563.75 W/(m2·K) to 696.62 W/(m2·K), increasing by 23.57%.
Figure 16 shows the rise and peak temperature of the stator, winding, PM and rotor have decreased to varying degrees after the optimization of the waterway structure. Among them, the peak temperature change of winding copper is close to that of the stator, and the temperature decreases from 95.97 °C to 83.51 °C, reducing by 12.98%. The change of stator temperature has an obvious effect on air-gap heat conduction and PM heat radiation. The peak temperature of PM decreases from 65.81 °C to 56.42 °C, a decrease of 14.26%, and the peak temperature of rotor is reduced from 62.68 °C to 54.86 °C by 12.47%. Furthermore, the heat dissipation performance of PM-IWM and the demagnetization risk in the PM are improved comprehensively.

5. Conclusions

(1)
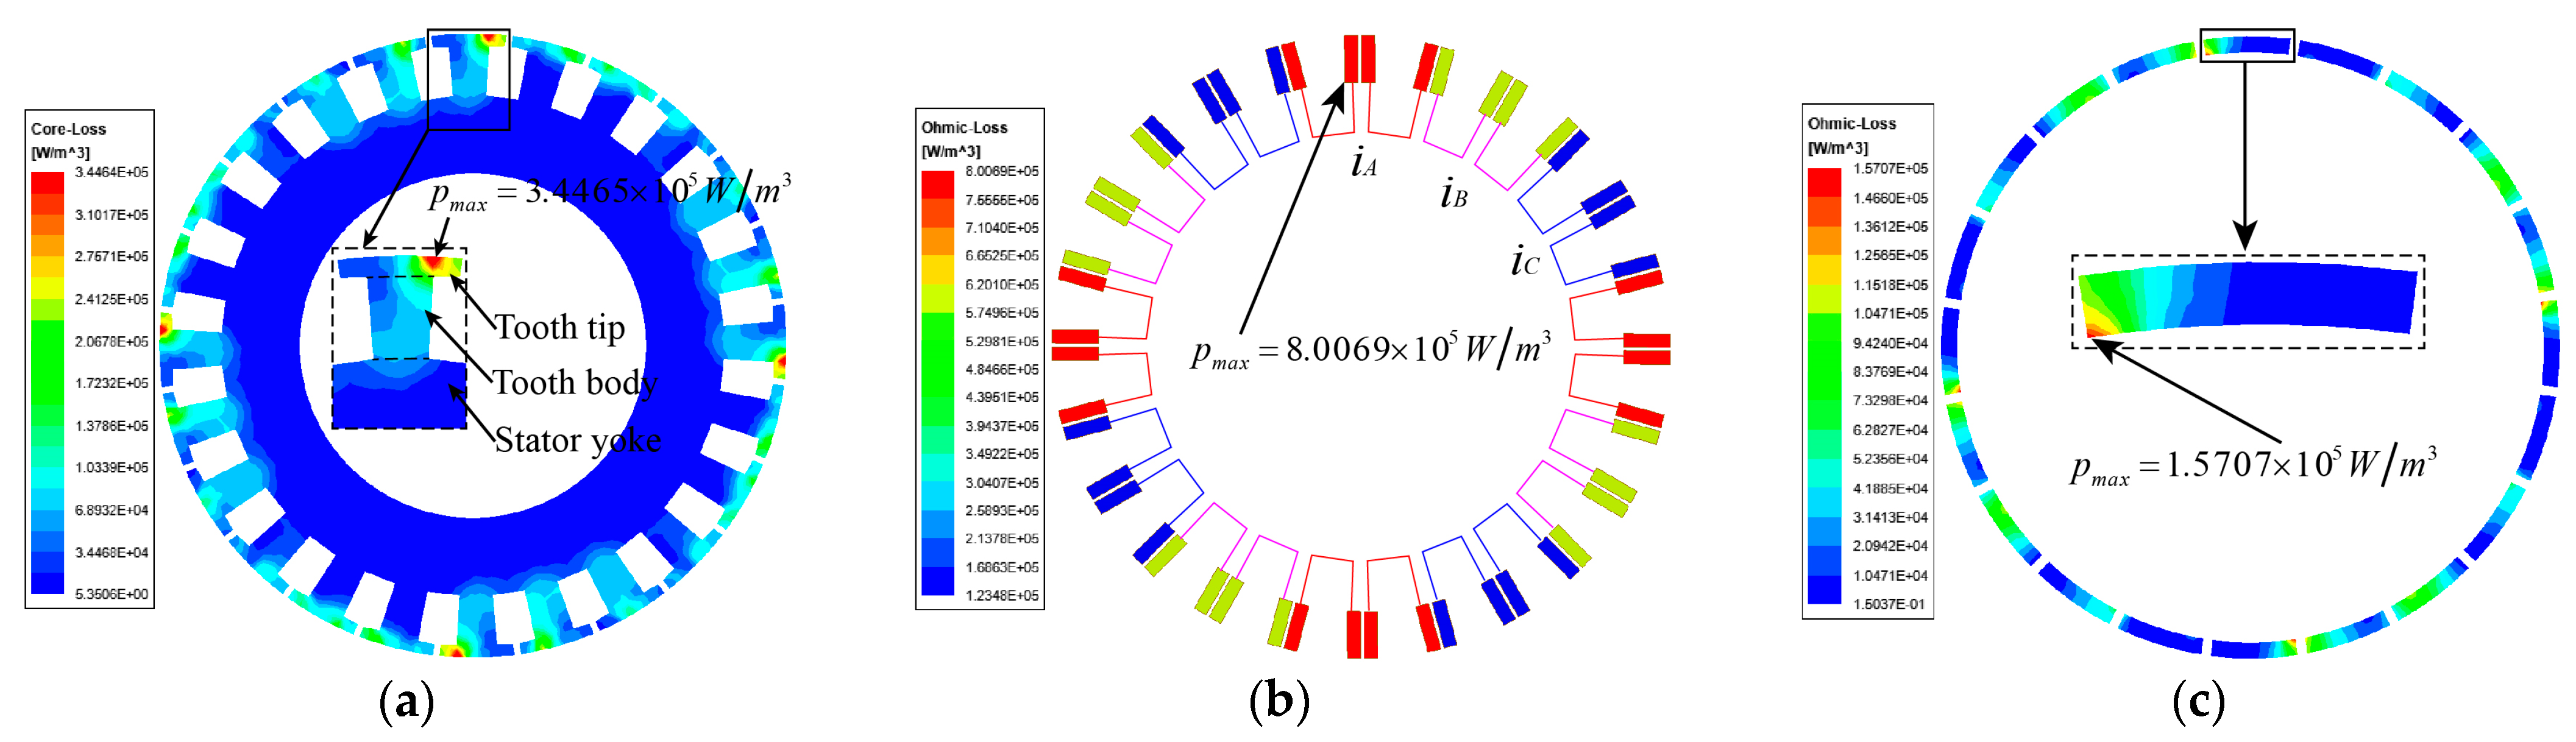
The heat generation, temperature field distribution and cooling structure optimization of the integrated PM-IWM are researched in this paper. Firstly, the magnetic flux density distribution of the PM, air-gap and stator core are compared and calculated by using the subdomain model and FE numerical model. The space-time distribution of stator core loss, winding copper loss and PM eddy current loss is obtained according to the Bertotti’s iron loss separation theory. The core loss is mainly concentrated between the stator teeth, the distribution of instantaneous copper loss is basically consistent with the winding layout, and there is a certain concentration of eddy current loss in some corresponding PM. Combined with the 3-D temperature simulation model, the temperature rise process and distribution of the main components are calculated. After the temperature rise tends to be stable, it can be seen that the winding copper is the largest, followed by the stator core, the PM and rotor yoke are relatively lower, and the peak temperatures are 131.24 °C, 130.14 °C, 88.01 °C and 87.55 °C, respectively.
(2)
The coolant flow velocity, pressure, CHTC and stator temperature distribution are analyzed based on the thermal-fluid coupled model and Ansoft Maxwell software simulation platform. The effects of the waterway structure parameters on the CHTC, pressure loss and peak temperature of stator are also clarified. It can be concluded that the CHTC is approximately proportional to the number of waterways, flow velocity and section width of waterway, and with the increase of the U-type fillet radii, it rises rapidly and then decreases slightly. The peak temperature of the stator decreases with the increase of number of waterways, flow velocity and section width of waterway, and decreases rapidly and then rises slowly with the increase of the U-type fillet radii. The comparison results show that the change of waterway structure parameters has a significant impact on the heat dissipation performance of IWM, in which the effect results also provide some guidance for its optimal design.
(3)
Taking the number of waterways, flow velocity, section width of waterway and fillet radii of U-type as design variables, the heat dissipation effect of the cooling system is optimized based on the proposed chaotic mapping ant colony algorithm with metropolis criterion. Moreover, the Pareto frontier distribution of the optimization target is obtained. After optimization, the waterway pressure loss decreases from 2.87 kPa to 2.62 kPa, reducing by 8.71%. The average CHTC is increased from 563.75 W/(m2·K) to 696.62 W/(m2·K), increasing by 23.57%. The peak temperature of the stator has decreased from 95.47 °C to 82.73 °C by 13.34%. In addition, the rise and peak temperature of key components such as winding copper, PM and rotor are reduced to varying degrees. The optimized waterway structure comprehensively improves the heat dissipation effect of the motor and the demagnetization risk in the PM. The research results can provide some theoretical and technical support for design and control of the integrated PM-IWM.

Author Contributions

Conceptualization, Q.W. and Z.Z.; methodology, Q.W. and R.L.; software, R.L.; validation, Q.W., W.X. and P.Z.; formal analysis, R.L. and K.L.; investigation, Q.W. and K.L.; data curation, R.L.; writing—original draft preparation, Q.W.; writing—review and editing, P.Z.; visualization, W.X.; supervision, Z.Z.; funding acquisition, Q.W. All authors have read and agreed to the published version of the manuscript.

Funding

This research was funded by the National Nature Science Foundation of China (Grant No. 52002229), Project funded by China Postdoctoral Science Foundation (Grant No. 2022M713655) and Scientific Research Foundation of Shandong University of Science and Technology for Recruited Talents (Grant No. 2017RCJJ053).

Data Availability Statement

Not applicable.

Acknowledgments

This study was partially supported by the Intelligent Transportation Driving System Research Institute of Shandong University of Science and Technology.

Conflicts of Interest

The authors declare no conflict of interest.

References

  1. Zhu, X.Y.; Jiang, M.; Xiang, Z.X.; Quan, L.; Hua, W.; Cheng, M. Design and Optimization of a Flux-Modulated Permanent Magnet Motor Based on an Airgap-Harmonic-Orientated Design Methodology. IEEE Trans. Ind. Electron. 2020, 67, 5337–5348. [Google Scholar] [CrossRef]
  2. Yang, H.; Li, Y.; Lin, H.; Zhu, Z.Q.; Lyu, S.K. Principle Investigation and Performance Comparison of Consequent-Pole Switched Flux PM Machines. IEEE Trans. Transp. Electrif. 2020, 7, 766–778. [Google Scholar] [CrossRef]
  3. Hanic, A.; Zarko, D.; Hanic, Z. A Novel Method for No-Load Magnetic Field Analysis of Saturated Surface Permanent-Magnet Machines Using Conformal Mapping and Magnetic Equivalent Circuits. IEEE Trans. Energy Convers. 2015, 31, 740–749. [Google Scholar] [CrossRef]
  4. Hanic, A.; Zarko, D.; Kuhinek, D.; Hanic, Z. On-Load Analysis of Saturated Surface Permanent Magnet Machines Using Conformal Mapping and Magnetic Equivalent Circuits. IEEE Trans. Energy Convers. 2018, 33, 915–924. [Google Scholar] [CrossRef]
  5. Wu, L.J.; Zhu, Z.Q.; Staton, D.; Popescu, M.; Hawkins, D. An Improved Subdomain Model for Predicting Magnetic Field of Surface-Mounted Permanent Magnet Machines Accounting for Tooth-Tips. IEEE Trans. Magn. 2011, 47, 1693–1704. [Google Scholar] [CrossRef]
  6. Wu, L.J.; Zhu, Z.Q.; Staton, D.; Popescu, M.; Hawkins, D. Subdomain Model for Predicting Armature Reaction Field of Surface-Mounted Permanent-Magnet Machines Accounting for Tooth-Tips. IEEE Trans. Magn. 2011, 47, 812–822. [Google Scholar] [CrossRef]
  7. Oner, Y.; Zhu, Z.Q.; Wu, L.J.; Ge, X.; Zhan, H.; Chen, J.T. Analytical On-Load Subdomain Field Model of Permanent-Magnet Vernier Machines. IEEE Trans. Ind. Electron. 2016, 63, 4105–4117. [Google Scholar] [CrossRef]
  8. Liang, P.X.; Chai, F.; Chen, L.; Wang, Y.P. Analytical Prediction of No-Load Stator Iron Losses in Spoke-Type Permanent-Magnet Synchronous Machines. IEEE Trans. Energy Convers. 2017, 33, 252–259. [Google Scholar] [CrossRef]
  9. Khedda, Z.K.; Boughrara, K.; Dubas, F.; Kechroud, A. Analytical Prediction of Iron-Core Losses in Flux-Modulated Permanent-Magnet Synchronous Machines. IEEE Trans. Magn. 2019, 535, 6333112. [Google Scholar]
  10. Liang, P.X.; Tang, Y.; Chai, F.; Shen, K.; Liu, W.G. Calculation of the Iron losses in a Spoke-Type Permanent Magnet Synchronous In-Wheel Motor for Electric Vehicles by Utilizing the Bertotti Model. IEEE Trans. Magn. 2019, 55, 8202407. [Google Scholar] [CrossRef]
  11. Tao, D.; Zhou, K.L.; Lv, F.; Dou, Q.; Wu, J.; Sun, Y.; Zou, J. Magnetic Field Characteristics and Stator Core Losses of High-Speed Permanent Magnet Synchronous Motors. Energies 2020, 13, 535. [Google Scholar] [CrossRef] [Green Version]
  12. Ji, W.; Ni, F.; Gao, D.; Luo, S.; Lv, Q.; Lv, D. Electromagnetic Design of High-Power and High-Speed Permanent Magnet Synchronous Motor Considering Loss Characteristics. Energies 2021, 14, 3622. [Google Scholar] [CrossRef]
  13. Li, B.; Yan, L.; Cao, W. An Improved LPTN Method for Determining the Maximum Winding Temperature of a U-Core Motor. Energies 2020, 13, 1566. [Google Scholar] [CrossRef]
  14. Chen, H.; Wang, K.; Yan, W.J.; Orabi, M.; Parspour, N. Temperature Analysis of Switched Reluctance Motor Based on Equivalent Heat Circuit Method. IEEE Trans. Appl. Supercond. 2021, 31, 1–4. [Google Scholar] [CrossRef]
  15. Tong, W.M.; Sun, R.L.; Li, S.Q.; Tang, R.Y. Loss and Thermal Analysis for High-Speed Amorphous Metal PMSMs Using 3-D Electromagnetic-thermal Bi-Directional Coupling. IEEE Trans. Energy Convers. 2021, 36, 2839–2849. [Google Scholar] [CrossRef]
  16. Tang, Y.; Chen, L.; Chai, F.; Chen, T.C. Thermal Modeling and Analysis of Active and End Windings of Enclosed Permanent-Magnet Synchronous In-Wheel Motor Based on Multi-Block Method. IEEE Trans. Energy Convers. 2020, 35, 85–94. [Google Scholar] [CrossRef]
  17. Jia, M.; Hu, J.; Xiao, F.; Yang, Y.; Deng, C. Modeling and Analysis of Electromagnetic Field and Temperature Field of Permanent-Magnet Synchronous Motor for Automobiles. Electronics 2021, 10, 2173. [Google Scholar] [CrossRef]
  18. Chen, Q.P.; Shao, H.; Huang, J.L.; Sun, H.Y.; Xie, J.C. Analysis of Temperature Field and Water Cooling of Outer Rotor In-Wheel Motor for Electric Vehicle. IEEE Access 2019, 7, 140142–140151. [Google Scholar] [CrossRef]
  19. Liu, X.M.; Yu, H.T.; Shi, Z.C.; Xia, T.; Hu, M.Q. Electromagnetic-Fluid-Thermal Field Calculation and Analysis of a Permanent Magnet Linear Motor. Appl. Therm. Eng. 2018, 129, 802–811. [Google Scholar] [CrossRef]
  20. Luo, L.; Chang, J.J.; Wu, J.L.; Zhu, B.; Zheng, M.Y.; Zhang, N. Design and Analysis of a Water-Cooling System in a New Yokeless and Segmented Armature Axial In-Wheel Motor for Electric Vehicles. J. Therm. Sci. Eng. Appl. 2021, 13, 051015. [Google Scholar] [CrossRef]
  21. Liang, P.X.; Chai, F.; Shen, K.; Liu, W.G. Water Jacket and Slot Optimization of a Water-Cooling Permanent Magnet Synchronous In-Wheel Motor. IEEE Trans. Ind. Appl. 2021, 57, 2431–2439. [Google Scholar] [CrossRef]
  22. Lu, Q.F.; Zhang, X.M.; Chen, Y.; Huang, X.Y.; Ye, Y.Y.; Zhu, Z.Q. Modeling and Investigation of Thermal Characteristics of a Water-Cooled Permanent-Magnet Linear Motor. IEEE Trans. Ind. Appl. 2014, 51, 2086–2096. [Google Scholar] [CrossRef]
  23. Ge, B.J.; Zhang, J.; Tao, D.J. Temperature Prediction and Cooling Structure Optimization of Explosion-Proof High Pressure Water-Cooled Double Speed Motor. Energy Rep. 2022, 8, 3891–3901. [Google Scholar]
  24. Chen, J.S.; Gong, P.H.; Liu, Y.S.; Zheng, X.Y.; Ren, F. Optimization of Hot Stamping Cooling System Using Segmented Model. Int. J. Adv. Manuf. Technol. 2017, 93, 1357–1365. [Google Scholar] [CrossRef]
  25. Zhu, G.J.; Li, L.; Mei, Y.H.; Liu, T.; Xue, M. Design and Analysis of a Self-Circulated Oil Cooling System Enclosed in Hollow Shafts for Axial-Flux PMSMs. IEEE Trans. Veh. Technol. 2022, 71, 4879–4888. [Google Scholar] [CrossRef]
  26. Roy, P.; Bourgault, A.J.; Towhidi, M.; Song, P.Z.; Li, Z.; Mukundan, S.; Rankin, G.; Kar, N.C. An Algorithm for Effective Design and Performance Investigation of Active Cooling System for Required Temperature and Torque of PM Traction Motor. IEEE Trans. Magn. 2020, 57, 8201507. [Google Scholar] [CrossRef]
  27. Li, Y.S.; Li, C.B.; Garg, A.; Gao, L.; Li, W. Heat Dissipation Analysis and Multi-Objective Optimization of a Permanent Magnet Synchronous Motor Using Surrogate Assisted Method. Case Stud. Therm. Eng. 2021, 27, 101203. [Google Scholar] [CrossRef]
  28. Bertotti, G. General Properties of Power Losses in Soft Ferromagnetic Materials. IEEE Trans. Magn. 1988, 24, 621–630. [Google Scholar] [CrossRef]
  29. Gai, Y.; Kimiabeigi, M.; Chong, Y.C.; Widmer, J.D.; Deng, X.; Popescu, M.; Goss, J.; Staton, D.A.; Steven, A. Cooling of Automotive Traction Motors: Schemes, Examples, and Computation Methods. IEEE Trans. Ind. Electron. 2018, 66, 1681–1692. [Google Scholar] [CrossRef]
  30. Dorigo, M.; Birattari, M.; Stutzle, T. Ant Colony Optimization. IEEE Comput. Intell. Mag. 2006, 1, 28–39. [Google Scholar] [CrossRef]
Figure 1. Structure of the integrated PM-IWM prototype.
Energies 16 01527 g001
Figure 2. Subdomain model of magnetic field: (a) Subdomain distribution; (b) Stator structure; (c) Inverter circuit.
Energies 16 01527 g002
Figure 3. Magnetic flux density distribution contour of PM-IWM under on-load condition.
Energies 16 01527 g003
Figure 4. Magnetic flux density in the middle of the air-gap under on-load condition: (a) Radial component; (b) Tangential component.
Energies 16 01527 g004
Figure 5. Magnetic flux density time-varying waveform of the stator core: (a) Radial component; (b) Tangential component.
Energies 16 01527 g005
Figure 6. Iron loss distribution contour of PM motor during on-load condition: (a) Stator core loss; (b) Winding copper loss; (c) PM eddy current loss.
Energies 16 01527 g006
Figure 7. Loss power time-varying curves of PM-IWM during on-load condition.
Energies 16 01527 g007
Figure 8. Thermal flux vector distribution of PM-IWM.
Energies 16 01527 g008
Figure 9. Temperature distribution contour of PM-IWM components under on-load condition: (a) Winding; (b) Stator core; (c) PM; (d) Rotor yoke.
Energies 16 01527 g009
Figure 10. Temperature rise curve of PM-IWM components under on-load condition. (a) Motor components; (b) Stator components.
Energies 16 01527 g010
Figure 11. Configuration and main parameters of U-type waterways.
Energies 16 01527 g011
Figure 12. Heat dissipation contour of cooling system: (a) CHTC distribution; (b) Velocity streamline distribution; (c) Pressure distribution; (d) Temperature distribution of the stator.
Energies 16 01527 g012
Figure 13. Stator peak temperature and CHTC vary with waterway structure parameters: (a) Number of waterways; (b) flow velocity; (c) Section width of waterway; (d) Fillet radii of U-type.
Energies 16 01527 g013
Figure 14. Pareto frontier distribution of multiple optimization targets.
Energies 16 01527 g014
Figure 15. Comparison of initial scheme and optimal scheme: (a) Design variables; (b) Optimization targets.
Energies 16 01527 g015
Figure 16. Comparison of temperature changes of PM-IWM components before and after optimization: (a) Heating process; (b) Peak temperature.
Energies 16 01527 g016
Table 1. Main parameters of the integrated PM motor.
ParametersSymbolValuesParametersSymbolValues
Pole/Slot number2p/Ns20/24Stator bore radiusRs145 mm
Magnet thicknesshm12 mmSlot top radiusRst140 mm
Active lengthla110 mmSlot bottom radiusRsb115 mm
Rated currentI14 ASlot width anglelsa8.5°
Pole-arc/pole-pitchσp0.86Slot opening width angleloa2.7°
Inner rotor radiusRm146.5 mmMagnet remanenceBr0.96 T
Table 2. Interface conditions between different subdomains.
Boundary LocationConstraint Equation
Rotor yoke surface 1 μ 0 μ r B 1 α | r = R r 1 μ r M α = 0
Interface between PM and air-gap B 1 r = B 2 r | r = R m ;   H 1 α = H 2 α | r = R m
Interface between air-gap and slot opening B 2 α | r = R s = B 4 α | r = R s ;   A z 4 i | r = R s = A z 2 | r = R s
Interface between slot opening and slot B 4 α | r = R s t = B 3 α | r = R s t ;   A z 3 i | r = R s t = A z 4 i | r = R s t
Bottom surface of slot B α | r = R s b = 0
Table 3. Preset ranges of design variables.
Design VariableSymbolInitial ValueConstraint Condition
Number of waterwaysnw2016 < nw < 26
Coolant flow velocityvin0.50 m/s0.20 < vin < 1.20
section width of waterwaybw14.67 mm10 < bw < 18
fillet radii of U-typeRc2 mm0 < Rw < 8
Disclaimer/Publisher’s Note: The statements, opinions and data contained in all publications are solely those of the individual author(s) and contributor(s) and not of MDPI and/or the editor(s). MDPI and/or the editor(s) disclaim responsibility for any injury to people or property resulting from any ideas, methods, instructions or products referred to in the content.

