Article

Impact of Digital Industrialization on the Energy Industry Supply Chain: Evidence from the Natural Gas Industry in China

1
School of Law & Business, Wuhan Institute of Technology, Wuhan 430205, China
2
Center for High Quality Collaborative Development of Resources, Environment and Economy, Wuhan Institute of Technology, Wuhan 430205, China
3
Institute of Agricultural Science and Technology Information, Shanghai Academy of Agricultural Sciences, Shanghai 201403, China
*
Author to whom correspondence should be addressed.
Energies 2023, 16(4), 1564; https://doi.org/10.3390/en16041564
Submission received: 3 January 2023 / Revised: 20 January 2023 / Accepted: 2 February 2023 / Published: 4 February 2023

Abstract

:
The global economy is moving into a new era characterized by digital and green development. To examine the impact of digital industrialization development on the energy supply chain, in relation to the sustainable development of China’s energy security, we discuss the nonlinear impact and transmission mechanism of digital industrialization on the supply chain of the energy industry using a panel threshold regression model based on sample data on the development of the provincial natural gas industry in China from 2006 to 2020. We found that there are multiple threshold effects of digital industrialization level development on energy supply chain length, and the results are statistically significant, i.e., digital industrialization development positively contributes to natural gas supply chain length after digital industrialization is raised to or crosses the critical threshold. Meanwhile, the heterogeneity analysis results show that there are differences in the impact of digital industrialization on the energy supply chain from sub-sectors, regional development differences, and different development periods. Therefore, we provide some factual support and experience for achieving the construction goal of “Digital China” and accelerating the digital reform of the energy supply chain as well as transforming and upgrading the economic structure.

1. Introduction

Due to the COVID-19 pandemic, the global energy supply chain has been reforming at an accelerated pace. Energy is the basic material condition for human society to survive and develop. It is a matter of national security and long-term stability, involving the comprehensive development of national strategies. In modern society, the energy industry is concerned with the reconstruction of the world order, so promoting the transformation of the energy structure has now become the consensus of the international community and the energy industry [1,2,3]. Against the backdrop of increased uncertainty in the world economy, the ability of China’s energy sector to ensure supply chain security and stability will have a decisive impact on whether China’s economy can achieve sustainable development. As a major energy-demanding country, the national government has continuously provided preferential policies for relevant enterprises, emphasizing “Internet+” and intelligent energy enterprises. General Secretary Xi Jinping also proposed to promote the energy industry revolution, build intelligent energy systems, and strengthen new energy consumption and reserves, thus continuously optimizing the energy industry supply chain, promoting the further transformation and upgrading of the industrial structure of China’s energy development, and supporting the subsequent energy development. Digital industrialization refers to the provision of digital technologies, products, services, infrastructure, and solutions for the digital development of industries as well as various economic activities that are completely dependent on digital technologies and data elements [4,5]. In the historical process of upgrading the energy industry, the technological revolution has been the decisive factor [6,7]. With the wide application of new-generation information technology, the energy supply chain has gradually developed into a digital supply chain with the deep integration of digital technology. The deep integration of digital technology in the energy industry empowers the transformation and upgrading of the traditional energy industry. By empowering the supply chain with new features such as big data support and networked sharing, the transparency of information is enhanced for all aspects of the supply chain and promotes the efficient operation of the energy supply chain. Therefore, under the current situation, studying the relationship between digital industrialization and the energy supply chain is in line not only with the future trend of digital economy development but also with providing a decision-making reference to further promote the development of the digital economy, the transformation and upgrading of energy industry structure, and supply chain efficiency.
With the deepening effect of digital industry on global economic development, theoretical innovations in the field of the digital economy have been increasing in China. Among them, research related to the upgrading of the energy industry in the context of digital industrialization has been a research focus of scholars [8,9,10,11]. It was found that digital industrialization helps stimulate industrial structure optimization [3,12,13], which is important for the energy industry [14,15]. Thus, this article reviews the following four facets found in the literature:
First, regarding the impact of digital industrialization on the energy industry, the existing literature focuses on three aspects: intelligent change in the energy industry, the reform of energy-related enterprises, and the impact on other industries. (1) During crisis situations, emerging digital technologies are relevant in dealing with supply chain disruptions [16]. Some scholars focused their research on the impact of epidemic outbreaks, particularly on the supply chain [17]. Digitizing supply chains and networks reduces design complexity and improves energy industry connectivity and resource flows, which helps to manage existing energy strategic relationships while identifying new possible ones [18]. In terms of digital industrialization promoting the intelligent transformation of the energy industry, digital transformation is crucial to the high-quality development of the energy industry. The realization of the digital industrialization of the energy industry can effectively boost the transformation and innovation of the energy supply chain and promote the realization of digital intelligence [19,20]. Digital industrialization is also the key to realize the “double carbon” era and accelerate the digital and intelligent transformation of the energy system [9,10]. (2) The COVID-19 crisis triggered supply chain disruptions that made it challenging for firms to continue operating, especially SMEs [21]. In these highly competitive but poorly supported business environments, the energy industry needs to generate relevant innovations and technologies to improve its performance and competitiveness [21,22]. COVID-19 has fast-tracked the ongoing digitalization trends, so more industry players are now aware of the urgency of investing in new technologies [23,24,25]. Digital industrialization affects the reform of energy-related enterprises, and digitalization profoundly affects the business model, organizational management, resource allocation, and business evolution of the energy industry [14,15,26]. (3) The digital transformation of enterprises has created workforce issues in the supply chain to reduce overall expenditures [27]. COVID-19 has impacted digitalization worldwide. The growth rate of SMEs has increased significantly, which is entirely due to the advent of digital technology [28]. Some researchers believe that COVID-19 is forcing enterprises and other traditional manufacturers to realize the benefits of digitalization. Digital industrialization improves the efficiency of information exchange and competition in the energy industry by influencing the development of other industries. The digital industrialization of energy enterprises is a new industry and a new business model, following the collision and integration of IT and enterprises in the industry, which can effectively improve the efficiency and reliability of the whole industry. Digitization is an effective way to promote the comprehensive competitiveness of the energy industry and strengthen energy competition [9,29]. The utilization of relevant digital technologies can stimulate the productivity of digital processes by converting all paper documents into electronic documents using the various e-services available throughout the country [30]. Digital industrialization allows SMEs to address labor issues, manage operational costs, reduce overall expenses, and address COVID-19 challenges [27]. The use of emerging technologies can stimulate productivity, as SMEs can digitize their processes, convert all their paper documents into electronic documents, and migrate to e-commerce services [30]. This can also help alleviate challenges and reduce lengthy administrative procedures. Digital industrialization offers new opportunities within the global economy, with a greater impact on SMEs and the IT ecosystem.
Second, regarding the impact of digital information technology on the energy industry, some scholars believe that digital information has become a characteristic of current development and that it will promote the change of the energy industry and empower the low-carbon transformation of cities, while others believe that digital industrialization disturbs the balance of the energy industry. The core insistence of digital technology is to introduce digital transformation through the Internet [31], design corporate operations, reduce budget shortfalls, send digital standard information through smartphones, increase the utilization of the Internet, and make people aware of Internet facilities. On the one hand, the future of the energy industry should be led by digital information technology, giving full play to the advantages of the digital economy, accelerating the digital and intelligent transformation of the energy industry, and improving the stability and competitiveness of the supply chain [32]. Digital technologies are now considered key to sustaining productivity and other downstream activities [33]. Many studies proved that artificial intelligence and other digital technologies can improve social capital and increase supply chain productivity [18]. In addition, some proposed adopting practices and restructuring supply chains to account for the carbon emissions related to digital technologies [34,35]. Digital technologies also help to align environmental resources. Digital information technology promotes energy-efficiency improvement, green-technology progress, and industrial-structure upgrades to empower urban low-carbon transformation [9,10,36] and improve the structure of the energy sector [37]. On the other hand, digital information technology developments are disrupting the industry and putting the ecosystem in the innovation spotlight, so the energy sector is under pressure to nurture and manage the ecosystem in the innovation process [38,39]. Although companies see the short-term benefits of digital technologies, they remain skeptical about their usefulness after the pandemic [40]. It is relevant that attacks related to digital technologies, such as artificial intelligence, machine learning, and 5G networks, have increased significantly [41]. Many plants use automated technology with the workforce located off-site, while the shop floor is connected to digital technology, which exposes energy plants to cyber-attacks.
Third, regarding the impact of digital services on the energy sector, scholars argue that digital services will drive economic growth in the energy sector. In the context of carbon neutrality, digital services empower countries to achieve net-zero growth in carbon emissions [29]. Research suggests a combination of servitization and digitalization, that is, the adoption of smart servitization and digital servitization for other smart connected products to provide advanced services to customers in the COVID-19 era [25,42]. Advanced services provided through a digitally based servitization model are more likely to perform better in a disruptive situation such as a pandemic than vendors who limit themselves to basic services [42]. The use of platforms provided by digital services is cost-effective and often yields greater efficiency than traditional methods of information exchange [43]. Digital services have become the key to economic growth in the energy sector, which is significant for countries’ economic growth as well as for combating climate warming. In the current digital era, the energy industry is facing a transformation dilemma, so more and more energy companies are pushing to transform the core of their value creation from providing energy products to providing energy services; the core of such energy services is data services or data application services [44,45].
Fourth, regarding the impact of digital infrastructure on the energy industry, scholars believe that the construction of digital infrastructure will support the development of the energy industry, which is proposed to strengthen the construction of digital infrastructure, so the digital economy has become an important driving force for high-quality economic development [46]. The adoption of digital infrastructure is effective in improving supply chain visibility and addressing other adversities [18,47]. The extensive penetration and application process of digital infrastructure construction in other industrial sectors stimulates innovation in the energy industry [37]. Digital systems in smart cities and infrastructure serve to modernize the new energy industry [38]. Digitization makes infrastructure and cities “smarter”. The use of physical space and energy; the transmission of information; the management of users, assets and processes; and the operations of businesses and enterprises have been progressively digitized [48]. Strengthening digital infrastructure is an important way to achieve green and low-carbon energy development [49].
The existing research results expanded the research horizon in the field of digital economy and energy, provided a rich theoretical and practical basis for the formulation of China’s energy policy, and made important contributions to promoting the upgrading of China’s energy industry as well as China’s digital transformation, but there are still the following shortcomings: (1) Most of the current studies involve the overall impact of the digital economy on the energy industry, but there is little in the literature based on theoretical models and empirical analysis to study the impact of digital industrialization development on the length of the supply chain in the energy industry. (2) There are relatively few studies in the literature that consider the nonlinear impact of digital industrialization on the energy supply chain. (3) The analysis of the heterogeneous impact of digital industrialization on the energy industry is not rich enough.
Compared with the existing studies, the marginal contributions of this paper are mainly in the following aspects: (1) Drawing on the existing literature, we construct indicators of the digital industrialization and supply chain length of the energy industry from the provincial natural gas level and study the correlation between them to make up for the research deficiencies. (2) In terms of research methodology, the panel threshold regression model is used to analyze the impact of the digital industrialization level on energy supply chain length, to make up for the lack of analysis of nonlinear effects in the existing literature. (3) This article studies the heterogeneous effects at the levels of segmented industries, time, and regions and further deepens the analysis of the inner mechanism of digital industrialization for the digital empowerment of supply chain length in the energy industry, which makes this paper’s research more policy-relevant and enriches the related research theories. Based on our research contributions, the results show that there are multiple threshold effects of digital industrialization level on energy supply chain length. Meanwhile, there are differences in the impact of digital industrialization on the energy supply chain from sub-sectors, regional development differences, and different development periods. This is crucial to the current realization of “double carbon” and energy security.
The remainder of the article is organized as follows. Section 2 investigates the theoretical basis and proposes hypotheses. Section 3 introduces the econometric model and data. Empirical results are presented and analyzed in Section 4. Section 5 builds the mechanism test and Section 6 concludes the article and gives policy suggestions.

2. Theoretical Basis and Hypotheses

The inherent advantages of digital industry, such as speed and sustainability, effectively eliminate the problems of traditional industries’ excessive consumption of tangible resources and energy and the fragmentation of the industrial chain. In addition to its own characteristics, digital industrialization has a direct impact on the efficiency of the energy supply chain and an indirect impact through foreign trade, technological innovation, industrial structure upgrading, disposable income, and environmental regulation. This article investigates the nonlinear effect and influencing mechanism of digital industrialization on the supply chain of the energy industry and proposes research hypotheses, Specific research hypotheses are shown in Figure 1.

2.1. Nonlinear Effect of Digital Industrialization on Supply Chain of Energy Industry

In the era of digital economy, consumers’ demand for products and services is increasingly diversifying, while the boundary of economic activities between product departments is gradually weakening, and transaction costs and information search costs are also significantly reducing [50]. In this context, sectors of the energy industry participate in the construction of green development, which enables them to enjoy the digital dividend and the positive incentive of green development in a wider range and promotes the improvement of the efficiency of the energy industry [51]. With the improvement of the digital industrialization level, on the one hand, various departments reconstruct the main body association mode and supply chain relationship, optimize the allocation of resources, and improve their own operation efficiency [52]. On the other hand, the Internet-based digital economy mainly provides a broader and higher quality communication platform for the innovation sector, which effectively expands the market scale and improves transaction efficiency [53,54]. In the general environment of digital industry development, the inter-temporal dissemination of digital technology makes the cost of acquiring information and technology in the energy sector fall, and the marginal cost of industrial linkage continues to decrease, so the benefits that participants obtain from it will continue to increase. Moreover, this effect will become increasingly pronounced with the upgrading of industrial structure and the improvement of technological innovation. Therefore, the impact of digital industrialization on the supply chain of the energy industry may show nonlinear effects. Therefore, the article proposes the following research hypothesis:
Hypothesis 1.
Digital industrialization has nonlinear effect on the supply chain of the energy industry.

2.2. Mechanism Analysis of Digital Industrialization of Energy Supply Chain

The driving effect of digital industrialization on the energy supply chain can be achieved gradually through five channels, foreign trade, technological innovation, industrial structure upgrading, disposable income and environmental regulation, to realize the digital transformation of the supply chain in the energy sector. This article will also measure the development level of the energy supply chain by selecting the corresponding indicators based on these five channels.
  • Foreign trade
The development of digital industry has broken the boundaries of time and space and promoted the further improvement of international marketization [55]. On the one hand, the development of the digital economy is changing the market structure [56], breaking the disadvantages of poor factor flow in the traditional market, realizing exchanges across time and space, and reducing the transaction costs of the real economy. On the other hand, digital industrialization has broken the localization of the commodity trading market, so trading time and place are no longer restricted. The COVID-19 pandemic has had a significant impact on pre-existing global supply chains and demand systems, as well as on the structure of major economies. In addition, global activities and operations have become more reliant on digital technology, which connects all parts of the world, in the context of the impact of the COVID-19 pandemic. China has become a major center of the global production chain. Digital technology has also made it easier to do business because it opens up global markets and is cheaper to advertise. The global epidemic has not affected the ability of China’s financial markets to expand their reform and opening [57,58].
  • Technological innovation
The scale and diffusion effects exhibited by digital industrialization have led to the improvement of technological innovation. On the one hand, innovation is, to a certain extent, a process of information processing [59]. The essence of the digital technology represented by the Internet is that it is a medium of information exchange, and the Internet promotes the processing of diversified and scattered information and optimizes the process of innovation activities [60]. On the other hand, the application of digital technology optimizes the cross-border allocation of innovation resources, changes the innovation process and mode, and shortens the innovation product cycle; thus, the transformation efficiency of innovation results is improved [61,62]. In addition, under the impetus of digital industry, innovation subjects, mainly in scientific research institutions are gradually transformed through the interconnection and cooperation of enterprises, government, and other innovation subjects, which effectively allocates the innovation resources, thus promoting the level of technological innovation [63]. At the same time, technological innovation will enhance the economic efficiency of the energy industry through technology spillover and technology linkage.
  • Industrial structure upgrading
Digital industrialization can affect the energy supply chain by optimizing industrial structure upgrading [64]. The electronic information manufacturing industry, software services and other new industries can not only accelerate the pace of the transformation of traditional manufacturing industries to the middle and high end but also promote the deep integration of the energy industry and information technology industry, thus helping to achieve industrial structure upgrading [65,66]. The enabling effect of traditional digital technology on industry lies in the circulation of information and the reduction in intermediate transaction links. New digital technologies, represented by big data, cloud computing and artificial intelligence, can also better integrate the upstream and downstream of the industry chain and facilitate the connection between producers, consumers, and investors.
From the perspective of energy structure, the development of the digital economy can drive the transformation of energy structure in the following three aspects. First, the digital economy can change the energy production structure. The digitalization of energy is conducive to the intelligent transformation of the energy production process and the upgrading of the production management system of energy enterprises, to realize the recycling of energy and improve energy utilization efficiency [55]. Second, the digital economy can optimize the energy consumption structure. Digital enterprises can help other industries to optimize energy consumption through technology transportation [67,68]. The development of the digital economy has also changed our way of production and lifestyle, promoted the virtualization and dematerialization of economic activities, and reduced traditional energy consumption and carbon emissions. Third, the digital economy can accelerate the development of new energy sources. Through the embedding of digital technology, more renewable energy will replace traditional fossil energy, and the energy consumption structure will be further improved.
  • Disposable income
In terms of digital industrialization being an important part of the national economy, the faster the development of digital industry is in one place, the greater its contribution to the local economy is, and the more local income it will generate. Moreover, as the agglomeration effect of digital industry becomes more and more prominent [60], its pulling effect on the local economy and income will become more obvious. On the one hand, due to the siphon effect generated by the agglomeration of digital industry, the faster and larger the development of digital industry is in one place, the more likely it is to cause an inflow of technology, talents, capital and other production factors related to digital industry from other regions into the local area, thus creating a positive impact on the local economic development and income [69]. On the other hand, the rapid development of digital industry in one place will also promote it in other regions through the diffusion effect such as the drive of the industrial chain [70].
  • Environmental regulation
As an important tool for the government to correct the behavior of enterprises, environmental regulation plays an important role in stimulating technological innovation, promoting industrial transformation and facilitating the development of the green economy [71,72]. China’s economic development is gradually changing from being factor-driven to being efficiency-driven. With the Internet as a bridge, the digital economy connects the whole process of products, production, distribution, exchange, and consumption, which reduces transaction costs and information search costs and, thus, becomes a key driver of green economy efficiency improvement [73]. From the perspective of environmental management, the advantages of digital industrialization reduce the disadvantages of information asymmetry from previous environmental management. Using information technologies such as big data, cloud computing, and the Internet of Things, environmental pollution information can be timely transmitted to government decision makers, enterprises and the public. In this way, the environmental pollutants produced in the production process can be dynamically monitored, so environmental pollutants can be treated in a timely manner, thus improving green economic development.
Therefore, the article proposes the following research hypothesis:
Hypothesis 2.
Digital industrialization positively affects the energy supply chain by promoting foreign trade, improving technological innovation, optimizing industrial structure, increasing disposable income, and regulating environmental regulations.

3. Methods

3.1. Model

Since the threshold autoregressive model (TAR) [74] was proposed, this nonlinear time series model has been widely used in the economic and financial fields. In this article, we argue that the impact of digital industrialization on the energy industry supply chain is not a simple linear relationship but will change as the level of digital industrialization development increases on the energy supply chain. To further study the nonlinear relationship between digital industrialization and energy supply chain, we use the length of energy supply chain as the explanatory variable and the level of digital industrialization as the threshold variable to analyze the actual impact of the level of digital industrialization on the length of energy supply chain through the panel threshold model; the basic model is set as shown in Equation (1):
y i t = u i + x i t β 1 × I ( q i t γ ) + x i t β 2 × I ( q i t > γ ) + ε i t
where i = 1 , 2 , n ; t = 1 , 2 , , T denotes time, q i t is the threshold variable, ε i t is the random error term, and y i t and x i t are the explained and explanatory variables, respectively. I ( · ) is an indicator function, which is I when the conditions hold, and 0 otherwise. Based on the relative magnitude of the threshold variable q i t and the threshold value γ , the sample observations are divided into two different intervals, and the differences between the intervals are expressed in the regression coefficients β 1 and β 2 . This ensures that β 1 and β 2 can be estimated, and, thus, x i t cannot contain dummy variables such as specific variables that do not change over time. Moreover, the panel threshold model requires that the threshold variables have specific properties. There is only one threshold in Equation (1), though in many realistic situations there may be more than one threshold, so it is necessary to further consider the multiple threshold model. The dual threshold model is set up as shown in Equation (2), where γ 1 < γ 2 :
y i t = u i + x i t β 1 × I ( q i t γ 1 ) + x i t β 2 × I ( γ 1 < q i t γ 2 ) + x i t β 3 × I ( q i t γ 2 ) + ε i t

3.2. Variables

  • Explained variable: length of supply chain
The supply chain also has product or service attributes, structural attributes, and value attributes. The supply chain delivers different products or services for different industrial units, forms different spatial–temporal structures, and delivers different values for end consumers. Scholars have studied supply chains through the collection of industrial data. Representative literature such as Sarkis (2003) [75] used network analysis to evaluate supply chain management strategies and constructed a system of environmental performance indicators. Therefore, we use Social Network Analysis (SNA) to calculate the length of energy supply chain to measure the level of energy supply chain, involving concepts such as point centrality index, betweenness centrality index, and closeness centrality index. Among them, point centrality reflects the centrality of nodes in the network and measures the length of energy supply chain by absolute centrality, while participating in the robustness discussion as alternative indicator between centrality index and closeness centrality index. The main calculation formulas are as follows:
First, the point centrality index. Point centrality reflects the centrality of the node in the network, C A D ( i ) to indicate the absolute centrality, in the case of directed network, as C A D ( i ) = i n d e g r e e   o f   i + o u t d e g r e e   o f   i . Point indegree refers to the number of relationships that enter other points to the point, while point outdegree refers to the number of relationships that connect to other points from the point. The relative point centrality is the ratio of the absolute point degree centrality of a node to the maximum possible number of degrees of the nodes in the network. Supposing that there are n city nodes in the network, the relative point centrality C R D ( i ) in the directed network is denoted as
C R D ( i ) = ( i n d e g r e e   o f   i + o u t d e g r e e   o f   i ) / ( 2 n 2 )
In the whole network diagram, the point degree central potential C is expressed as
C = i = 1 n [ C R D m a x C R D ( i ) ] m a x { i = 1 n [ C R D m a x C R D ( i ) ] }
where C R D m a x is the maximum value of the point centrality of each node.
Second, the betweenness centrality index. Betweenness centrality reflects the node’s ability to control the communication among other nodes. If the point is not supportive of regional cooperation, it will affect the communication between other nodes. Let g j k ( i ) be the number of shortcuts that exist between node j and node k . Then, there is b j k ( i ) = g j k ( i ) / g j k , where b j k ( i ) denotes the probability that the node i is on the shortcut between node j and node k . The absolute betweenness centrality of node i , i.e., C A B = j n k n b j k , denotes the result after passing through all point pairs of nodes i in aggregate. The relative point degree centrality C R B ( i ) expression is noted as
C R B ( i ) = 2 C A B ( i ) C A B m a x
In the network diagram, the intermediate central potential is calculated as
C B = i = 1 n [ C R B m a x C R B ( i ) ] m a x { i = 1 n [ C R B m a x C R B ( i ) ] }
where C A B m a x and C R B m a x are the maximum values of the absolute intermediate degree and relative intermediate centrality of each node, respectively.
Third, the closeness centrality index. Closeness centrality of nodes is considered in terms of distance to the extent that nodes are not dependent on other nodes in their communication activities [76]. When the node i is closer to other nodes in the network, it is more likely to exchange information and resources with them, and this exchange is less dependent on other nodes “allowing it to pass”. Therefore, the absolute centrality of node i can be expressed as C A P = 1 j = 1 n d i j , which is the sum of the shortcut distances between that point and other points in the network, where d i j is the shortcut distance (the number of threads contained in the shortcut) between node i and node j . The relative centrality is related to the network size, i.e., C R P = n 1 C A P 1 = ( n 1 ) 1 j = 1 n d i j . In the star network, the closeness centrality potential can be expressed as
C C = i = 1 n [ C R P m a x C R P ( i ) ] ( n 1 ) ( n 2 ) / ( 2 n 3 )
where C R P m a x is the maximum value of the closeness centrality of each node.
Therefore, we calculate the natural gas supply chain length, and the results are shown in Figure 2.
Figure 2 illustrates the spatial evolution of the length of the natural gas supply chain from 2006 to 2020. The overall spatial distribution is characterized by high levels in the southeastern coastal and central regions and low levels in the northwestern and northeastern regions. Among them, the cities in Shaanxi and Hebei provinces, the Pearl River Delta region, and the Yangtze River Delta region have consistently maintained high levels of natural gas supply chain length. The main reason for the difference in natural gas supply chain length is that the development of industrial structure has a strong dependence on talent, capital, technology, and other factors. Eastern cities overall have a developed energy industry and transportation and have a higher ability to attract factors, thus the development of natural gas industry supply chain length is higher than that of central and western cities. Shaanxi and Hebei are the provinces with more developed military industry in China, strong scientific research strength of colleges and universities, and high development degree of natural gas supply chain. In general, the time trend of the national energy supply chain length has basically increased at a steady rate of growth, with the only disturbance being a certain degree of decline and pause from 2006 to 2009, which did not change the trend of increase. In general, the time trend of the length of the national energy supply chain has basically increased at a stable growth rate. The reason for that disturbance might have been the systemic risk impact caused by the US subprime mortgage crisis in 2008.
  • Digital industrialization
The level of digital industrialization (addvaluerate) is selected as the explanatory variable. The core industries of the digital economy from the Statistical Classification of the Digital Economy and its Core Industries (2021) are used as the sectoral classification of digital industrialization. On this basis, the sectors that include digital industrialization in the sectoral classification within the input–output table are stripped. Referring to the methods of Xu and Zhang (2020) [77] and Wang and Dong (2020) [78], the level of digital industrialization at the regional level is measured. We introduce the “digital industrialization adjustment coefficient“. The adjustment coefficient of digital industrialization is the proportion of the value added by digital industrialization in the industry to the total value added by the industry, which can be expressed by
ρ j l = I n d u s t r y   D i g i t a l   I n d u s t r i a l i z a t i o n   V a l u e   A d d e d T o t a l   i n d u s t r y   v a l u e   a d d e d
where ρ is the digital industrialization adjustment factor. Figure 3 shows the spatial distribution characteristics of digital industrialization.
Figure 3 illustrates the spatial evolution of digital industrialization development from 2006 to 2020. From the timeline, the digital economy development index scores of each province (autonomous region and municipality directly under the Central Government) have always maintained a development trend of rolling forward, except for the eastern coastal areas, Beijing, Shanghai, Guangdong and other traditional first-echelon areas; the digital economy development indexes of the provinces in North China, Central China, and Northeast China have all jumped to a certain extent at the spatial level. However, the overall pattern still reflects a strong “Matthew effect“, and the strongest situation (such as in Guangdong, Beijing, and Shanghai) has been maintained since the beginning. Second, in terms of the distribution pattern in geographic space, there is a strong stability in the situation that the digital economy development index score decreases from southeast to northwest, with the Heihe–Tengchong Line (the geographical boundary from Heihe River in Heilongjiang Province to Tengchong in Yunnan Province) as the boundary. These two major characteristics in time and space highlight the uneven and inadequate development of China’s digital economy, revealed in the process of generation and cultivation. From the perspective of exogenous comparative advantage, such as Xinjiang, Tibet, Qinghai, and other western provinces, in the level of population, natural environment, geographical location, market size, etc., are lagging provinces for better development of digital economy; from the perspective of endogenous comparative advantage, the above-mentioned provinces have long lagged behind other provinces in terms of talent-level indicators for the level of digital technology. The industrial structure between provinces in China has been distinctive under the original division of labor pattern. Some of the central and western provinces are labor-exporting provinces or resource-dependent economies, so it is difficult to transform the industrial structure digitally.
  • Control variables
In order to dissect the transmission mechanism of digital industrialization on energy supply chain length, i.e., whether digital industrialization can optimize energy supply chain length by improving foreign trade, accelerating technological innovation and optimizing industrial structure, we select foreign direct investment (fdi), per capita GDP (pcgdp), patent licensing (patlic), technology-market turnover (techcon), environmental management investment (pollucon) and industrial structure (iu) as control variables, by referring to existing studies [79,80,81].
Foreign direct investment (fdi): The ratio of the amount of actual foreign investment utilized by each region to the regional GDP is used as a proxy variable for foreign direct investment, such as in Hoffman et al. (2005) [82], Lu et al. (2022) [12], and Perkins et al. (2009) [83]. The level of foreign investment is expressed as a share of GDP compared to the actual amount of foreign investment used. FDI has contributed to the economic development of China and may affect the level of consumption-based economic growth.
Per capita GDP (pcgdp): The alleviation of income disparity, optimization, and upgrading of industrial structure are inseparable from economic growth. Economic growth can provide more market capacity for the development of industries [84], which is conducive to the adjustment and optimization of industrial structure. At the same time, it can increase jobs and increase the income of workers, while providing them with more employment options.
Patent licensing (patlic): Yang et al. (2022) [3], Gao (2022) [84], and Peng et al. (2020) [2] have analyzed patent licensing in detail. The number of patent applications in each province is reflected by taking the logarithm of the number of patent applications in a certain province in a certain year. The higher the value is, the stronger the regional technological innovation capacity is, and, accordingly, the higher the ability to promote technological innovation is.
Technology-market turnover (techcon): Considering that technology-market turnover reflects the exchange of technology goods in each provincial area [85,86] and that the sum of technology goods exchange is a more ideal indicator to measure the activity of technology market, we select technology-market turnover to measure the activity of technology market in each provincial area.
Environmental management investment (pollucon): With reference to Wu et al. (2021) [36], considering the availability of data, the investment in environmental pollution control is selected as the representative of investment in environmental pollution control.
Industrial structure (iu): Referring to Kuznets (1973) [87], we select the ratio of the added value of the tertiary industry to that of the secondary industry in each region to express it.

3.3. Data Description

The empirical study is based on panel data of 30 Chinese provinces (except Tibet, Hong Kong, Macao, and Taiwan) from 2006 to 2020. The original data are from the China Energy Statistical Yearbook, the annual data of National Bureau of Statistics by province, CSMER database, and China Environmental Statistical Yearbook. The data of digital industrialization in digital economy come from China Statistical Yearbook, China Industrial Economy Statistical Yearbook and China Tertiary Industry Statistical Yearbook. The data of other variables are obtained from China Statistical Yearbook. The descriptive statistics of the variables are shown in Table 1 and Figure 4. The results show that the mean value of natural gas supply chain length is 8.8301, the maximum value is 29.41, and the minimum value is only 0. The mean value of digital industrialization level is 0.0619, the maximum value reaches 0.1787, and the minimum value is only 0.02451. For the inter-provincial level, the results are consistent with the unbalanced development of China’s national situation.

4. Results

4.1. Benchmark Model Estimation

4.1.1. Testing

  • Model testing
Before the regression analysis, in order to avoid spurious regression, the panel data are first tested for stationarity. LLC is used to test whether the data have a unit root, and basically the test results significantly reject the null hypothesis, so the model does not have unit root. Then, the panel cointegration test is used to determine whether there is a long-run equilibrium between the variables, which shows that there is a long-run equilibrium relationship between each variable’s energy supply chain length and digital industrialization. The above tests indicate that the research panel data possess smoothness, which improves the reliability of the regression results. The test results are shown in Table 2. Meanwhile, the White test and BP test found that there is heteroskedasticity in the data, and we corrected the data by using the weighted least squares (WLS) method.
  • LR test
Figure 5 represents the LR statistics of the threshold estimation with the level of digital industrialization (addvaluerate) as the core variable. The vertical axis represents the value of the likelihood ratio function, and the dashed line represents the threshold value at the 95% confidence level. Among them, the confidence intervals of the first threshold of supply chain length, the confidence interval of the second threshold of supply chain length, and the confidence interval of the third threshold of supply chain length are represented in Figure 5. According to the likelihood ratio test formula proposed by Hansen, when L R ( γ ) > c ( θ ) , the original hypothesis is rejected. When θ = 5 % , the critical value of the LR statistic is 7.35. According to Figure 5, the single, double, and triple thresholds of the effect of the level of digital industrialization on the length of the natural gas supply chain pass the significance test. Therefore, the estimation results of the triple threshold are mainly explained below.

4.1.2. Preliminary Estimates

  • Benchmark results
Columns 1–3 of Table 3 report the results of the regressions using the mixed OSL, fixed effects model, and random effects model, respectively, to preliminarily investigate the effects of digital industrialization and each control variable on the length of the natural gas supply chain. The coefficients in the mixed OLS and random effects models for the level of digital industrialization are significantly negative, while the estimated coefficients in the fixed effects model are positive; however, the results are not significant, indicating that the level of digital industrialization and the length of the natural gas supply chain are negatively correlated and that the increase in digital industrialization level is conducive to shortening the length of the supply chain in the natural gas industry. For the control variables, the estimated coefficients of GDP per capita, patent licensing, and technology-market turnover are significantly positive, indicating that the increase in GDP per capita, patent licensing, and technology-market turnover lengthens the supply chain length of the natural gas industry. FDI significantly shortens the supply chain length of natural gas under the estimation of mixed OSL and random effects model, which is not significant in the estimation of the fixed effects model. Environmental governance investment has a significantly negative estimated coefficient in the mixed OSL, but the results are not significant in the fixed effects and random effects models. Industry structure has a significantly positive estimated coefficient in the mixed OSL, but the results are not significant in the fixed effects and random effects models.
Table 3 shows that the threshold values are 9.5183, 11.9329, and 12.7471, and the effect of digital industrialization on the natural gas supply chain shows a nonlinear effect when the level of digital industrialization is in different intervals. From the results of the research, it is concluded that when the level of digital industrialization (advdvaluerate) is below the first threshold value of 9.5183, its coefficient estimate is −48.87, and the result is not significant; when the level of digital industrialization (advdvaluerate) is above the first threshold value of 9.5183 but below the second threshold value of 11.9329, its coefficient estimate increases from −48.87; when the digital industrialization level (advdvaluerate) is higher than the second threshold value of 11.9329 and lower than the third threshold value of 12.7471, its coefficient estimate increases from −1.223 to 23.53, which is positively correlated at the 10% confidence level; when the digital industrialization level (advdvaluerate) is higher than the third threshold value of 12.7471, its coefficient estimate increases from −1.223 to 23.53, which is positively correlated at the 10% confidence level; and when the level of digital industrialization (addvaluerate) is higher than the third threshold value of 12.7471, its coefficient estimates increase from 23.53 to 51.45, which is positively correlated at the 10% confidence level. Overall, the relationship between the digital industrialization level and the natural gas supply chain length is nonlinear, and, when the estimated coefficient of the digital industrialization level is below the first threshold or above the first threshold and below the second threshold, its negative effect on the natural gas supply chain length is not significant; when the estimated coefficient of digital industrialization level is between the second threshold and the third threshold or above the third threshold, its positive effect on the natural gas supply chain length is not significant. The positive effect on the length of the natural gas supply chain is more significant when the estimated coefficient of the digital industrialization level is between the second threshold and the third threshold or above the third threshold.
In summary, there is no absolute linear relationship between the digital industrialization level and the length of the natural gas supply chain. The technology-market turnover is the key for the level of digital industrialization to promote the length of the energy supply chain, while the digital industrialization to promote the length of the natural gas supply chain also depends on the increase in the number of patents granted, so this result verifies Hypothesis 1.
  • Threshold effect model test results
In order to ensure the precision of the threshold estimation and study the threshold characteristics of the digital industrialization level on the length of the natural gas supply chain, the bootstrap method of Hansen (1999) [88] is adopted to determine the threshold number of the model, and the single threshold, double threshold, and triple threshold tests are carried out successively to obtain the F statistics, as shown in Table 4.
As can be seen from Table 4, the single threshold effect is significant at the 10% confidence level, the double threshold effect is significant at the 5% confidence level, and the triple threshold effect is significant at the 10% confidence level. This indicates that the effect of the digital industrialization level on the length of the natural gas supply chain is not a simple linear relationship and that there is a significant triple-threshold characteristic between them. Based on the principle of moving from complexity to simplicity, the triple-threshold effect model is mainly analyzed. The threshold values of the digital industrialization level effect on the length of the natural gas supply chain are 9.5183, 11.9329 and 12.7471, respectively. Based on this, we construct a triple threshold model with the digital industrialization level as the threshold variable.

4.2. Description of Related Measurement Issues

In the previous section, static panels were used to examine the impact of digital industrialization development on the length of the natural gas supply chain. In order to ensure the robustness of the conclusion, we further adopt the dynamic panel model to test the robustness of the benchmark regression by introducing a level equation, while conducting LR tests for the omitted variables to reduce the estimation error.
  • Dynamic change
We draw on Peng and Xiao’s (2021) [86] treatment to conduct the threshold effect test to determine the existence and significance of the threshold effect, the number of thresholds, the threshold value, and the corresponding econometric model. Table 3 and Table 4 report the results of the threshold tests and threshold estimates for the level of digital industrialization and each dimensional index. The estimation results of the threshold values and confidence intervals show that the identification effect of the threshold values is more significant. Furthermore, the authenticity of the threshold estimate is tested. The method proposed by Hansen (1999) [88] is used to calculate the different threshold values and their corresponding likelihood ratio test statistics.
Hansen (2000) [89] argued that the threshold variable x i can either be a regressor in the explanatory variables or can be used as an independent threshold variable. While panel threshold models have been widely used in empirical studies, Hansen’s (1999) [88] model was static; in addition, fixed effects regression estimation requires that the covariates are strong exogenous variables and that the estimates are consistent. However, strong exogeneity can be restrictive in many practical applications. Therefore, the model is extended to a dynamic panel model. A dynamic panel threshold model is assumed as follows:
y i t = x i t β + ( 1 , x i t ) δ 1 { q i t > γ } + μ i + ε i t
where i = 1 , , n ; t = 1 , , T ; x i t may contain lagged dependent variables, i.e., x i t is the lag of Y , and q i t is the threshold variable.
Second, the threshold model is calculated. The reasonableness of the threshold effect is tested with the estimated threshold value, i.e., whether the threshold effect exists and whether the threshold value is equal to the true value. The results are shown in Figure 6.
  • Omitted variables
Since there are multiple control variables and we cannot input them all into the model for calculation, we use the treatment of omitted variables for endogeneity testing. The omitted variable is related to both the independent variable and the dependent variable. Figure 7 represents the effect of the level of digital industrialization on the length of the natural gas supply chain after the gradual addition of control variables. Figure 7a represents the LR test with the addition of one control variable, Figure 7b represents the LR test with the addition of two control variables, and so on, up to Figure 7f, which represents the LR test with the addition of six control variables. The results show that all three thresholds pass the significance test.

4.3. Heterogeneity Analysis

  • Industry segmentation
By subdividing the core variable digital industrialization level into four sub-industries: infrastructure, technology and application, transaction, and media. Figure 8 represents the effect of the digital industrialization level on the length of the natural gas supply chain with infrastructure, technology and applications, transaction, and media as the threshold variables for the LR test. Among them, the triple threshold with infrastructure and technology and applications as threshold variables fails the significance test, while the triple threshold with transaction and media as threshold variables passes the significance test.
Column (3) of Table 5 indicates that the triple thresholds are 9.5183, 11.9661, and 12.9687 when transaction is the threshold variable. The coefficient of influence is −1439.5 at the 95% confidence level. The absolute value of the impact coefficient gradually decreases, indicating that the negative effect on the length of the supply chain in the natural gas industry gradually diminishes as the level of digital industrialization increases.
Column (4) of Table 5 indicates that the triple thresholds are 9.2419, 11.6759, and 12.6363 when media is the threshold variable. When in the first threshold interval, the impact coefficient is −3715.7, which is significant at the 90% confidence level; and in the fourth threshold interval, the impact coefficient is 85.55, which is significant at the 95% confidence level. The impact coefficient changes from negative to positive, indicating that the development of digital industrialization level at the early stage has a negative effect on the length of the supply chain in the natural gas industry. However, with the further improvement of the digital industrialization level, digital industry not only promotes its own scale expansion but also promotes the co-construction and sharing of network infrastructure. Digital industrialization promotes the transformation of the traditional industrial economy to an intelligent industrial economy, greatly reduces social transaction costs, and improves the efficiency of the optimal allocation of resources, thus promoting the length of the natural gas supply chain.
The results suggest that the impact of digital industrialization on the length of the natural gas supply chain may change in a jump-like manner, rather than linearly in the traditional sense. This supports Hypothesis 1.
  • Different regions
The estimation results for the sample of digital industrialization levels are likely to depend on the performance of certain samples in a single observation. There are differences in the level of digital industrialization due to the huge regional development differences in digital development in China. The digitalization level in the east is more perfect, which is more affected by the externality of research and development achievements. Meanwhile, the intensity of the demand for innovation and development is higher, and the development demand for digital industrialization is higher, so the impact on the length of the natural gas supply chain is also different. To further discuss the impact of different geographical characteristics on the level of digital industrialization, the digital industry is divided into eastern, central, western, and northeastern regions to observe the performance of the threshold regression model.
As Figure 9 shows, the threshold effect of the level of digital industrialization on the length of the natural gas supply chain is partially significant when limiting the sample regions. The single threshold, double threshold, and triple threshold effects are significant for the eastern, central, and western regions, while the triple threshold for the northeastern region does not pass the significance test.
Column (1) of Table 6 shows that the triple thresholds for the eastern region are 11.3971, 12.7471, and 12.7011. When the digital industrialization level in the eastern region is within the fourth interval, that is, greater than the third threshold value, the influence coefficient is 29.56, which is significant at the 95% confidence level.
Column (2) shows that the triple thresholds for the central region are 9.3293, 11.0862 and 11.7497. When the digital industrialization level is in the third interval, the impact coefficient is −141.9, which is significant at the 95% confidence level. When the digital industrialization level is in the fourth interval, the impact coefficient is 59.45, which is significant at the 95% confidence level. The coefficient of influence changes from negative to positive, indicating that the effect of the level of digital industrialization on the length of the natural gas supply chain changes from a negative to a positive correlation. This indicates that the increase in the level of digital industrialization when the level of digital industrialization crosses the third threshold is beneficial to extend the supply chain length in the natural gas industry.
Column (3) shows that the triple threshold effect for the western region has triple threshold values of 9.5183, 11.0021, and 12.5025. When the level of digital industrialization in the western region is within the first interval, the impact coefficient is −208.5, which is significant at the 95% confidence level. When the level of digital industrialization is within the second interval, the impact coefficient is −126.9, which is significant at the 95% confidence level. When the level of digital industrialization is within the fourth interval, the impact coefficient is 72.14, which is significant at the 99% confidence level. When the digital industrialization level is in the fourth interval, the coefficient of influence is 72.14, which is significant at the 99% confidence level.
The results indicate that the level of digital industrialization has a significantly stronger contribution to the length of the natural gas supply chain in the western region than in other regions. Since most of the eastern enterprises are located in the developed coastal economic level, they have a high level of active innovation activities, a high demand for product technology innovation, and a high incentive to increase R&D investment. In addition, the types of energy enterprises are mostly new-energy and technology-oriented, and their scale is smaller than that of the traditional energy industry, so it is difficult to bear the consequences of the R&D results being copied and stolen by others. The western region is more backward in economy, less developed in infrastructure, and lagging in development, mostly relating to the coal mining industry and basic manufacturing industries, which still following the traditional economic development model that relies on land, infrastructure construction, pollution, and R&D. Digital industrialization in the western region has a certain time lag. The development of digital industrialization at this stage indirectly promotes the growth of the natural gas supply chain by promoting R&D investment [86], which in turn promotes technological progress. This supports Hypothesis 2.
  • Different time periods
The development of digital industrialization is divided into three periods: the 11th Five-Year Plan period (see Figure 10a), the 12th Five-Year Plan period (see Figure 10b), and the 13th Five-Year Plan period (see Figure 10c). The results show that there is a significant triple threshold effect in the 11th and 12th Five-Year Plan periods, while the 13th Five-Year Plan period fails the test.
Column (1) of Table 7 shows that during the 11th Five-Year Plan period, the triple threshold values are 10.8825, 11.9354, and 12.1439. When the digital industrialization level is in the first interval during the 11th Five-Year Plan period, the impact coefficient is 215.2, which is significant at the 99% confidence level. When the digital industrialization level is in the second interval, the impact coefficient is 197.3, which is significant at the 99% confidence level. When the digital industrialization level is in the third interval, the impact coefficient is 225.0, which is significant at the 99% confidence level. When the digital industrialization level is in the fourth interval, the impact coefficient is 160.9, which is significant at the 95% confidence level. When the digital industrialization level is in the fourth interval, the influence coefficient is 160.9, which is significant at the 95% confidence level.
Column (2) shows that during the 12th Five-Year Plan period, the triple threshold values are 9.1955, 10.5659, and 13.2504. When the digital industrialization level is in the second interval, the impact coefficient is −98.50, which is significant at the 95% confidence level. When the digital industrialization level is in the fourth interval, the impact coefficient is 66.48, which is significant at the 95% confidence level.

4.4. Robustness Discussion

  • Replacement indicators
The explanatory variable of this article, energy supply chain length, is a composite indicator and is calculated based on the weights of each province. Therefore, in order to verify the robustness of the conclusions of this article, the explanatory variable is replaced by the relative length of the supply chain, and the data are obtained from the statistical yearbooks of each province. The larger the value of this indicator is, the higher the relative level of the energy supply chain length development is. The direction of the regression coefficients of the test results is the same as that of the full sample regression results, and the significance also remains basically the same, indicating that the conclusions of this article have good robustness and reliability.
  • Sample of key positions
Considering that the sample used in this article is the sample data of the natural gas industry at the provincial level, Beijing, Tianjin, Shanghai, and Chongqing, as four municipalities directly under the Central Government, have data values that do not differ much from the provincial level data. In order to ensure the robustness of the results, the samples of the above four municipalities are excluded, and the impact of the level of digital industrialization on the supply chain length of the energy industry is tested again, which shows that the results are still robust.
  • Robustness test
To ensure the reliability of the empirical results, we again divide the sample into eastern, central, western, and northeastern parts and repeat the above empirical approach. The test results show that the core explanatory variables are still able to influence the explanatory variables and are significantly positive at the 1%, 5% and 10% levels, thus further verifying the reliability of the empirical results.

5. Discussion

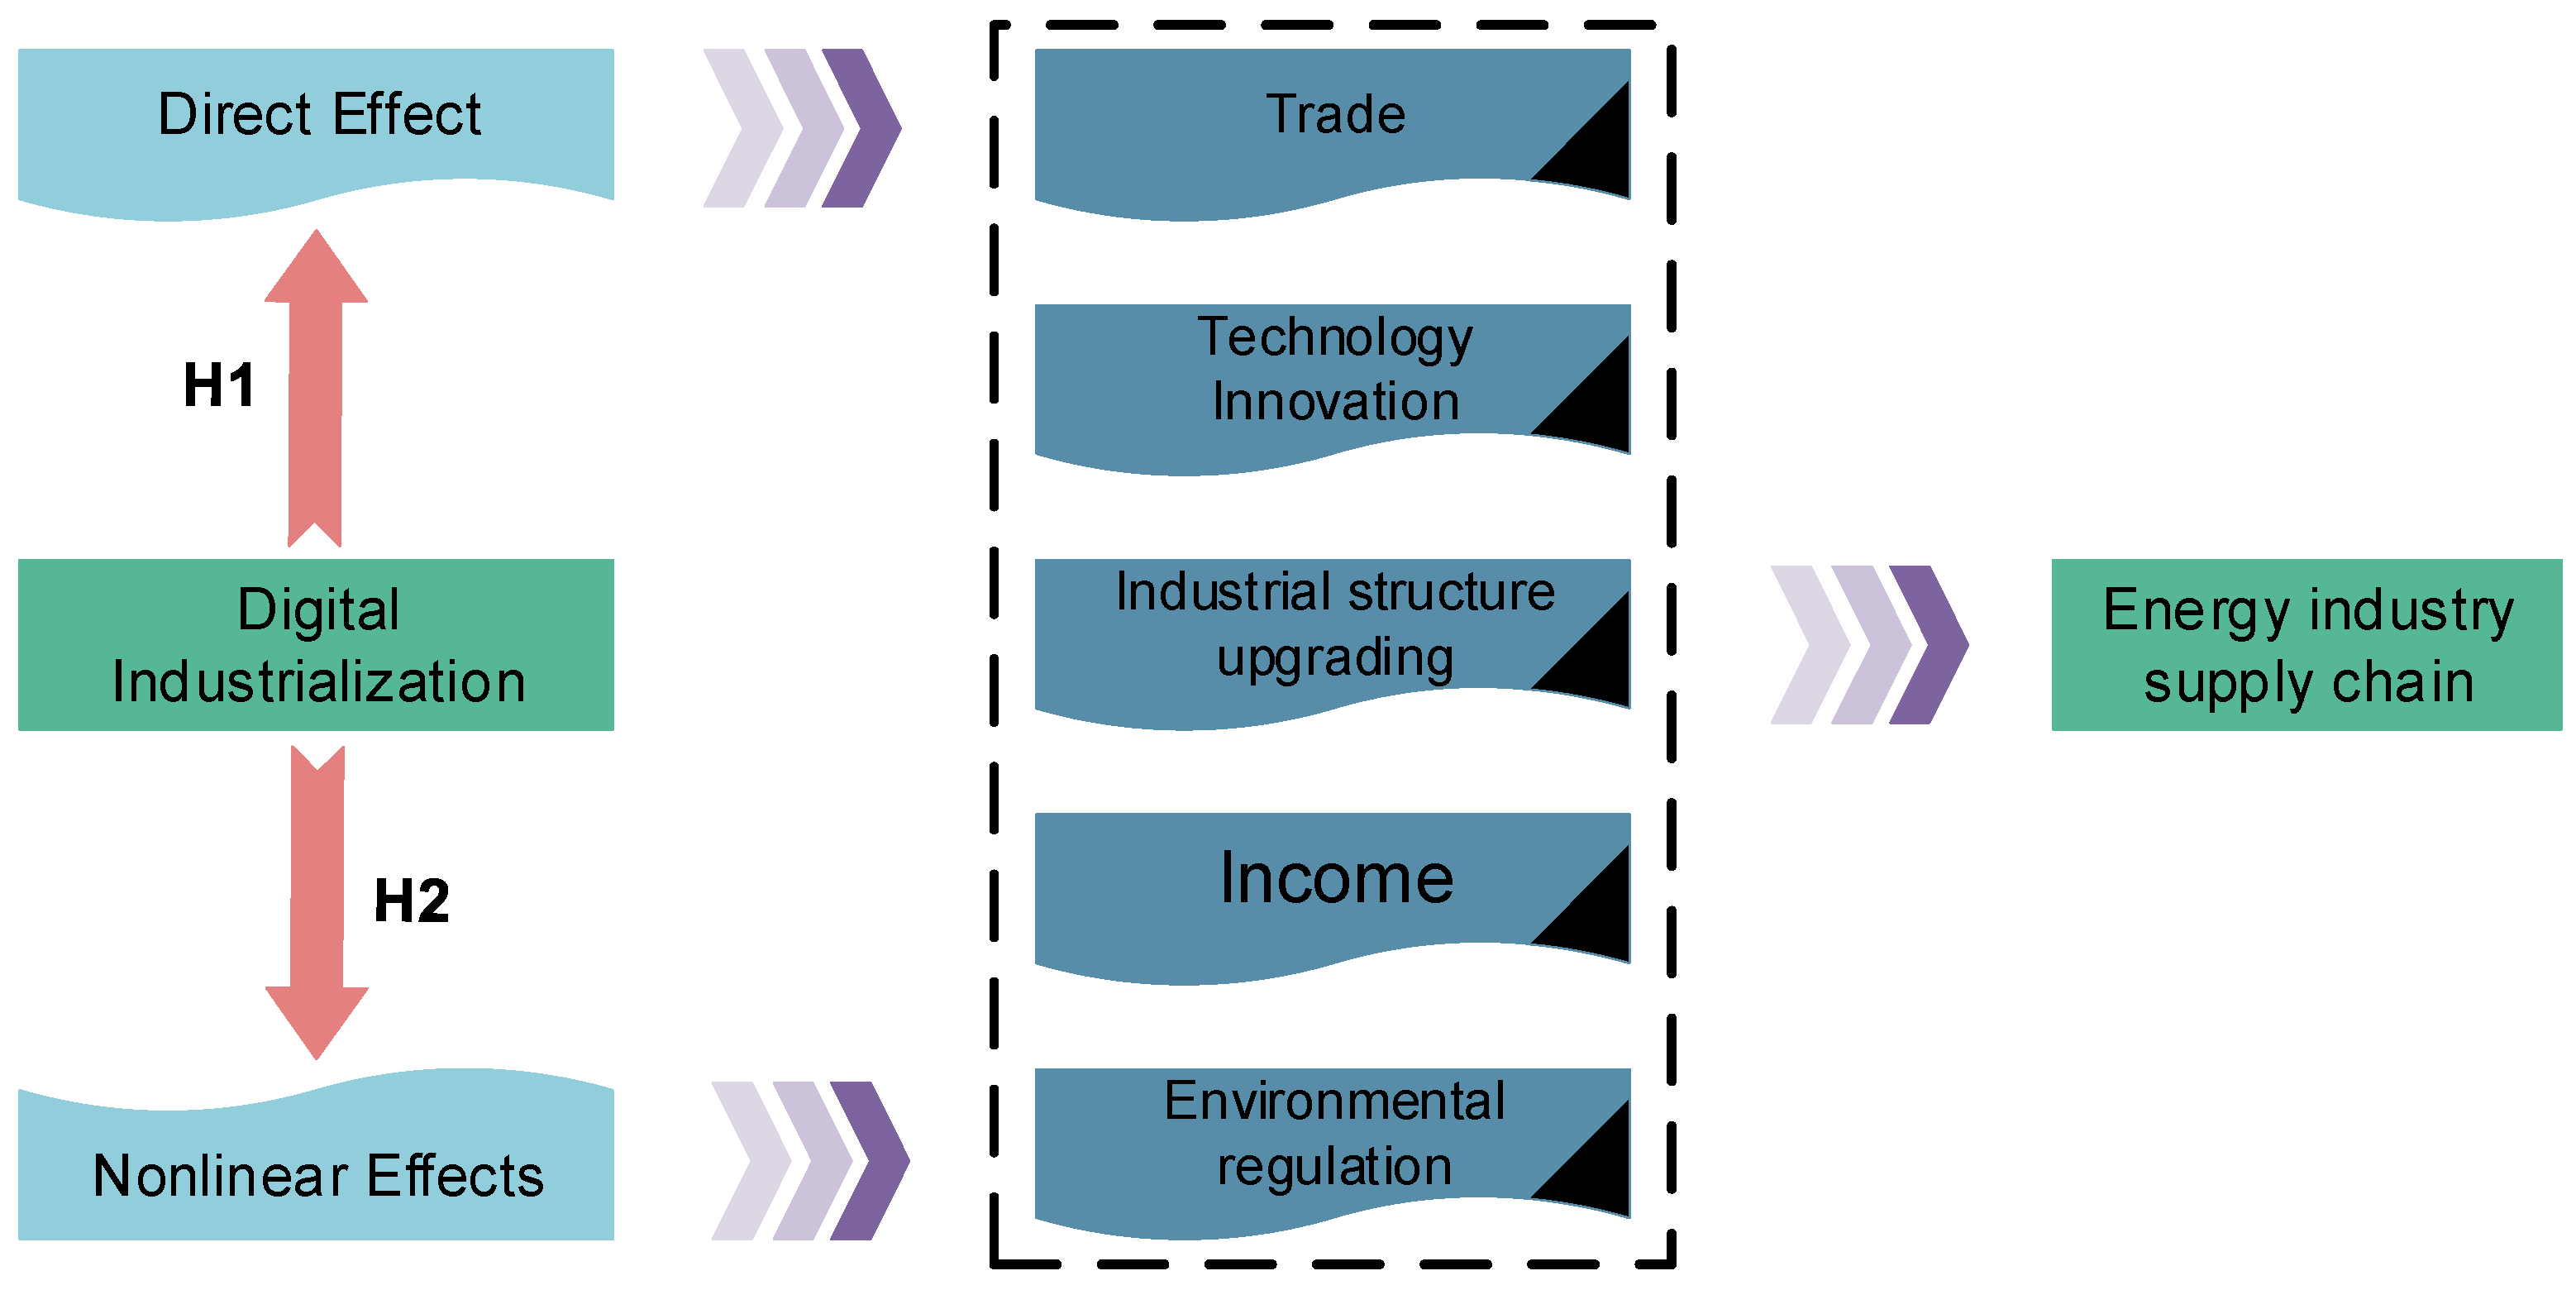
The above basic estimation results reveal that digital industrialization can improve the energy supply chain length. Next, combined with the specific performance of digital industrialization development in economic reality, we further explore the ways through which digital industrialization enhances the length of the energy supply chain and verify the inner mechanism of digital industrialization, empowering the length of the energy supply chain. To this end, we use a panel regression model to explore the transmission path of digital industrialization on the supply chain length (CENTRA) in the natural gas industry and construct the following regression equation [90].
ln C E N T R A i t = α 0 + α 1 ln A D V i t + α 2 M i t × ln A D V i t + α 3 F T i t + α 4 T I i t + α 5 U I S i t + α 6 D P I i t + α 7 R E G U i t + θ 1 C O N T i t + φ i + μ t + ε i t
where i stands for province and t stands for year. C E N T R A i t denotes the supply chain length of province i in year t ; A D V i t indicates the level of digital industrialization in province i in year t ; M denotes the mechanism variables, including foreign trade ( F T ), technological innovation ( T I ), industrial structure upgrading ( U I S ), disposable income ( D P I ), and environmental regulation ( R E G U ); φ i is the province fixed effect that does not vary over time; μ t is the time fixed effect; ε i t is the classical error term; and the control variables ( C O N T i t ) control for other factors that may affect the supply chain length ( C E N T R A ).
  • Foreign trade (FT)
As shown in column (1) of Table 8, the coefficients of the digital industrialization development level (addvdvaluerate) are all insignificant, which indicates that the improvement of digital industrialization development level does not significantly enhance foreign trade. At present, the development of digital industrialization is not effective in promoting foreign trade, based on the actual situation in China. Although the degree of openness of China’s foreign trade is gradually being liberalized, the demand for foreign trade differs from region to region, and foreign trade policies also differ. Not many digital industries have been introduced in the central and western regions, and most of them are small in scale and low in technology, so the quality of investment attracted is not high, which makes it difficult to develop foreign trade. Although the consumer Internet represented by e-commerce has fully compressed the arbitrage space under market segmentation and information asymmetry, it is still difficult to fundamentally break down the inter-regional barriers caused by administrative segmentation and local protectionism, which results in the overall insignificant impact of digital industrialization development on foreign trade.
  • Technological innovation (TI)
As shown in column (2) of Table 8, the coefficient of the level of digital industrialization development (addvaluerate) is significant at the 1% level, indicating that the increase in the level of digital industrialization development will significantly improve the level of technological innovation. The development of digital industrialization eases the financing constraints of innovation projects and improves the level of regional intellectual property protection, providing a favorable external environment for regional innovation activities. At the same time, the innovation of digital industry enhances the degree of market competition in the region, stimulating the traditional manufacturing sector to introduce and imitate advanced technologies and accelerate technological innovation. The emerging industry sector will also actively develop new technologies to maintain its leading position, which will lead to a new round of technology spillover and continuously improve the technology level and productivity of the manufacturing sector. The digital industry has broken the barriers of knowledge and technology spillover in terms of spillover channels, ways, speed, and scope, promoting the transformation of technology spillover from point-to-point unidirectional diffusion to point-to-plane multi-dimensional diffusion. In the process of spillover, new elements are constantly integrated for the self-updating and integration of technology, which greatly improve the level of technological innovation.
  • Industrial structure upgrading (UIS)
As shown in column (3) of Table 8, the coefficient of the development level of digital industrialization (addvaluerate) is significant at the 1% level, indicating that the increase in the development level of digital industrialization will significantly promote the upgrading of industrial structure. The development of digital industry will impact the traditional economy, and the negative effect on the demand structure and consumption structure is greater than the positive effect, which will bring about innovation in consumption content and consumption patterns, as the level of development of digital economy increases. In addition, the technical support, training, production equipment, and other services provided by digital service providers also improve the production technology and management skills of the manufacturing industry in the region through forward linkage. In the era of the digital economy, manufacturing enterprises continue to divest non-core businesses and transfer production services to professional third-party institutions. Producer services provide the manufacturing industry with all-round support of technical consultation, product project approval, process optimization and marketing services, and accelerate the deep integration of manufacturing and producer services. Industrial integration improves the industrial efficiency and value-add of the manufacturing industry by extending the industrial chain and optimizing the value chain, which promotes the increasing technical complexity of manufacturing exports.
  • Disposable income (DPI)
As shown in column (4) of Table 8, the coefficient of the level of digital industrialization development (addvdvaluerate) is significant at the 1% level, indicating that the increase in the level of digital industrialization development will significantly increase disposable income. During the development of digital industries, many new industries, new models, and new employment have emerged, allowing more people to have the opportunity to work hard and become wealthy. Digital industry can promote economic growth, drive small and medium-sized enterprises to start their own businesses, absorb jobs, and benefit many small and medium-sized enterprises as well as the people who should benefit from them. Unlike traditional information technology, which focuses on information process technology, digitalization focuses on building business digitalization, so the main responsibility extends from the IT department to almost all business departments. As a result, the connotation and extension of the occupation of people from all walks of life changes. At the same time, the source of people’s income, the content and intensity of work, the amount of income, and the social security from having outside income also change, thus affecting the income distribution relationship.
  • Environmental regulation (REGU)
As shown in column (5) of Table 8, the coefficient of the digital industrialization development level (addvaluerate) is significant at the 5% level, indicating that the increase in the digital industrialization development level will significantly enhance environmental regulation. On the one hand, the new kinetic energy and new ways brought by the digital economy can control the resulting energy waste and avoid causing new environmental pollution; on the other hand, the popularization of the Internet and digital technology has broadened the channels for all social entities to participate in environmental governance, effectively improving the environmental governance capacity and the effect of environmental regulation and reducing the implementation cost and difficulty of environmental regulation. The cultivation of the digital economy industry needs to be organically combined with the healthy development of capital, which highlights the important regulatory role of the legal environment within it.

6. Conclusions and Policy Implications

In this article, we analyze the impact of the level of digital industrialization on the energy industry through theoretical analysis and explore the mechanism of action between variables. A panel threshold model is constructed on this basis. The results of the study show that there is a significant promotion effect on the length of the energy supply chain in areas with a high level of digital industrialization. When the digital industrialization level is taken as the threshold variable, the development of the digital industrialization level has a threshold effect on the length of the energy supply chain. With the improvement of the digital industrialization level, the promotion effect on the length of the supply chain in the energy industry has been significantly improved. From the perspective of industry segmentation, the development of digital industrialization in the four sub-industries of infrastructure, technology and application, trading and media has a negative effect on the length of the energy supply chain in low-level areas, while it has a positive effect on the length of the supply chain in high-level areas. From the perspective of regional development in eastern, central, and western China, digital industrialization has different effects on the supply chain length at different development levels, with negative effects at low development levels and positive effects at high development levels. In terms of different development periods, there are some differences, which are mainly reflected by the following aspects: During the 11th Five-Year Plan period, the level of digital industrialization has a positive effect on the length of the supply chain. During the 12th Five-Year Plan period, the impact of digital industrialization level development on the supply chain length changes from a negative effect to a positive effect. During the 13th Five-Year Plan period, the development of the digital industrialization level has a negative effect on the length of the supply chain.
Based on the above findings, the following policy recommendations are made:
First, it is recommended to promote the construction of new digital infrastructure and consolidate the foundation of the digital development of energy. Digital infrastructure is an important foundation and prerequisite for ensuring the safe storage and secure operation of data elements in the process of energy’s digital transformation. The construction of new digital infrastructure should be planned in an integrated manner, taking into account regional coordinated development, and promoting new digital infrastructure to the central and western regions to make up for the regional “digital divide“ caused by uneven development in the early stage. Enterprises carry out digital transformation, strengthen public services for digital transformation, and lower the threshold of digital transformation. In addition, we should strengthen the construction of digital society and digital government to regulate the energy industry, facilitate its development, and build a new ecology of the digital economy for energy industry. At the same time, we should deepen the pilot demonstration of the integration and development of the digital energy industry, digital society, and digital government, and cultivate new models of cross-domain integration and application of new energy products and services. At present, the “digital divide“ between China’s regions is large, and the development of digital industry between eastern, central and western regions shows a trend of decreasing gradient. On the one hand, coastal areas should moderately advance the construction of digital infrastructure, promote the deep integration of digital technology and the real economy, stimulate cross-border collaboration between industries, and develop richer application scenarios. On the other hand, the central and western regions should take advantage of the amplification, superposition, and multiplier effects of digital technology to enhance the development space of traditional energy industries, accelerate the integration of various markets and extend the energy supply chain.
Second, it is suggested that the government should improve the digital transformation of the energy supply chain industry norms to ensure that all the work of digital construction is based on the law. Relevant departments should introduce policies centered on digitalization to promote the digital transformation of energy enterprises and improve industrial infrastructure capacity and supply chain modernization. The Ministry of Science and Technology, the People’s Bank of China and other departments should also introduce relevant policies to support digital transformation in terms of science and technology innovation, improve regional innovation levels and provide new talents for energy transformation. At the same time, the government should establish robust laws and regulations related to the security of data elements in the energy industry, and further clarify the boundaries of the rights and responsibilities of the subjects related to the construction of energy digitization. In addition, we should accelerate the establishment of safety standards for energy data resource property rights, transaction circulation, transmission protection, and other aspects. In the process of promoting industrial structure upgrades and energy transformation, on the one hand, local governments should also introduce more digital transformation content according to local conditions and stimulate relevant energy industries to carry out innovative reforms in order to attract more technical talents for energy’s digital transformation. On the other hand, governments around the world should cooperate to create an integrated digital economy smart service platform, strengthen inter-regional collaboration among energy companies, and encourage the exchange and sharing of advanced technologies among different companies.

Author Contributions

Conceptualization, J.P.; methodology, J.P.; software, J.P.; validation, J.P., H.C. and S.F.; formal analysis, J.P. and H.C.; investigation, H.C., L.J. and J.T.; resources, J.P.; data curation, H.C., L.J. and J.T.; writing—original draft preparation, H.C.; writing—review and editing, J.P., S.F. and J.T.; visualization, J.P.; supervision, L.J.; funding acquisition, J.P., H.C., L.J., S.F. and J.T. All authors have read and agreed to the published version of the manuscript.

Funding

This research was funded by the MOE (Ministry of Education in China) Project of Humanities and Social Sciences and Soft science research project of Science (No. 18YJCZH029). The authors would also like to acknowledge financial support from the youth talent project of Wuhan-Shuguang project (No. 2022010801020365), Research Fund Project of Wuhan Institute of Technology (No. K202248), the Statistical Research Project of National Bureau of Statistics in China (No. 2022LY057), Social Science Foundation of Hubei Province (No. HBSK2022YB336, HBSK2022YB339) and the 14th Graduate Education Innovation Fund Project of Wuhan Institute of Technology (CX2022408).

Data Availability Statement

The data presented in this study are available on request from the corresponding author.

Acknowledgments

We are grateful for the Energies editorial office and the comments and suggestions from the editor and anonymous reviewers who helped improve the paper. We would also like to express our gratitude to the Ministry of Education in China, Knowledge Innovation Program of Wuhan Shuguang Project, and the Research Fund Project of Wuhan Institute of Technology for providing funding support.

Conflicts of Interest

The authors declare no conflict of interest.

References

  1. Peng, J.; Xiao, J.; Wen, L.; Zhang, L. Energy industry investment influences total factor productivity of energy exploitation: A biased technical change analysis. J. Clean. Prod. 2019, 237, 117847. [Google Scholar] [CrossRef]
  2. Peng, J.; Xiao, J.; Zhang, L.; Wang, T. The impact of China’s ‘atmosphere ten articles’ policy on total factor productivity of energy exploitation: Empirical evidence using synthetic control methods. Resour. Policy 2020, 65, 101544. [Google Scholar] [CrossRef]
  3. Yang, B.; Liu, B.; Peng, J.; Liu, X. The impact of the embedded global value chain position on energy-biased technology progress: Evidence from China’s manufacturing. Technol. Soc. 2022, 71, 102065. [Google Scholar] [CrossRef]
  4. Kjaer, L.L.; Pigosso, D.C.; McAloone, T.C.; Birkved, M. Guidelines for evaluating the environmental performance of product/service-systems through life cycle assessment. J. Clean. Prod. 2018, 190, 666–678. [Google Scholar] [CrossRef]
  5. Usman, A.; Ozturk, I.; Hassan, A.; Zafar, S.M.; Ullah, S. The effect of ICT on energy consumption and economic growth in South Asian economies: An empirical analysis. Telemat. Inform. 2021, 58, 101537. [Google Scholar] [CrossRef]
  6. Su, J.; Su, K.; Wang, S. Does the digital economy promote industrial structural upgrading?—A test of mediating effects based on heterogeneous technological innovation. Sustainability 2021, 13, 10105. [Google Scholar] [CrossRef]
  7. Zou, C.; Zhao, Q.; Zhang, G.; Xiong, B. Energy revolution: From a fossil energy era to a new energy era. Nat. Gas Ind. B 2016, 3, 1–11. [Google Scholar] [CrossRef]
  8. Guo, Q.; Wu, Z.; Jahanger, A.; Ding, C.; Guo, B.; Awan, A. The spatial impact of digital economy on energy intensity in China in the context of double carbon to achieve the sustainable development goals. Environ. Sci. Pollut. Res. 2022, 1–17. [Google Scholar] [CrossRef]
  9. Zhang, J.; Lyu, Y.; Li, Y.; Geng, Y. Digital economy: An innovation driving factor for low-carbon development. Environ. Impact Assess. Rev. 2022, 96, 106821. [Google Scholar] [CrossRef]
  10. Zhang, W.; Zhou, H.; Chen, J.; Fan, Z. An empirical analysis of the impact of digital economy on manufacturing green and low-carbon transformation under the dual-carbon background in China. Int. J. Environ. Res. Public Health 2022, 19, 13192. [Google Scholar] [CrossRef]
  11. Zhang, Y.; Peng, J.; Ding, Z. A study on the influencing factors of total factor productivity of cultivated land resource utilization: Evidences from direct influence and spatial spillover in China. Int. J. Low-Carbon Technol. 2022, ctac101. [Google Scholar] [CrossRef]
  12. Lu, H.; Peng, J.; Lu, X. Do factor market distortions and carbon dioxide emissions distort energy industry chain technical efficiency? A heterogeneous stochastic frontier analysis. Energies 2022, 15, 6154. [Google Scholar] [CrossRef]
  13. Zhang, L.; Fu, S.; Tian, J.; Peng, J. A review of energy industry chain and energy supply chain. Energies 2022, 15, 9246. [Google Scholar] [CrossRef]
  14. Wang, J.; Wang, B.; Dong, K.; Dong, X. How does the digital economy improve high-quality energy development? The case of China. Technol. Forecast. Soc. Chang. 2022, 184, 121960. [Google Scholar] [CrossRef]
  15. Wang, J.; Ma, X.; Zhang, J.; Zhao, X. Impacts of digital technology on energy sustainability: China case study. Appl. Energy 2022, 323, 119329. [Google Scholar] [CrossRef]
  16. Olan, F.; Arakpogun, E.O.; Jayawickrama, U.; Suklan, J.; Liu, S. Sustainable supply chain finance and supply networks: The role of artificial intelligence. IEEE Trans. Eng. Manag. 2022, 1–16. [Google Scholar] [CrossRef]
  17. Queiroz, M.M.; Ivanov, D.; Dolgui, A.; Fosso Wamba, S. Impacts of epidemic outbreaks on supply chains: Mapping a research agenda amid the COVID-19 pandemic through a structured literature review. Ann. Oper. Res. 2022, 319, 1159–1196. [Google Scholar] [CrossRef]
  18. Kim, H.K.; Lee, C.W. Relationships among healthcare digitalization, social capital, and supply chain performance in the healthcare manufacturing industry. Int. J. Environ. Res. Public Health 2021, 18, 1417. [Google Scholar] [CrossRef]
  19. Li, G.; Hou, Y.; Wu, A. Fourth industrial revolution: Technological drivers, impacts and coping methods. Chin. Geogr. Sci. 2017, 27, 626–637. [Google Scholar] [CrossRef]
  20. Maroufkhani, P.; Desouza, K.C.; Perrons, R.K.; Iranmanesh, M. Digital transformation in the resource and energy sectors: A systematic review. Resour. Policy 2022, 76, 102622. [Google Scholar] [CrossRef]
  21. Markovic, S.; Koporcic, N.; Arslanagic-Kalajdzic, M.; Kadic-Maglajlic, S.; Bagherzadeh, M.; Islam, N. Business-to-business open innovation: COVID-19 lessons for small and medium-sized enterprises from emerging markets. Technol. Forecast. Soc. Chang. 2021, 170, 120883. [Google Scholar] [CrossRef]
  22. Iglesias, O.; Markovic, S.; Bagherzadeh, M.; Singh, J.J. Co-creation: A key link between corporate social responsibility, customer trust, and customer loyalty. J. Bus. Ethics 2020, 163, 151–166. [Google Scholar] [CrossRef]
  23. Belhadi, A.; Kamble, S.; Jabbour, C.J.C.; Gunasekaran, A.; Ndubisi, N.O.; Venkatesh, M. Manufacturing and service supply chain resilience to the COVID-19 outbreak: Lessons learned from the automobile and airline industries. Technol. Forecast. Soc. Chang. 2021, 163, 120447. [Google Scholar] [CrossRef]
  24. Moutray, C. In recovery mode: Manufacturers try to bounce back after COVID-19 disruptions. Bus. Econ. 2020, 55, 240–252. [Google Scholar] [CrossRef]
  25. Rapaccini, M.; Saccani, N.; Kowalkowski, C.; Paiola, M.; Adrodegari, F. Navigating disruptive crises through service-led growth: The impact of COVID-19 on italian manufacturing firms. Ind. Mark. Manag. 2020, 88, 225–237. [Google Scholar] [CrossRef]
  26. Ma, H.; Jia, X.; Wang, X. Digital transformation, ambidextrous innovation and enterprise value: Empirical analysis based on listed Chinese manufacturing companies. Sustainability 2022, 14, 9482. [Google Scholar] [CrossRef]
  27. Borges, A.F.; Laurindo, F.J.; Spínola, M.M.; Gonçalves, R.F.; Mattos, C.A. The strategic use of artificial intelligence in the digital era: Systematic literature review and future research directions. Int. J. Inf. Manag. 2021, 57, 102225. [Google Scholar] [CrossRef]
  28. Bagale, G.S.; Vandadi, V.R.; Singh, D.; Sharma, D.K.; Garlapati, D.V.K.; Bommisetti, R.K.; Gupta, R.K.; Setsiawan, R.; Subramaniyaswamy, V.; Sengan, S. Small and medium-sized enterprises’ contribution in digital technology. Ann. Oper. Res. 2021, 1–24. [Google Scholar] [CrossRef]
  29. Borowski, P.F. Digitization, digital twins, blockchain, and industry 4.0 as elements of management process in enterprises in the energy sector. Energies 2021, 14, 1885. [Google Scholar] [CrossRef]
  30. Polanco-Diges, L.; Debasa, F. The use of digital marketing strategies in the sharing economy: A literature review. J. Spat. Organ. Dyn. 2020, 8, 217–229. [Google Scholar]
  31. Warokka, A.; Sjahruddin, H.; Sriyanto, S.; Noerhartati, E.; Saddhono, K. Digital marketing support and business development using online marketing tools: An experimental analysis. Int. J. Psychosoc. Rehabil. 2020, 24, 1181–1188. [Google Scholar] [CrossRef]
  32. Lee, M.; Yun, J.J.; Pyka, A.; Won, D.; Kodama, F.; Schiuma, G.; Park, H.; Jeon, J.; Park, K.; Jung, K. How to respond to the fourth industrial revolution, or the second information technology revolution? Dynamic new combinations between technology, market, and society through open innovation. J. Open Innov. Technol. Mark. Complex. 2018, 4, 21. [Google Scholar] [CrossRef]
  33. Juergensen, J.; Guimón, J.; Narula, R. European SMEs amidst the COVID-19 crisis: Assessing impact and policy responses. J. Ind. Bus. Econ. 2020, 47, 499–510. [Google Scholar] [CrossRef]
  34. Harris, J.L.; Sunley, P.; Evenhuis, E.; Martin, R.; Pike, A.; Harris, R. The Covid-19 crisis and manufacturing: How should national and local industrial strategies respond? J. Local Econ. Policy Unit 2020, 35, 403–415. [Google Scholar] [CrossRef]
  35. Monostori, L.; Váncza, J. Lessons learned from the COVID-19 pandemic and their possible consequences on manufacturing. Smart Sustain. Manuf. Syst. 2020, 4, 333–337. [Google Scholar] [CrossRef]
  36. Wu, H.; Xue, Y.; Hao, Y.; Ren, S. How does internet development affect energy-saving and emission reduction? Evidence from China. Energy Econ. 2021, 103, 105577. [Google Scholar] [CrossRef]
  37. Dou, Q.; Gao, X. The double-edged role of the digital economy in firm green innovation: Micro-evidence from Chinese manufacturing industry. Environ. Sci. Pollut. Res. 2022, 29, 67856–67874. [Google Scholar] [CrossRef]
  38. Karimi, J.; Walter, Z. The role of dynamic capabilities in responding to digital disruption: A factor-based study of the newspaper industry. J. Manag. Inf. Syst. 2015, 32, 39–81. [Google Scholar] [CrossRef]
  39. Kolloch, M.; Dellermann, D. Digital innovation in the energy industry: The impact of controversies on the evolution of innovation ecosystems. Technol. Forecast. Soc. Chang. 2018, 136, 254–264. [Google Scholar] [CrossRef]
  40. Priyono, A.; Moin, A.; Putri, V.N.A.O. Identifying digital transformation paths in the business model of SMEs during the COVID-19 pandemic. J. Open Innov. Technol. Mark. Complex. 2020, 6, 104. [Google Scholar] [CrossRef]
  41. Zhang, Z.J.; He, W.; Li, W.; Abdous, M. Cybersecurity awareness training programs: A cost–benefit analysis framework. Ind. Manag. Data Syst. 2021, 121, 613–636. [Google Scholar] [CrossRef]
  42. Tian, J.; Coreynen, W.; Matthyssens, P.; Shen, L. Platform-based servitization and business model adaptation by established manufacturers. Technovation 2022, 118, 102222. [Google Scholar] [CrossRef]
  43. Omotosho, B.J. Small scale craft workers and the use of social media platforms for business performance in southwest Nigeria. J. Small Bus. Entrep. 2020, 1–16. [Google Scholar] [CrossRef]
  44. Giehl, J.; Göcke, H.; Grosse, B.; Kochems, J.; Müller-Kirchenbauer, J. Survey and classification of business models for the energy transformation. Energies 2020, 13, 2981. [Google Scholar] [CrossRef]
  45. Paukstadt, U.; Becker, J. Uncovering the business value of the internet of things in the energy domain–a review of smart energy business models. Electron. Mark. 2021, 31, 51–66. [Google Scholar] [CrossRef]
  46. Zhou, X.; Song, M.; Cui, L. Driving force for China’s economic development under Industry 4.0 and circular economy: Technological innovation or structural change? J. Clean. Prod. 2020, 271, 122680. [Google Scholar] [CrossRef]
  47. Sharma, A.; Adhikary, A.; Borah, S.B. COVID-19’ s impact on supply chain decisions: Strategic insights from NASDAQ 100 firms using Twitter data. J. Bus. Res. 2020, 117, 443–449. [Google Scholar] [CrossRef]
  48. Montero, J.; Finger, M. Digitalizing infrastructure: Active management for smarter networks. In A Modern Guide to the Digitalization of Infrastructure; Edward Elgar Publishing: Cheltenham, UK, 2021; pp. 1–42. [Google Scholar]
  49. Luo, K.; Liu, Y.; Chen, P.; Zeng, M. Assessing the impact of digital economy on green development efficiency in the Yangtze River Economic Belt. Energy Econ. 2022, 112, 106127. [Google Scholar] [CrossRef]
  50. Ahmedov, I. The impact of digital economy on international trade. Eur. J. Bus. Manag. Res. 2020, 5, 4. [Google Scholar] [CrossRef]
  51. Hosan, S.; Karmaker, S.C.; Rahman, M.M.; Chapman, A.J.; Saha, B.B. Dynamic links among the demographic dividend, digitalization, energy intensity and sustainable economic growth: Empirical evidence from emerging economies. J. Clean. Prod. 2022, 330, 129858. [Google Scholar] [CrossRef]
  52. Namany, S.; Al-Ansari, T.; Govindan, R. Sustainable energy, water and food nexus systems: A focused review of decision-making tools for efficient resource management and governance. J. Clean. Prod. 2019, 225, 610–626. [Google Scholar] [CrossRef]
  53. Sanasi, S.; Ghezzi, A.; Cavallo, A.; Rangone, A. Making sense of the sharing economy: A business model innovation perspective. Technol. Anal. Strateg. Manag. 2020, 32, 895–909. [Google Scholar] [CrossRef]
  54. Hu, H.; Huang, T.; Cheng, Y.; Lu, H. The evolution of sustainable business model innovation: Evidence from a sharing economy platform in China. Sustainability 2019, 11, 4207. [Google Scholar] [CrossRef]
  55. Ren, S.; Hao, Y.; Xu, L.; Wu, H.; Ba, N. Digitalization and energy: How does internet development affect China’s energy consumption? Energy Econ. 2021, 98, 105220. [Google Scholar] [CrossRef]
  56. Sturgeon, T.J. Upgrading strategies for the digital economy. Glob. Strat. J. 2019, 11, 34–57. [Google Scholar] [CrossRef]
  57. Ba, S.; Bai, H. Covid-19 pandemic as an accelerator of economic transition and financial innovation in China. J. Chin. Econ. Bus. Stud. 2020, 18, 341–348. [Google Scholar] [CrossRef]
  58. Susanto, H.; Fang Yie, L.; Mohiddin, F.; Rahman Setiawan, A.A.; Haghi, P.K.; Setiana, D. Revealing social media phenomenon in time of COVID-19 pandemic for boosting Start-Up businesses through digital ecosystem. Appl. Syst. Innov. 2021, 4, 6. [Google Scholar] [CrossRef]
  59. Haefner, N.; Wincent, J.; Parida, V.; Gassmann, O. Artificial intelligence and innovation management: A review, framework, and research agenda. Technol. Forecast. Soc. Chang. 2021, 162, 120392. [Google Scholar] [CrossRef]
  60. Ren, S.; Li, L.; Han, Y.; Hao, Y.; Wu, H. The emerging driving force of inclusive green growth: Does digital economy agglomeration work? Bus. Strategy Environ. 2022, 31, 1656–1678. [Google Scholar] [CrossRef]
  61. Linde, L.; Sjödin, D.; Parida, V.; Wincent, J. Dynamic capabilities for ecosystem orchestration A capability-based framework for smart city innovation initiatives. Technol. Forecast. Soc. Chang. 2021, 166, 120614. [Google Scholar] [CrossRef]
  62. Luo, Q.; Miao, C.; Sun, L.; Meng, X.; Duan, M. Efficiency evaluation of green technology innovation of China’s strategic emerging industries: An empirical analysis based on Malmquist-data envelopment analysis index. J. Clean. Prod. 2019, 238, 117782. [Google Scholar] [CrossRef]
  63. Fukuda, K. Science, technology and innovation ecosystem transformation toward society 5.0. Int. J. Prod. Econ. 2020, 220, 107460. [Google Scholar] [CrossRef]
  64. Yi, M.; Liu, Y.; Sheng, M.S.; Wen, L. Effects of digital economy on carbon emission reduction: New evidence from China. Energy Policy 2022, 171, 113271. [Google Scholar] [CrossRef]
  65. Li, B.; Hou, B.; Yu, W.; Lu, X.; Yang, C. Applications of artificial intelligence in intelligent manufacturing: A review. Front. Inf. Technol. Electron. Eng. 2017, 18, 86–96. [Google Scholar] [CrossRef]
  66. Zhou, R.; Tang, D.; Da, D.; Chen, W.; Kong, L.; Boamah, V. Research on China’s manufacturing industry moving towards the middle and high-end of the GVC driven by digital economy. Sustainability 2022, 14, 7717. [Google Scholar] [CrossRef]
  67. Borowski, P.F. Innovative processes in managing an enterprise from the energy and food sector in the era of Industry 4.0. Processes 2021, 9, 381. [Google Scholar] [CrossRef]
  68. Min, Q.; Lu, Y.; Liu, Z.; Su, C.; Wang, B. Machine learning based digital twin framework for production optimization in petrochemical industry. Int. J. Inf. Manag. 2019, 49, 502–519. [Google Scholar] [CrossRef]
  69. Liu, J.; Yu, Q.; Chen, Y.; Liu, J. The impact of digital technology development on carbon emissions: A spatial effect analysis for China. Resour. Conserv. Recycl. 2022, 185, 106445. [Google Scholar] [CrossRef]
  70. Meng, H.; Deng, P.; Zhang, J. Nonlinear impact of circulation-industry intelligentization on the urban–rural income gap: Evidence from China. Sustainability 2022, 14, 9405. [Google Scholar] [CrossRef]
  71. Zhai, X.; An, Y. Analyzing influencing factors of green transformation in China’s manufacturing industry under environmental regulation: A structural equation model. J. Clean. Prod. 2020, 251, 119760. [Google Scholar] [CrossRef]
  72. Shao, S.; Hu, Z.; Cao, J.; Yang, L.; Guan, D. Environmental regulation and enterprise innovation: A review. Bus. Strat. Environ. 2020, 29, 1465–1478. [Google Scholar] [CrossRef]
  73. Zhao, S.; Peng, D.; Wen, H.; Wu, Y. Nonlinear and spatial spillover effects of the digital economy on green total factor energy efficiency: Evidence from 281 cities in China. Environ. Sci. Pollut. Res. 2022, 1–21. [Google Scholar] [CrossRef] [PubMed]
  74. Tong, H. Non-Linear Time Series: A Dynamical System Approach; Oxford University Press: Oxford, UK, 1990. [Google Scholar]
  75. Sarkis, J. A strategic decision framework for green supply chain management. J. Clean. Prod. 2003, 11, 397–409. [Google Scholar] [CrossRef]
  76. Freeman, L.C. Centrality in social networks conceptual clarification. In Social Network: Critical Concepts in Sociology; Routledge: Londin, UK, 1978; Volume 1, pp. 215–239. [Google Scholar]
  77. Xu, X.; Zhang, M. Research on the Scale Measurement of China’s Digital Economy——Based on the Perspective of International Comparison. China Ind. Econ. 2020, 5, 23–41. [Google Scholar]
  78. Wang, Y.; Dong, W. How the rise of robots has affected China’s labor market: Evidence from China’s listed manufacturing firms. Econ. Res. J. 2020, 55, 159–175. [Google Scholar]
  79. Adeniyi, O.; Oyinlola, A.; Omisakin, O.; Egwaikhide, F.O. Financial development and economic growth in Nigeria: Evidence from threshold modelling. Econ. Anal. Policy 2015, 47, 11–21. [Google Scholar] [CrossRef]
  80. Liu, X.; Sun, T.; Feng, Q.; Zhang, D. Dynamic environmental regulation threshold effect of technical progress on China’s environmental pollution. J. Clean. Prod. 2020, 272, 122780. [Google Scholar] [CrossRef]
  81. Liu, Y.; Yang, Y.; Li, H.; Zhong, K. Digital economy development, industrial structure upgrading and green total factor productivity: Empirical evidence from China’s cities. Int. J. Environ. Res. Public Health 2022, 19, 2414. [Google Scholar] [CrossRef]
  82. Hoffmann, R.; Lee, C.G.; Ramasamy, B.; Yeung, M. FDI and pollution: A granger causality test using panel data. J. Int. Dev. J. Dev. Stud. Assoc. 2005, 17, 311–317. [Google Scholar] [CrossRef]
  83. Perkins, R.; Neumayer, E. Transnational linkages and the spillover of environment-efficiency into developing countries. Glob. Environ. Chang. 2009, 19, 375–383. [Google Scholar] [CrossRef]
  84. Gao, D.; Li, G.; Yu, J. Does digitization improve green total factor energy efficiency? Evidence from chinese 213 cities. Energy 2022, 247, 123395. [Google Scholar] [CrossRef]
  85. Li, J.; Peng, J.; Shuai, C.; Wang, Z.; Huang, F.; Khayyam, M. Does the solar PV program enhance the social empowerment of China’s rural poor? Energy 2022, 253, 124084. [Google Scholar] [CrossRef]
  86. Peng, J.; Xiao, J. Environmental regulation, energy factor price and green innovation efficiency: A case study of the Yangtze River economic belt. J. Environ. Econ. 2021, 6, 158–178. [Google Scholar]
  87. Kuznets, S. Modern economic growth: Findings and reflections. Am. Econ. Rev. 1973, 63, 247–258. [Google Scholar]
  88. Hansen, B.E. Threshold effects in non-dynamic panels: Estimation, testing, and inference. J. Econom. 1999, 93, 345–368. [Google Scholar] [CrossRef] [Green Version]
  89. Hansen, B.E. Sample splitting and threshold estimation. Econometrica 2000, 68, 575–603. [Google Scholar] [CrossRef]
  90. Zhang, Z.; Wan, X.; Sheng, K.; Sun, H.; Jia, L.; Peng, J. Impact of carbon sequestration by terrestrial vegetation on economic growth: Evidence from Chinese county satellite data. Sustainability 2023, 15, 1369. [Google Scholar] [CrossRef]
Figure 1. Research hypothesis framework diagram. Note: The diagram was created by the author using VISIO 2019.
Energies 16 01564 g001
Figure 2. Spatial evolution characteristics of natural gas supply chain length. Notes: (a)–(f) represent the centrality of the length of the natural gas energy supply chain in 2006, 2009, 2012, 2015, 2018, and 2020, respectively. The figures were created by the author using ArcGis 10.8.
Energies 16 01564 g002
Figure 3. Spatial evolution characteristics of digital industrialization. Notes: (af) represent the level of digital industrialization (addvaluerate) in 2006, 2009, 2012, 2015, 2018 and 2020, respectively. The figures were created by the author using ArcGis 10.8.
Energies 16 01564 g003
Figure 4. Descriptive statistics of the main changes. Notes: (a), correlation coefficient distribution of the core variables; (b), box plot of the core variables. These diagrams were created by the author using Origin Pro 2022.
Energies 16 01564 g004
Figure 5. LR test. Note: These graphs were created by the author using Stata 17.0.
Energies 16 01564 g005
Figure 6. Results of the LR statistical test for dynamic changes. Note: Created by the author using Stata 17.0.
Energies 16 01564 g006
Figure 7. Results of LR test for omitted variables. Note: The graphs were created by the author using Stata 17.0. Notes: (a) shows the LR test with the addition of FDI (fdi); (b) shows the LR test with the addition of per capita GDP (pcgdp) on the basis of (a); (c) shows the LR test with the addition of patent licensing (patlic) on the basis of (b); (d) shows the LR test with the addition of technology-market turnover (techcon) on the basis of (c); (e) shows the LR test with the addition of environmental treatment investment (pollucon) on the basis of (d); and (f) shows the LR test with the addition of industrial structure (iu) on the basis of (e).
Energies 16 01564 g007
Figure 8. LR test results of segmented industries. Note: These graphs were created by the author using Stata 17.0.
Energies 16 01564 g008
Figure 9. LR test results in different regions. Note: These graphs were created by the author using Stata 17.0. Notes: (a) shows the LR test for the level of digital industrialization in the eastern region; (b) shows the LR test for the level of digital industrialization in the central region; (c) shows the LR test for the level of digital industrialization in the western region; (d) shows the LR test for the level of digital industrialization in the northeastern region.
Energies 16 01564 g009
Figure 10. LR test results in different periods. Note: These graphs were created by the author using Stata 17.0. Notes: (a) shows the LR test for the level of digital industrialization in the 11th Five-Year Plan period; (b) shows the LR test for the level of digital industrialization in the 12th Five-Year Plan period; (c) shows the LR test for the level of digital industrialization in the 13th Five-Year Plan period.
Energies 16 01564 g010
Table 1. Descriptive statistics of indicators.
Variables NameObsMeanSDMinMedianMax
centrality4508.83017.04308.82429.41
addvaluerate4500.06190.033350.024510.050120.1787
fdi4501495.7751258420537.819,830
pcgdp45044,50028,376610338,081176,031
patlic45041,60070,8799715,884576,698
techcon4503,050,0007,011,676−750,493596,71964,000,000
pollucon450197,000184,3913563148,9191,400,000
iu4500.96340.31940.18410.94321.897
Table 2. LLC unit root test.
VariablesUnadjusted t StatisticAdjusted t * Statisticp-Value
centrality−6.2108 ***−3.0530 ***0.0011
pcgdp−3.4329 ***−4.8013 ***0.0001
addvaluerate−8.3316 ***−3.8627 ***0.0001
fdi−5.6061 ***−10.8629 ***0.0000
patlic−4.7554 ***−8.6181 ***0.0000
techcon−5.7020 ***−14.1845 ***0.0000
iu−4.2357 ***−1.8116 **0.0350
Notes: * p < 0.1, ** p < 0.05, *** p < 0.01.
Table 3. Baseline regression results.
(1) OLS(2) FE(3) RE(4) Single(5) Double(6) Triple
Single threshold value γ = 12.7471γ = 12.7471γ = 12.7471
[20.06][20.06][20.06]
Double threshold value γ = 9.5183γ = 9.5183
[9.50][9.50]
Triple threshold value γ = 11.9329
[11.02]
addvaluerate−96.85 ***12.29−46.87 ***
(−10.51)(0.64)(−3.21)
0._cat#c.addvaluerate 4.687−33.62−48.87
(0.18)(−0.79)(−0.98)
1._cat#c.addvaluerate 33.71 **8.559 **−1.223
(2.30)(2.32)(−0.04)
2._cat#c.addvaluerate 40.69 **23.53 *
(2.50)(0.86)
3._cat#c.addvaluerate 51.45 *
(1.84)
lnfdi−1.764 ***−0.139−0.850 *−0.1590.05650.190
(−5.03)(−0.25)(−1.77)(−0.18)(0.07)(0.25)
lngdp2.956 ***2.935 **3.510 ***2.6182.1322.112
(4.29)(2.17)(3.63)(1.48)(1.13)(1.11)
lnpatlic3.021 ***2.328 ***2.323 ***2.275 *2.143 *1.760
(9.50)(3.53)(4.62)(1.97)(2.01)(1.52)
lntechcon1.307 ***0.925 ***0.971 ***0.959 ***0.873 ***0.859 ***
(10.53)(3.14)(4.14)(3.77)(3.07)(2.95)
lnpollucon−0.645 **−0.239−0.362−0.164−0.120−0.0967
(−2.07)(−0.85)(−1.32)(−0.53)(−0.40)(−0.32)
iu3.141 ***0.153−0.1681.1510.7891.018
(3.38)(0.15)(−0.18)(0.68)(0.44)(0.60)
_cons−46.54 ***−53.67 ***−50.34 ***−52.19 ***−46.38 ***−43.91 ***
(−7.14)(−6.86)(−6.97)(−5.27)(−3.97)(−3.97)
N448448448450450450
Notes: t-statistics in parentheses; * p < 0.1, ** p < 0.05, *** p < 0.01. The result of Hausman test is 40.58, which effectively rejects the null hypothesis that the model uses fixed effects.
Table 4. Results of the threshold effect model test.
γValueLowerUpperF TestCrit10Crit5Crit1
Single12.747112.730112.763920.06 *11.04124.225947.0188
Double9.51839.03199.54159.5 **4.370214.238823.4517
Triple11.932911.638411.935411.02 *7.451412.332327.572
Notes: * p < 0.1, ** p < 0.05.
Table 5. Regression results of the threshold effect of segmented industries.
Samples(1) Infrastructure(2) Technology and Application(3) Transaction(4) Media(5) Digital Industrialization
Single threshold valueγ = 12.7471γ = 12.6106γ = 11.9661γ = 9.2419γ = 12.7471
[19.24][19.14][19.65][4.29][20.06]
Double threshold valueγ = 10.2580γ = 11.1500γ = 12.9687γ = 11.6759γ = 9.5183
[9.21][7.06][10.62][7.33][9.50]
Triple threshold valueγ = 11.9329γ = 9.5183γ = 9.5183γ = 12.6363γ = 11.9329
[2.63][6.46][13.57][8.38][11.02]
0._cat#c.basingrate−68.19−133.4 **−7142.1 **−3715.7 *−48.87
(−0.73)(−2.73)(−2.61)(−1.89)(−0.98)
1._cat#c.basingrate20.03 *−81.38−3517.3 ***−1403.1−1.223
(1.89)(−1.68)(−4.66)(−1.29)(−0.04)
2._cat#c.basingrate42.28 *−48.75−1439.5 **−592.123.53 *
(1.71)(−1.18)(−2.66)(−1.02)(1.86)
3._cat#c.basingrate94.03 ***11.10 **−143.085.55 **51.45 *
(3.09)(2.27)(−0.29)(2.17)(1.84)
_cons−49.12 ***−42.74 ***−47.18 ***−43.59 ***−43.91 ***
(−4.80)(−3.68)(−4.40)(−3.70)(−3.97)
control variablesYESYESYESYESYES
N450450450450450
Notes: t-statistics in parentheses; * p < 0.1, ** p < 0.05, *** p < 0.01. The value in square brackets is the F statistic of the estimated threshold value.
Table 6. Regression results of threshold effects in different regions.
Samples (1) The East(2) The Central(3) The West(4) The Northeast
Single threshold valueγ = 11.3971γ = 9.3293γ = 12.5025γ = 11.7505
[26.16][16.83][21.00][24.44]
Double threshold valueγ = 12.7471γ = 11.0862γ = 9.5183γ = 11.1519
[11.71][13.14][13.40][7.54]
Triple threshold valueγ = 12.7011γ = 11.7497γ = 11.0021γ = 12.0461
[10.23][13.54][10.08][6.17]
0._cat#c.addvaluerate−35.88−265.8 ***−208.5 **−215.2
(−0.84)(−5.12)(−3.05)(−2.20)
1._cat#c.addvaluerate11.15−54.97−126.9 **−151.0
(0.38)(−0.85)(−2.44)(−1.18)
2._cat#c.addvaluerate−27.25−141.9 **−56.13−54.47
(−0.82)(−2.76)(−1.35)(−0.43)
3._cat#c.addvaluerate29.56 **59.45 **72.14 ***−10.41
(2.17)(2.16)(2.74)(−0.10)
_cons18.31−56.64 **−27.27 **−11.37
(0.74)(−3.57)(−2.27)(−1.04)
Control variablesYESYESYESYES
N1509016545
Notes: t-statistics in parentheses; ** p < 0.05, *** p < 0.01. The value in square brackets is the F statistic of the estimated threshold value.
Table 7. Regression results of threshold effects in different periods.
Samples(1) 11th Periods(2) 12th Periods(3) 13th Periods
Single threshold valueγ = 11.9354γ = 9.1955γ = 13.1244
[5.97][48.22][5.11]
Double threshold valueγ = 12.1439γ = 13.2504γ = 13.3965
[−0.02][17.50][2.04]
Triple threshold valueγ = 10.8825γ = 10.5659γ = 12.5595
[1.82][19.05][4.33]
0._cat#c.addvaluerate215.2 ***−250.9 ***−46.91 **
(2.94)(−3.77)(−2.61)
1._cat#c.addvaluerate197.3 ***−98.50 **−28.54 *
(2.78)(−2.35)(−1.85)
2._cat#c.addvaluerate225.0 ***24.62−20.18
(3.03)(0.64)(−0.91)
3._cat#c.addvaluerate160.9 **66.48 **−44.06 *
(2.46)(2.27)(−1.98)
_cons44.95 ***−94.45 **1.886
(2.91)(−2.51)(0.11)
Control variablesYESYESYES
N150150150
Notes: t-statistics in parentheses; * p < 0.1, ** p < 0.05, *** p < 0.01. The value in square brackets is the F statistic of the estimated threshold value.
Table 8. Regression results of mechanism test.
Variables(1) FT(2) TI(3) UIS(4) DPI(5) REGU
addvaluerate0.5636.741 ***3.661 ***2.948 ***8.160 **
(0.33)(4.80)(4.06)(4.29)(2.43)
_cons−1.446 **−7.495 ***2.033 ***4.586 ***6.264 ***
(−2.09)(−16.56)(5.68)(26.43)(4.71)
Control variablesYESYESYESYESYES
N450450450450450
Notes: t-statistics in parentheses; ** p < 0.05, *** p < 0.01. The value in square brackets is the F statistic of the estimated threshold value.
Disclaimer/Publisher’s Note: The statements, opinions and data contained in all publications are solely those of the individual author(s) and contributor(s) and not of MDPI and/or the editor(s). MDPI and/or the editor(s) disclaim responsibility for any injury to people or property resulting from any ideas, methods, instructions or products referred to in the content.

