
Evaluation of Methane Emissions in Daily Operations and Accidents: A Case Study of a Local Distribution Company in China

Abstract
:1. Introduction
2. Methods
2.1. Scope of Study
2.1.1. Description of the Distribution System
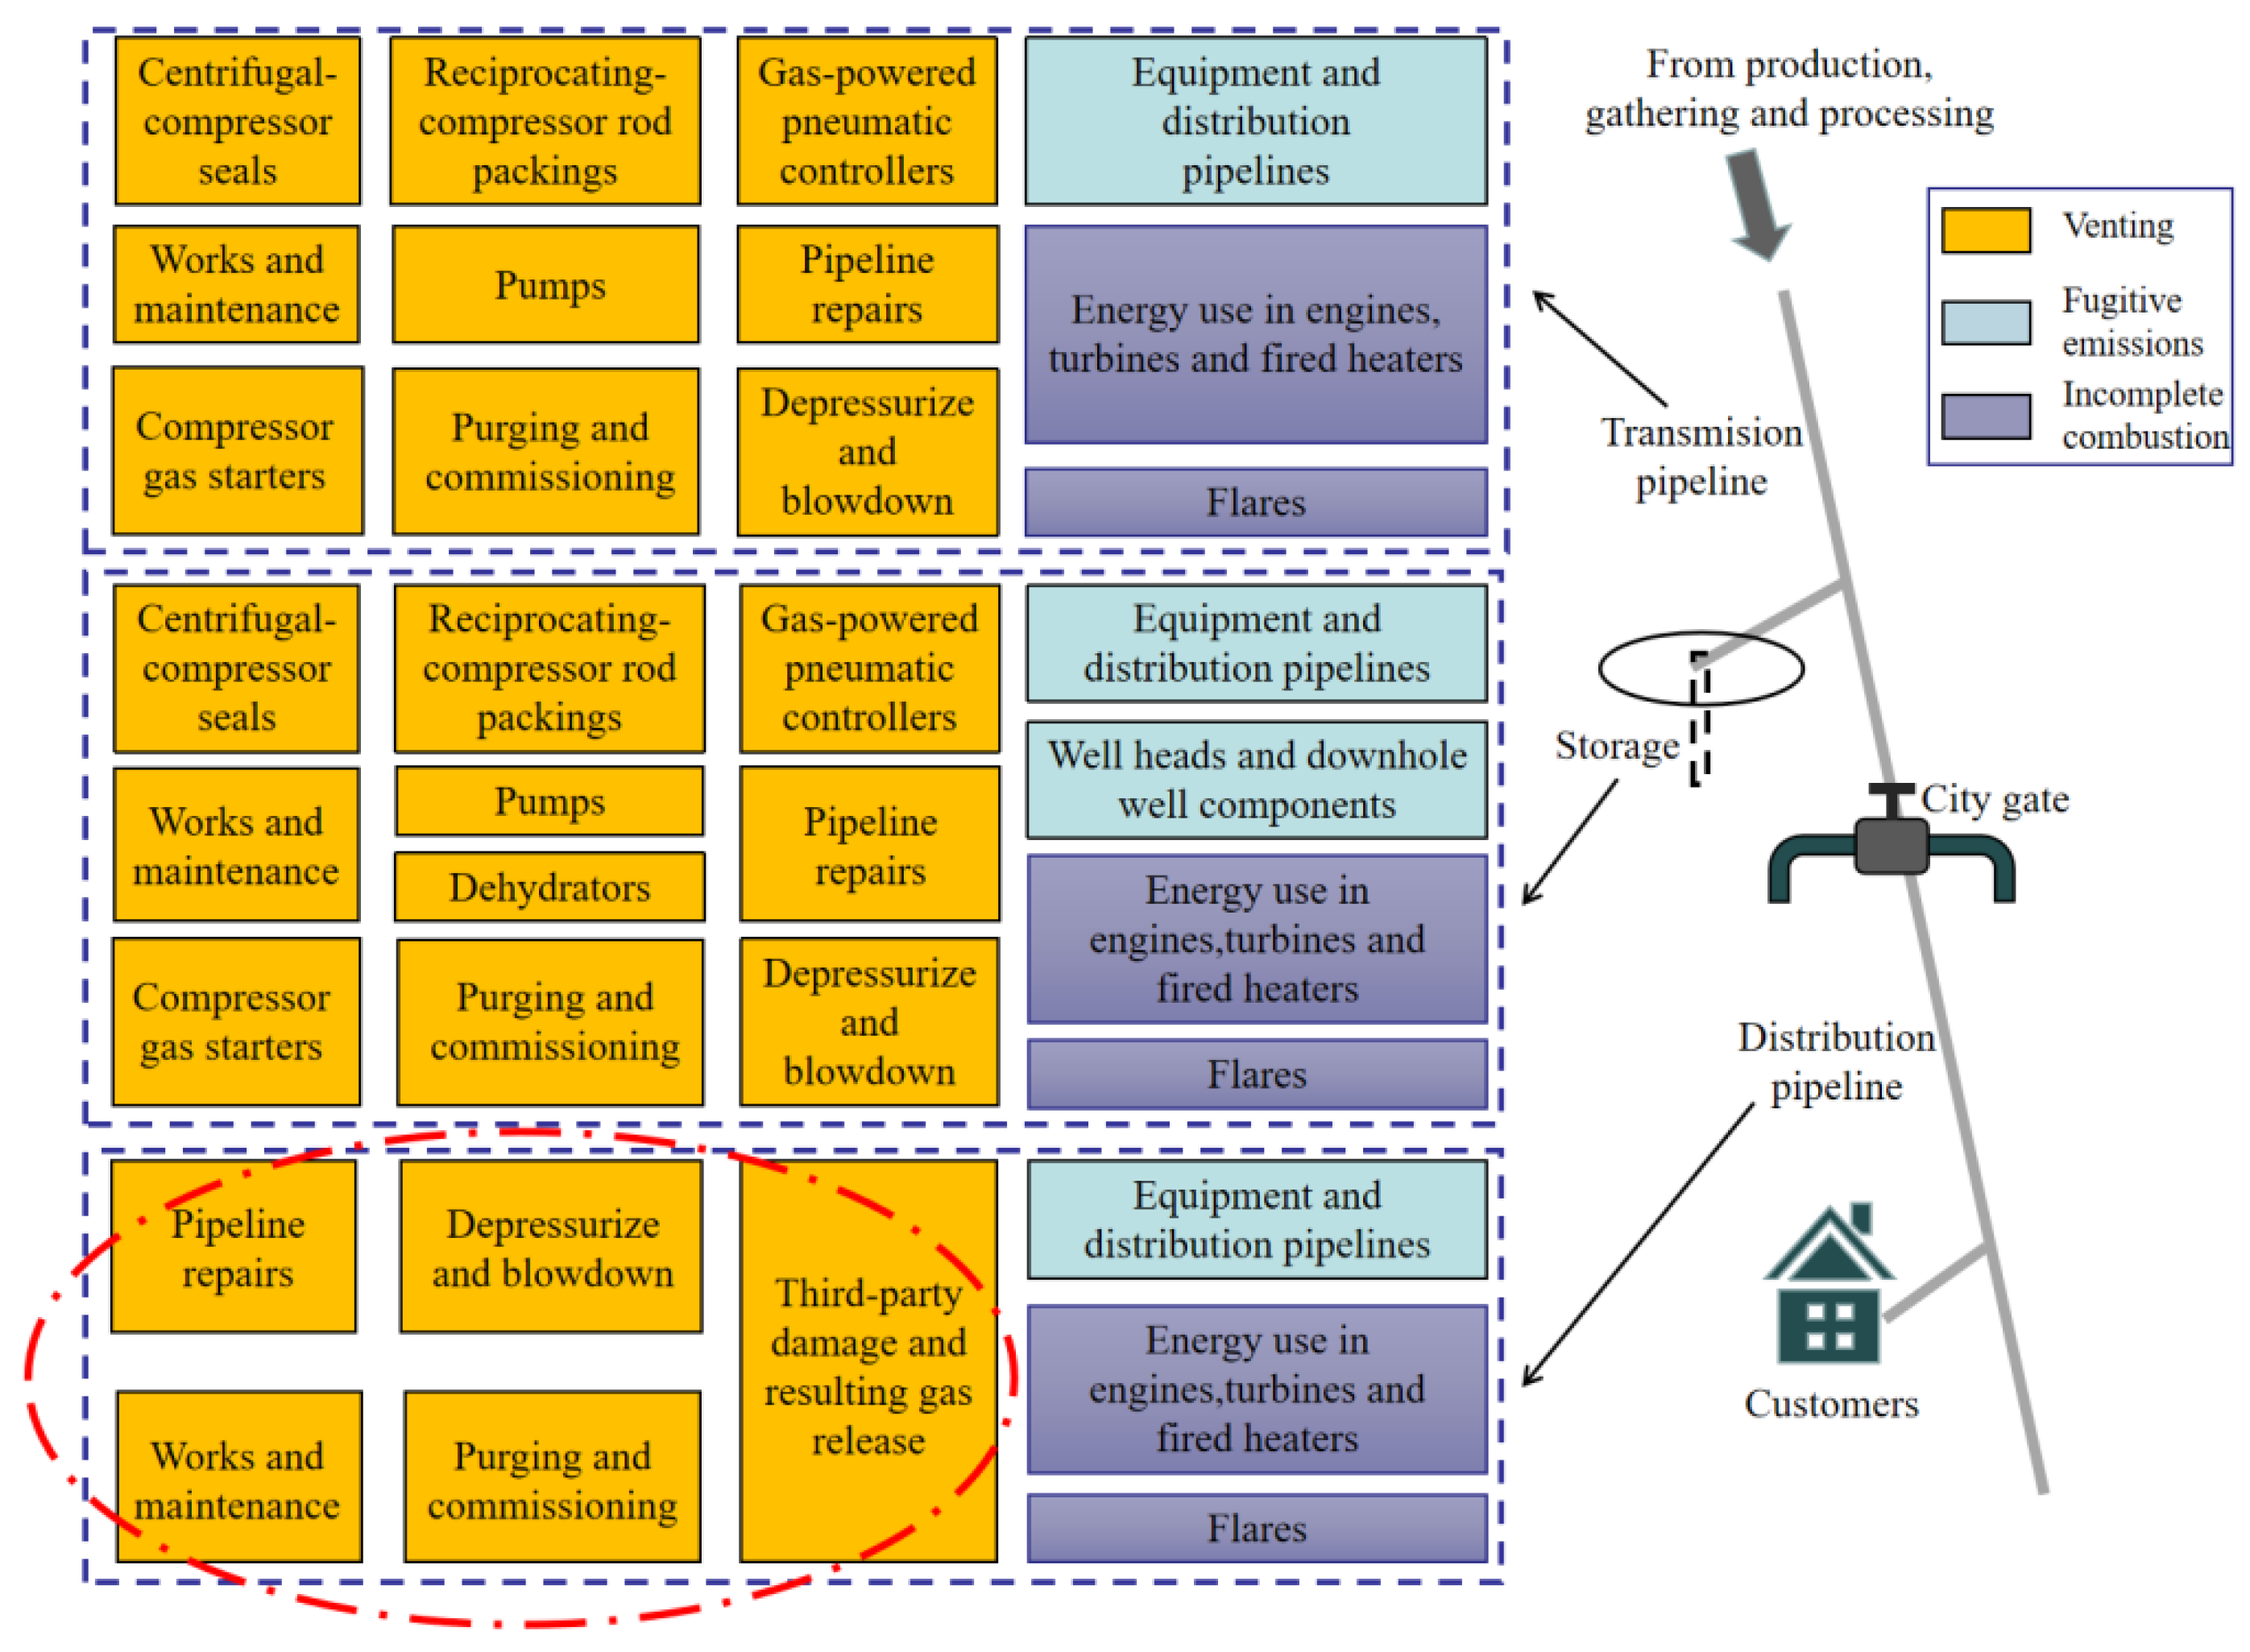
2.1.2. Emission Source Identification
- ①
- New pipeline connection
- (1)
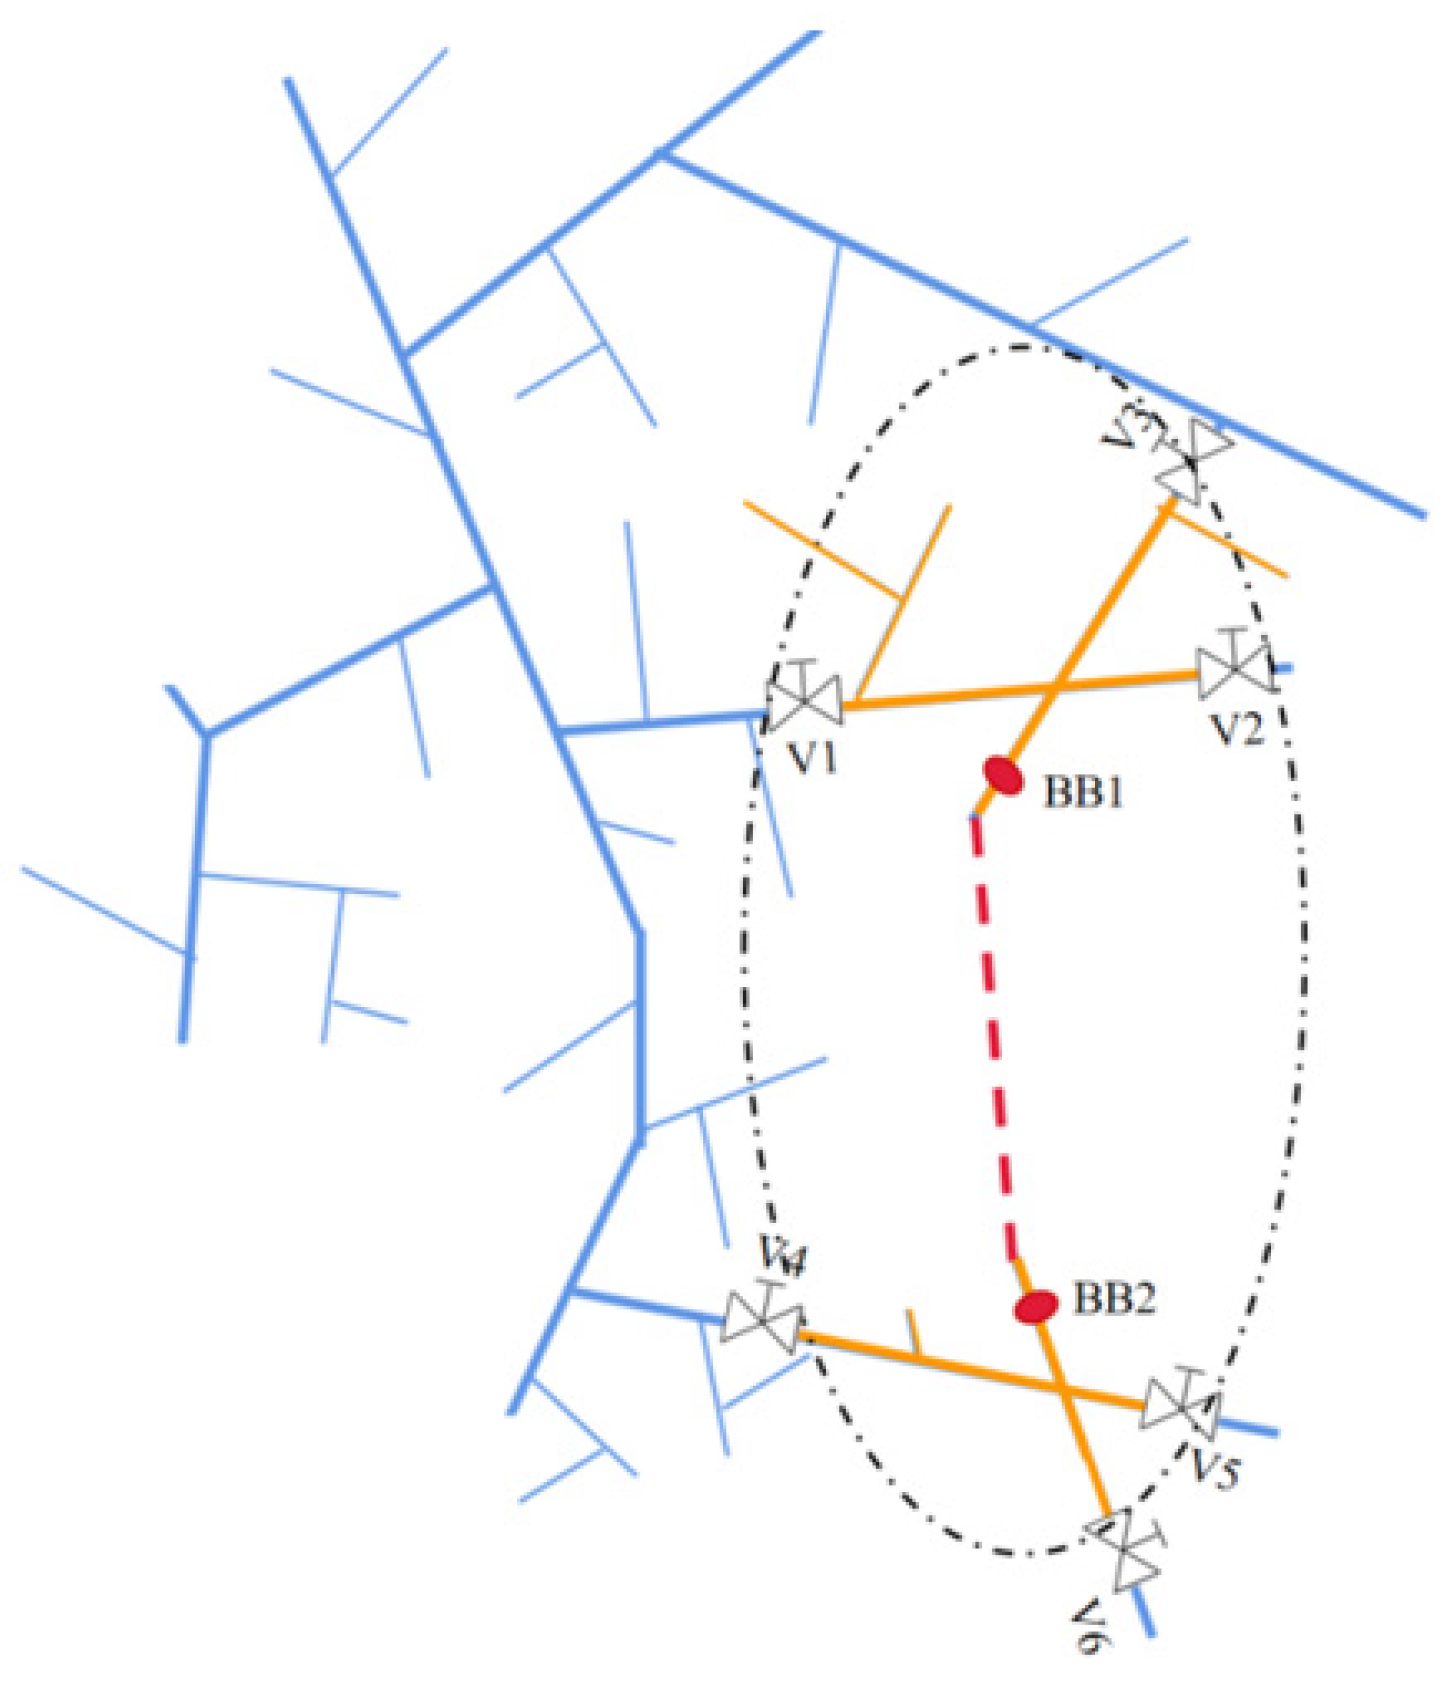
- Isolation: after the construction of new pipes (red dashed line in Figure 2) and strength and tightness tests are finished, to shut off all valves (V1, V2, V3, V4, V5 in Figure 2) on adjacent existing pipes leading to new pipes so as to establish an “isolated” network (dash–dot oval) to minimize the impact on customers outside the “isolated” section.
- (2)
- Blowdown: to de-pressurize the “isolated” network by releasing gas into the atmosphere through venting holes on regulators or valves until the pressure is slightly higher than atmospheric in order to reduce risk in the following operation processes.
- (3)
- Accurate isolation: to drill holes on existing pipes and insert stopples (shown as BB1, BB2 in Figure 2) to achieve a smaller cut-off section.
- (4)
- Construction: to perform constructions such as welding, etc., and then new pipes are physically connected with existing pipes.
- (5)
- Purging: to take out stopples and then purge the air remaining within new pipes into the atmosphere through the drilled holes or venting holes on neighboring regulators or valves. During this step, methane concentration at the vent is monitored continually with detecting equipment. When it rises to 85%, workers close upstream valve and wait for 1 min and then open the valve again while checking the methane concentration three times (once a minute) to ensure no air remains.
- ②
- New regulator connection
- ③
- Emergency repair
- ④
- Third-party damage and repair
2.2. Emission Quantification Methodology
2.2.1. Data Source
2.2.2. Gas Emission from Blowdown
2.2.3. Gas Emission from Purging
- ①
- Model for simulation
- ②
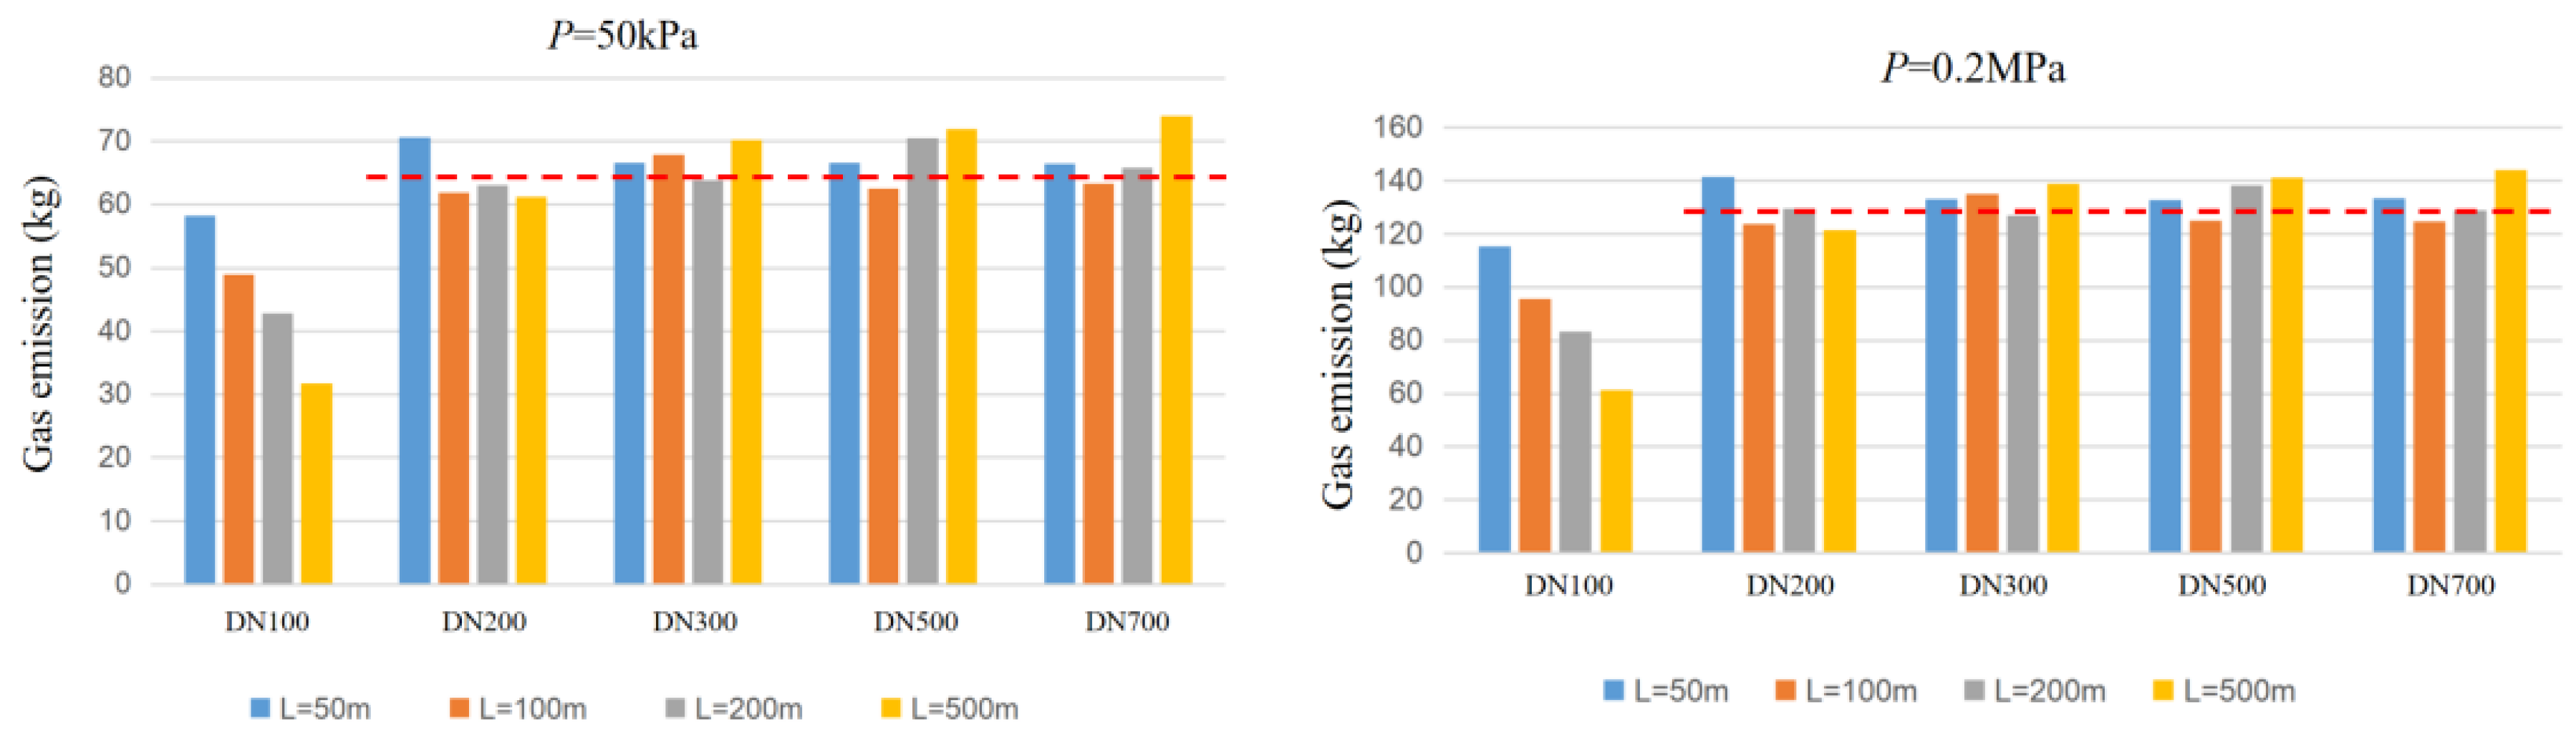
- Simulation results
- ③
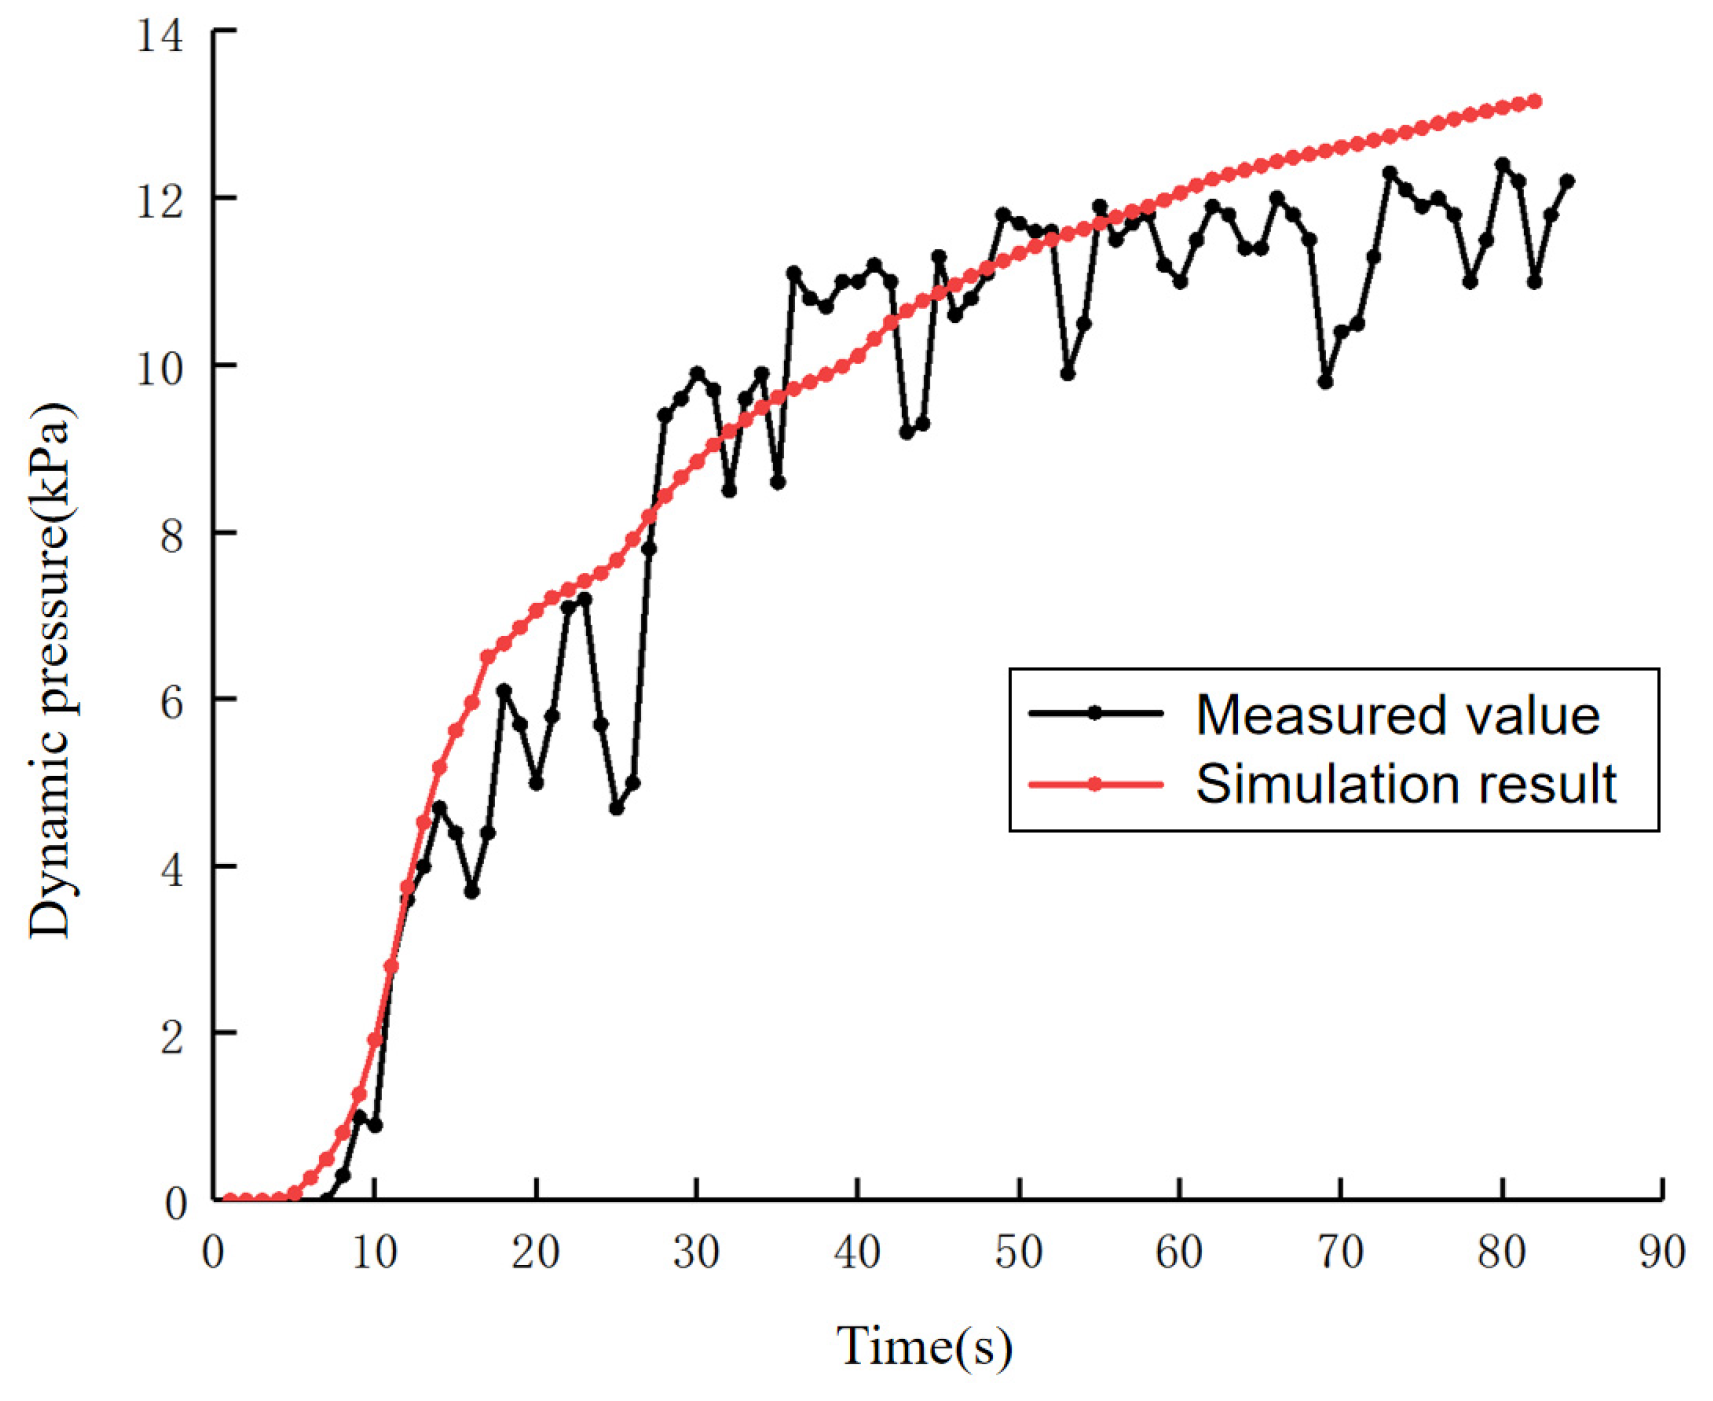
- Simulation verification
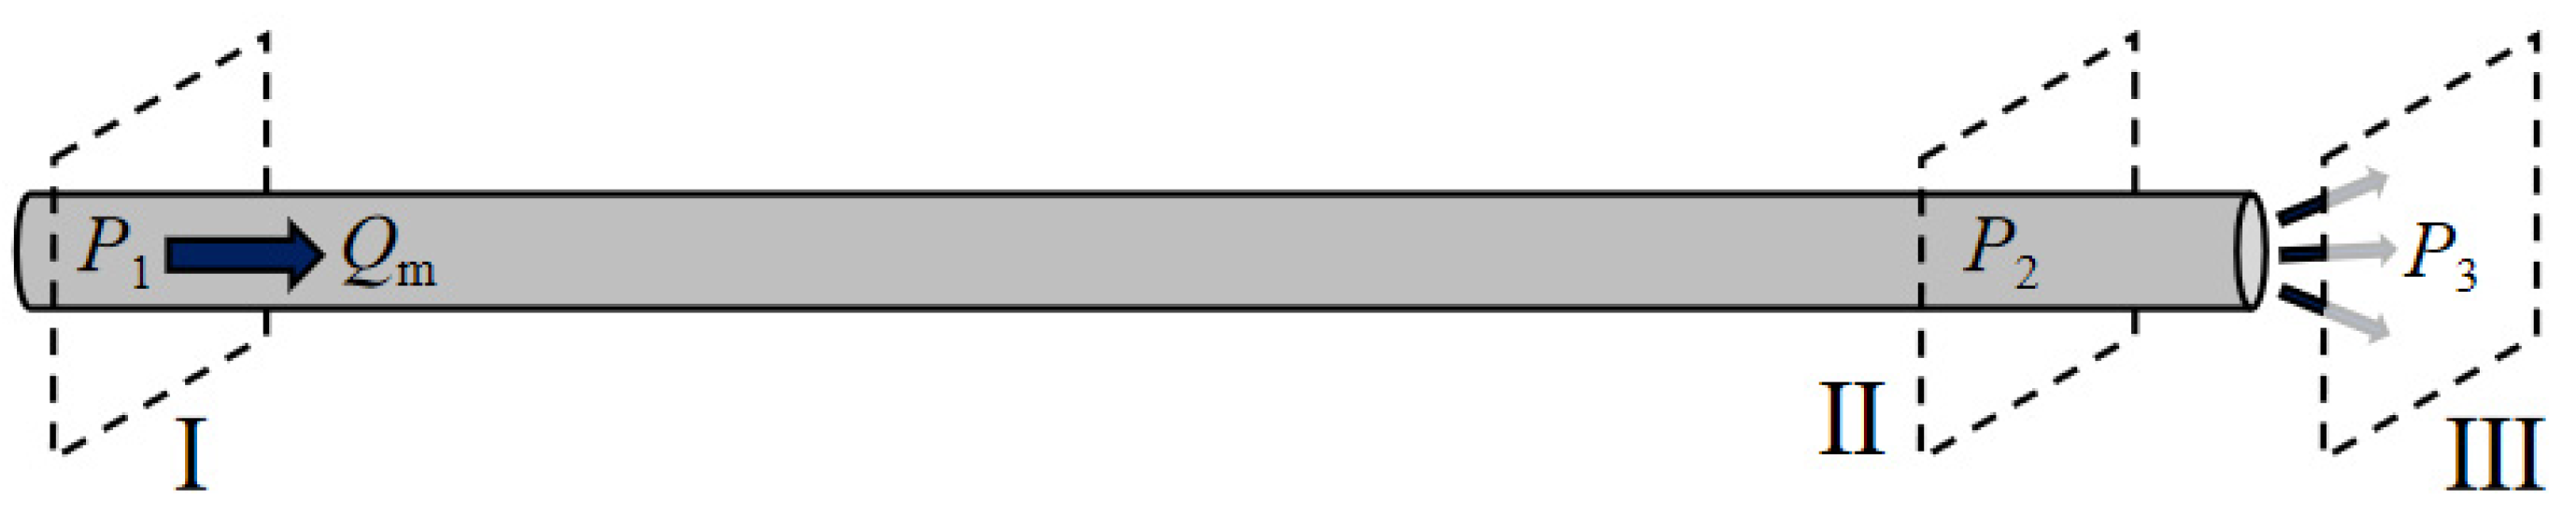
2.2.4. Gas Emission from Third-Party Damage
- ①
- Free leakage of completely broken pipes
- ②
- Free leakage of partially broken pipes
3. Results and Discussion
3.1. Filing Data Analyses
3.2. Methane Emission Rate
3.3. Total Methane Emission and Emission Factor
4. Conclusions
- ①
- Detailed procedures of pipeline constructions and rehabilitation were investigated for a local distribution company, and emission sources were identified including new pipeline connections, new regulator connections, emergency repairs and third-party damages and repairs.
- ②
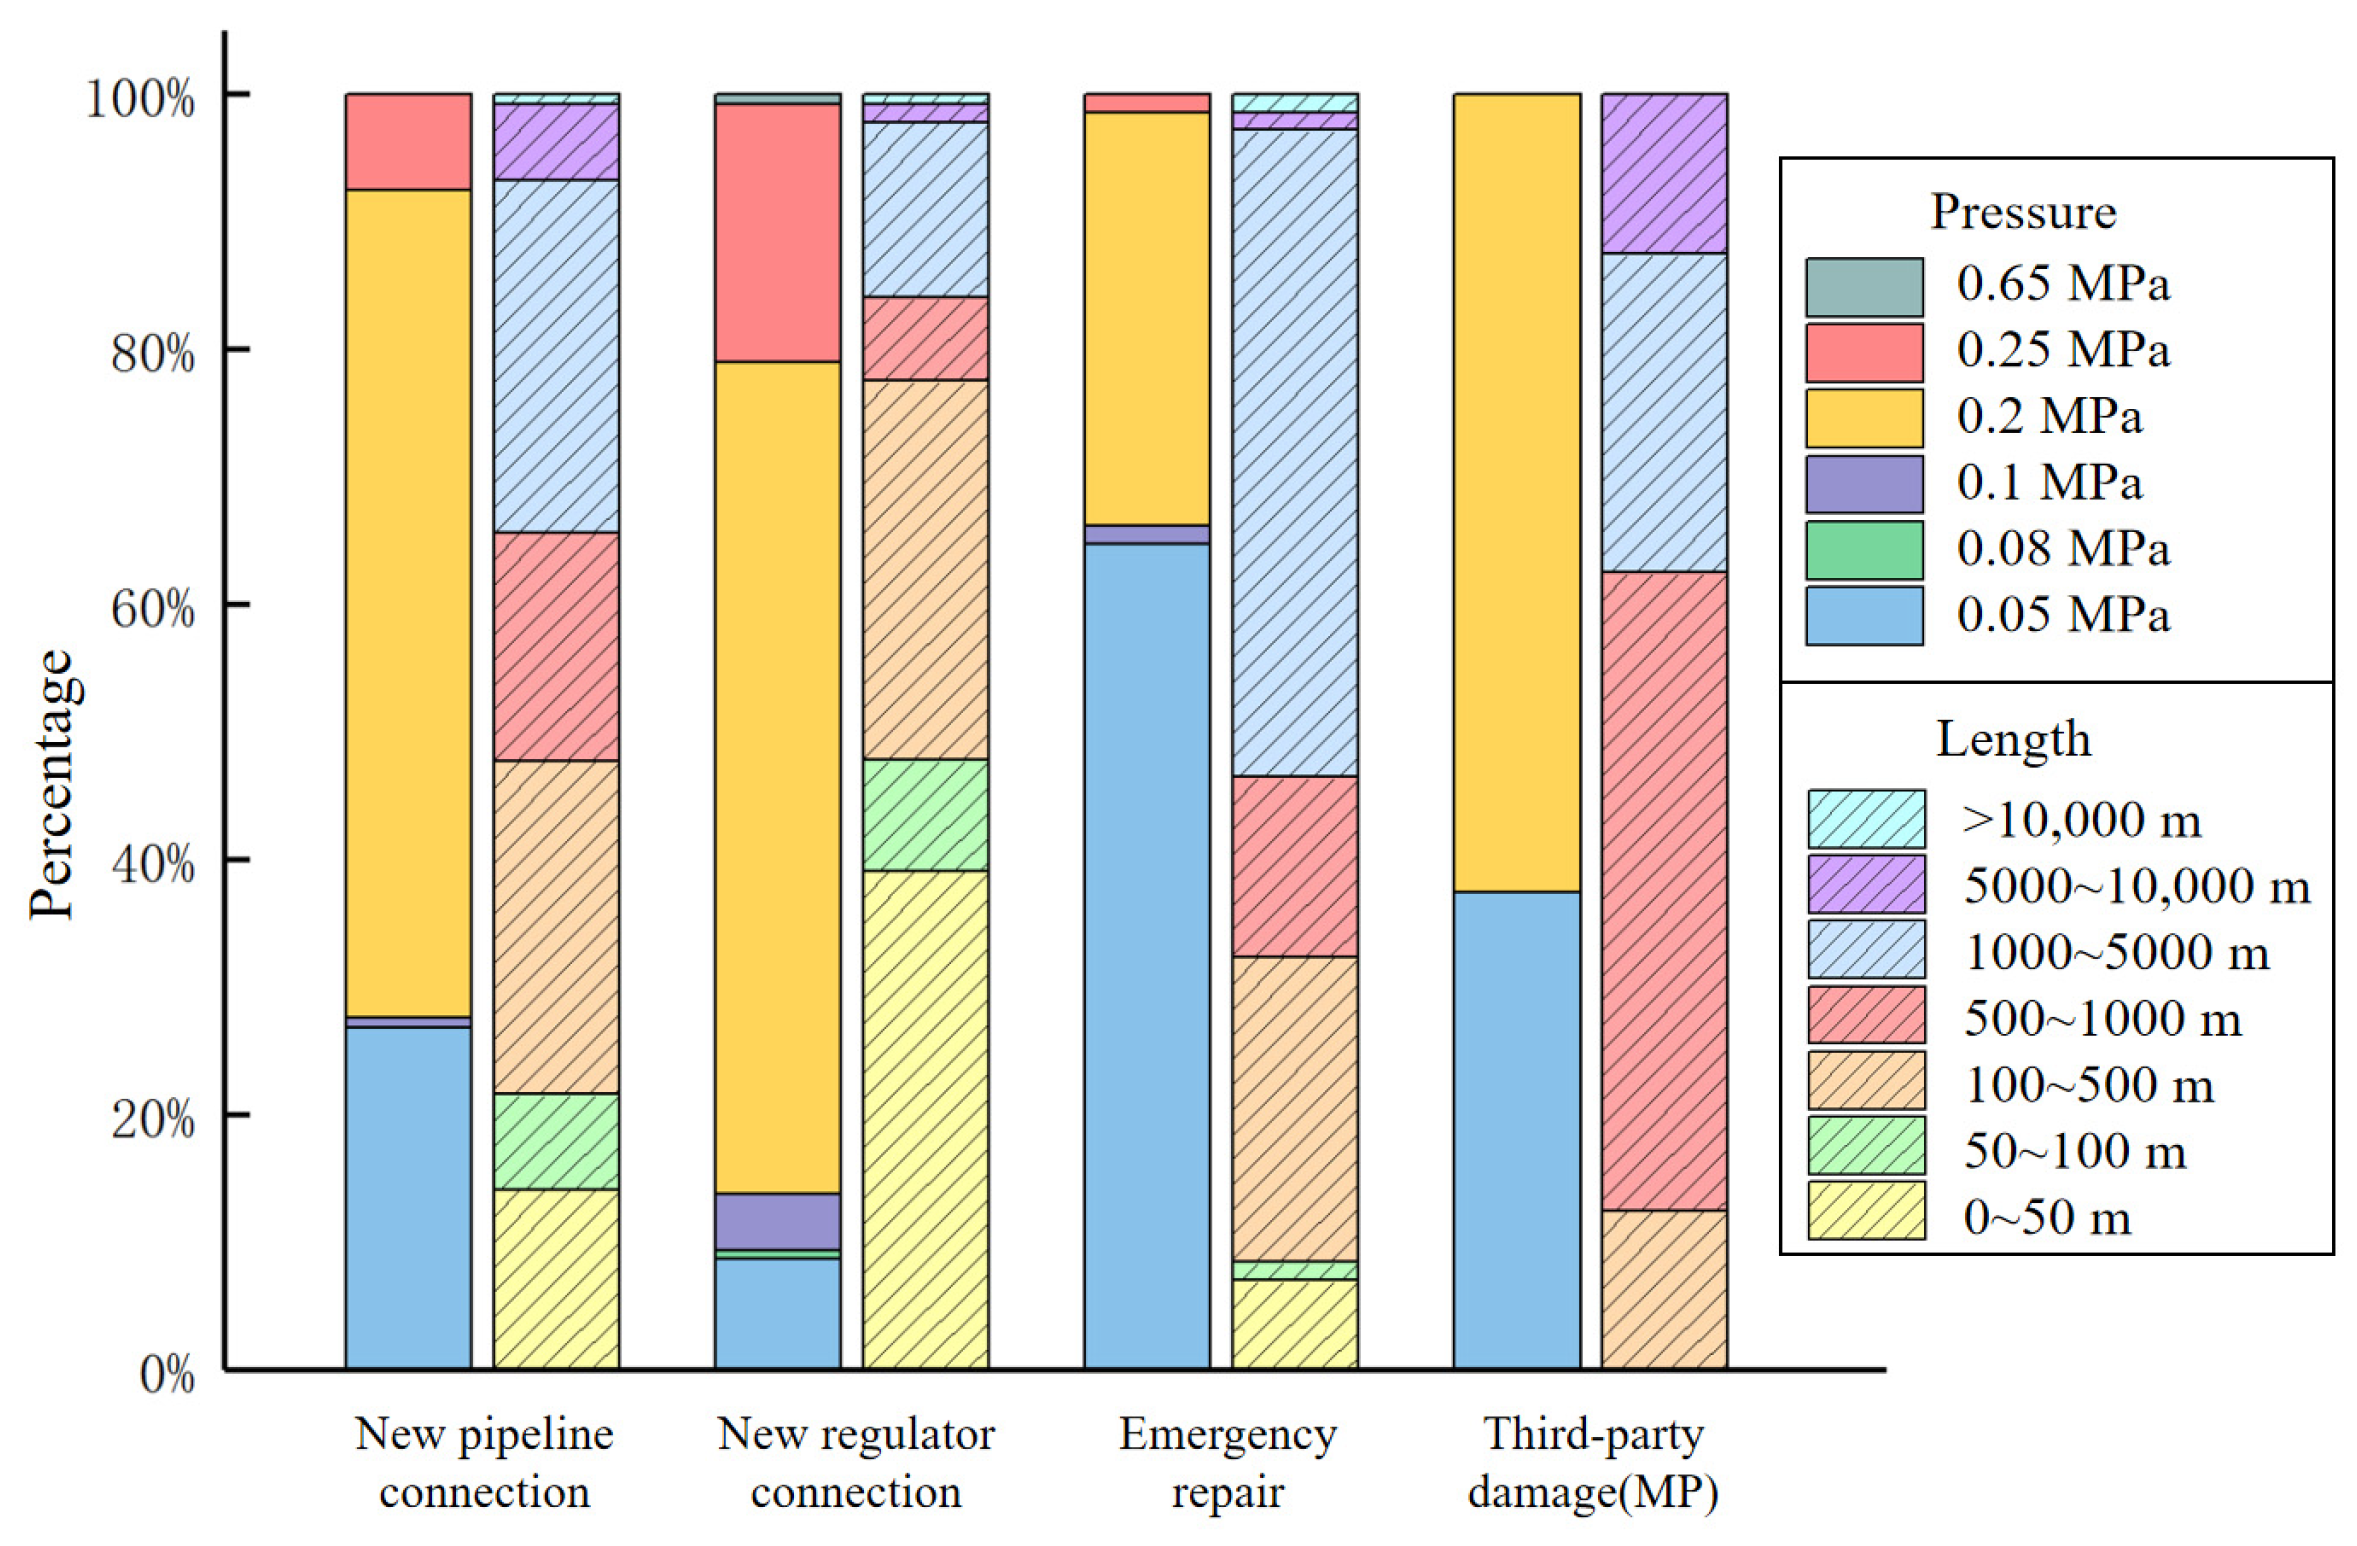
- By analyzing filing data, it was found that 0.05 MPa and 0.2 MPa are the most common pressures. The lengths of pipes in different cases differs from each other dramatically, and the most common length ranges of new pipeline connection, new regulator connection, emergency repair and third-party damage (MP) are 1000–5000, 0–50, 1000–5000 and 500–1000. The diameters of pipes involved in third-party damage (LP) are mostly under DN50, and apart from this, most pipes related are larger than DN50 and smaller than DN500.
- ③
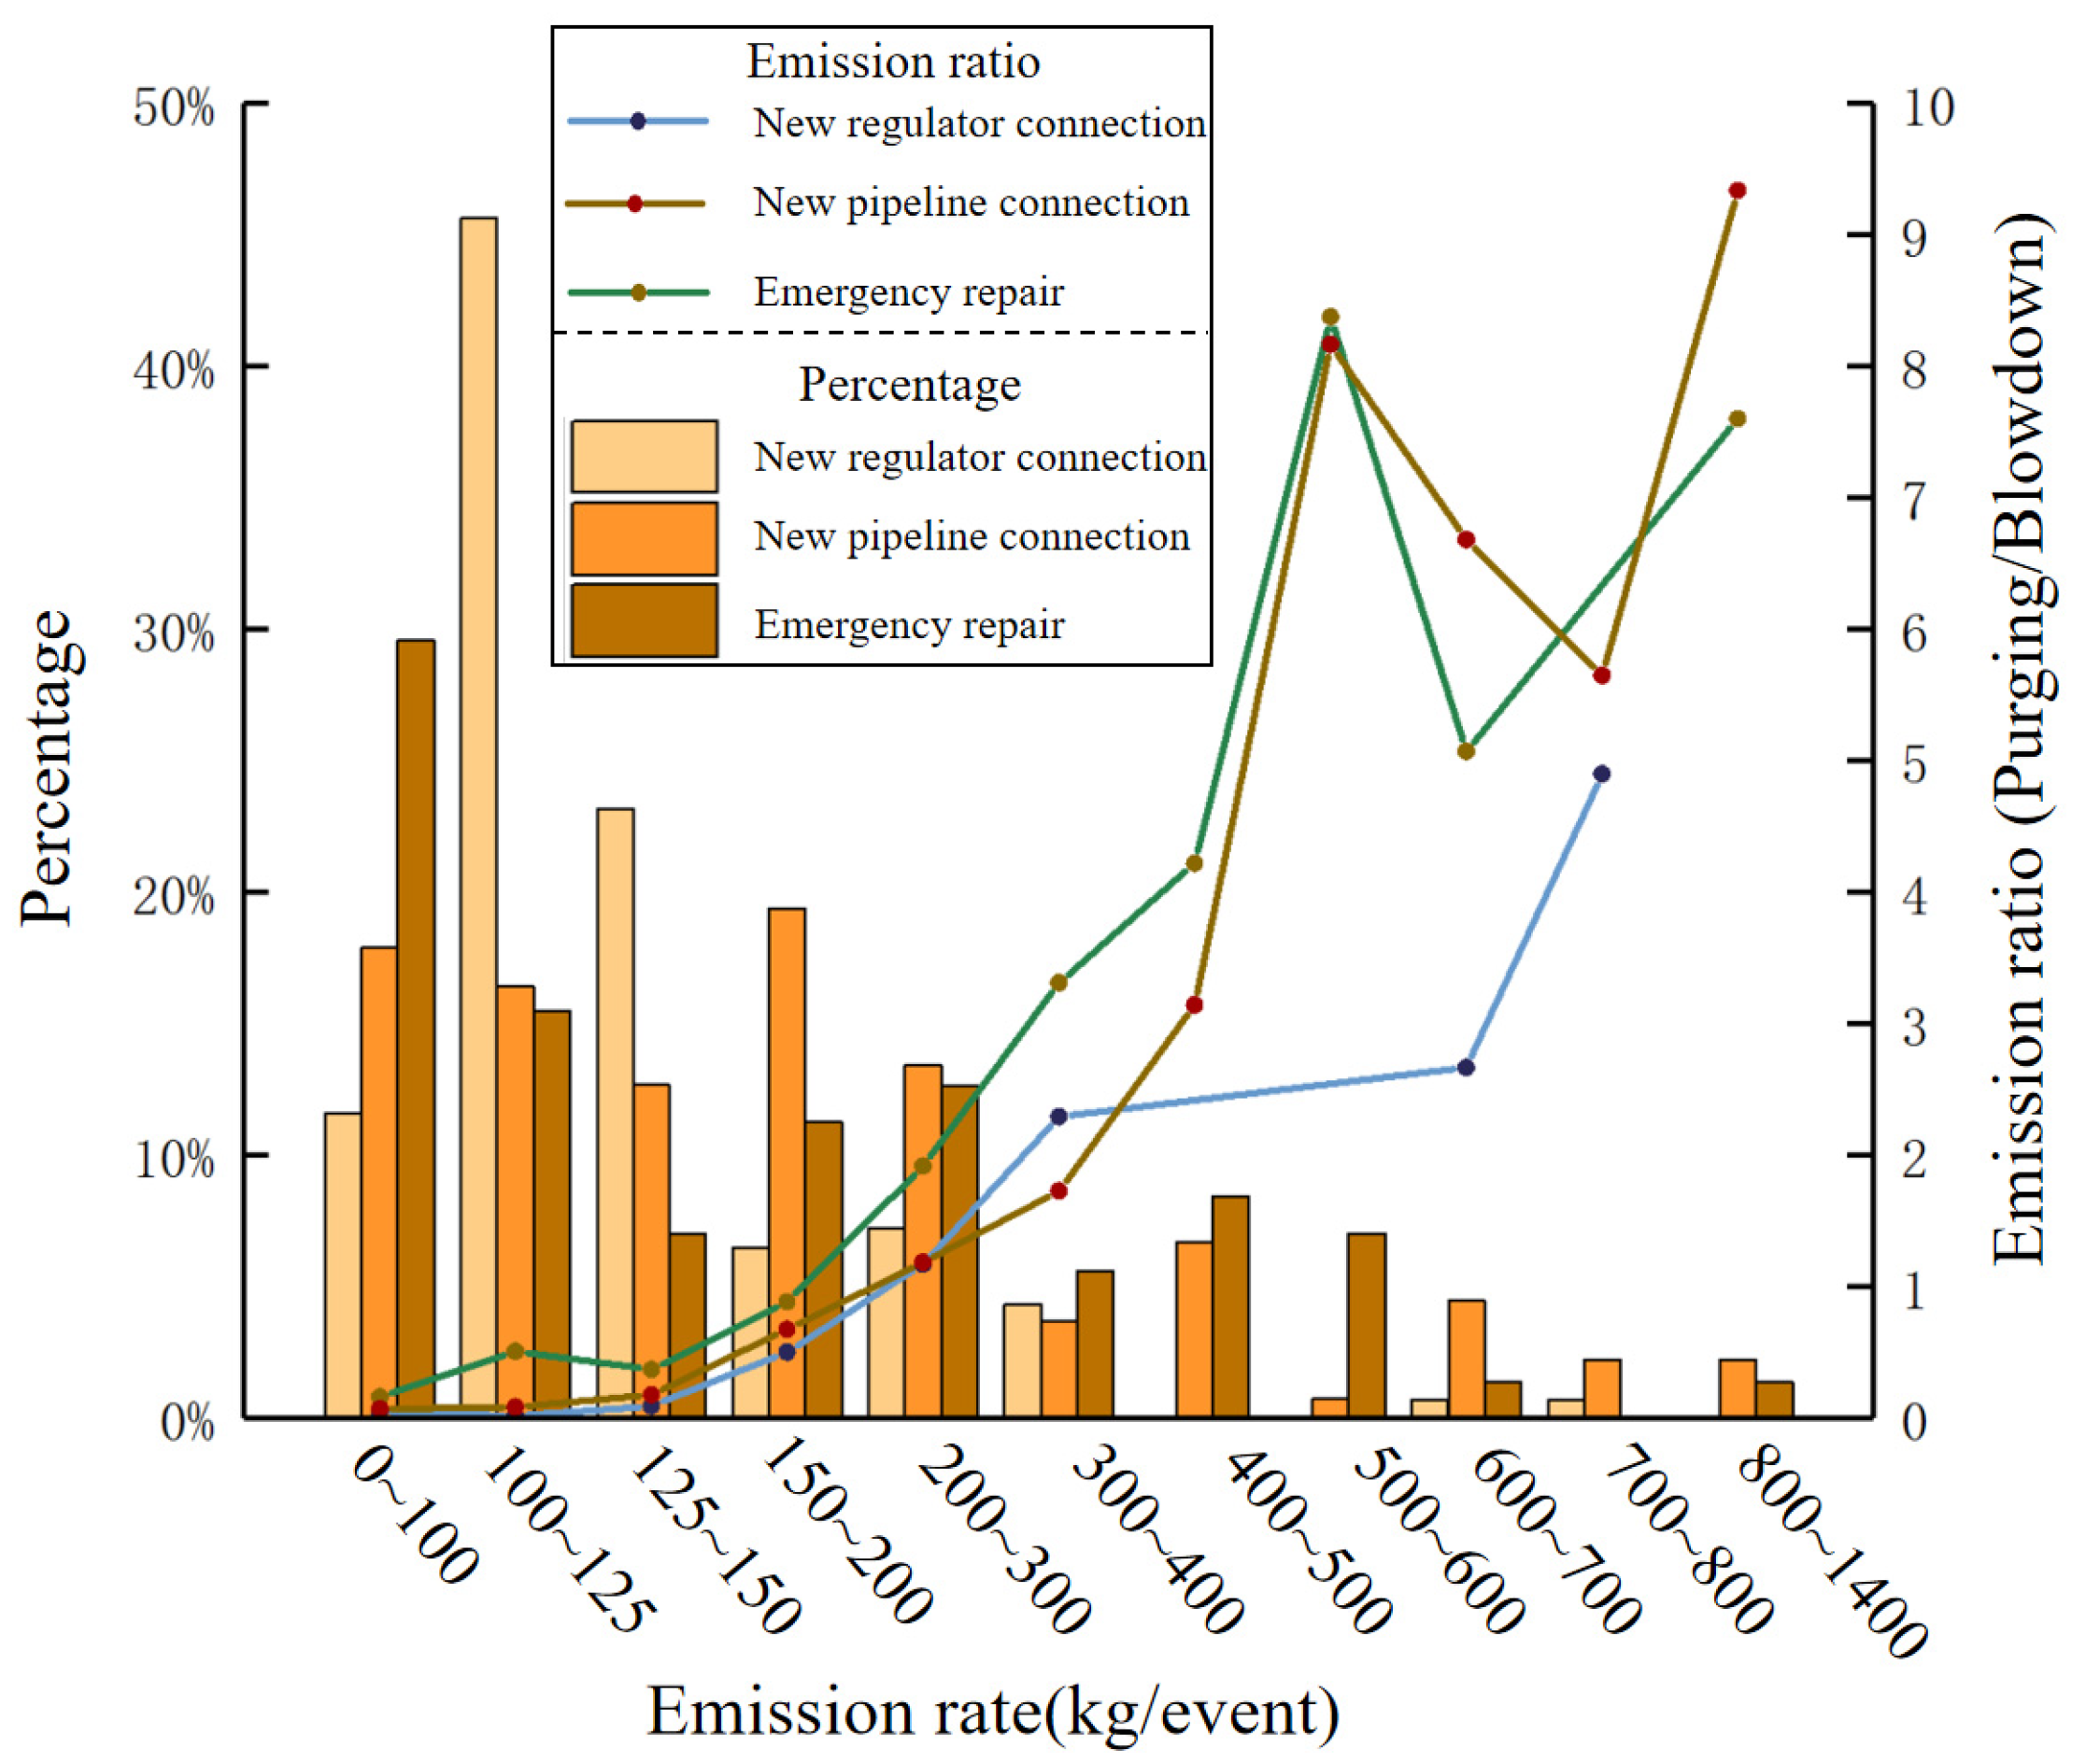
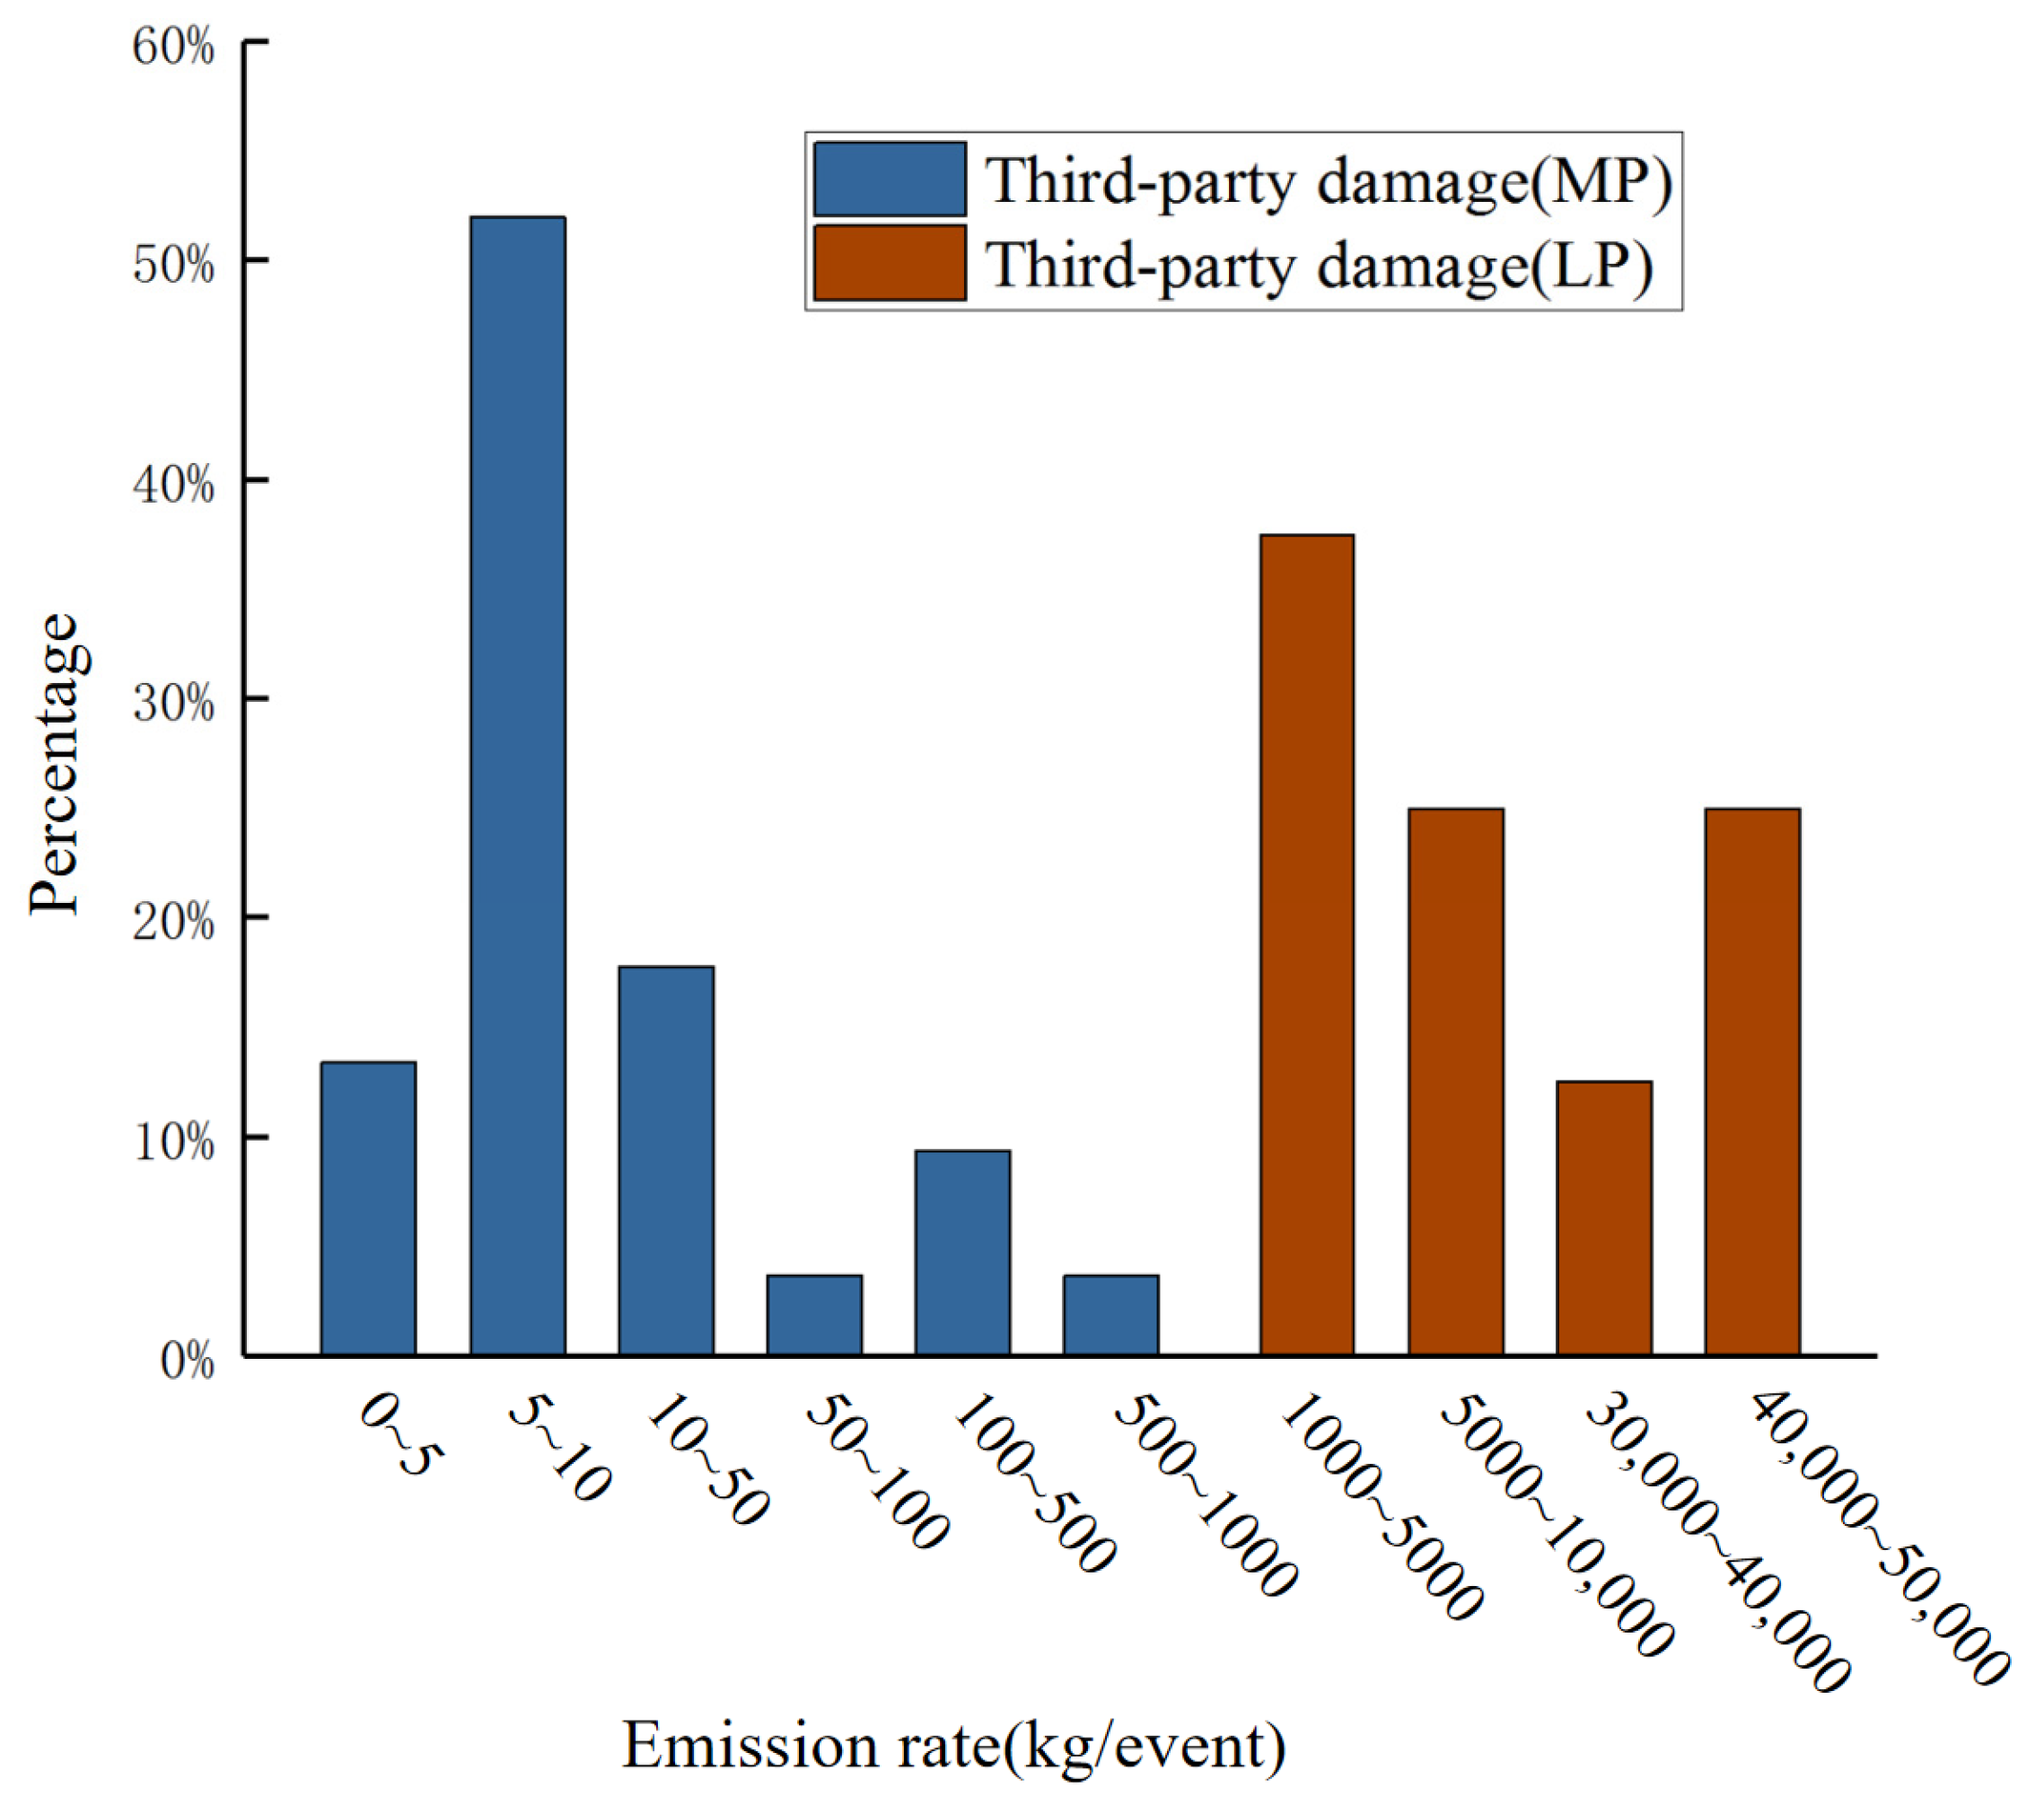
- The emission rates vary within a very broad range because of the difference of network structure. The average emission rates of new pipeline connections, new regulator connections, emergency repairs, third-party damages (MP) and third-party damages (LP) are 234 kg, 147 kg, 217 kg, 17,282 kg and 62 kg, respectively.
- ④
- Total methane emission for all these emission sources is 223.8 t. Estimating methane emission of these sources in China according to the number of customers and the amount of gas consumption, it is 44536 t and 59083 t, respectively, which accounts for 0.08% and 0.1% of methane emission in China.
Author Contributions
Funding
Data Availability Statement
Acknowledgments
Conflicts of Interest
References
- Intergovernmental Panel on Climate Change. Climate Change 2014: Synthesis Report. Available online: https://www.ipcc.ch/site/assets/uploads/2018/05/SYR_AR5_FINAL_full_wcover.pdf (accessed on 12 November 2022).
- Izrael, Y.A.; Semenov, S.M.; Anisimov, O.A.; Anokhin, Y.A.; Velichko, A.A.; Revich, B.A.; Shiklomanov, I.A. The fourth assessment report of the intergovernmental panel on climate change: Working group II contribution. Russ. Meteorol. Hydrol. 2007, 32, 551–556. [Google Scholar] [CrossRef]
- Intergovernmental Panel on Climate Change. Anthropogenic and Natural Radiative Forcing. Available online: https://www.ipcc.ch/site/assets/uploads/2018/02/WG1AR5_Chapter08_FINAL.pdf (accessed on 12 November 2022).
- PBL Netherlands Environmental Assessment Agency. Trends in Global CO2 and Total Greenhouse Gas Emissions. Available online: https://www.pbl.nl/en/publications/trends-in-global-co2-and-total-greenhouse-gas-emissions-2020-report (accessed on 12 November 2022).
- Intergovernmental Panel on Climate Change. Global Warming of 1.5 °C. Available online: https://www.ipcc.ch/sr15/ (accessed on 12 November 2022).
- U.S. Environmental Protection Agency. Inventory of U.S. Greenhouse Gas Emissions and Sinks: 1990–2013. Available online: http://www.epa.gov/climatechange/Downloads/ghgemissions/US-GHG-Iventory-2015-Main-Text.pdf (accessed on 12 November 2022).
- Alvarez, R.A.; Pacala, S.W.; Winebrake, J.J.; Chameides, W.L.; Hamburg, S.P. Greater focus needed on methane leakage from natural gas infrastructure. Proc. Natl. Acad. Sci. USA 2012, 109, 6435–6440. [Google Scholar] [CrossRef] [PubMed]
- Liu, R.E.; Ravikumar, A.P.; Bi, X.T.; Zhang, S.; Nie, Y.; Brandt, A.; Bergerson, J.A. Greenhouse gas emissions of western Canadian natural gas: Proposed emissions tracking for life cycle modeling. Environ. Sci. Technol. 2021, 55, 9711–9720. [Google Scholar] [CrossRef] [PubMed]
- Gao, J.; Guan, C.H.; Zhang, B. Why are methane emissions from China’s oil & natural gas systems still unclear? A review of current bottom-up inventories. Sci. Total Environ. 2022, 807, 151076. [Google Scholar] [PubMed]
- Zaimes, G.G.; Littlefifield, J.A.; Augustine, D.J.; Cooney, G.; Schwietzke, S.; George, F.C.; Skone, T.J. Characterizing regional methane emissions from natural gas liquid unloading. Environ. Sci. Technol. 2019, 53, 4619–4629. [Google Scholar] [CrossRef] [PubMed]
- Allen, D.T.; Torres, V.M.; Thomas, J.; Sullivan, D.W.; Harrison, M.; Hendler, A. Measurements of methane emissions at natural gas production sites in the United States. Proc. Natl. Acad. Sci. USA 2013, 110, 17768–17773. [Google Scholar] [CrossRef] [PubMed]
- Brantley, H.L.; Thoma, E.D.; Squier, W.C.; Guven, B.B.; Lyon, D. Assessment of methane emissions from oil and gas production pads using mobile measurements. Environ. Sci. Technol. 2014, 48, 14508–14515. [Google Scholar] [CrossRef] [PubMed]
- Mitchell, A.L.; Tkacik, D.S.; Roscioli, J.R.; Herndon, S.C.; Yacovitch, T.I.; Martinez, D.M. Measurements of methane emissions from natural gas gathering facilities and processing plants: Measurement results. Environ. Sci. Technol. 2015, 49, 3219–3227. [Google Scholar] [CrossRef] [PubMed]
- Allen, D.T.; Pacsi, A.P.; Sullivan, D.W.; Zavala-Araiza, D.; Pacsi, A.P.; Harrison, M.; Keen, K.; Seinfeld, J.H. Methane emissions from process equipment at natural gas production sites in the United States: Pneumatic controllers. Environ. Sci. Technol. 2015, 49, 633–640. [Google Scholar] [CrossRef] [PubMed]
- Tavakkoli, S.; Feng, L.; Miller, S.M.; Jordaan, S.M. Implications of generation efficiencies and supply chain leaks for the life cycle greenhouse gas emissions of natural gas-fired electricity in the United States. Environ. Sci. Technol. 2022, 56, 2540–2550. [Google Scholar] [CrossRef] [PubMed]
- Brandt, A.R.; Heath, G.A.; Kort, E.A.; O’Sullivan, F.; Pétron, G.; Jordaan, S.M. Methane leaks from north American natural gas systems. Science 2014, 343, 733–735. [Google Scholar] [CrossRef] [PubMed]
- Wennberg, P.O.; Mui, W.; Wunch, D.; Kort, E.A.; Blake, D.R.; Atlas, E.L. On the sources of methane to the Los Angeles atmosphere. Environ. Sci. Technol. 2012, 46, 9282–9289. [Google Scholar] [CrossRef] [PubMed]
- Peischl, J.; Ryerson, T.B.; Brioude, J.; Aikin, K.C.; Andrews, A.E.; Atlas, E. Quantifying sources of methane using light alkanes in the Los Angeles basin, California. J. Geophys. Res. Atmos. 2013, 118, 4974–4990. [Google Scholar] [CrossRef]
- Mckain, K.K.; Down, A.; Raciti, S.M.; Budney, J.; Hutyra, L.R.; Floerchinger, C. Methane emissions from natural gas infrastructure and use in the urban region of Boston, Massachusetts. Proc. Natl. Acad. Sci. USA 2015, 112, 1941–1946. [Google Scholar] [CrossRef] [PubMed]
- Lebel, E.D.; Lu, H.S.; Speizer, S.A.; Finnegan, C.J.; Jackson, R.B. Quantifying methane emissions from natural gas water heaters. Environ. Sci. Technol. 2020, 54, 5737–5745. [Google Scholar] [CrossRef] [PubMed]
- Boothroyd, L.M.; Almond, S.; Worrall, F.; Davies, R.K.; Davies, R.J. Assessing fugitive emissions of CH4 from high-pressure gas pipelines in the UK. Sci. Total Environ. 2018, 631–632, 1638–1648. [Google Scholar] [CrossRef] [PubMed]
- Safavian, A.; Honarvar, B.; Aboosadi, Z.A.; Esfandiari, N. Measuring and estimating of fugitive emissions in normal operations. S. Afr. J. Chem. Eng. 2020, 34, 107–115. [Google Scholar]
- Barroso, J.; Solis, J.M.; Ballester, J.; Pina, A. Evaluation of methane emissions from polyethylene gas distribution systems at medium pressure. J. Nat. Gas Sci. Eng. 2009, 1, 144–153. [Google Scholar] [CrossRef]
- Hendrick, M.F.; Ackley, R.; Sanaie-Movahed, B.; Tang, X.; Phillips, N.G. Fugitive methane emissions from leak-prone natural gas distribution infrastructure in urban environments. Environ. Pollut. 2016, 213, 710–716. [Google Scholar] [CrossRef] [PubMed]
- Lamb, B.K.; Cambaliza, M.O.L.; Davis, K.J.; Edburg, S.L.; Ferrara, T.W.; Floerchinger, C. Direct and indirect measurements and modeling of methane emissions in Indianapolis, Indiana. Environ. Sci. Technol. 2016, 50, 8910–8917. [Google Scholar] [CrossRef] [PubMed]
- American Petroleum Institute. Compendium of Greenhouse Gas Emissions Methodologies for the Oil and Natural Gas Industry. Available online: https://www.api.org/~/media/Files/EHS/climate-change/2009_GHG_COMPENDIUM.pdf (accessed on 12 November 2022).


| Emission Source | Numbers | Blowdown (kg) | Purging (kg) | Leakage (kg) | Total (kg) |
|---|---|---|---|---|---|
| New pipeline connection | 134 | 18,114 | 13,189 | 0 | 31,303 |
| New regulator connection | 138 | 5074 | 15,150 | 0 | 20,224 |
| Emergency repair | 71 | 10,004 | 5378 | 0 | 15,382 |
| Third-party damage (MP) | 8 | 0 | 731 | 137,526 | 138,257 |
| Third-party damage (LP) | 298 | 0 | NA | 18,607 | 18,607 |
| Total | 649 | 33,192 | 34,448 | 156,133 | 223,773 |
| Segment/Source | Factor (kg/Event) | Segment/Source | Factor (kg/Event) |
|---|---|---|---|
| New pipeline connection | 233.6 (195.8–271.4) | Blowdown | 96.8 (78.3–115.3) |
| New regulator connection | 146.5 (130.6–162.5) | Purging | 98.1 (95.2–101.0) |
| Emergency repair | 216.6 (173.4–259.8) | Leakage (MP) | 17,190.7 (1602.0–2779.5) |
| Third-party damage (MP) | 17,282.1 (1694.0–32,870.2) | Leakage (LP) | 62.4 (43.3–81.5) |
| Third-party damage (LP) | 62.4 (43.3–81.5) | ||
| Uncertainty limits: estimated as the 95% confidence limit | |||
Disclaimer/Publisher’s Note: The statements, opinions and data contained in all publications are solely those of the individual author(s) and contributor(s) and not of MDPI and/or the editor(s). MDPI and/or the editor(s) disclaim responsibility for any injury to people or property resulting from any ideas, methods, instructions or products referred to in the content. |
© 2023 by the authors. Licensee MDPI, Basel, Switzerland. This article is an open access article distributed under the terms and conditions of the Creative Commons Attribution (CC BY) license (https://creativecommons.org/licenses/by/4.0/).
Share and Cite
Xie, Y.; Qin, C.; Wu, C.; Zhang, L.; Cao, P. Evaluation of Methane Emissions in Daily Operations and Accidents: A Case Study of a Local Distribution Company in China. Energies 2023, 16, 1582. https://doi.org/10.3390/en16041582
Xie Y, Qin C, Wu C, Zhang L, Cao P. Evaluation of Methane Emissions in Daily Operations and Accidents: A Case Study of a Local Distribution Company in China. Energies. 2023; 16(4):1582. https://doi.org/10.3390/en16041582
Chicago/Turabian StyleXie, Yitong, Chaokui Qin, Cong Wu, Lubing Zhang, and Ping Cao. 2023. "Evaluation of Methane Emissions in Daily Operations and Accidents: A Case Study of a Local Distribution Company in China" Energies 16, no. 4: 1582. https://doi.org/10.3390/en16041582
APA StyleXie, Y., Qin, C., Wu, C., Zhang, L., & Cao, P. (2023). Evaluation of Methane Emissions in Daily Operations and Accidents: A Case Study of a Local Distribution Company in China. Energies, 16(4), 1582. https://doi.org/10.3390/en16041582