Abstract
Building information modelling (BIM) is the first step towards implementing Building 4.0, where virtual reality and digital twins are key elements. The use of unmanned aircraft systems (UAS/drones) to capture data from buildings is nowadays a very popular method, so a methodology was developed to digitally integrate the photogrammetric surveys of a building into BIM, exclusively with the use of drones. Currently, buildings are responsible for 40% of energy consumption in Europe; therefore, the interconnection between BIM and building energy modelling (BEM) is essential to digitalize the construction sector, increasing competitiveness through cost reduction. In this context, the BlueWoodenHouse Project aims, among other activities, to characterize the solutions/systems of building materials and monitor the temperature, relative humidity and CO2, as well as energy consumption, of a single-family modular wooden house located in the north of Portugal, with 190 m2 and three users. Thus, the experimental monitoring results, of this case study, were used to validate the numerical model developed in the DesignBuilder simulator, which includes the building envelope’s 3D geometrical data obtained by one of those aircraft, in order to demonstrate the usefulness of drones for the optimization of solutions, from the energy point of view.
Keywords:
BIM; BEM; photogrammetric survey; sustainable construction; energy simulation; UAS; UAV; drones 1. Introduction
1.1. Background
In most developed countries, particularly in Europe, about 90% of the time is spent indoors, mostly at home. This value will tend to grow with the increase in teleworking, as recommended by the European Union [1]. As residential buildings are increasingly places for living and working, they must have suitable indoor air quality and thermal comfort requirements for their occupants.
The importance of indoor thermal comfort in residential buildings has been widely studied [2,3], as can be seen from the different studies existing in national and international literature, taking into account the impacts that lower thermal comfort has on health [4], productivity [5], and energy consumption [6,7,8].
In Portugal, as in the rest of southern Europe, the most used construction system for residential buildings is based on the intensive use of reinforced concrete and brick masonry, which results in high thermal inertia [9,10]. However, in recent years, alternative and more industrialized construction systems have proliferated throughout the world and started to gain market share in relation to more traditional solutions.
In this context, modular buildings have attracted greater attention from potential buyers, investors, and the construction industry itself, taking into account the numerous advantages of this construction method over traditional alternatives, namely: they need a smaller number of workers on site, construction processes are faster and safer, construction processes are more ecological and environmentally friendly and with more predictable completion times, there is less waste of resources, presenting numerous advantages in constructions in which units built are repeated [10].
Consequently, and since the research on building energy performance has been gaining more attention, it becomes useful to integrate and manage information from BIM (building information modelling) and BEM (building energy modelling) models [11]. Thus, it is beneficial to survey the 3D geometry of existing buildings (“as-is”) for subsequently performing energy analysis [12,13,14,15]. The use of new technologies in the study of buildings has increased, including drones [12,16,17] (also known as UAS, unmanned aircraft systems, and UAV, unmanned aerial vehicles). These devices bring various advantages, such as reduced human effort and more security, access to hard-to-reach places, reduced time of surveying, low cost, etc. [16,17,18,19]. These can be applied at different stages of a building’s life cycle [18,19,20], with different levels of adoption [19]. According to Albeaino and Gheisari [18], the main emphasis is on progress monitoring and on pre-construction activities such as site planning and site mapping.
1.2. Related Research
In their literature review about the use of UAVs for civil engineering purposes, Freeman et al. [19] noted the emerging application of using these aircraft to assist in the creation of digital models. Indeed, linking the potential of UASs with BIM along the construction’s value chain has already been discussed [21], for instance, for more efficient project management and quality control [20], and for construction safety management [22]. While the integration of these technologies has already been discussed in the literature, including using the BIM model afterwards for virtual reality purposes, the integration of UASs, BIM, and the IoT (internet of things) sensing technologies are not fully explored yet [23].
In order to create accurate geometric 3D models for energy studies of as-is buildings, reverse engineering methods must be applied [12,13,14,15]. For example, Rocha et al. [14] studied the thermal comfort of a bus station during the winter season. The study aimed to choose the best thermal comfort retrofitting solution possible. A laser scanner was used to acquire the geometrical data, which was used to create the BIM model before the BIM-to-BEM process. Through the BEM model, alternative scenarios were presented and analysed, not only in terms of the energy performance of the station but also an economical overview.
Gigliarelli et al. [24,25,26] used a laser scanner and terrestrial photogrammetry to establish an approach to analyse the energy performance of buildings of historical interest. Implementing heritage BIM (HBIM) models for this purpose is considered a challenge as it is necessary to simplify the building’s geometry to run simulations successfully on proper software. No sensors were used in this methodology to compare the simulations with reality, though. Nagy and Asharaf [27] went further by creating a real-time platform to visualise the energy performance of heritage buildings using smart sensing, applied to a case study in Egypt. Laser scanner and photogrammetric data were acquired to develop the HBIM model. The BEM model created afterwards was calibrated using real-time data from the sensors installed inside the building.
Despite being useful for on-site data acquisition for further BIM integration, laser scanners demand significant human action, thus, drones can replace them in many cases [21]. For instance, Maiolatesi et al. [28] performed an energy analysis to assess how neighbouring buildings influenced energy simulations by comparing two BEM models (one with and the other without the surrounding buildings) with the actual energy consumption of the building under study. A drone was used to acquire external geometry and a laser scanner detected the internal geometry of the apartments. These were then imported into BIM before following a BIM-to-BEM framework.
Gorzalka et al. [29] present an approach to automatically generate a BEM model of an existing building from UAV photogrammetric point clouds. Python was used in this process, creating a CityGML file to be simulated on BEM software (Modelica in this case). The building under study was monitored for 21 days, both the interior and the exterior. Then the simulated interior temperatures of the model were compared with those from the monitoring campaign so that further calculations could be made after calibration.
The drone-exclusive framework proposed by Benz et al. [30] assesses the as-is building’s energy performance based on photogrammetric and thermographic data, which is used for a BIM-to-BEM approach calibrated by sensors installed inside and outside the building. The thermographic data allowed for the estimation of U-values, and the BEM model was obtained by converting the IFC file from the BIM software (Graphisoft ArchiCAD) to an IDF file, which was used for the energy simulation on TRNSYS.
1.3. Research Significance
According to KPMG International, the level of drone adoption in the construction sector is around 26% worldwide, with 45% starting to use them [31]. This value is still far from the Portuguese reality, for example, which is only 4% [32]. As such, this article intends to demonstrate the usefulness of drones for optimising solutions from the energy point of view.
The development of digital models of existing buildings, in particular of models that are suitable for simulating energy performance, has long been a common albeit laborious task. These models are expected to become increasingly relevant with the greater prominence of digital twins in academic and industrial applications. Therefore, reducing the cost and time required to obtain suitable as-is models of buildings is a relevant research goal.
This paper explores the use of surveying and modelling tools to obtain building information and energy models. A detailed workflow is presented in the next section, using drones to perform photogrammetric surveys of buildings, BIM to establish a suitable information model, and BEM to develop energy simulations. This workflow is tested with a case study about a building in the north of Portugal. The case study is presented in Section 2, and the results are described in Section 3.
2. Materials and Methods
2.1. Methodology for Photogrammetric Surveys of Buildings with Drones
In recent decades, there has been an increasing interest in studying as-is buildings’ energy performance. This analysis can be improved by integrating BEM with BIM. BIM models can include information that is then traditionally introduced manually in a BEM model, thus, providing cost and time savings [11]. Therefore, to conduct an energy analysis of an existing building, it is interesting to collect data on its 3D geometry prior to that evaluation [12,13,14,15].
This work will follow a previously created methodology that digitally integrates the data acquired by the photogrammetric survey into BIM and BEM environments solely using a drone [33,34,35,36]. This method’s quantitative approach will then be further extended through a case study located in the north of Portugal.
2.1.1. Reconnaissance and Preparation
It is essential to follow a methodology to initiate the photogrammetric survey process with UASs. The first step is to consult the local legislation and plan the flight in terms of trajectories and local conditions [37,38,39,40], in addition, if possible, to seek useful information about the building to be surveyed, to aid the BIM modelling process [14,37,38,40,41].
Applicable Legislation
The first procedure when planning a drone survey is to ascertain if the aircraft can or cannot fly in that area. The local airspace legislation may restrict the flight height or, in a worst-case scenario, completely prohibit it if the operation is close to airports, for instance. In Portugal, these areas are defined by the Portuguese Civil Aviation Authority (ANAC) [42].
Countries under the European Union Aviation Safety Agency (EASA) jurisdiction must follow common rules, including drone flights. The Commission Delegated Regulation (EU) 2019/945 [43] states that the aircraft is classified depending on the UAS characteristics (not only, but in particular, its weight and maximum speed). Then, the Commission Implementing Regulation (EU) 2019/947 [44], divides them into categories and subcategories according to the operational risks they pose, which will influence the distance the drone can be from people and buildings. If they present a high operational risk (i.e., from the “specific” and “certified” categories), security measures and a safety plan must be adopted after being previously approved by the competent authorities.
The Commission Implementing Regulation (EU) 2019/947 also states that the UAS, the remote pilot, and the drone operator (the “owner”) must all be registered on the national aviation authority website and that only EASA-certified remote pilots can legally fly these aircraft, as long as they pass the qualification courses and exams [44].
Assessment of Site Conditions—Obstacles and Weather Conditions
Even when it is permitted to fly a drone in a given geographic area, other issues must be considered, including overflight restrictions from places such as schools, public parks, hospitals, power plants, prisons, or military facilities. Applications such as Guardian by Altitude Angel (available as a website and a mobile application) [45] can be used to assess this information prior to the flight. Furthermore, flight planning approaches must take into account constraints such as:
- −
- The UAS battery and the existing airspace regulations [46];
- −
- The existence of obstacles and the correct GPS signal for proper georeferencing [17];
- −
- Wind speed and direction [47];
- −
- Precipitation, which causes noise in the images due to water droplets and consequently erroneous results [47];
- −
- Adverse weather conditions such as storms and the presence of other manned or unmanned aircraft in the vicinity [48] present relevant safety risks;
- −
- Attacks from nearby birds [49];
- −
- Proximity to electromagnetic fields, especially if it is intended to fly in the vicinity of high voltage cables, because electromagnetic interference may disturb the correct functioning of the equipment [40].
In addition to the equipment issues, remote pilots should consider their piloting conditions. I’M SAFE (Illness, Medication, Stress, Alcohol, Fatigue, and Emotion) [50] is a self-assessment checklist that pilots can follow to determine their readiness to fly safely.
Flight Planning
When an obstacle-free flight is possible, it is suggested to plan the survey with applications capable of automating the operation, such as the DroneDeploy [51] or Drone Harmony [52]. Applications such as these can set, for instance, the flight path, the desired percentage of image overlay, and the image capture angle of the cameras.
Rakha and Gorodetsky [17] analysed the most commonly used flight heights, distances to façades, and overlap percentages in the literature. They conclude that, empirically, a minimum overlap percentage of 70% in grid-shaped flights and 90–95% in elliptical-shaped flights is recommended. Besides the flight planning constraints mentioned previously, which need to be taken into account for a safe operation, the following protocol is a suggestion for data acquisition with a UAS:
- −
- Flight height should be higher than the largest building in the area, and it is advisable not to exceed this height by 1.5 times [12];
- −
- Distance to the façade—there are several alternatives, but the suggestion is that the remote pilot will suit this distance according to the building’s surroundings (presence of walls or other buildings, for example);
- −
- Flight plan can be circular, elliptical, grid-shaped [17], or Y-shaped (multiple flights overlapping each other) [12];
- −
- Camera angle—camera angles outside the 5°–60° range should be avoided to prevent radiation reflections [47]. For photogrammetric purposes, an angle of 45° is suggested [37];
- −
- Overlap of about 90% is suggested for adjacent images [17,53].
Project Elements
As suggested by Shibasaki [40], the collection of information about the building through documents such as design elements, construction records (such as the work diary), photographic or video records, and as-built drawings are useful for the correct geometric survey of the building.
These design elements are important for geometric modelling and for the correct acquisition of the properties of the materials to be later integrated into the BIM model [41]. Indeed, the proper acquisition of these properties is an essential step for quantitative approaches, such as the quantification of the thermal properties of the materials, i.e., the coefficient of thermal transmission (U) and the thermal resistance (R), fundamental for the analysis of the energy performance of a building [54,55]. It should be taken into account that these properties affect the thermal comfort conditions of a building. Commonly, these properties are considered constant for the same element, which is not always true because the maintenance conditions of a building may change throughout its life cycle [55].
2.1.2. Image Collection Using Drones
In the phase after the initial study of the selected building, the equipment must be calibrated and, if necessary, the site prepared with methods to support georeferencing [38,39,40,56]. After following the previous steps, the drone operation is set to begin.
Equipment Calibration
In order to start the flight and consequently collect images with the UAV, calibrations must first be carried out for the safe and correct operation of the device. This step includes the calibrations of the cameras of the vision systems and infrared positioning sensors, the compass, and the inertial measurement unit (IMU)—accelerometer, gyroscope, thermometer, and barometer. One must follow the aircraft’s user manual for a correct procedure.
Georeferencing Support Methods
It is possible to adopt targets as a way to visually mark on-the-ground auxiliary points for georeferencing purposes (GCPs—ground control points) and evaluate the accuracy of the photogrammetric reconstruction in comparison to the reality (checkpoints) on appropriate photogrammetric software [37,57]. These must be clearly visible from the air and evenly distributed in the area that will be surveyed, as well as ensuring they are firmly placed so that they cannot be easily moved [58]. These markers are commonly used when a high degree of absolute precision is needed, such as for topographic surveys [57,58,59,60,61].
Drones equipped with RTK (real-time kinematic) or PPK (post-processed kinematic) may dismiss the use of GCPs, as they will not substantially influence the absolute accuracy of the georeferencing [57,60,62]. Even if a survey is GCP-free, it is still possible to produce accurate 3D results [61,62]; however, issues with the orientation, scale or absolute position of the reconstruction may occur as a consequence [62].
If no real geographical coordinate points are required (i.e., the absolute accuracy of the project), points that appear in multiple images (known as tie points) can replace the GCPs to improve the relative accuracy of the photogrammetric project (i.e., how close geometries in the reconstruction compares with the reality, for example, a distance) [58,62].
A high degree of absolute accuracy will often be unnecessary for photogrammetric models that will be incorporated into 3D BIM modelling software [61]; thus, physical markers may be dispensable [59]. If needed, tie points of the building (e.g., the corner of a window) can be a valid replacement to improve the quality of the photogrammetric model [38,62]. It is recommended to use between five and ten points in the reconstruction process and assess its precision [62,63].
Image Collection
With the preflight stages completed, the photogrammetric drone survey may begin. One must remember that it is crucial to have all the up-to-date documents, identifications, and insurance to fly the drone legally when performing the survey to avoid possible wrongdoings [33,34,36].
2.1.3. Processing and Analysis of the Collected Images
After the image acquisition, the process of digitally rebuilding the building is performed with photogrammetric data reconstruction software, and the generated point cloud should be cleaned [37,38,40]. This process strongly influences the subsequent BIM modelling [37,39,56].
Photogrammetric Model (Point Cloud and 3D Mesh Model)
At this stage of the methodology, a representation of the current state (“as-is”) of the surveyed building will be created based on the georeferenced images collected during the aerial survey [37,38]. Proper software based on structure-from-motion (SfM) algorithms must be used at this stage to provide satisfactory results regarding accuracy [37]. SfM uses the acquired images’ EXIF metadata to automatically calibrate, match, and align them so that a sparse point cloud can be created. Subsequently, the cloud can be densified by applying a multi-view-stereo (MVS) algorithm [37,60,64].
The creation of a 3D BIM model depends on the accuracy of the software used in this process; therefore, the best available software must be used at this step [65]. Pix4Dmapper and Agisoft Metashape, which have been tested in previous UAS-based point cloud reconstruction operations [64], are among the SfM-based software suggestions.
Point Cloud Cleaning
Point clouds generated by the processes described above typically contain unwanted points from the background or the surroundings of the objects of interest (e.g., buildings, trees, sky, etc.), which should be removed [38,40,66]. This process of cleaning the unwanted points which do not belong to the model is performed manually [37] through specific cleaning tools in the software, such as crop and delete [33,67].
Due to this cleaning process, the point cloud will require less computer power, preventing software lag, as the files will be smaller. Also, as a result of this process, it will be easier to perceive the building itself [66,67], which will ease the modelling process afterwards [66].
2.1.4. Integration and Modelling in BIM Environment
In order to incorporate the point cloud created from the photogrammetric data into BIM environment, it is first necessary to export it from the SfM software used. Although Autodesk Revit is one of the world’s most used BIM software [15,37], it has some particularities regarding its point cloud importation procedure; nevertheless, the subsequent modelling process itself is similar to other BIM solutions. This manual BIM modelling stage is performed by using the imported point cloud as a guide [14,28,37,39,66].
Import to a BIM Authoring Software
Before importing the point cloud into the BIM authoring software, one must export it in a format that can be properly integrated for further modelling. According to Opincar [65], the LAS (LASer) format is recommended because it is suitable for point clouds created from photogrammetric methods and LiDAR data [65], as it can support any three-dimensional x, y, z dataset [68]. This format can be exported from several applications, including Agisoft Metashape and Pix4Dmapper [33]. Note that this binary file format was created and is maintained as a public standard by the American Society for Photogrammetry and Remote Sensing (ASPRS) [68].
When Autodesk Revit is used, some intermediate processes are required to convert the point cloud data to a readable format by this software. The LAS file must be imported into Autodesk Recap first and then exported as either an rcs or rcp file, so that Autodesk Revit can successfully read the point cloud [37,69].
The procedure described above was validated by Martinez-Carricondo et al. [37] during their reconstruction work using a UAV-based photogrammetric survey to create an HBIM model of a historical building in Níjar, Almería, Spain.
BIM Modelling
After importing the point cloud into the BIM authoring application, its orientation should be adjusted, and the building’s levels should be set [37]. The model must be oriented correctly to obtain accurate energy simulations [70].
The point cloud can then be used to guide the modelling process for the visible building elements, such as external walls, roofs, doors, and windows [37,71]. These elements’ correct dimensions and locations are critical for the later energy analysis [71]. The material’s properties in the BIM model are a key factor for this analysis; therefore, those properties must be considered during the modelling process [41].
2.1.5. Energy Simulations on BEM Software
In order to carry out energy simulations, first it is necessary to analyse the formats of data transfers between the BIM modelling applications and the programs where the energy simulations will take place [72,73]. In this section, some suggestions are presented to carry out energy simulations from a photogrammetric survey with a UAV, briefly addressing the main data transfer formats between BIM and BEM and procedures to carry out the simulations.
The photogrammetric data acquired during the survey is fundamental, as the geometrical data serves as the basis for the BEM model. The building’s physical properties are all linked to its geometry, whereas the systems and the building’s operational data are inserted manually and edited directly in the BEM software [66,74].
From BIM to BEM—Data Transfer Formats
Several file formats are available to transfer information between BIM and BEM software to perform energy simulations, such as IFC (Industry Foundation Class), gbXML (Green Building eXtensible Markup Language) [11,70,71,72,73], CityGML (City Geography Markup Language) [29,56] and IDF (Input Data File) [11,30,74]. IFC and gbXML are considered the most commonly used BIM-to-BEM formats [11,72,75]; nonetheless, gbXML has been proven to have superior performance for this process, as it can correctly transfer the (simplified) geometry, materials, and thermal zones of the model [11,75].
gbXML is a data file that stores information according to a hierarchy capable of integrating thermal data with geometric data of a given building [70]. However, the interoperability between BIM and BEM software is not seamless; therefore, interoperability issues in this BIM-to-BEM process must be checked and corrected [11,66,72,73,76]. In particular, it is recommendable to simplify the building geometry [24,26,70,75,77], to avoid collisions between elements, since they create openings in the BEM model [70].
From BIM to BEM—Energy Simulations and Software
Before exporting to BEM software, “spaces” must be created in the BIM model covering the entire building volume, which is a key step for energy simulations [70,72,75,77]. A space corresponds to a closed volume that is thermally simulated and to which thermal properties are attributed [70]. These spaces are of vital importance as they will create the energy analytical model [72,74]; therefore, if gaps or geometric flaws exist in this space, the model may not even be exported correctly [66,72].
“Rooms” should also be created, as useful information for energy simulations is linked to them, such as the occupancy of the building [77,78].
There are many energy simulation software, but not all are compatible with BIM applications [70]. DesignBuilder, for instance, is a BEM application that accepts gbXML files from a BIM authoring software with a building’s geometry as input. The properties needed to perform the simulation can be added in DesignBuilder to avoid information losses in the transference process [66,78], or through a plug-in between BIM and BEM applications [75,77].
When building a BEM model, one must ensure that the model meets the information requirements to proceed with the energy simulations. These requirements include the building geometry, material properties, HVAC systems, lighting features, local weather data, and operations data (occupancy, schedules, etc.) [70,74,79].
Figure 1 summarizes the process described previously, applied to the case study presented hereafter.
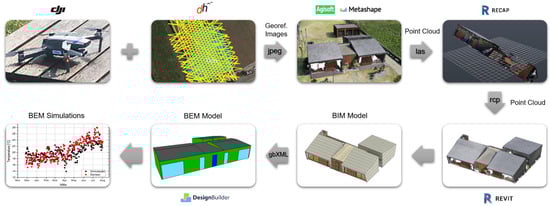
Figure 1.
UAS-BIM-BEM procedure adopted for the housing under study, from the programmed aerial photogrammetric survey to the BIM model and posterior BEM model and its energy simulations.
2.2. Case Study
2.2.1. Experimental Monitoring
The case study is a single-family wooden house located in the north of Portugal, with a covered area of 190 m2, in full use, that is, inhabited by a family of three people (two adults and one child). The energy sources associated with this house are: (i) natural gas for cooking; (ii) electricity for heating, cooling, ventilation, and domestic hot water; and (iii) heat pump for sanitary water heating.
The monitoring plan included measuring at 15 min intervals the temperature, relative humidity (RH), and CO2 concentration (ppm), using 7 HOBO MX CO2 sensors distributed over different rooms of the house (kitchen, living room, social zone, room 1, room 2, room 3 and bathroom 3). A HOBO UX100 sensor (which measures temperature and RH) was placed on the exterior, with an acquisition every 15 min, and the results of this sensor allowed the creation of the weather file used in the numerical simulations, based on the weather file of Esposende, where the building is located. Figure 2 shows the floor plan of the house as well as the monitoring positions and AC equipment. The sensors were placed outside the direct area of influence of the AC equipment to avoid disturbances.
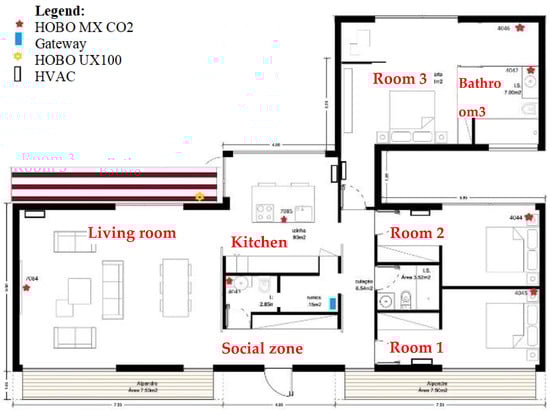
Figure 2.
Location of the different sensors used in the experimental campaign and HVAC equipment.
Monitoring started in November 2021 and this work presents an analysis of the data focused on the air temperature obtained between December 2021 and November 2022 (1 year of the experimental campaign).
2.2.2. Numerical Simulation
In this work, the numerical simulation was carried out using DesignBuilder, an energy simulation software from EnergyPlus. For this purpose, the numerical model was also divided into different thermal zones that represent an approximation of the housing divisions, as seen in Figure 2.
DesignBuilder was chosen for the building energy simulation (BES) because it is an interface for EnergyPlus, which enables the simulation to be completed within the DesignBuilder interface and utilises a complex system of modules and algorithms to estimate the energy needs for heating, cooling, ventilation, hot water production, lighting, and appliance electrical needs. The surface heat balance manager, air heat balance manager, and building systems simulation manager represent the main three modules interacting with the integrated solution manager, which simultaneously handles all module interactions. The thermal comfort was evaluated using the adaptive model for thermal comfort EN16798-1 [80], which offers acceptable indoor temperature limitations as a function of the exponential weighted running mean of the outdoor temperature.
The walls, roof, and floor are composed of oriented strand board (OSB) plates with thermal insulation. The exterior walls have the following components from the exterior to the interior face: slate tiles, air layer (0.02 m), vapour permeable membrane, OSB (0.012 m), mineral wool (0.09 m), OSB (0.012 m), vapour barrier and, finally, plasterboard as an internal finish.
The floor is in contact with the ground and consists of a concrete slab (0.2 m), followed by waterproofing and vapour barrier, OSB (0.012 m), mineral wool (0.09 m), OSB (0.012 m), and a floating wood floor (0.012 m). Finally, the roof, which is sloped and not accessible, has slate tiles, vapour permeable membrane, air layer (0.02 m), OSB (0.012 m), mineral wool (0.18 m), OSB (0.012 m), vapor barrier, and as an interior finish a suspended ceiling system with plasterboard.
Table 1 presents the physical and thermal properties of the materials used in the walls, floor, and ceiling. All the windows are double-glazed, with 6 mm and 4 mm glass, with a low emissivity coating, plus a 16 mm argon layer with an aluminium frame with thermal break. The thermal conductivity Uw is 1.1 W/mK, with a solar transmittance of 0.83 and a solar heat gain coefficient of 0.63. The shading devices are metallic external venetian blinds.

Table 1.
Materials used in opaque elements and their properties.
An occupancy schedule based on an approximation of the user habits was considered, together with the number of users, the type of indoor activity, and the structure of the typical working week, i.e., considering that the weekdays are different from weekends. Cooling and heating set point temperatures were also defined (see Table 2). In this way, the AC turns on and off based on indoor temperatures and the defined schedules. Heating and cooling are activated during working hours and during unoccupied periods the system turns on only under “extreme” circumstances, according to the setback temperatures (see Table 2).
Table 2.
Occupancy, and AC parameters for DesignBuilder simulations.
A specific lamp power of 3 W/m2/100 lx was assumed during the occupancy schedule. The lighting levels adopted were bathroom—75 lx, bedrooms—200 lx, living room and kitchen—300 lx, and hall—100 lx. Finally, as previously mentioned, the weather file for Esposende, Braga was edited using the temperature and RH measured on the outside sensor.
3. Results and Discussion
3.1. From UAS to BEM
3.1.1. Photogrammetric Survey with a Drone
The building under study is located in Esposende, Braga, in the north of Portugal. As a way of acquiring data from the building, the methodology presented in Section 2 was followed. This continuous workflow of UAS-to-BIM and BIM-to-BEM methodologies had as its final objective the comparison and validation of the experimental monitoring results with those obtained by energy simulation through DesignBuilder.
First, one has to verify which airspace rules are in force in the place under study, as drone flight might face restrictions. That is not the case for this building as it is located outside restricted or prohibited geographical areas for the flight of these aircraft stipulated by ANAC (the Portuguese Civil Aviation Authority), so the flight is authorization-free up to 120 m in height [42,81]. However, authorization is required to capture images by AAN (the National Aeronautical Authority) to avoid violating the personal data protection policy, due to being able to capture images with the UAS camera [82,83].
Apart from the national rules in force, European regulations have to be followed too [43,44]. It is worth remembering that, besides the recommendations stated in 2.1.2, the European drone rules also mandate that the drone, the remote pilot, and the operator (the “owner”) must all be registered on the national aviation authority website [44], in this case, ANAC’s [42].
After verifying that a drone could fly at that location, the weather conditions were assessed. The building’s surroundings were checked before the survey for possible obstacles through the Guardian by Altitude Angel application, which identified that cables from a nearby transformer station passed above the house. Thus, Google Street View images were analysed, and a site visit was made before the drone operation to create a suitable survey plan.
After this verification, the survey operation was planned in the Drone Harmony Mobile application with a flight height of 15 m (for safety reasons, above the cables), with the triple grid mode, 90% overlap between images, and a 45° drone camera angle.
The survey was carried out on 12 July 2022, around 10 a.m., with sunny weather conditions and no wind, taking about an hour to capture 246 photographs for the 3D reconstruction of the building. The operation was conducted by an EASA-certified drone pilot (one of the authors), as only certified pilots can fly a drone legally [44].
The chosen aircraft, a DJI Mavic 2 Enterprise Dual, was calibrated according to its user manual [84] prior to the survey. This 899 g quadcopter is equipped with a 1/2.3″ CMOS sensor, 12 MP resolution, and since it also has an uncooled VOx microbolometer sensor, thermographic information can also be acquired, although this was not used for this study.
Figure 3 shows the drone during the aerial photogrammetric survey of the building as previously scheduled.
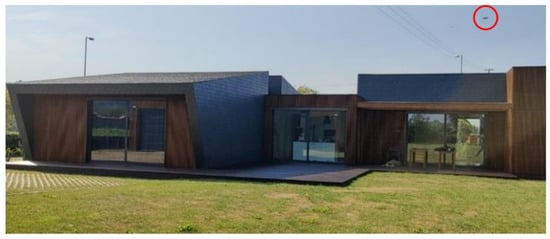
Figure 3.
Drone during the aerial photogrammetric survey operation as programmed in the Drone Harmony Mobile app.
3.1.2. 3D Reconstruction and BIM Model (UAS-to-BIM)
In this work, Agisoft Metashape was the SfM-based photogrammetric software chosen to generate a 3D point cloud of the surveyed area from the multiple images taken. If desired, it is possible to create 3D polygonal meshes from point clouds (called 3D mesh models), which have a better representation and completeness by comparison.
In Figure 4, it is possible to observe the dense point cloud created in the software used (with approximately 55.66 million points) and the 3D mesh model of the north façade (with roughly 4.56 million faces and 2.28 million vertices).
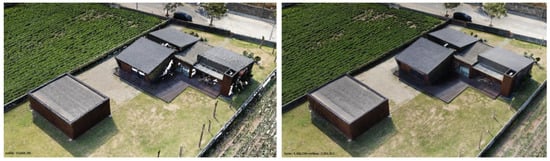
Figure 4.
Photogrammetric reconstruction of the building under study, north façade. On the left, the point cloud, and on the right, the 3D mesh.
No physical GCPs were used throughout this operation as the project did not require a high degree of absolute precision (the real coordinates on the planet); however, seven checkpoints from the building envelope were marked in the photogrammetric software to assess the relative accuracy of the reconstruction. These points estimated the following errors: RMSEXY = 1.43 cm (RMSEX = 0.99 cm and RMSEY = 1.03 cm), RMSEZ = 1.09 cm and RMSETOTAL = 1.80 cm. These represent the distance between the physical position of the points calculated by the drone’s onboard GNSS receiver (global navigation satellite system—GPS + GLONASS in this case) and the reconstruction’s estimated location for these specified points. The first represents the longitude (X) and latitude (Y) root mean square error (RMSE), the second is correlated with the altitude (Z) and the last indicates the total error, also known as the vector sum [37]. These RMSE values are in accordance with some other recent photogrammetric studies with UAVs which also used Agisoft’s software, such as [37,85,86].
Before exporting the point cloud, unnecessary points for the BIM model were manually removed (e.g., trees, other buildings, the garage, etc.) through Agisoft Metashape’s point removal functions. This process reduced the number of points to roughly 1.94 million and, then, the project was exported in LAS format.
Autodesk Revit was the selected BIM software for this study, as it is one of the most used BIM software in the world [15,37]. In order to import the point cloud to Autodesk Revit, a conversion from the previous format to a file readable by this software was performed in Autodesk ReCap, as Agisoft’s software cannot export to those formats [87]. After converting the LAS file into an rcp file, the cloud was imported into Autodesk Revit. Subsequently, the rotation and orientation were adjusted. Once this process was finished, the BIM modelling process of the dwelling (namely its envelope) started, using the point cloud as a reference.
As mentioned in Section 2.1.5, “spaces” and “rooms” must be created in Autodesk Revit so that energy simulations can be conducted afterwards. After creating the energy analytical model, the gbXML file was exported for further developments in the BEM software chosen to proceed with this research. Figure 5 shows the finalized BIM model of the dwelling under study.
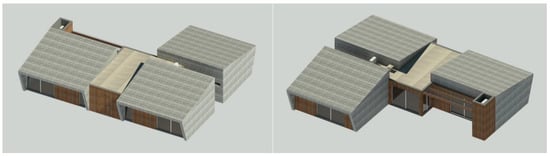
Figure 5.
BIM model of the surveyed building. On the (left), the south façade, and on the (right), the north façade.
3.1.3. BEM Model and Energy Simulations (BIM-to-BEM)
The energy simulation software used was DesignBuilder, which is capable of importing gbXML files from Autodesk Revit with the building geometry and, later, capable of inserting the necessary properties for the simulation, avoiding interoperability issues between this software [66,78]. The model imported into DesignBuilder can be seen in Figure 6 and the materials used in this case study and their respective properties were inserted, assembling the various constructions of the model.
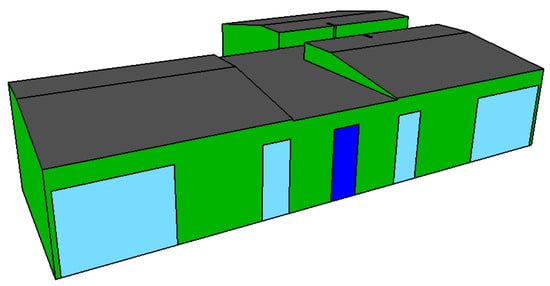
Figure 6.
Geometry imported into DesignBuilder, in gbXML format.
3.2. Experimental Results
Figure 7 shows the air temperature (T) evolution measured inside the seven thermal zones: living room, kitchen, room 1, room 2, room 3, bathroom 3, and social zone. It is also possible to compare the indoor conditions with the respective exterior temperature fluctuation.
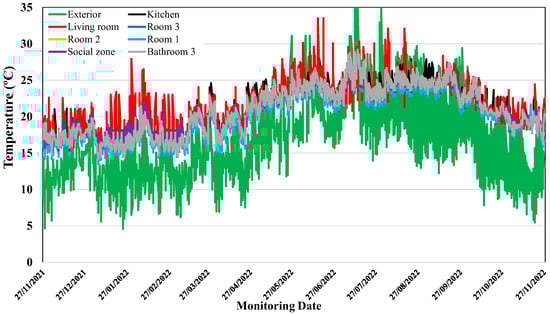
Figure 7.
Temperature measured over different zones (hourly values).
The monitoring results showed a clear alignment between the different indoor temperature conditions throughout the monitoring period. It is also possible to observe that, in general, the temperatures inside the different rooms are very close, identifying, occasionally, moments when the temperature inside the living room is higher.
The thermal comfort assessment was carried out based on the adaptive model proposed by the EN 16798-2 [88] standard, which defines the operating temperature limits that lead to thermal comfort as a function of the exponentially weighted average temperature of the outside air. In this context, it was considered that the air temperature is a good approximation of the operating temperature since the air velocity is low and there are no relevant radiative effects. Figure 8 shows the representation of temperature records and comfort limits, separately for each thermal zone and considering that the building is in category II (normal level of expectation). In order to facilitate the interpretation of the results presented in Figure 8, the percentage of time in discomfort was calculated in each thermal zone, obtaining 2.1% in room 3, 2.1% in the bathroom, 3.1% in room 2, 3.1% in room 1, 5.2% in the living room, and 6.3% in the kitchen.
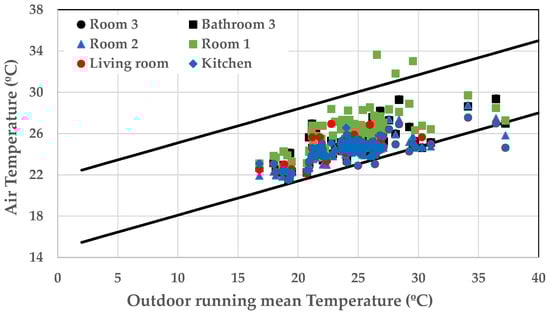
Figure 8.
Assessment of thermal comfort through the adaptive model of EN 16798-2 (summer season).
3.3. Numerical Results
As an example of the application of the methodology described above, the numerical results obtained for the temperature profiles during the winter and summer seasons, and a comparison with the experimental results of the monitoring are presented. Figure 9 and Figure 10 show a comparison of the temperature profiles obtained for different thermal zones, during the two seasons analysed.
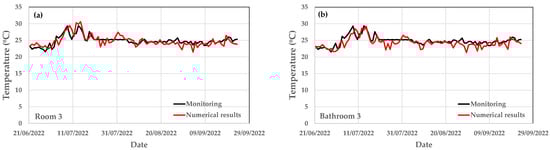
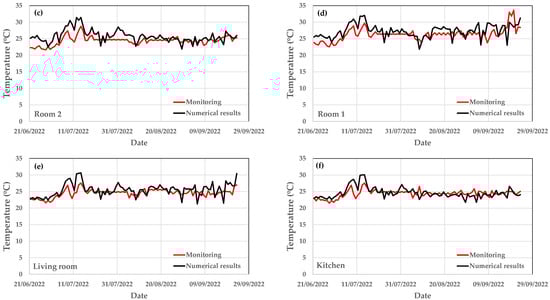
Figure 9.
Comparison of the temperature profiles between the experimental monitoring and numerical results, for different thermal zones (summer season): (a) Room3, (b) Bathroom 3, (c) Room 2, (d) Room 1, (e) Living room and (f) Kitchen.
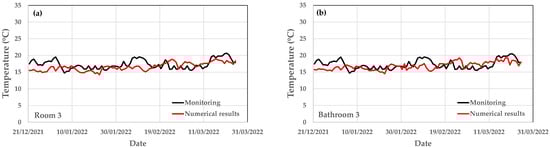
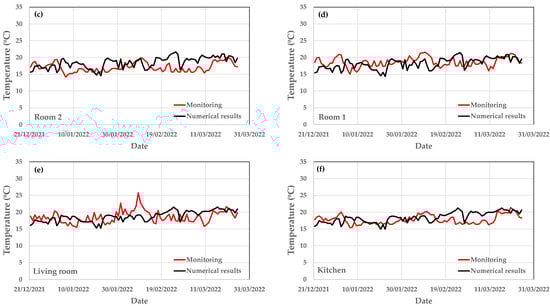
Figure 10.
Comparison of the temperature profiles between the experimental monitoring and numerical results, for different thermal zones (winter season): (a) Room3, (b) Bathroom 3, (c) Room 2, (d) Room 1, (e) Living room and (f) Kitchen.
The results, for the summer season, show a good agreement between the experimental (monitoring) and numerical results, where the absolute error between the two temperature profiles does not exceed 6.7%, on average, i.e., approximately 1.5 °C.
Finally, the results, for the winter season, presented in Figure 10, also show a good agreement between the experimental (monitoring) and numerical results, where the absolute error between the two temperature profiles does not exceed 9.3%, on average, i.e., approximately 2 °C.
3.4. Discussion
This work demonstrates the usefulness of existing drone-based hardware and software solutions to digitize the built environment geometry for BIM-to-BEM purposes through aerial photogrammetry. These solutions are particularly convenient as they support highly automatable workflows. They are often more agile and easier to use than alternative solutions, such as laser scanners [21].
In the proposed workflow, the model geometry for the BEM simulations is acquired during the survey to recreate the as-is building in a BIM environment, which is then exported to the energy simulation software. While some simulation properties can be manually entered and changed directly in the BEM software, the building’s geometrical properties are obtained directly from the BIM model [66,74]. Hence, the importance of the survey.
However, since the UAS is only used to acquire the external geometry of the building, further adjustments must be performed to the digital models after the survey is performed. As described in 2.2.1, the building under study has sensors in different locations. The thermal zone created in the BIM model can be divided into the BEM software according to the sensor locations. These new thermal zones represent an approximation of the rooms for further analysis.
The numerical results of the building energy simulation showed a good agreement between the monitoring results of the experimental campaign, and the numerical simulation for the winter and summer seasons. These numerical results validate the use of the BEM model for building energy simulations where different scenarios can be explored, in order to improve energy efficiency, avoiding time-consuming and expensive work.
4. Conclusions
The use of drones in the construction sector has been growing, bringing with it several useful advantages. Although drone adoption in this sector is already widespread worldwide, in Portugal its incorporation is still far behind. As such, this article aims to highlight the usefulness of adopting these aircraft for the optimization of solutions, from the energy point of view, of a dwelling in the national territory.
The method used in this paper follows a continuous UAS-to-BIM and BIM-to-BEM workflow, starting at the aerial photogrammetric survey of the building under study, and ending with the simulations in a BEM authoring software, in this case, DesignBuilder. Prior to these simulations, one must first create a BIM model based on the point cloud created using SfM software through photogrammetry, as this model will then be exported to the BEM application. Agisoft Metashape and Autodesk Revit were the selected SfM and BIM software for this case study, respectively.
After exporting the model as a gbXML file format from Autodesk Revit to DesignBuilder, the various simulation parameters were entered, referring to the materials used, as well as the occupation and use times of the relevant equipment for the thermal study. Seven sensors were also placed inside the different rooms of the building and a sensor was placed outside to measure temperature and relative humidity.
The comparative analysis between the monitoring results and the numerical simulation for the winter and summer season show a good agreement.
In summary, this work analyses and discusses the BIM model which facilitates the definition of the geometric and parametric model to be used in the BEM, and validates the use of the BEM model for energy simulations where different scenarios can be explored, avoiding time-consuming and expensive work.
As scan-to-BIM solutions based on the combined use of reality capture solutions continue to improve, it is expected that this methodology can be further automated. Solutions based on laser scanning have been developed and tested in earlier initiatives developed by this research team [89,90]. These tools will be applied to point clouds generated from photogrammetric surveys in the future.
Author Contributions
All the authors contributed to the development, analysis, writing, and revision of the paper: conceptualisation, J.P.M., D.F.R.P. and L.R.; methodology, J.M.P.Q.D., A.G.B.L. and A.S.G.; formal analysis, J.M.P.Q.D., J.P.M., D.F.R.P. and S.S.F.; investigation, J.P.M., D.F.R.P., J.M.P.Q.D. and L.R.; writing—original draft preparation, J.P.M., D.F.R.P. and J.M.P.Q.D.; writing—review and editing, J.P.M., D.F.R.P., A.G.B.L., A.S.G. and J.M.P.Q.D.; visualisation S.S.F., A.S.G. and J.M.P.Q.D.; supervision, J.P.M., A.S.G. and J.M.P.Q.D. All authors have read and agreed to the published version of the manuscript.
Funding
This work is a result of the project “BlueWoodenHouse”, with the reference POCI-01-0247-FEDER-047157, in partnership with the project “REV@CONSTRUCTION”, with the reference POCI-01-0247-FEDER-046123, both co-funded by the European Regional Development Fund (ERDF) through the Operational Programme for Competitiveness and Internationalization (COMPETE 2020), under the Portugal 2020 Partnership Agreement. In addition, this work was financially supported by LA/P/0045/2020 (ALiCE), Base Funding-UIDB/04708/2020 and UIDB/00511/2020, Programmatic Funding-UIDP/04708/2020 (CONSTRUCT) and UIDP/00511/2020 (LEPABE), funded by national funds through the FCT/MCTES (PIDDAC); and by FCT–Fundação para a Ciência e a Tecnologia through the individual Scientific Employment Stimulus 2020.00828.CEECIND.
Institutional Review Board Statement
Not applicable.
Informed Consent Statement
Not applicable.
Data Availability Statement
The data that support the findings of this study are available upon request from the authors.
Conflicts of Interest
The authors declare no conflict of interest.
References
- World Health Organization Regional Office for Europe. Combined or Multiple Exposure to Health Stressors in Indoor Built Environments; Sarigiannis, D.A., Ed.; World Health Organization: Copenhagen, Denmark, 2014. [Google Scholar]
- Delgado, J.; Matos, A.M.; Guimarães, A.S. Linking Indoor Thermal Comfort with Climate, Energy, Housing, and Living Conditions: Portuguese Case in European Context. Energies 2022, 15, 6028. [Google Scholar] [CrossRef]
- Enescu, D. A Review of Thermal Comfort Models and Indicators for Indoor Environments. Renew. Sustain. Energy Rev. 2017, 79, 1353–1379. [Google Scholar] [CrossRef]
- Ormandy, D.; Ezratty, V. Housing, Health, and the Domestic Environment. In Clay’s Handbook of Environmental Health; Routledge: London, UK, 2022; pp. 490–515. ISBN 9781003035640. [Google Scholar]
- Alfalah, G.; Al-Sakkaf, A.; Mohammed Abdelkader, E.; Zayed, T. An Integrated Fuzzy-Based Sustainability Framework for Post-Secondary Educational Buildings: A User-Perspective Approach. Sustainability 2022, 14, 9955. [Google Scholar] [CrossRef]
- Matos, A.M.; Delgado, J.M.P.Q.; Guimarães, A.S. Energy-Efficiency Passive Strategies for Mediterranean Climate: An Overview. Energies 2022, 15, 2572. [Google Scholar] [CrossRef]
- Matos, A.M.; Delgado, J.M.P.Q.; Guimarães, A.S. Linking Energy Poverty with Thermal Building Regulations and Energy Efficiency Policies in Portugal. Energies 2022, 15, 329. [Google Scholar] [CrossRef]
- Xu, Y.; Yan, C.; Yan, S.; Liu, H.; Pan, Y.; Zhu, F.; Jiang, Y. A Multi-Objective Optimization Method Based on an Adaptive Meta-Model for Classroom Design with Smart Electrochromic Windows. Energy 2022, 243, 122777. [Google Scholar] [CrossRef]
- Elaouzy, Y.; El Fadar, A. Energy, Economic and Environmental Benefits of Integrating Passive Design Strategies into Buildings: A Review. Renew. Sustain. Energy Rev. 2022, 167, 112828. [Google Scholar] [CrossRef]
- Roque, E.; Vicente, R.; Almeida, R.M.S.F. Indoor Thermal Environment Challenges of Light Steel Framing in the Southern European Context. Energies 2021, 14, 7025. [Google Scholar] [CrossRef]
- Gao, H.; Koch, C.; Wu, Y. Building Information Modelling Based Building Energy Modelling: A Review. Appl. Energy 2019, 238, 320–343. [Google Scholar] [CrossRef]
- Hou, Y.; Volk, R.; Chen, M.; Soibelman, L. Fusing Tie Points’ RGB and Thermal Information for Mapping Large Areas Based on Aerial Images: A Study of Fusion Performance under Different Flight Configurations and Experimental Conditions. Autom. Constr. 2021, 124, 103554. [Google Scholar] [CrossRef]
- Cho, Y.K.; Ham, Y.; Golpavar-Fard, M. 3D As-Is Building Energy Modeling and Diagnostics: A Review of the State-of-the-Art. Adv. Eng. Inform. 2015, 29, 184–195. [Google Scholar] [CrossRef]
- Rocha, A.; Pinto, D.; Ramos, N.M.M.; Almeida, R.M.S.F.; Barreira, E.; Simões, M.L.; Poças Martins, J.; Pereira, P.F.; Sanhudo, L. A Case Study to Improve the Winter Thermal Comfort of an Existing Bus Station. J. Build. Eng. 2020, 29, 101123. [Google Scholar] [CrossRef]
- Sanhudo, L.; Ramos, N.M.M.; Poças Martins, J.; Almeida, R.M.S.F.; Barreira, E.; Simões, M.L.; Cardoso, V. Building Information Modeling for Energy Retrofitting—A Review. Renew. Sustain. Energy Rev. 2018, 89, 249–260. [Google Scholar] [CrossRef]
- Karachaliou, E.; Georgiou, E.; Psaltis, D.; Stylianidis, E. UAV for Mapping Historic Buildings: From 3D Modelling to BIM. ISPRS—Int. Arch. Photogramm. Remote Sens. Spat. Inf. Sci. 2019, XLII-2/W9, 397–402. [Google Scholar] [CrossRef]
- Rakha, T.; Gorodetsky, A. Review of Unmanned Aerial System (UAS) Applications in the Built Environment: Towards Automated Building Inspection Procedures Using Drones. Autom. Constr. 2018, 93, 252–264. [Google Scholar] [CrossRef]
- Albeaino, G.; Gheisari, M. Trends, Benefits, and Barriers of Unmanned Aerial Systems in the Construction Industry: A Survey Study in the United States. J. Inf. Technol. Constr. 2021, 26, 84–111. [Google Scholar] [CrossRef]
- Freeman, M.R.; Kashani, M.M.; Vardanega, P.J. Aerial Robotic Technologies for Civil Engineering: Established and Emerging Practice. J. Unmanned Veh. Syst. 2021, 9, 75–91. [Google Scholar] [CrossRef]
- Li, Y.; Liu, C. Applications of Multirotor Drone Technologies in Construction Management. Int. J. Constr. Manag. 2019, 19, 401–412. [Google Scholar] [CrossRef]
- Dupont, Q.F.M.; Chua, D.K.H.; Tashrif, A.; Abbott, E.L.S. Potential Applications of UAV along the Construction’s Value Chain. Procedia Eng. 2017, 182, 165–173. [Google Scholar] [CrossRef]
- Alizadehsalehi, S.; Yitmen, I.; Celik, T.; Arditi, D. The Effectiveness of an Integrated BIM/UAV Model in Managing Safety on Construction Sites. Int. J. Occup. Saf. Ergon. 2020, 26, 829–844. [Google Scholar] [CrossRef]
- Rachmawati, T.S.N.; Kim, S. Unmanned Aerial Vehicles (UAV) Integration with Digital Technologies toward Construction 4.0: A Systematic Literature Review. Sustainability 2022, 14, 5708. [Google Scholar] [CrossRef]
- Gigliarelli, E.; Calcerano, F.; Cessari, L. Heritage bim, Numerical Simulation and Decision Support Systems: An Integrated Approach for Historical Buildings Retrofit. Energy Procedia 2017, 133, 135–144. [Google Scholar] [CrossRef]
- Gigliarelli, E.; Calcerano, F.; Calvano, M.; Ruperto, F.; Sacco, M.; Cessari, L. Integrated Numerical Analysis and Building Information Modeling for Cultural Heritage. In Proceedings of the Building Simulation Applications: BSA 2017: 3th IBPSA-Italy Conference, Bolzano, Italy, 8–10 February 2017; pp. 105–112. [Google Scholar]
- Gigliarelli, E.; Calcerano, F.; Cessari, L. Implementation Analysis and Design for Energy Efficient Intervention on Heritage Buildings. In Digital Heritage. Progress in Cultural Heritage: Documentation, Preservation, and Protection. EuroMed 2016. Lecture Notes in Computer Science; Ioannides, M., Fink, E., Moropoulou, A., Hagedorn-Saupe, M., Fresa, A., Liestøl, G., Rajcic, V., Grussenmeyer, P., Eds.; Springer: Cham, Switzerland, 2016; Volume 10058, pp. 91–103. [Google Scholar] [CrossRef]
- Nagy, G.; Ashraf, F. HBIM Platform & Smart Sensing as a Tool for Monitoring and Visualizing Energy Performance of Heritage Buildings. Dev. Built Environ. 2021, 8, 100056. [Google Scholar] [CrossRef]
- Maiolatesi, A.; Prada, A.; Luce, F.; Massari, G.; Baggio, P. Analysis of the Surroundings Impact on the Building Energy Performance by Means of a BIM Analytical Model Coupled with Dynamic Simulation. In Proceedings of the Building Simulation Applications: BSA 2019: 4th IBPSA-Italy Conference, Bolzano, Italy, 19–21 June 2019; pp. 315–322. [Google Scholar]
- Gorzalka, P.; Schmiedt, J.E.; Schorn, C.; Hoffschmidt, B. Automated Generation of an Energy Simulation Model for an Existing Building from UAV Imagery. Buildings 2021, 11, 380. [Google Scholar] [CrossRef]
- Benz, A.; Taraben, J.; Debus, P.; Habte, B.; Oppermann, L.; Hallermann, N.; Voelker, C.; Rodehorst, V.; Morgenthal, G. Framework for a UAS-Based Assessment of Energy Performance of Buildings. Energy Build. 2021, 250, 111266. [Google Scholar] [CrossRef]
- KPMG International. No Turning Back—An Industry Ready to Transcend—2021 Global Construction Survey. 2021. Available online: https://assets.kpmg/content/dam/kpmg/xx/pdf/2021/08/global-construction-survey1.pdf (accessed on 12 December 2022).
- Sanhudo, L.; Poças Martins, J.; Rocha, A.; Soeiro, A.; Correia, T. A Digitalização nas Empresas da Indústria AEC Portuguesa: Inquérito e Análise de Resultados. DECivil 2022, 3, 13–17. [Google Scholar]
- Parracho, D.F.R. Processos Digitais para a Realização de Levantamentos Fotogramétricos e Termográficos com Veículos Aéreos Não Tripulados (VANT). Master’s Thesis, Faculty of Engineering (FEUP), University of Porto, Porto, Portugal, 2021. [Google Scholar]
- Parracho, D.F.R.; Poças Martins, J.; Barreira, E. Metodologia Digital para a Realização de Levantamentos Fotogramétricos e Termográficos de Edifícios Existentes com Drones—Caso de Estudo. In 4° Congresso Português de ‘Building Information Modelling’ vol. 2—ptBIM; Azenha, M., Lino, J.C., Granja, J., Figueiredo, B., Poças Martins, J., Eds.; UMinho Editora: Braga, Portugal, 2022; pp. 395–406. [Google Scholar] [CrossRef]
- Parracho, D.F.R.; Poças Martins, J.; Barreira, E. Proposal of a Methodology for Photogrammetric and Thermographic Surveys of Existing Buildings with Drones. In Proceedings of the 3rd Building and Management International Conference (BIMIC 2021), Madrid, Spain, 24–26 November 2021; pp. 54–57. [Google Scholar]
- Parracho, D.F.R.; Poças Martins, J.; Barreira, E. A Workflow for Photogrammetric and Thermographic Surveys of Buildings with Drones. In New Advances in Building Information Modeling and Engineering Management; González-García, M.N., Rodrigues, F., Baptista, J.S., Eds.; Springer: Cham, Switzerland, 2023; in press. [Google Scholar]
- Martínez-Carricondo, P.; Carvajal-Ramírez, F.; Yero-Paneque, L.; Agüera-Vega, F. Combination of Nadiral and Oblique UAV Photogrammetry and HBIM for the Virtual Reconstruction of Cultural Heritage. Case Study of Cortijo Del Fraile in Níjar, Almería (Spain). Build. Res. Inf. 2020, 48, 140–159. [Google Scholar] [CrossRef]
- Ribeiro, D.; Santos, R.; Shibasaki, A.; Montenegro, P.; Carvalho, H.; Calçada, R. Remote Inspection of RC Structures Using Unmanned Aerial Vehicles and Heuristic Image Processing. Eng. Fail. Anal. 2020, 117, 104813. [Google Scholar] [CrossRef]
- Qu, T.; Zang, W.; Peng, Z.; Liu, J.; Li, W.; Zhu, Y.; Zhang, B.; Wang, Y. Construction Site Monitoring Using UAV Oblique Photogrammetry and BIM Technologies. In Protocols, Flows and Glitches: Proceedings of the 22nd International Conference of the Association for Computer-Aided Architectural Design Research in Asia (CAADRIA), 5–8 April 2017, Suzhou, China; Janssen, P., Loh, P., Raonic, A., Schnabel, M.A., Eds.; The Association for Computer-Aided Architectural Design Research in Asia (CAADRIA): Hong Kong, China, 2017; pp. 655–662. [Google Scholar] [CrossRef]
- Shibasaki, A. Inspeção da Torre do Monte da Virgem com o Auxílio de Veículo Aéreo não Tripulado. Master’s Thesis, School of Engineering (ISEP), Polytechnic Institute of Porto, Porto, Portugal, 2019. [Google Scholar]
- Natephra, W.; Motamedi, A.; Yabuki, N.; Fukuda, T. Integrating 4D Thermal Information with BIM for Building Envelope Thermal Performance Analysis and Thermal Comfort Evaluation in Naturally Ventilated Environments. Build. Environ. 2017, 124, 194–208. [Google Scholar] [CrossRef]
- ANAC Explore. Available online: https://uas.anac.pt/explore (accessed on 7 December 2022).
- The European Commission (EU). Commission Delegated Regulation (EU) 2019/945—Of 12 March 2019—On Unmanned Aircraft Systems and on Third-Country Operators of Unmanned Aircraft Systems. Off. J. Eur. Union 2019, 62, L 152/1–L 152/40. [Google Scholar]
- The European Commission (EU). Commission Implementing Regulation (EU) 2019/947—Of 24 May 2019—On the Rules and Procedures for the Operation of Unmanned Aircraft. Off. J. Eur. Union 2019, 62, L 152/45–L 152/71. [Google Scholar]
- Altitude Angel | Drone and UAV Services UTM Platform. Available online: https://www.altitudeangel.com/ (accessed on 7 December 2022).
- Volkmann, W.; Barnes, G. Virtual Surveying: Mapping and Modeling Cadastral Boundaries Using Unmanned Aerial Systems (UAS). In Proceedings of the XXV FIG International Congress: Engaging the Challenges—Enhancing the Relevance, Kuala Lumpur, Malaysia, 16–21 June 2014. [Google Scholar]
- Entrop, A.G.; Vasenev, A. Infrared Drones in the Construction Industry: Designing a Protocol for Building Thermography Procedures. Energy Procedia 2017, 132, 63–68. [Google Scholar] [CrossRef]
- International Civil Aviation Organization. ICAO Cir 328, Unmanned Aircraft Systems (UAS); International Civil Aviation Organization: Montréal, QC, Canada, 2011; ISBN 978-92-9231-751-5. [Google Scholar]
- Flynt, J. How to Avoid Bird Attacks on Your Drone. Available online: https://3dinsider.com/bird-drone-attacks/ (accessed on 7 December 2022).
- Jarrel, T. Check Yourself—Every Pilot Should be Part of Their Own Preflight. Available online: https://www.aopa.org/news-and-media/all-news/2019/june/07/are-you-fit-to-fly (accessed on 7 December 2022).
- DroneDeploy Drone Mapping Software | Drone Mapping App | UAV Mapping | Surveying Software. Available online: https://www.dronedeploy.com/ (accessed on 7 December 2022).
- Drone Harmony Data Capture Platform for Drones & UAVs. Available online: https://droneharmony.com/ (accessed on 7 December 2022).
- Han, D.; Huh, J. Thermal Data Fusion for Building Insulation. In Proceedings of the 2019 International Conference on System Science and Engineering (ICSSE), Dong Hoi, Vietnam, 20–21 July 2019; pp. 368–371. [Google Scholar] [CrossRef]
- Ioannou, A.; Itard, L.C.M. Energy Performance and Comfort in Residential Buildings: Sensitivity for Building Parameters and Occupancy. Energy Build. 2015, 92, 216–233. [Google Scholar] [CrossRef]
- Lee, J.; Ham, Y. Impact Analysis on the Variations of the Thermo-Physical Property of Building Envelopes and Occupancy in Building Energy Performance Assessment. Procedia Eng. 2016, 145, 556–564. [Google Scholar] [CrossRef]
- Previtali, M.; Barazzetti, L.; Brumana, R.; Roncoroni, F. Thermographic Analysis from UAV Platforms for Energy Efficiency Retrofit Applications. J. Mob. Multimed. 2013, 9, 66–82. [Google Scholar]
- Wingtra Ground Control Points: How Many Do You Need (and When Are Checkpoints Enough)? Available online: https://wingtra.com/ground-control-points-how-many-do-you-need-and-when-are-checkpoints-enough/ (accessed on 15 December 2022).
- Heliguy a Guide to Using Ground Control Points for Surveying. Available online: https://www.heliguy.com/blogs/posts/guide-to-using-ground-control-points (accessed on 3 December 2022).
- DroneDeploy When to Use Ground Control Points—How to Decide If Your Drone Mapping Project Needs GCPs. Available online: https://medium.com/aerial-acuity/when-to-use-ground-control-points-2d404d9f5b15 (accessed on 4 December 2022).
- Kalacska, M.; Lucanus, O.; Arroyo-Mora, J.P.; Laliberté, É.; Elmer, K.; Leblanc, G.; Groves, A. Accuracy of 3D Landscape Reconstruction without Ground Control Points Using Different UAS Platforms. Drones 2020, 4, 13. [Google Scholar] [CrossRef]
- Pix4D SA The Future of Accuracy: Marking GCPs Automatically. Available online: https://www.pix4d.com/blog/automatic-ground-control-points (accessed on 15 December 2022).
- Pix4D SA Ground Control Points: Why Are They Important? Available online: https://www.pix4d.com/blog/why-ground-control-points-important (accessed on 4 December 2022).
- Pix4D SA Do More GCPs Equal More Accurate Drone Maps? Available online: https://www.pix4d.com/blog/GCP-accuracy-drone-maps (accessed on 4 December 2022).
- Jiang, S.; Jiang, C.; Jiang, W. Efficient Structure from Motion for Large-Scale UAV Images: A Review and a Comparison of SfM Tools. ISPRS J. Photogramm. Remote Sens. 2020, 167, 230–251. [Google Scholar] [CrossRef]
- Opincar, E. Assessing the Technology Used by UAVs in Data Acquisition on Construction Sites. Master’s Thesis, University of Washington, Seattle, WA, USA, 2016. [Google Scholar]
- Prata, T.G. Avaliação Energética com Recurso ao BIM para Escolha de Estratégias de Reabilitação—Bairro de Lordelo do Ouro, Porto. Master’s Thesis, Faculty of Engineering (FEUP), University of Porto, Porto, Portugal, 2022. [Google Scholar]
- Sanhudo, L.; Ramos, N.M.M.; Poças Martins, J.; Almeida, R.M.S.F.; Barreira, E.; Simões, M.L.; Cardoso, V. A Framework for In-Situ Geometric Data Acquisition Using Laser Scanning for BIM Modelling. J. Build. Eng. 2020, 28, 101073. [Google Scholar] [CrossRef]
- Library of Congress LAS (LASer) File Format, Version 1.4. Available online: https://www.loc.gov/preservation/digital/formats/fdd/fdd000418.shtml (accessed on 4 December 2022).
- Reality Imaging & Mapping Technologies How to Import Point Cloud In Revit for Asbuilt Modeling. Available online: https://www.realityimt.com/import-point-cloud-in-revit/ (accessed on 4 December 2022).
- Alhaidary, H.; Al-Tamimi, A.K.; Al-Wakil, H. The Combined Use of BIM, IR Thermography and HFS for Energy Modelling of Existing Buildings and Minimising Heat Gain through the Building Envelope: A Case-Study from a UAE Building. Adv. Build. Energy Res. 2019, 15, 709–732. [Google Scholar] [CrossRef]
- Wang, C.; Cho, Y.K. Performance Evaluation of Automatically Generated BIM from Laser Scanner Data for Sustainability Analyses. Procedia Eng. 2015, 118, 918–925. [Google Scholar] [CrossRef]
- Bastos Porsani, G.; Del Valle de Lersundi, K.; Sánchez-Ostiz Gutiérrez, A.; Fernández Bandera, C. Interoperability between Building Information Modelling (BIM) and Building Energy Model (BEM). Appl. Sci. 2021, 11, 2167. [Google Scholar] [CrossRef]
- Kamel, E.; Memari, A.M. Review of BIM’s Application in Energy Simulation: Tools, Issues, and Solutions. Autom. Constr. 2019, 97, 164–180. [Google Scholar] [CrossRef]
- Queiróz, G.; Grigoletti, G.; Santos, J. Interoperability between Autodesk Revit and EnergyPlus for Thermal Simulations of Buildings. PARC Pesqui. Em Arquitetura E Construção 2019, 10, e019005. [Google Scholar] [CrossRef]
- Elnabawi, M.H. Building Information Modeling-Based Building Energy Modeling: Investigation of Interoperability and Simulation Results. Front. Built Environ. 2020, 6, 573971. [Google Scholar] [CrossRef]
- Pezeshki, Z.; Soleimani, A.; Darabi, A. Application of BEM and Using BIM Database for BEM: A Review. J. Build. Eng. 2019, 23, 1–17. [Google Scholar] [CrossRef]
- Elnabawi, M.H.; Hamza, N. Investigating Building Information Model (BIM) to Building Energy Simulation (BES): Interoperability and Simulation Results. IOP Conf. Ser. Earth Environ. Sci. New Cairo Egypt 2019, 397, 12013. [Google Scholar] [CrossRef]
- Pimentel, B.P.; Barbosa, A.T.R.; Souza, M.D. de Análise de Métodos de Integração entre BIM e Simulação Termo Energética de Edificações Militares. Rev. Gestão Sustentabilidade Ambient. 2020, 9, 125–146. [Google Scholar] [CrossRef]
- Sanhudo, L.; Poças Martins, J.; Ramos, N.M.M.; Almeida, R.M.S.F.; Rocha, A.; Pinto, D.; Barreira, E.; Simões, M.L. BIM Framework for the Specification of Information Requirements in Energy-Related Projects. Eng. Constr. Archit. Manag. 2021, 28, 3123–3143. [Google Scholar] [CrossRef]
- EN 16798-1; CEN—European Committee for Standardization. Indoor Environmental Input Parameters for Design and Assessment of Energy Performance of Buildings Addressing Indoor Air Quality, Thermal Environment, Lighting and Acoustics—Module M1. European Committee for Standardization: Brussels, Belgium, 2019.
- ANAC Categoria Aberta (OPEN). Available online: https://www.anac.pt/vPT/Generico/drones/categoria_aberta/Paginas/CategoriaAberta.aspx (accessed on 9 December 2022).
- AAN Aeronaves Não Tripuladas (Drones). Available online: https://www.aan.pt/subPagina-AAN-001.005.005-aeronaves-nao-tripuladas-drones (accessed on 8 December 2022).
- AAN e-Autoridade Aeronáutica Nacional—Guia Rápido para Operadores. 2019, pp. 1–10. Available online: https://www.aan.pt/includes/AAN/conteudos/galeria/ficheiros/drones/guia-r-pido-vs-16dez2019_1929.pdf (accessed on 12 December 2022).
- DJI. Mavic 2 Enterprise Series—User Manual v1.8. 2021. Available online: https://dl.djicdn.com/downloads/Mavic_2_Enterprise/20210413/Mavic_2_Enterprise_Series_User_Manual-EN.pdf (accessed on 6 December 2022).
- Benavides Lopez, J.A.; Martin Civantos, J.M.; Rouco Collazo, J. Architectural Survey and Archeological Analysis of the Píñar Castle as a Starting Point for Its Conservation. Virtual Archaeol. Rev. 2020, 11, 95–115. [Google Scholar] [CrossRef]
- Russo, M.; Carnevali, L.; Russo, V.; Savastano, D.; Taddia, Y. Modeling and Deterioration Mapping of Façades in Historical Urban Context by Close-Range Ultra-Lightweight UAVs Photogrammetry. Int. J. Archit. Herit. 2019, 13, 549–568. [Google Scholar] [CrossRef]
- Agisoft LLC. Agisoft Metashape User Manual: Professional Edition, Version 1.8. 2022. Available online: https://www.agisoft.com/pdf/metashape-pro_1_8_en.pdf (accessed on 6 December 2022).
- EN 16798-2; CEN—European Committee for Standardization. Interpretation of the Requirements in EN 16798-1—Indoor Environmental Input Parameters for Design and Assessment of Energy Performance of Buildings Addressing Indoor Air Quality, Thermal Environment, Lighting and Acoustics. European Committee for Standardization: Brussels, Belgium, 2019.
- Sanhudo, L. Artificial Intelligence for an Enhanced As-Is BIM Energy Analysis—Enabling an Efficient Energy Retrofit through the Automation of the Scan-to-BIM Process. Ph.D. Thesis, Faculty of Engineering (FEUP), University of Porto, Porto, Portugal, 2021. [Google Scholar]
- Sanhudo, L.; Poças Martins, J.; Ramos, N.M.M. Proposta de Algoritmos de Inteligência Artificial para Automatização do Processo Scan-to-BIM. In 4° Congresso Português de ‘Building Information Modelling’ vol. 2—ptBIM; Azenha, M., Lino, J.C., Granja, J., Figueiredo, B., Poças Martins, J., Eds.; UMinho Editora: Braga, Portugal, 2022; pp. 419–429. [Google Scholar] [CrossRef]


Disclaimer/Publisher’s Note: The statements, opinions and data contained in all publications are solely those of the individual author(s) and contributor(s) and not of MDPI and/or the editor(s). MDPI and/or the editor(s) disclaim responsibility for any injury to people or property resulting from any ideas, methods, instructions or products referred to in the content. |
© 2023 by the authors. Licensee MDPI, Basel, Switzerland. This article is an open access article distributed under the terms and conditions of the Creative Commons Attribution (CC BY) license (https://creativecommons.org/licenses/by/4.0/).