Article

Impact of Primary Air Separation in a Grate Furnace on the Resulting Combustion Products

by
Michał Kozioł
1,* and
Joachim Kozioł
2,†
1
Department of Technologies and Installations for Waste Management, Faculty of Energy and Environmental Engineering, Silesian University of Technology, 44-100 Gliwice, Poland
2
Faculty of Civil Engineering, Architecture and Environmental Engineering, University of Zielona Góra, 65-516 Zielona Góra, Poland
*
Author to whom correspondence should be addressed.
Retired Employee.
Energies 2023, 16(4), 1647; https://doi.org/10.3390/en16041647
Submission received: 15 November 2022 / Revised: 31 January 2023 / Accepted: 3 February 2023 / Published: 7 February 2023
(This article belongs to the Special Issue NOx, PM and CO2 Emission Reduction in Fuel Combustion Processes)

Abstract

:
When burning fuel in grate furnaces, supplying the right amount of air to them is as important as the method of air supply. In a furnace with a fixed grate, the supply method of primary air is determined by the distribution of the supplied air stream over time, and in a furnace with a movable grate, the said method involves the distribution of the stream along the active length of the grate. The need to account for air distribution is attributable to complex processes that occur during the combustion process. The paper describes experimental studies aimed at determining the influence of the distribution of the supplied primary air on the emission of CO2, CO, SO2, NOx, and on the content of combustible parts in the slag. In all cases, the total amount of primary air supplied to the process as well as other process control parameters was identical, and only the distribution of primary air was different. The paper proposes the use of a generalized function to describe the distribution of air, defined by its total demand and the relative time R that fuel remains on the grate until the maximum air stream is obtained. The quantity R was accepted at the value ranging from 1/6 to 2/3. With the rise of R, the emissions of CO2, CO, and SO2 increased by 53%, 125%, and 27%, respectively, and the emissions of NOx and the share of combustibles in the slag decreased by 12% and 79%, respectively.

1. Introduction

1.1. The Role of Combustion Processes in Grate Furnaces

A significant part of the combustion processes of coal [1,2,3,4,5,6] and biomass [7,8,9,10,11,12,13] is carried out in grate furnaces. In the case of the above-mentioned fuels, such furnaces are most often used in heat plants and combined heat and power plants with small and medium power [1,2,3,4,5,8].
The combustion of solids, which will probably be implemented for the longest time in most countries of the world, will involve the combustion of waste and waste-based fuels. In recent years, a significant increase in the installations for energy management of municipal waste have taken place in the EU and China among other places [14,15,16]. In the EU, in the years 2008–2018, the number of such installations increased by 60, and currently only in Poland there are about 100 installations at various stages of planning and implementation (with only 8 operating so far) [14]. In China, after 2000, there was a rapid increase in the number of municipal waste incineration installations, resulting in the highest combined efficiency in the world currently [15]. At the same time, it should be emphasized that, depending on the country, grate furnaces are installed in about 70% to 100% of municipal waste incineration installations (e.g., 100% in Brazil and Australia, over 85% in the EU, and almost 70% in China) [15,16,17].

1.2. Advantages and Disadvantages of Combustion Processes in Grate Furnaces

The main advantages of grate furnaces include flexibility in terms of the properties of burned fuels, high reliability, ease of use, relatively low investment and operating costs in the case of structures with lower and medium power fired with coal [1,8,18,19]. In the case of waste incineration, only operating costs are usually lower [15,17].
The disadvantages of grate furnaces include increased emissions of CO, benzoalfapy-rene, CxHy compared with dust and fluidized furnaces, as well as a greater share of combustible parts in the slag [4,5,6,13,19,20,21]. The above-mentioned disadvantages principally do not apply to structurally advanced furnaces in thermal waste treatment installations.
Another disadvantage of grate furnaces involves temperature limitation of the process aimed at preventing the melting of mineral fractions of the fuel, which would lead to conglomeration and sticking of slag to the grate [8,18]. To a large extent, the above-mentioned disadvantages result in another disadvantage, i.e., relatively low energy efficiency of installations equipped with the discussed furnaces [3,4,5,6,8,18].

1.3. The Course of the Combustion Process in Selected Grate Furnaces

There are many constructions of grates and grate furnaces. The differences in the structures result mainly from the fact that grates and furnaces are adapted to the properties of the combusted fuel, to furnace efficiency and its functions (e.g., stove furnace or furnace in a water or steam boiler) [2,3,10,17,22,23].
The simplest structures of grate furnaces include furnaces with stationary grates and furnaces with flat movable grates. The first design is the traditional solution found in the furnaces of household stoves and low-power boilers. Such boilers are most often used by single-family houses, small farms, and small public utility buildings. The furnaces with flat movable grates constitute a difficult-to-estimate part of all movable furnaces, approximately hundreds of thousands [4,5,6,24]. The power of such furnaces ranges from a few to almost 100 MWt.
During the combustion of solid fuel in a combustion chamber with a stationary or movable grate, a number of processes take place, such as heating and drying of the fuel, degassing and partial gasification of the fuel, combustion of the obtained degassing and gasification products, and the combustion of the obtained carbonizate [17,23,25,26].
In the case of furnaces with a stationary grate, these processes take place for each portion of fuel fed to the furnace, and they dominate successively. There are also possible situations of a simultaneous occurrence of two or more processes in different parts of a given batch of fuel. During fuel combustion on movable grates, these processes take place along the length of the grate. In this case, these processes often overlap (in a given longitudinal section of the grate and the fuel, at different heights of the fuel layer and above it, different processes take place).
The combustion process changes the amount and properties of fuel over time (in the case of stationary grates) or along the length of the grate (in the case of furnaces with a mechanical grate). In each of the mentioned processes, there is also a different, often very different, air demand. The largest stream of air is required for the combustion of degassing and gasification products, and much less is needed for the combustion of carbonizate. On the other hand, for the heating and drying processes of fuel, an air supply is not necessary. The optimal amount of air necessary to be delivered to each of the subprocesses is additionally influenced by the thickness of the fuel layer and its properties [2,10,17,24,25,26,27,28].
In the grate furnaces in question, the majority of the oxidant is supplied to the combustion chamber as primary air. This air is supplied under the grate. The stream of this air also has the additional task of cooling the grate and protecting it from damage by excessively high temperatures.
Therefore, the regulation of the primary air stream is one of the most important control parameters for grate furnaces.
In the case of stationary furnaces, primary air regulation is possible by changing the efficiency of the primary air fan. In the absence of a fan, the control is possible only by adjusting the size of the opening through which primary air is sucked into the combustion chamber.
In order to be able to control the amount of primary air along the length of the movable flat grate, its supply is controlled in a specific zone. Depending on the structure, the space under the grate is divided into several zones [3,6,24,25,28]. The structure of the grate and that of the combustion chamber enable the feeding process of various primary air streams to individual zones. Most frequently, this is done with sector-based air boxes.
The basic problem related to the regulation of the amount of air supplied to specific zones results from the lack of knowledge of the curve describing the best air distribution along the length of the grate for a given fuel and furnace and for its efficiency. In the literature [3,29], we can find only qualitative information on the change in air demand along the length of the grate, without any description allowing for its more precise characteristics.
Another problem arises from the difficulty of assessing whether the amount of air supplied to a given zone is optimal or close to this value. Most often, in the case of industrial boilers and furnaces, the measurement of flue gas composition (or only the measurement of O2 and/or CO2 concentrations) is carried out at a very limited number of points, and often only at one point. This point, in turn, is often located at the exhaust outlet from the furnace or even from the entire installation. In such a case, the measurement results allow only for the assessment of the correctness of the course of the entire process, and they do not provide information on the possibility of its quick improvement. Such improvement is only possible by changing the setting of the control parameters by a trial-and-error method. Taking into account the efficiency change of the installation and the properties of the combusted fuel implies the necessity of frequent changes of the control parameters and long-term operation of the furnace in conditions significantly different from rational parameters. The exceptions include furnaces built in municipal waste incineration installations. In that case, the number of checkpoints measuring the most important (in terms of the regulation of the combustion process) components of the exhaust gas (i.e., CO, CO2, and/or O2) and the temperature is relatively large. However, even in the case of such installations, due to the turbulence of the process and often large dimensions of the combustion chamber, the adjustment is difficult [6,11,25,26].
The distribution of primary air in grate furnaces is generally viewed as one of the most important control parameters, e.g., [2,3,5,10,17,22,23,27]. However, most often the problem of primary air stream distribution is considered in the context of numerical simulations of combustion processes, e.g., [30,31,32,33,34,35,36,37,38].
There are few studies demonstrating the impact of primary air distribution on the obtained gaseous emissions along the length of the grate based on measurements. The [25,39] present the results of research studies carried out in industrial facilities. Due to the conditions of the carried-out research, the number of measurement points in the research presented in [39] was limited to five. In addition, only one primary air separation was taken into consideration in the publication.
In conclusion, we can state that one of the most important problems associated with the operation of grate furnaces is the supply of a suitable air stream under the grate. The mentioned stream is variable: in time (fixed grate furnaces) or along the length of the grate (mechanical furnaces).
The main objective of the study is to demonstrate the influence of air distribution on the formation dynamics of gaseous products of the combustion process. The dynamics is understood as the change in the stream of the above products over time. The impact in question was demonstrated based on the results of experimental tests for the theoretically determined air distribution function. It is also the basic innovative element of the study. The knowledge of the dynamics makes it possible to determine the total gaseous emissions of combustion products. The work also determined the effect of air distribution on the share of combustible parts in the slag.

2. Materials and Methods

2.1. Theoretical Basis of the Conducted Research

2.1.1. Generalization of Air Distribution in Grate Furnaces

The course of the combustion process depends mainly on the initial composition of the fuel, its initial amount, the time fuel stays on the grate (measured from the beginning of the combustion process), and the distribution of air fed to the furnace. In the case of a furnace with a movable grate, the time of fuel residence on the grate, at a constant grate move speed, determines the location (position) of the fuel on the grate:
l = w t,
where:
l—fuel location on the grate, distance from the point of fuel supply onto the grate, m;
w—grate movement speed, m/min;
t—fuel-stay time on the grate, min.
In the literature [3,25,29], information can be found on the applied experimental distribution of combustion air supplied to the grate. The authors of the present study in [24] defined the following generalized function of air distribution in grate furnaces:
V ˙ ( x ) = a ( 1 x X ) x   e x p ( b x X )
where:
a—empirical coefficients, m3/min2 or m3/m2;
b—empirical coefficients, dimensionless quantity;
x, X—variable specifying the fuel condition on the grate and its maximum value;
V ˙ ( x ) —air stream corresponding to the variable x;
with:
  • in furnaces with a fixed grate, the following should be assumed: x = t; X = T, min,
  • in a furnace with a movable grate: x = l; X = L, m,
where:
T—maximum fuel-stay time on the grate, min.,
L—active length of the movable grate, m.
The function V ˙ ( x ) should satisfy the following conditions: V ˙ ( x = 0 ) = 0 ; V ˙ ( x = X ) = 0 .
The form of the function is characterized by empirical coefficients. The numerical value of the factor b follows from the condition:
d V ˙ ( x ) d x / x = R X = 0 ,
where:
R—relative value of the variable x which defines the maximum stream of supplied air, referenced to the value of X; a dimensionless quantity.
In turn, the numerical value of the coefficient “a” determines the relationship:
V a d = x = 0 x = X V ˙ ( x ) d x
where:
Vad—total demand for combustion air resulting from the initial composition and amount of fuel and from the ratio of excess air, m3.
Using Equations (3) and (4) we obtain:
b = 1 2 R R ( R 1 ) ,
a = V a d X 2 · ( Y 1 Y 2 ) ,
where:
Y 1 = 1 b 2 [ ( b 1 ) exp ( b ) + 1 ]
Y 2 = ( 1 b 2 b 2 + 2 b 3 ) exp ( b ) 2 b 3 ,
When analyzing the system of Equations (2), (5) and (6), it can be seen that the V ˙ ( x ) curves of air distribution in grate furnaces are explicitly determined by the value of the variable x = R and by the total combustion air demand Vad.

2.1.2. Determination of Total Emissions of Gaseous Combustion Products

The calculation dependencies given in the further part of the study apply to furnaces with a fixed grate (x = t). They are also correct for furnaces with a mechanical grate, by taking into account Equation (1) and by substituting the variable l instead of the variable t.
The emission of gaseous products is determined from the dependence:
m ˙ j , R ( t ) = V ˙ s p ( t ) e j , R ( t ) V ˙ ( t ) e j , R ( t )
where:
m ˙ j , R ( t ) —emission of the j-th gaseous product at time t for the R-variant of air separation stream, g/min or mg/min,
with: j ∈ [CO2, CO, SO2, NOx];
V ˙ s p ( t )   —dry exhaust gas stream at time t for R-th variant of air separation, m3/min;
e j , R ( t ) —concentration of the j-th component in the dry exhaust gas, for the R-th variant of air separation at time t, g/m3 or mg/m3.
In view of the difficulties with measuring the flue gas flow, it was assumed: V ˙ s p ( t ) = V ˙ ( t ) . This problem is discussed in more detail in Section 2.1.3.
The air distribution is zonal (see Section 2.4). The flow of air V ˙ i in the i-th zone is constant but different between specific zones. The value of the air stream in the i-th zone is determined using Equation (2), yielding:
V ˙ i , R = 1 t i , k t i , p t i , p t i , k V ˙ R ( t ) d t ,
where:
ti,p, ti,k—start and end value of time t limiting the i-th feed zone of air, min., i = (1 … I).
V ˙ i , R —air stream in the i-th delivery zone, for the R-th variant of its distribution, m3/min.
Air stream is a quantity that controls the combustion process. Its value results from the distribution function (2). The compliance of the above air stream with the assumptions should be controlled by measurement.
The concentrations of the i-th components of exhaust gas ej,R(t) are also measured. Since the analyzer used to measure the concentrations shows average values in a specific time step, the emission stream of exhaust gas components can be determined from the following relation:
m ˙ j , R , i , n = V ˙ i , R e j , R , i , n ,
where:
m ˙ j , R , i , n   —average emission stream of the j-th product, with R-th air separation, in the n-th time step, g/min or mg/min;
e j , R , i , n   —average concentration of the j-th exhaust component in the n-th time step, of the i-th zone and the R-th variant of air supply, g/m3 or mg/m3;
and:
n = (1 … N)
where:
N—number of time steps in the i-th air supply zone.
The total emissions of gaseous combustion products can be determined from the formula:
m j , R = t = 0 t = T m ˙ j , R ( t ) d t = Δ t n = 1 n = N m ˙ j , R , k = Δ t i = 1 i = I V ˙ i , R n = 1 n = N e j , R , i , n ,
where:
m ˙ j , R —total emission of the j-th product, with R-th air separation, g or mg;
m ˙ j , R ( t ) —emission stream of the j-th product, with R-th air separation, at time t, g/min or mg/min;
Δt—time step, min.

2.1.3. Determination of the Relative Uncertainty of the Assessment of Gaseous Emissions of Combustion Products

The relative uncertainty of the assessment of the total emissions of gaseous products (exhaust components) can be derived from the formula:
δ m j , R m j , R = ( δ Δ t Δ t ) 2 + ( δ V ˙ V ˙ ) 2 + ( i = 1 i = I N i ) ( δ e e m ) 2 ,
where:
δ m j , R   —absolute error of the total emission assessment of the j-th exhaust component for the R-th variant of air separation, g or mg;
δ Δ t ,   δ V ˙ ,   δ e —absolute errors in the assessment of the time step, dry exhaust gas stream, exhaust gas component concentration, respectively: min, m3/min, g/min or mg/min.
Taking into account the assumptions that the air stream and the dry flue gas stream are equal, as specified in Section 2.1.2, one should take into account the error of the method. Thus, the value δ V ˙ V ˙ in the Equation (10) can be determined from the formula:
δ V ˙ V ˙ = ( δ e x V ˙ ) 2 + ( δ m V ˙ ) 2   ,
where:
δ e x , δ m —absolute error of the determination method of dry flue gas stream and the measurement of air stream, m3/min.
In order to determine the error of the method, stoichiometric calculations were carried out to determine the ratio α of the air stream to the dry flue gas stream, for exemplary fuels and exemplary values of excess air ratio λ. The obtained values are given in Table 1.
As the table shows, the error of the method for the analyzed exemplary solid fuels for λ = 1.0 is less than 4%, and it decreases with the increase of the excess air ratio. For the value λ = 1.6, it does not exceed 2.5%. For the conducted research, it was 1.6%.
The remaining uncertainty assessments are based on relative measurement errors. For the presented studies, they were less than 6%.
The relative uncertainty of the total emission of gaseous combustion products, determined according to the Equation (13), was less than 8%.

2.1.4. Determination of the Share of Combustible Parts in the Slag
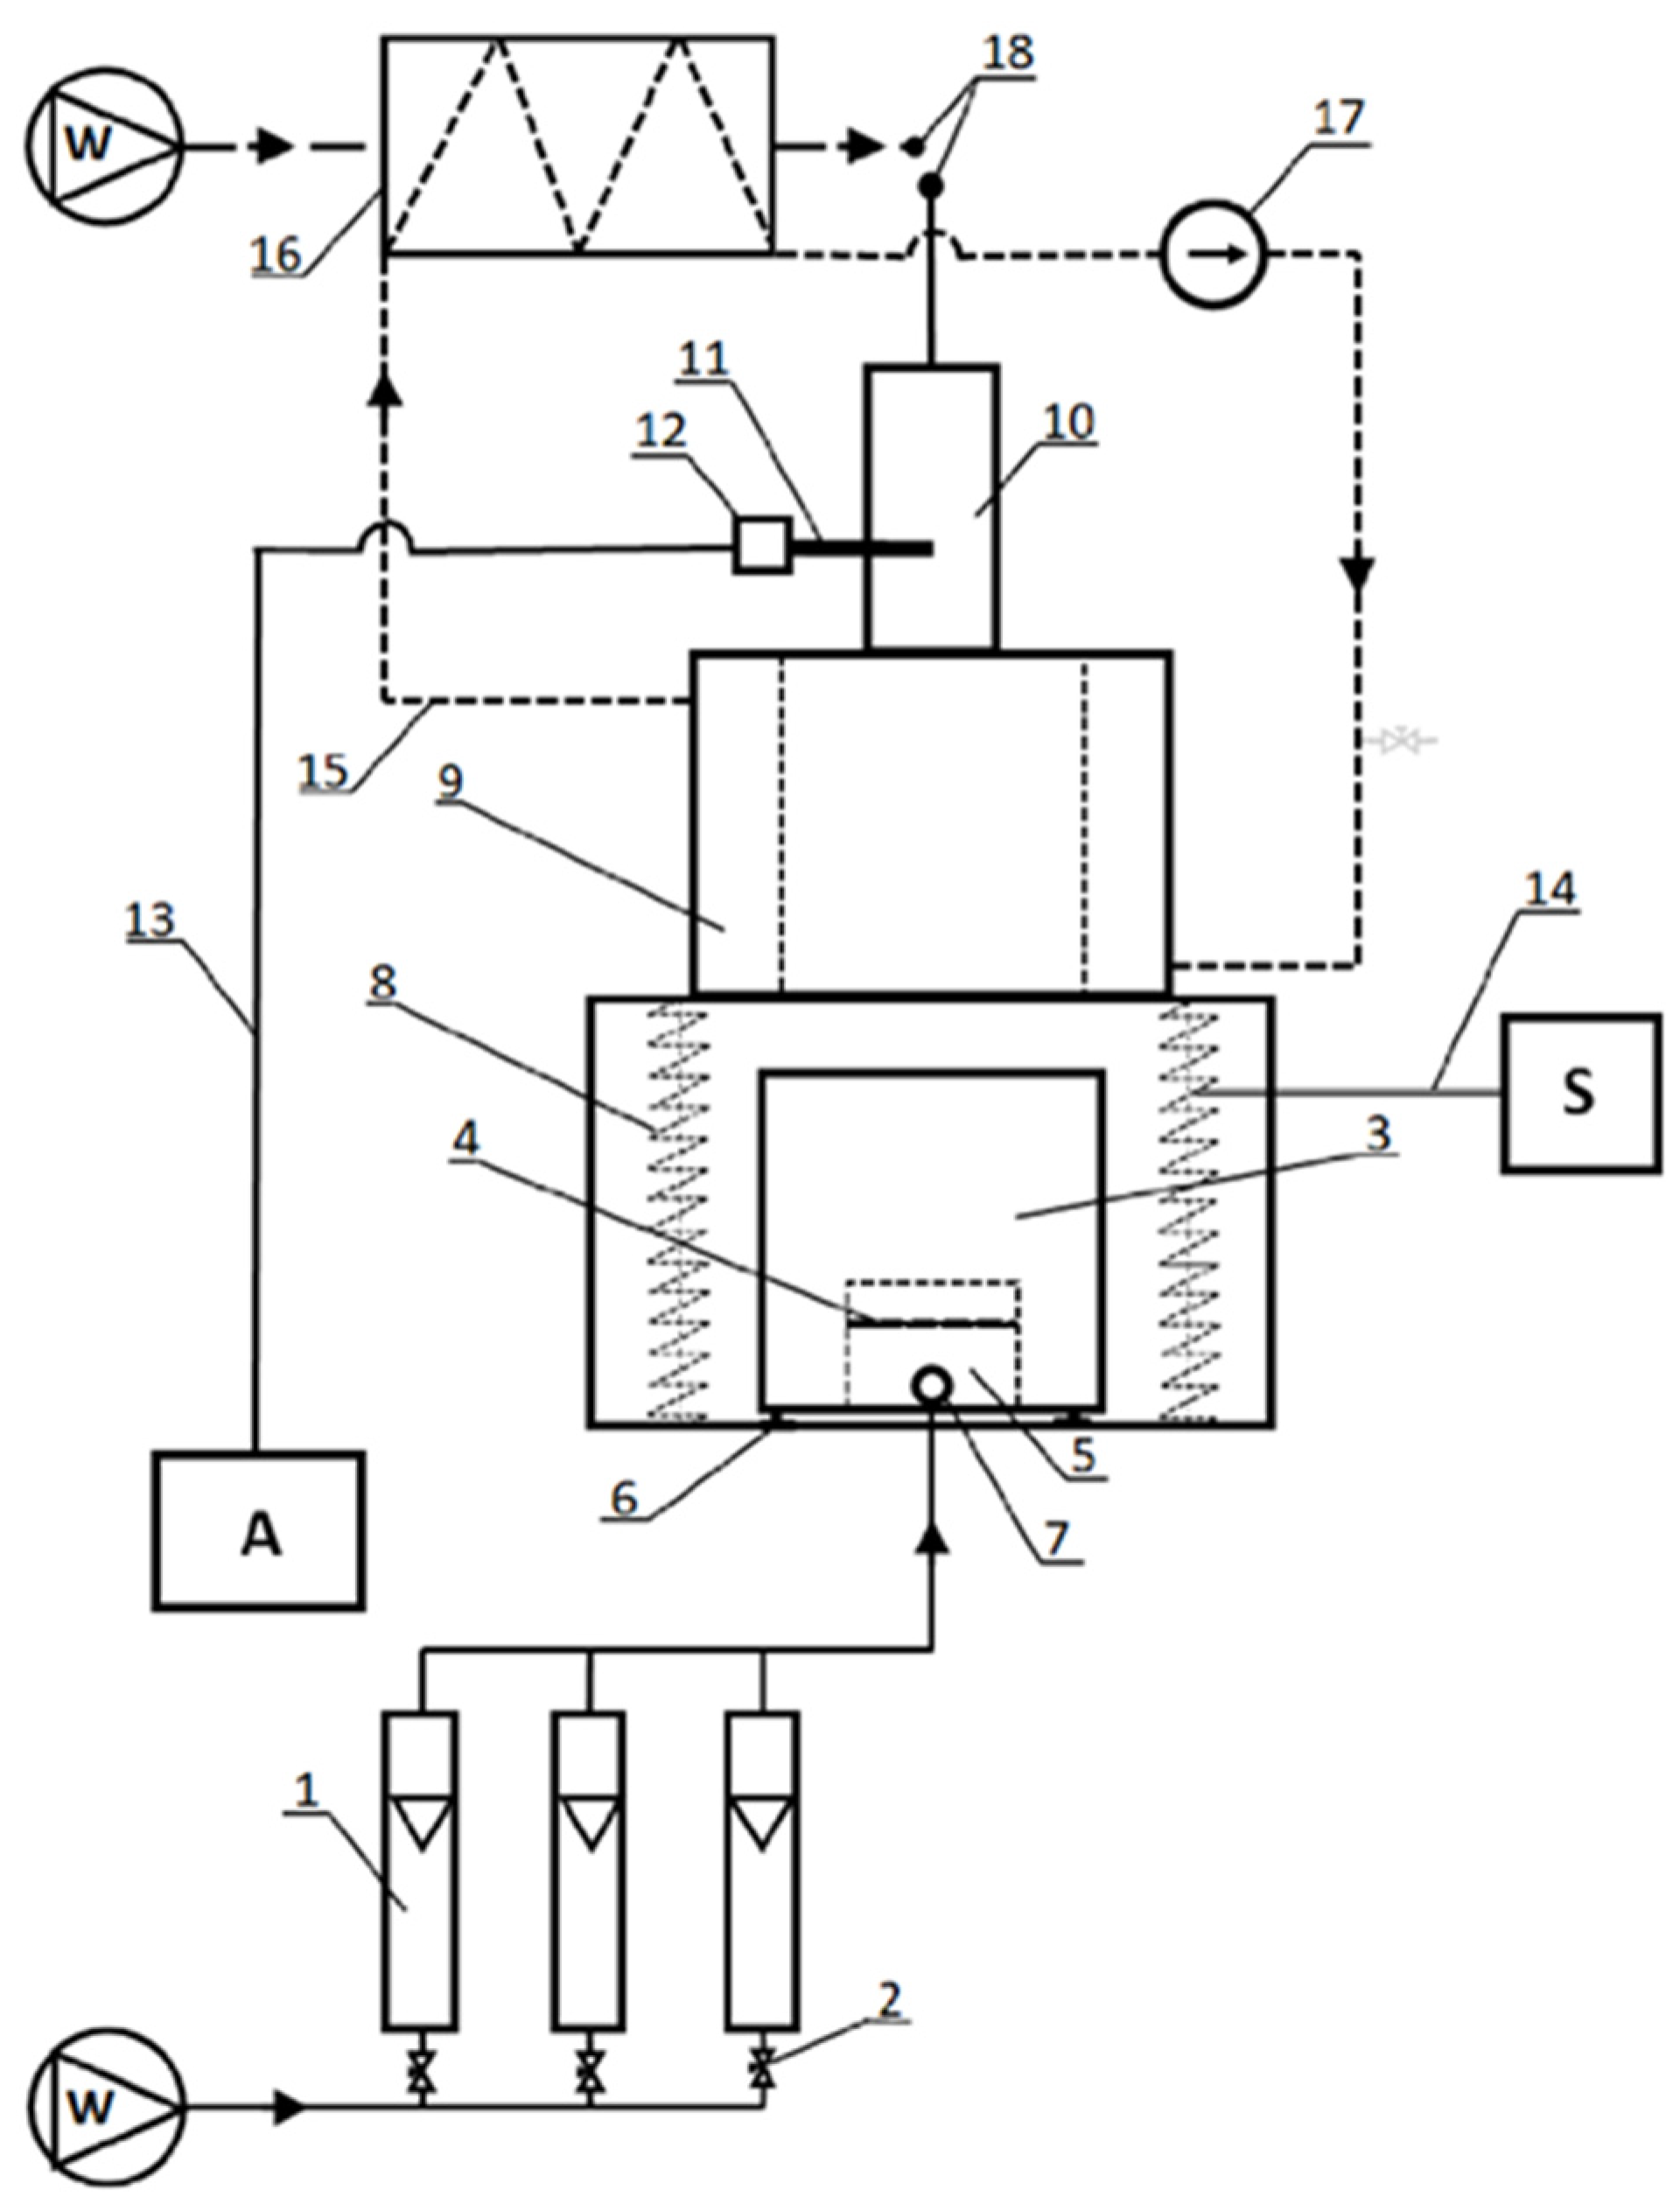
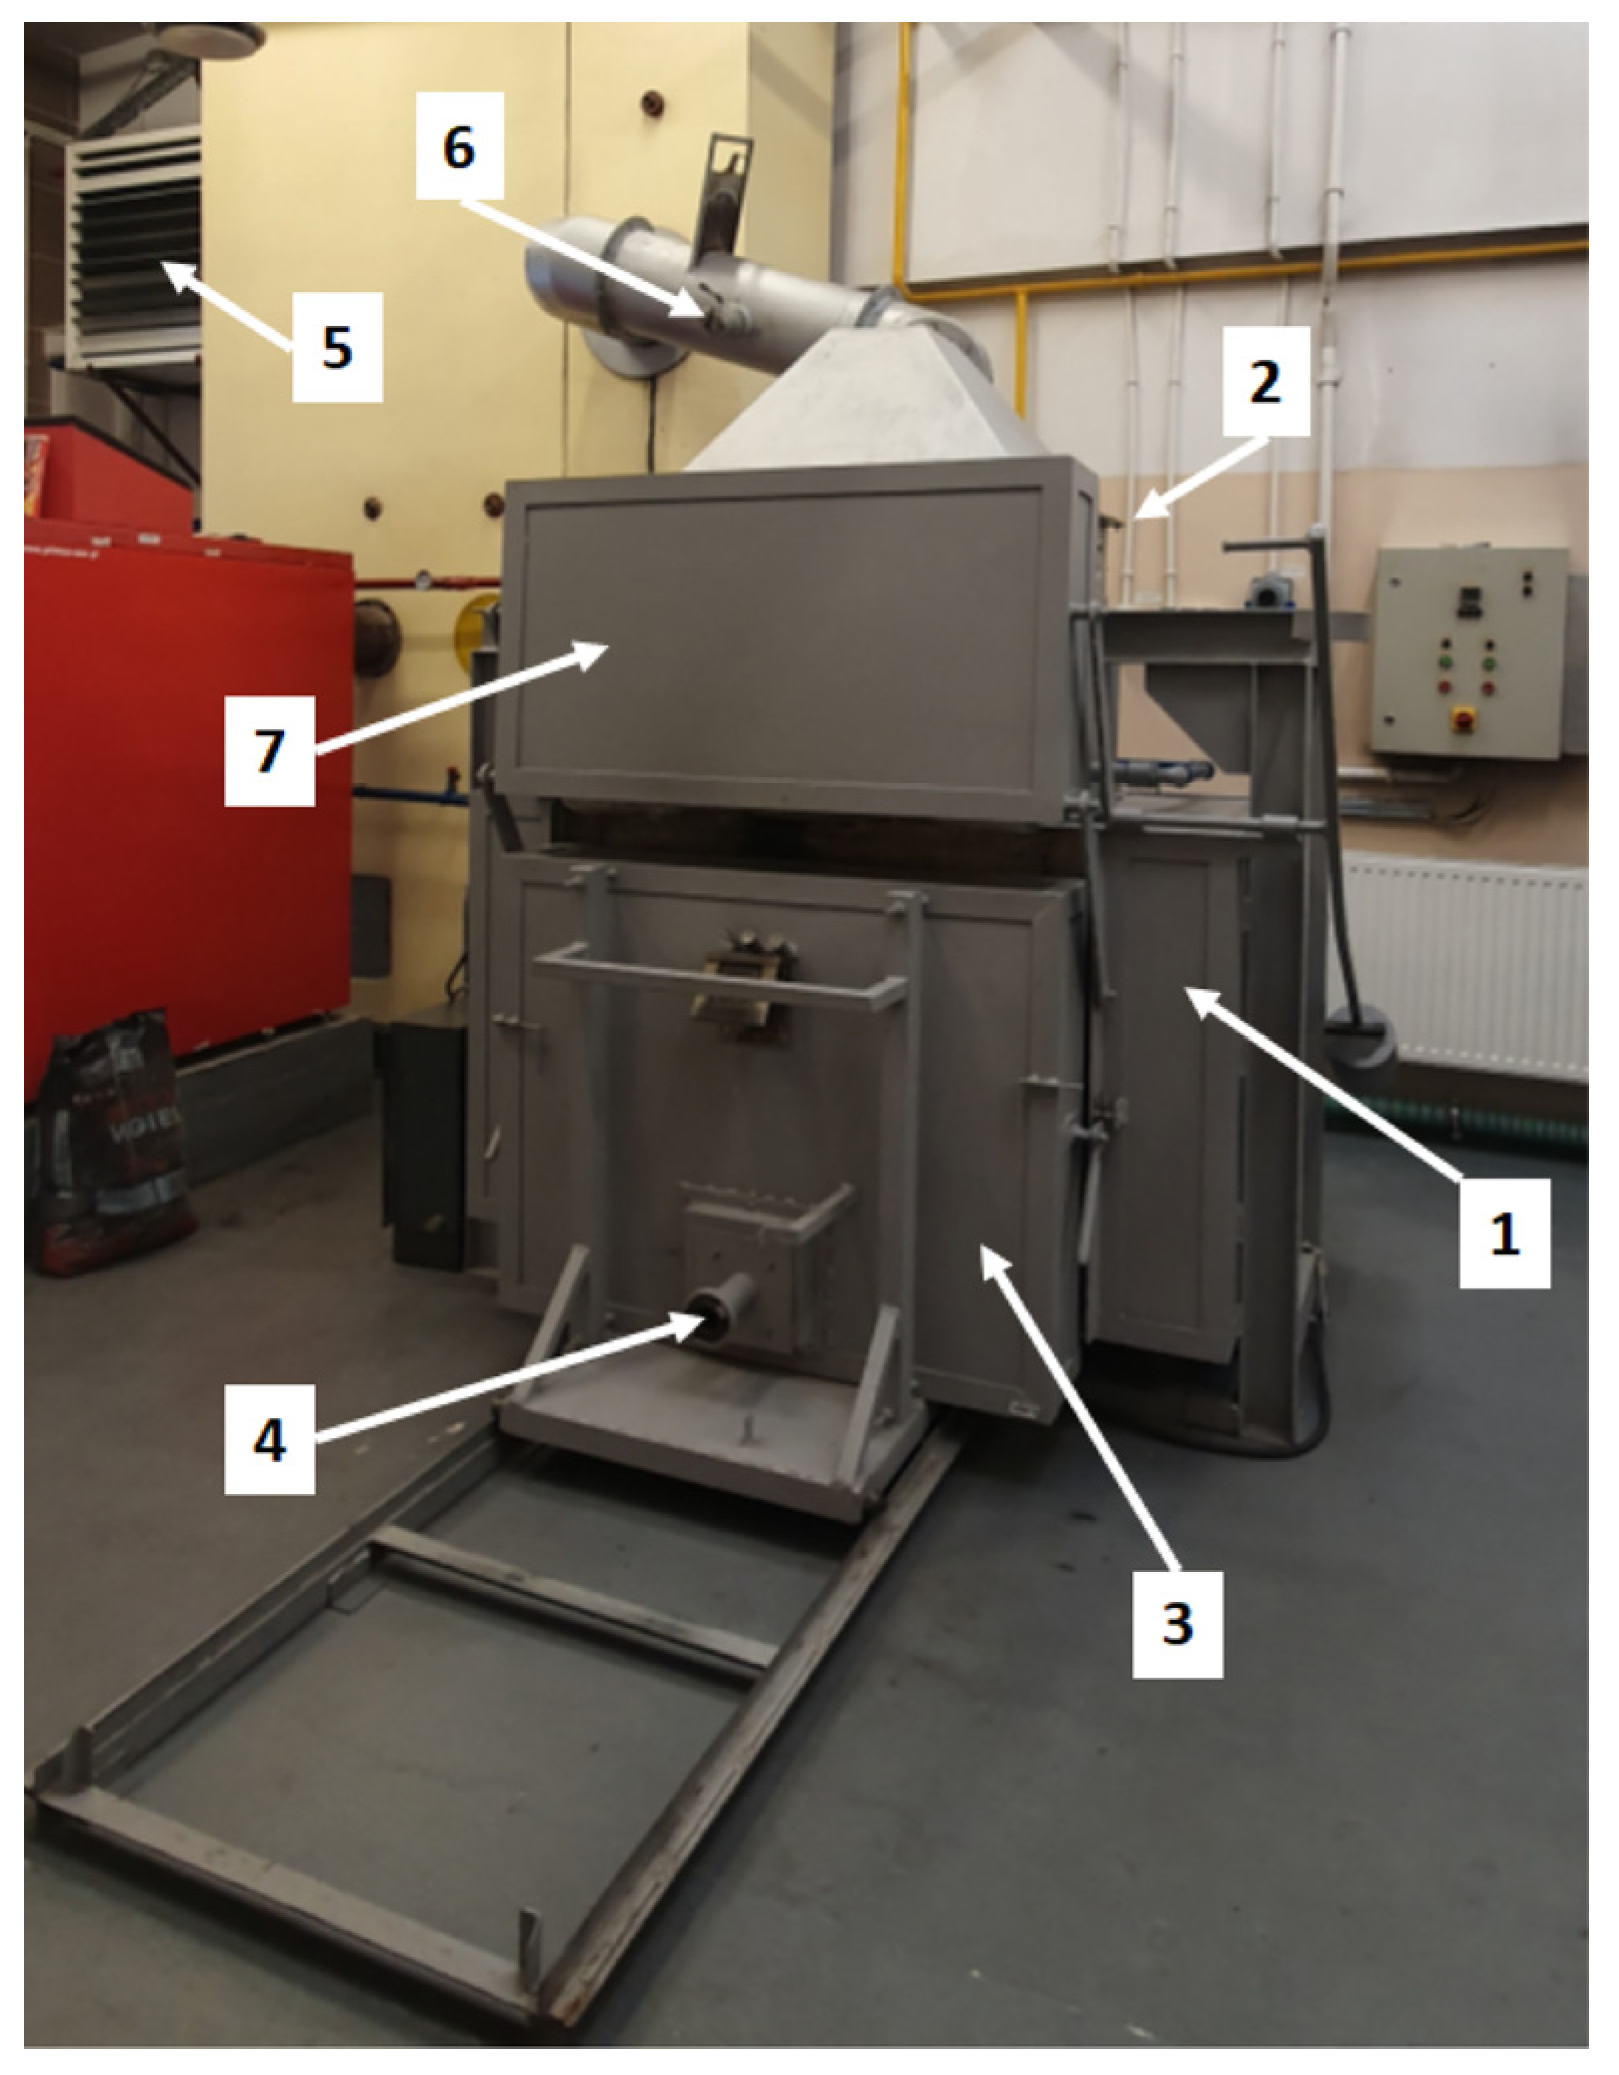
In order to determine the proportion of combustible parts in the slag, the slag was collected from the furnace chamber, from which, three samples weighing about 10 g were collected after it was homogenized. In the samples, the combustible parts were determined in accordance with PN-Z-15008-03:1993 [40]. The share of combustible parts was accepted as the average value of these determinations. The average value of these determinations was accepted as the share of combustible parts.
As to the share of combustible parts in the slag, the determination uncertainty of this value was 5%. This value was based on the determinations carried out in an additional series of 7 samples taken from the furnace chamber carried out for one of the tests. This value was defined as the quotient of the standard deviation related to the mean value.

2.2. Research Stand

The laboratory stand used in the research enables the simulation of combustion processes taking place in water boilers with a fixed grate and with a movable grate (e.g., belt grate). The diagram of the test stand shown in Figure 1 and Figure 2 presents the view of its most important part. The main element of the stand is the combustion chamber consisting of two basic parts: the upper and the lower part. In the lower part, it is possible to regulate the heating temperature of the chamber up to 1200 °C. In the upper part, a water jacket is applied.
The lower part of the installation, due to the possibility of heating to a constant temperature, enables the simulation of the vault ignition (afterburning) of a grate boiler. The heated chamber walls also simulate the influence of the remaining parts of the real boiler on the combustion fuel sample. The lower part of the test installation is designed to operate at temperatures up to 1800 °C. The upper part of the boiler allows the exhaust gas to be cooled in a manner similar to that occurring in the upper part of the combustion chambers of water boilers.
In order to quickly load the fuel sample into the furnace chamber and to allow the fuel to be placed on the grate, the grate is placed on a movable bed. The bed is pushed inside after the lower chamber has been heated to the assumed temperature.
The combustion chamber is equipped with a number of measuring nozzles that allow for temperature measurements and gas sampling at various points. The installation is equipped with a system of devices enabling the control of the size of air stream and its measurements. Due to the above-mentioned features, the installation enables the maintenance of repeatable values of the regulated factors. In order to measure the composition of the exhaust gases, samples were taken from a stub-pipe mounted in the chimney. The stub-pipe was located near the top of the combustion chamber. The concentrations of the analyzed gases were measured using the MGA 5 analyzer by MRU GmbH (Neckarsulm Germany). The analyzer measured CO2, CO, NO, and SO2 concentrations using infrared sensors. Additionally, in the case of NO2, the analyzer was using a catalytic converter. The accuracy of the exhaust gas analyzer was ±5% of the measured value [41].

2.3. Research Material

The research presented in this study concerns the co-firing of sludge with the composition given in Table 2 and hard coal with the composition shown in Table 3. The co-firing process was carried out in the furnace shown in Figure 1 (a fireplace with a fixed grate). The proportion of sludge in the burnt mixture was 15%, and the proportion of moisture in the sludge was 40%. The remaining parameters of the process were as follows: the initial thickness of the fuel layer on the grate was 10 cm, the theoretical ratio of excess air to combustion was 1.4, and the duration of the process was 40 min.

2.4. Distribution of Primary Air

Under the above-mentioned conditions, the tests were carried out for three variants of air stream distribution, which involved the relative version R ∈ [1/6, 5/12, 2/3], which in order to obtain absolute values should be multiplied by T.
In Figure 3, for the aforementioned R values, theoretical air stream distributions, determined according to the Equation (2), taking into account the dependencies (5) and (6), are presented. Figure 4 shows air streams in individual zones during the carried-out tests, which simulate the air flow distribution curves described by the Equation (2), for the R values taken into account. In each variant, the air was fed into 5 zones.

2.5. Sequence of Procedures in the Determination of Gaseous Products of the Combustion Process

  • The following part of the article presents the results of tests carried out in compliance with the following procedure:
  • Based on the composition and amount of the tested fuel and on the assumed ratio of excess air, the total amount of supplied air (Vad) was calculated.
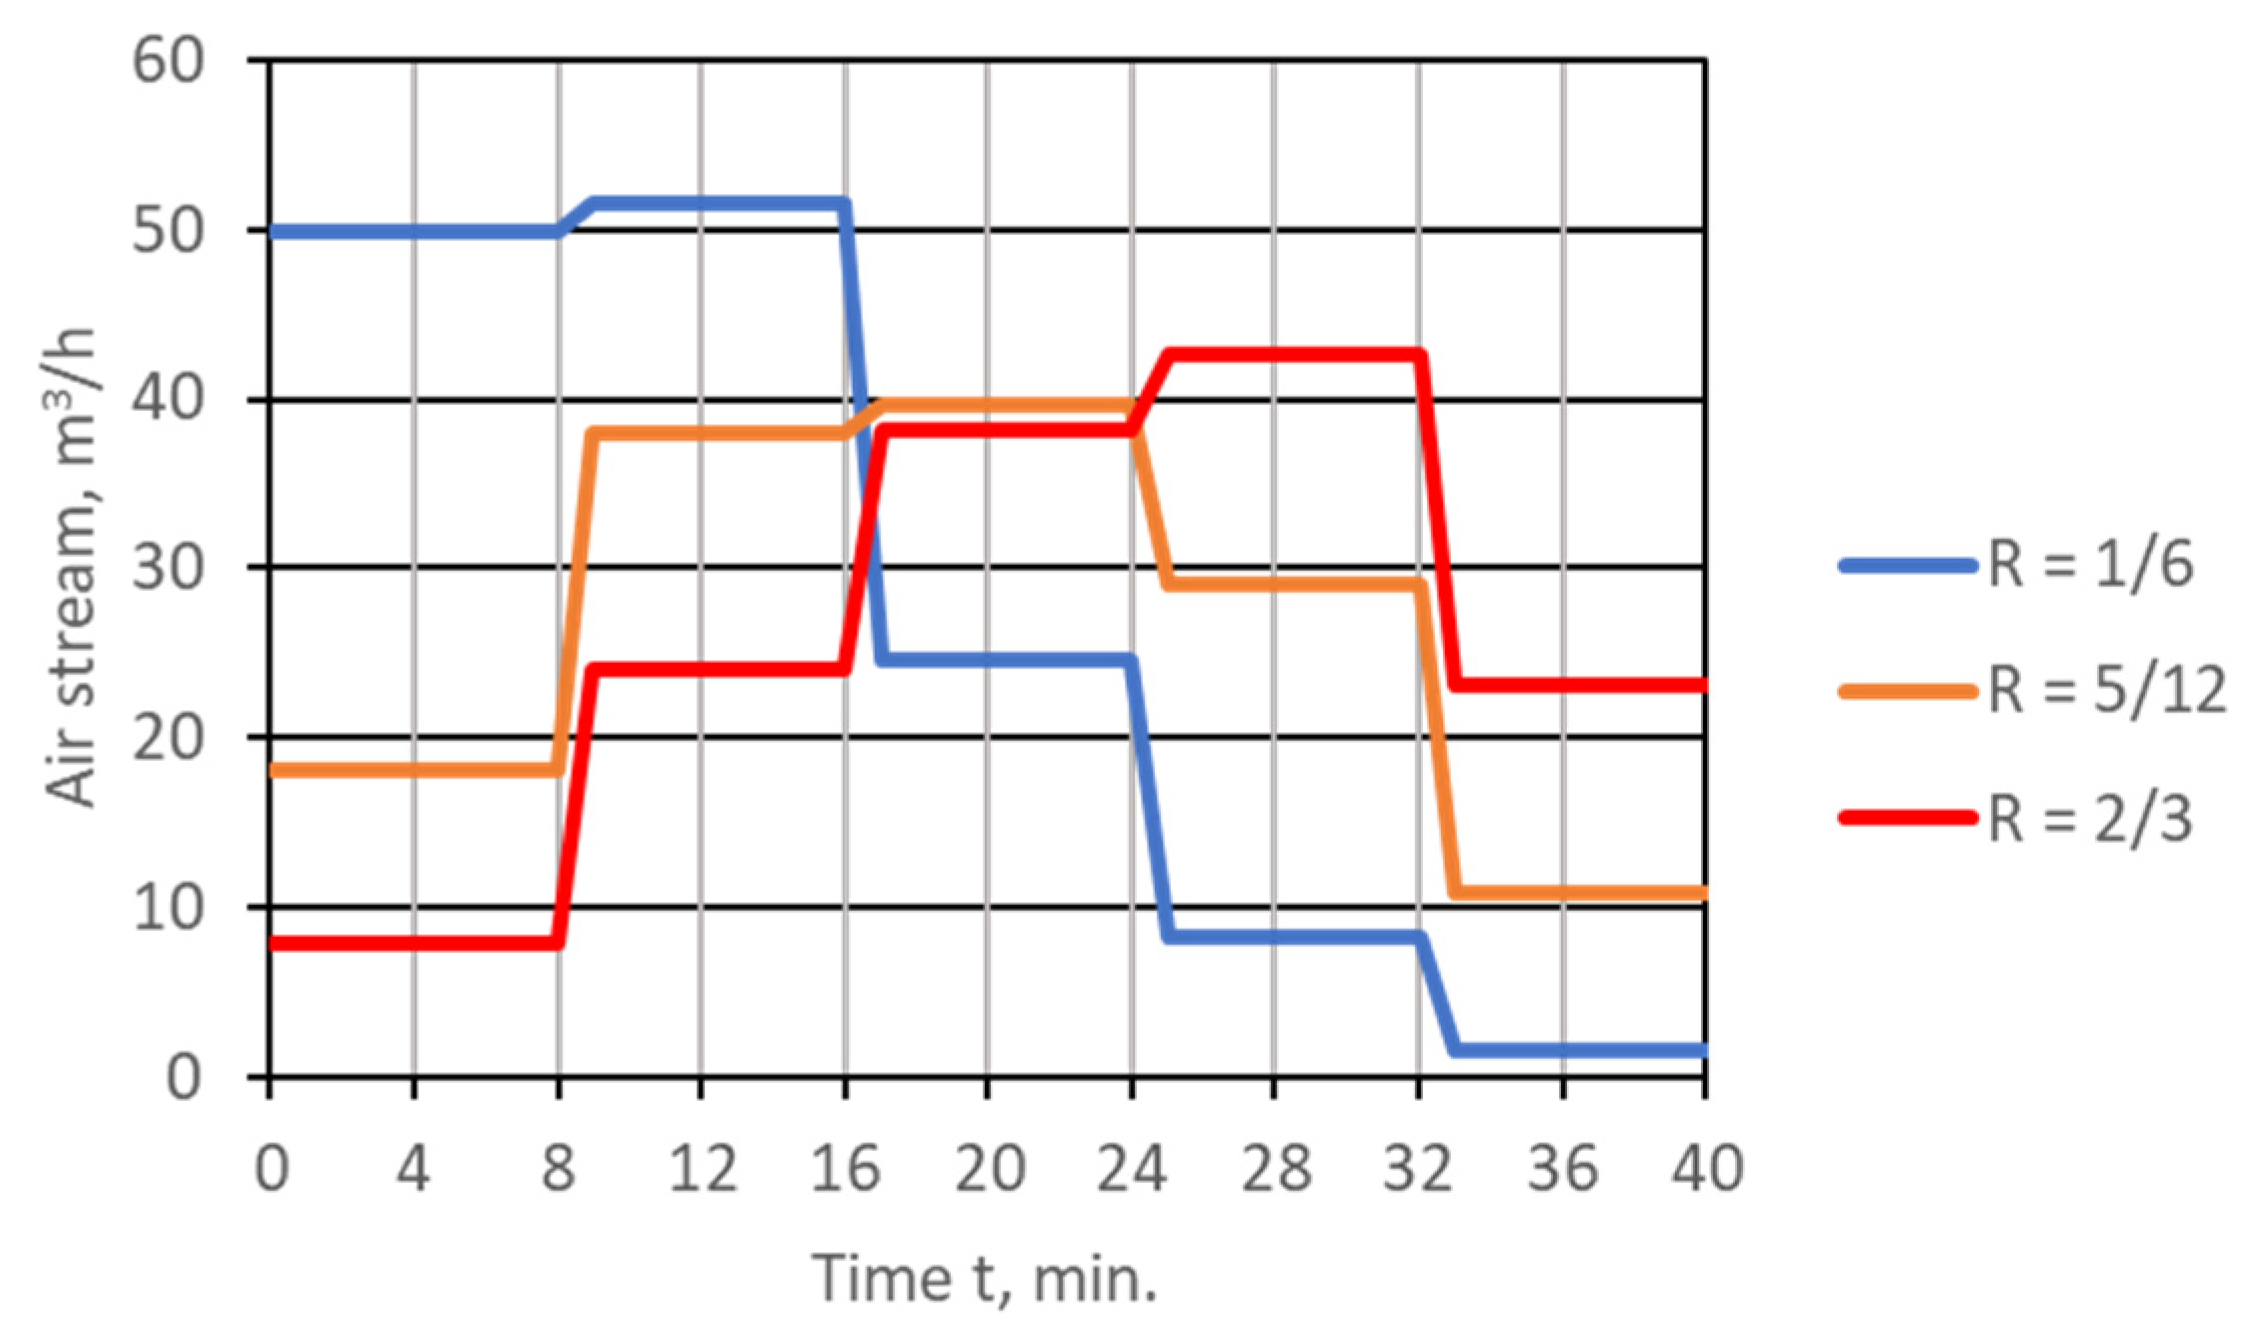
  • For the assumed value of R, the air stream distribution in time V ˙ was determined in line withEquation (2) (Figure 3).
  • Based on the Equation (10), the average values of air streams in individual zones V ˙ i , R were calculated (Figure 4).
  • The air streams, equal to the calculated values, were blown into the combustion chamber (they were controlled by means of rotameters).
  • During the tests, the concentrations of the analyzed exhaust gas components were measured e j , R , i , n ; the measurements were made in subsequent time steps in individual zones (using an analyzer).
For the values of air streams and concentrations of exhaust gas components resulting from the measurement, from Equation (11), taking into account Equation (9), the emission streams of exhaust gas components were calculated.

3. Results

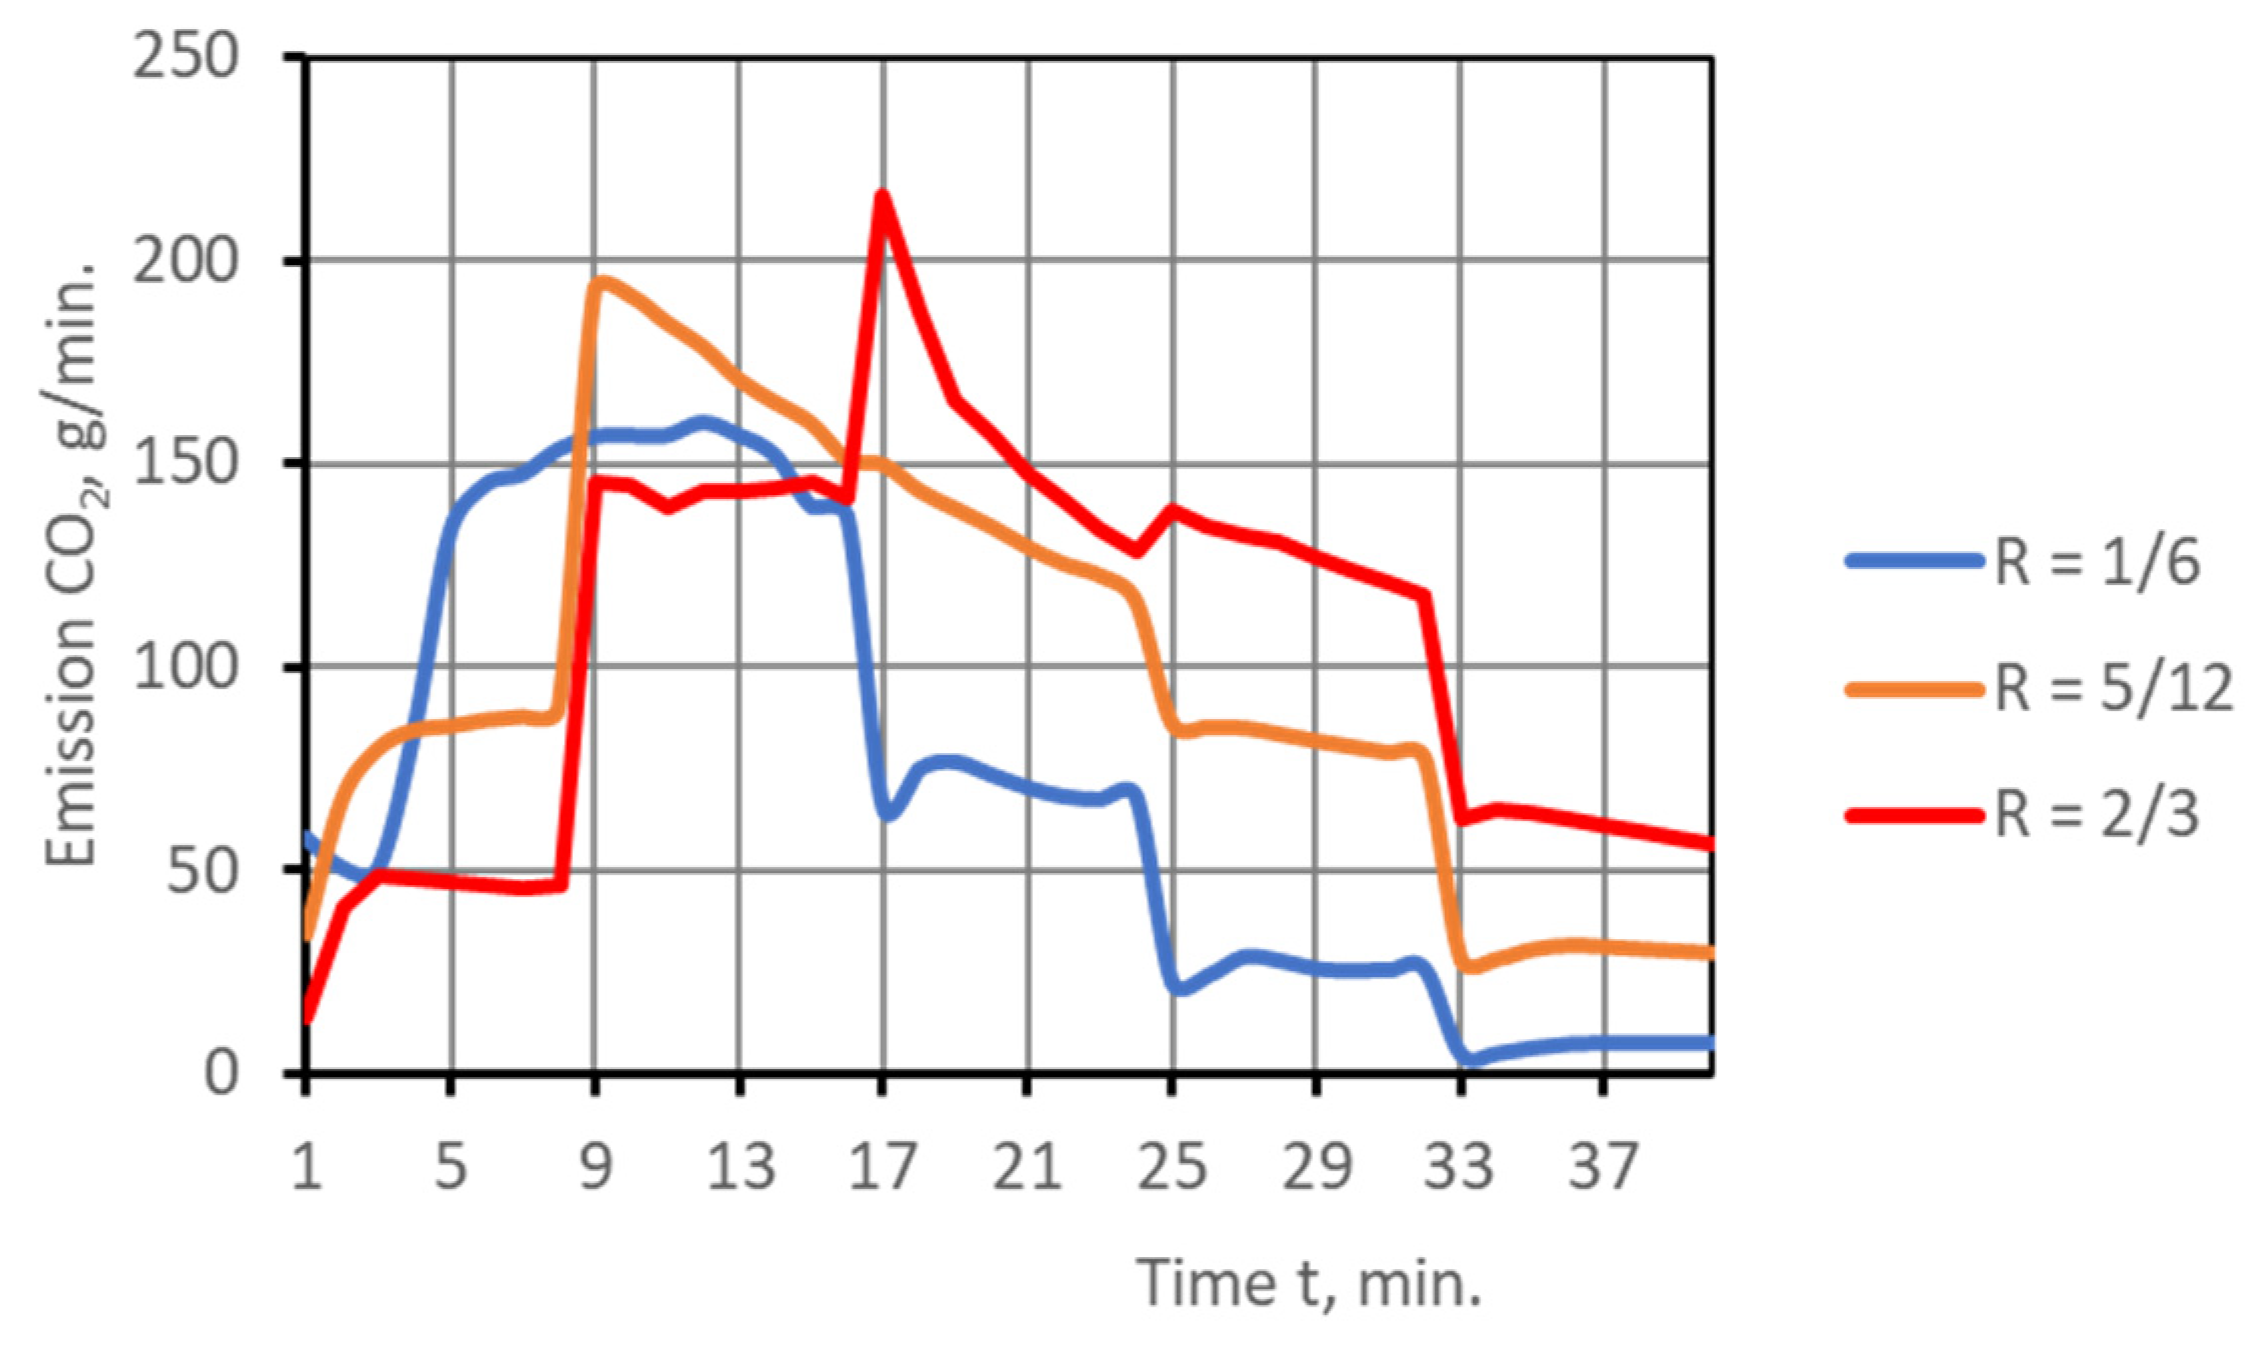
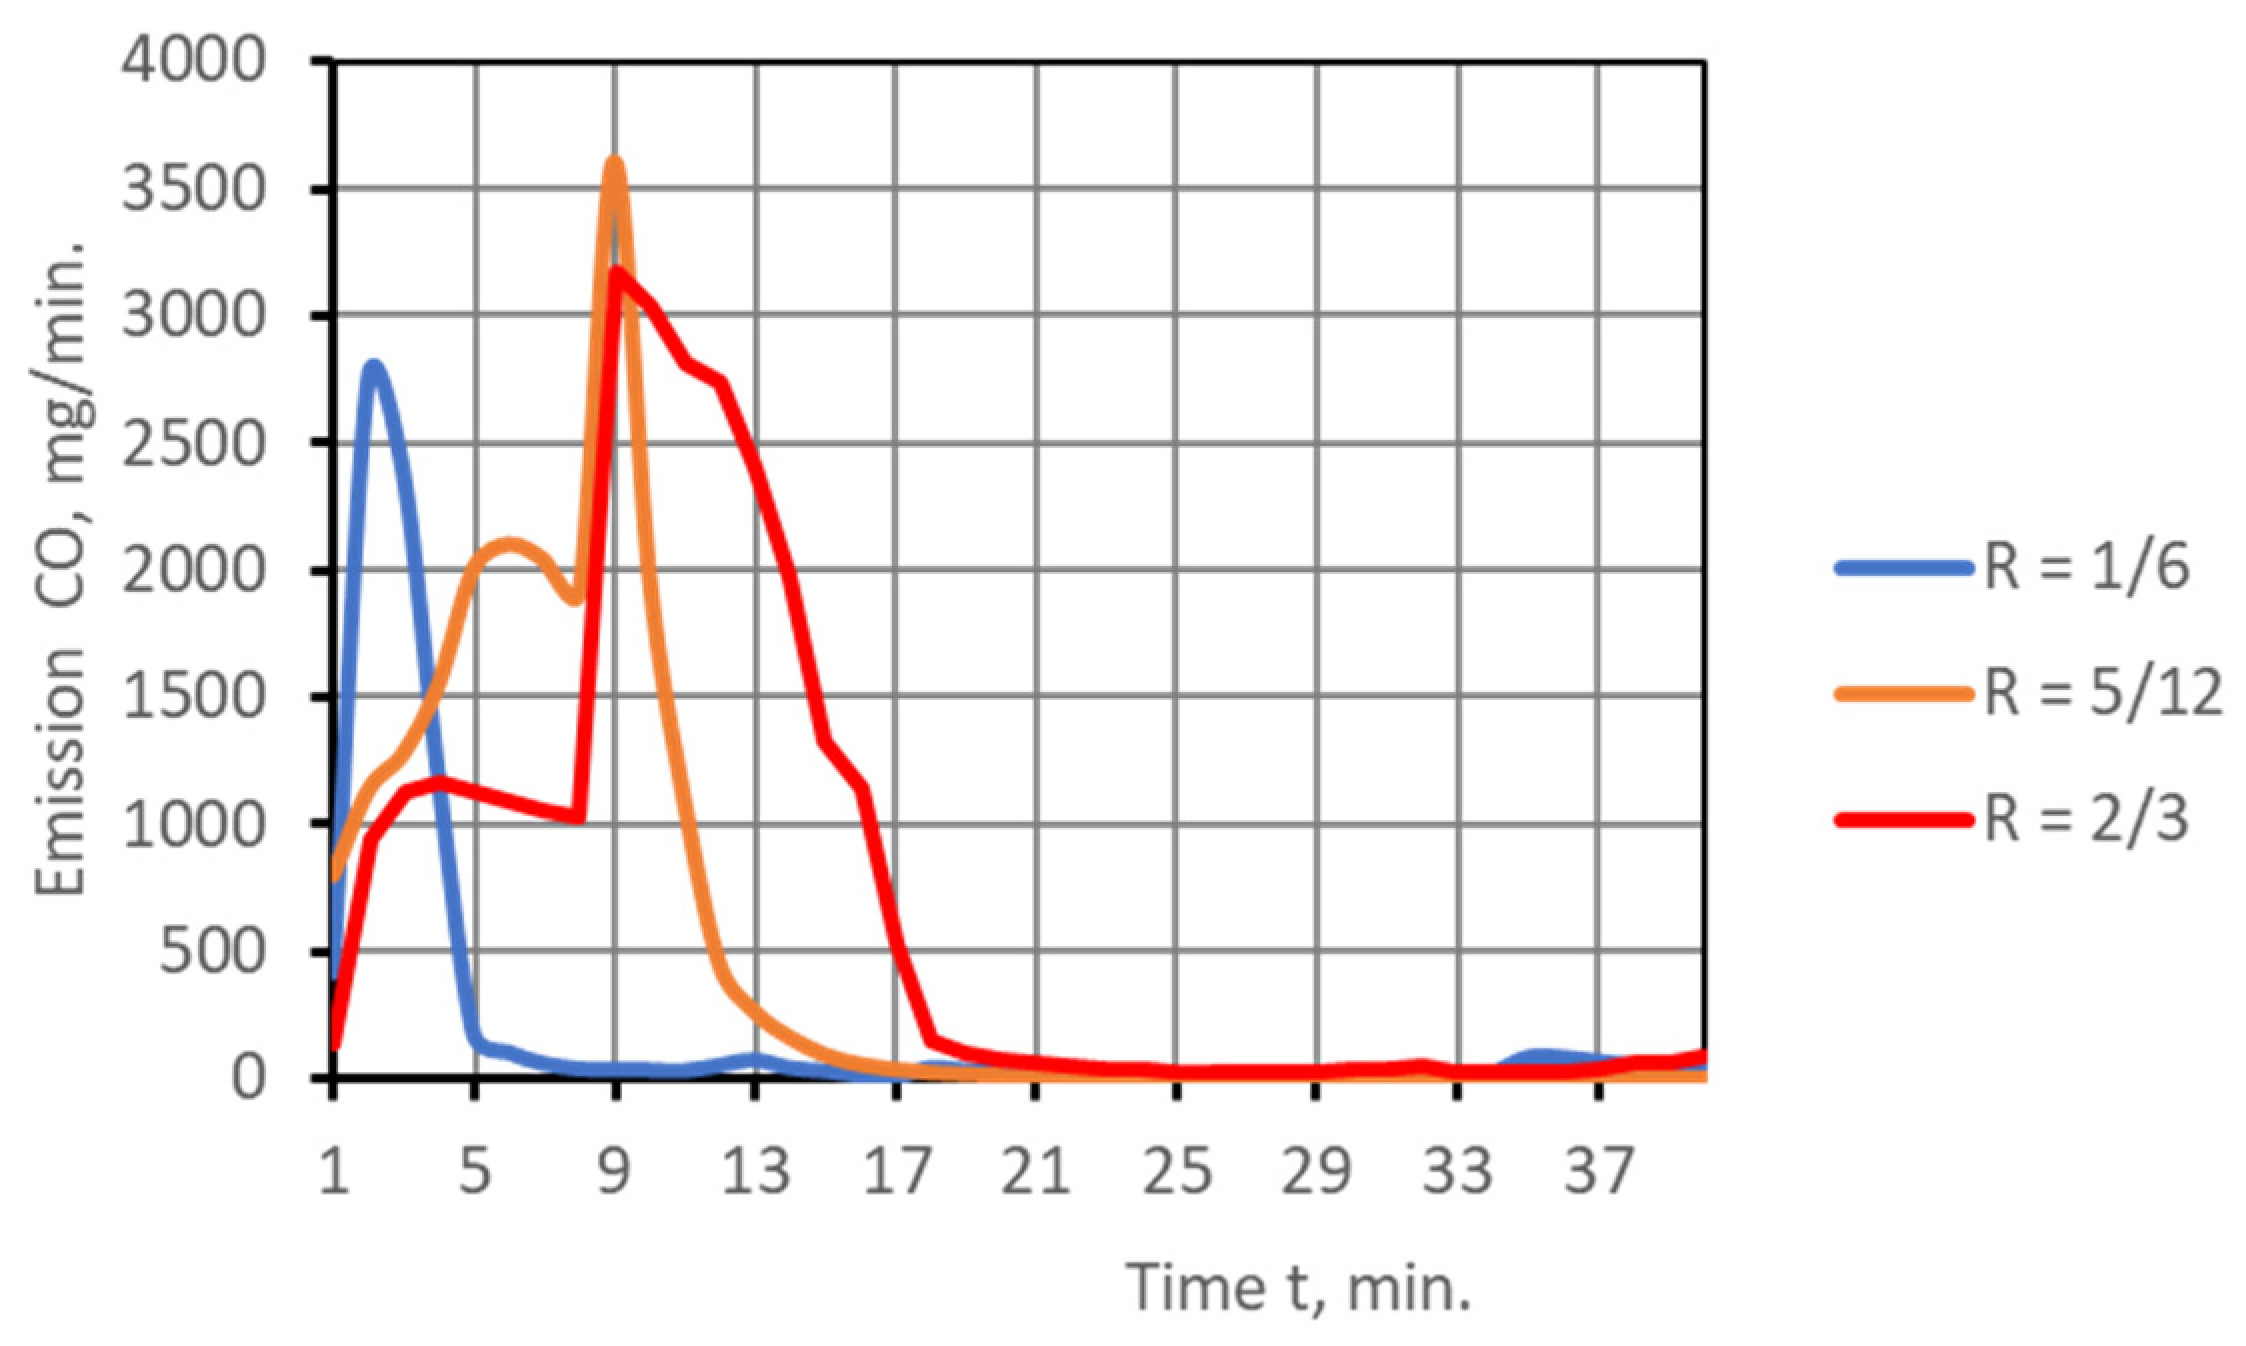
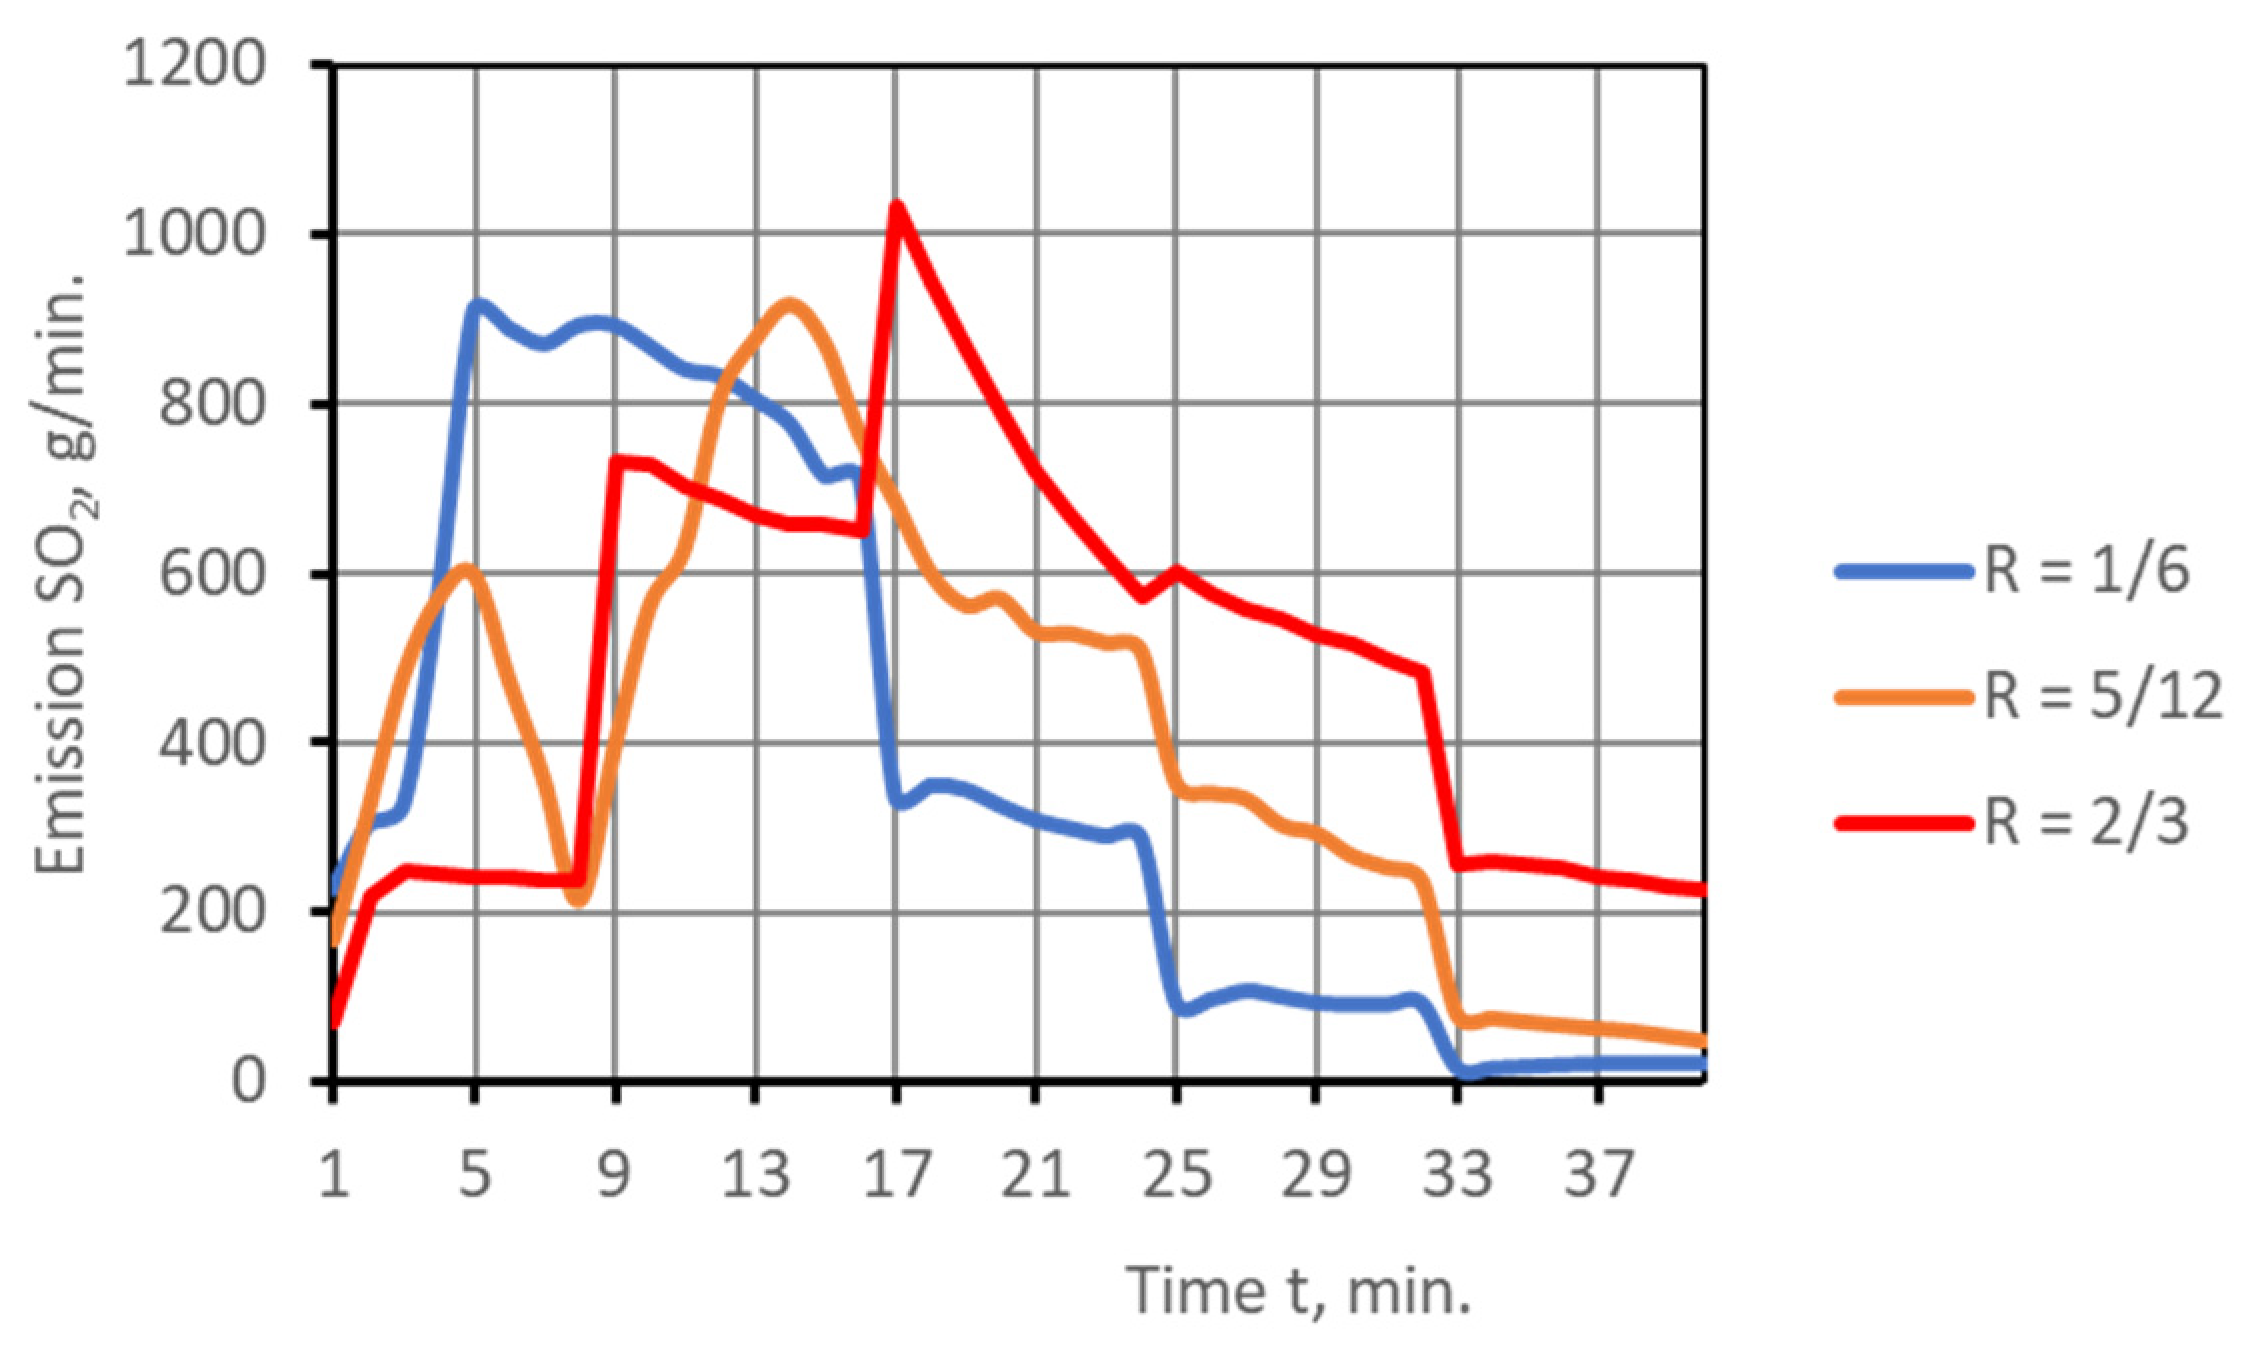
3.1. Emission Streams of Exhaust Gas Components

The following was assumed in the calculations: I = 5, N = 8, ∆t = 1 min, and R ∈ [1/6, 5/12, 2/3]. The obtained results are shown in Figure 5, Figure 6, Figure 7 and Figure 8, respectively for CO2, CO, NOx, and SO2. Each figure shows the emission streams corresponding to the three analyzed air distributions R. The information provided in the figures demonstrates the impact of air distribution both on the values of the emission streams of exhaust gas components obtained during the combustion of fuel and on the dynamics of the changes of these streams (i.e., their changes over time).

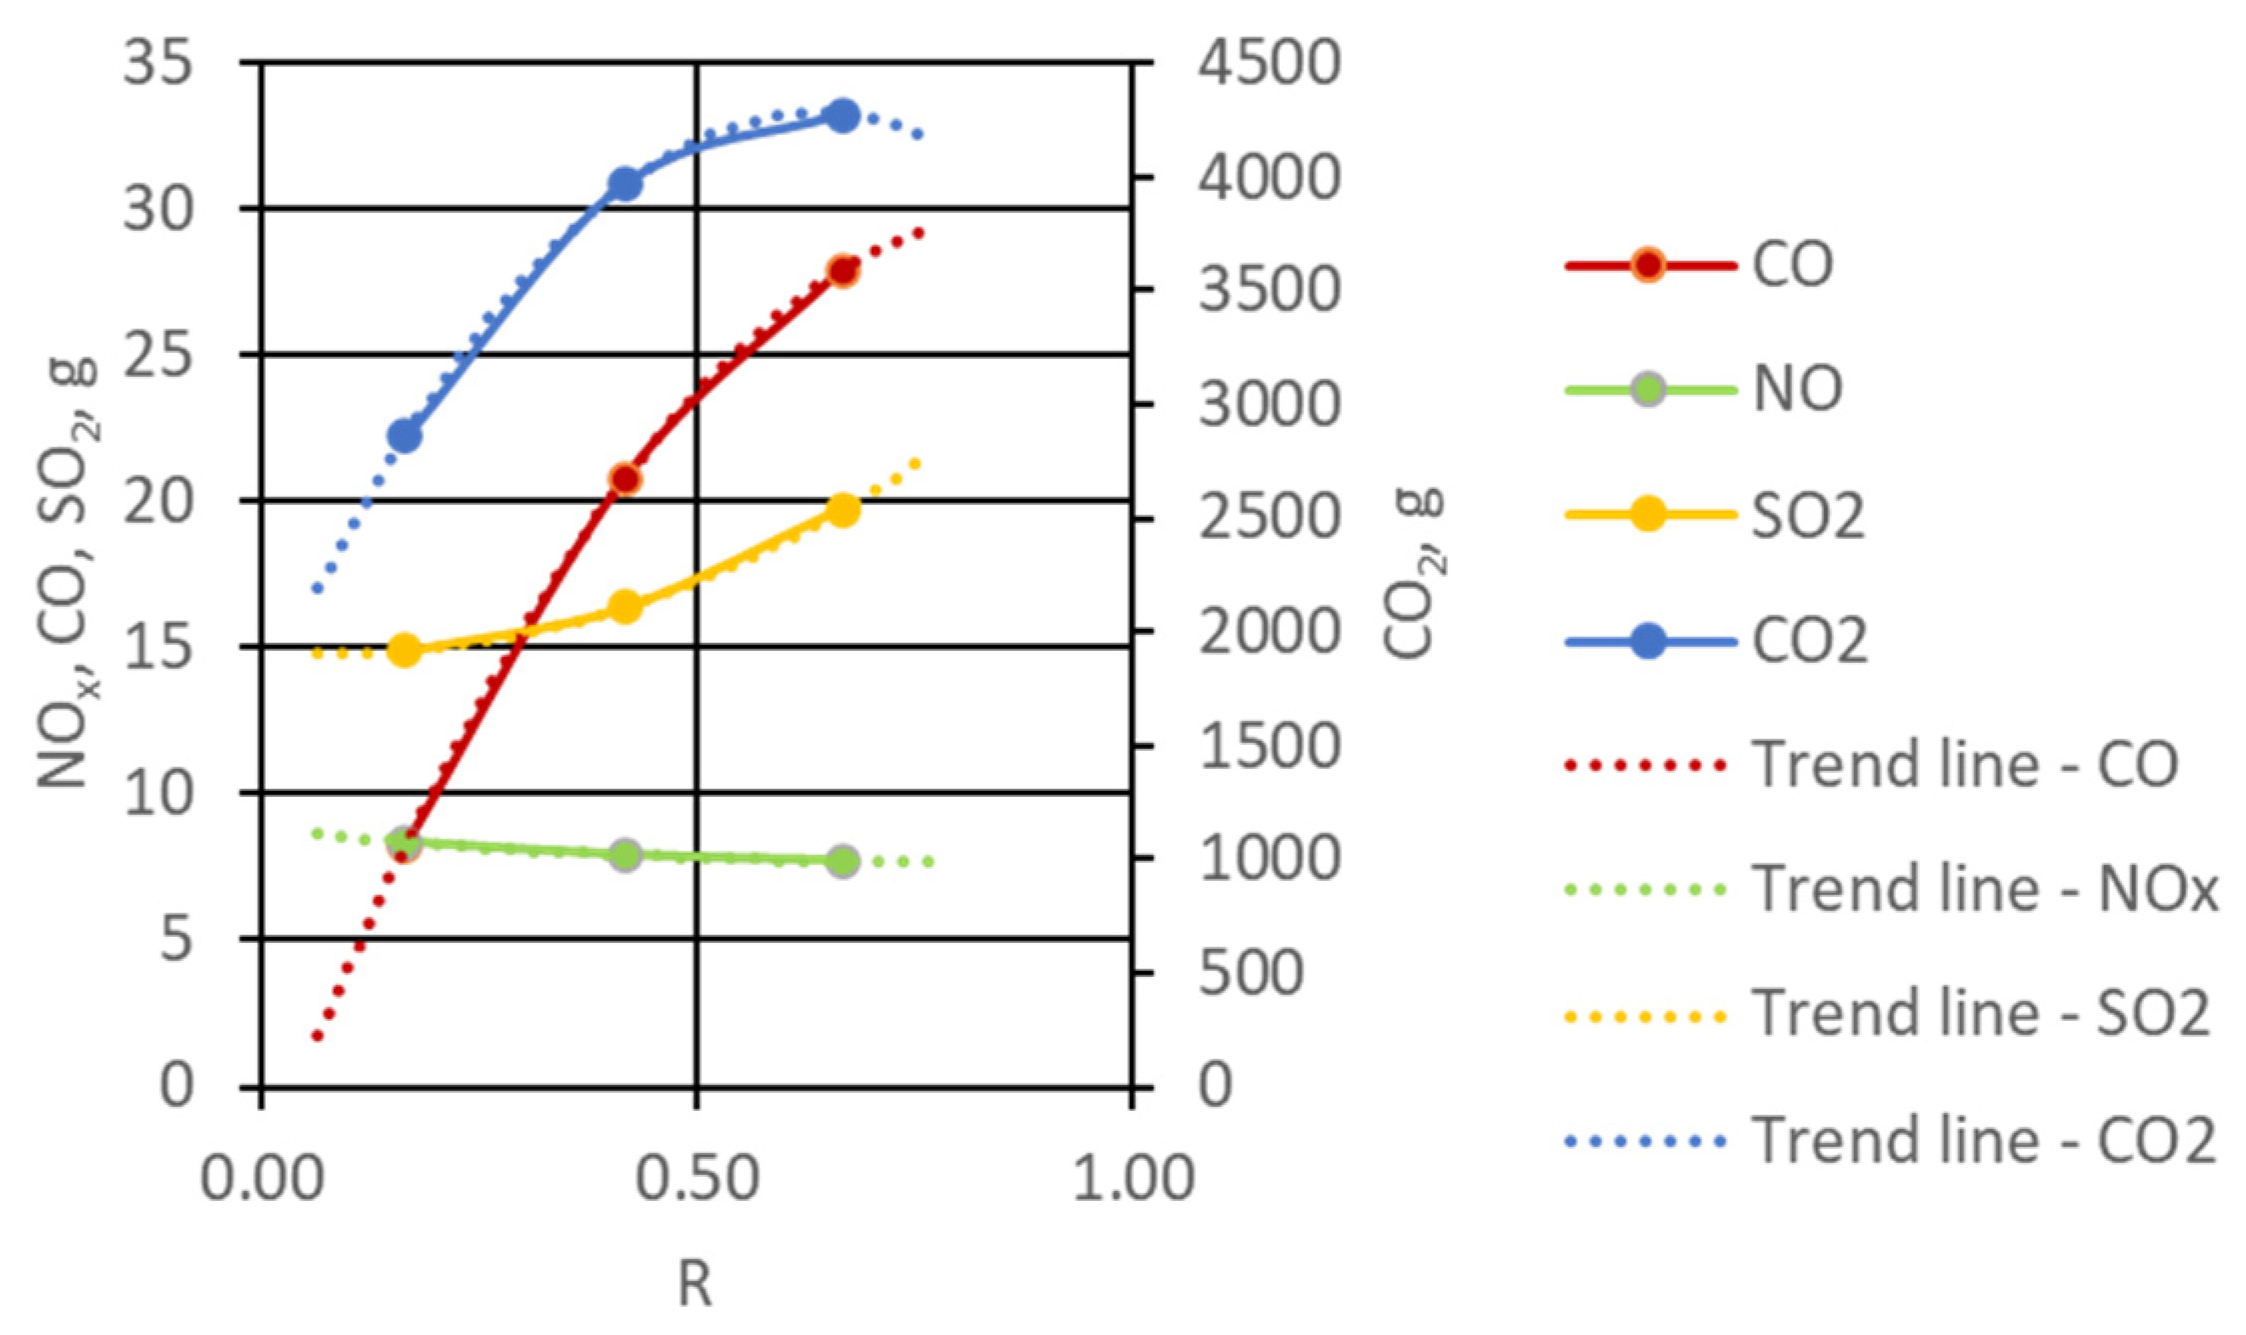
3.2. Total Emissions of Gaseous Combustion Products

The total emissions of the analyzed exhaust gas components were determined from the dependence (12) based on the above-mentioned measurement results and the adopted assumptions. The geometrical interpretation of the total emission of exhaust gas components is expressed by the fields under the graphs defining the emission stream of these components (see Figure 5, Figure 6, Figure 7 and Figure 8). The obtained results are presented in Figure 9.
The dashed lines show the trend lines extrapolated beyond the test range (by the value of 0.1 of the parameter R).

3.3. Determination of the Share of Combustible Parts in the Slag

The contents of the combustible parts in the slag, measured for the three considered air distributions, are presented in Figure 10. The dashed line shows the trend line, which is the extrapolated trend line beyond the scope of the tests (by 0.1 of the R parameter).

4. Discussion

The following discussion is based on the results of the research carried out in a furnace chamber with a fixed grate, working at the operating parameters given in Section 2 of this paper.
The changes in air streams introduced during the tests caused disturbances in the combustion process, which contributed to the irregular course of the streams of gaseous emissions of exhaust gas components.
In the case of the curves showing the changes in CO2 (Figure 5), the relationship between gas emissions and the changes in the primary air stream is clearly visible. And with the increase in parameter R, the occurrence of the largest CO2 stream is increasingly ahead of the moment of maximum air stream supply.
Almost the entire emission of CO (Figure 6), regardless of the distribution of the supplied air, takes place up to the moment of the largest stream of supplied air (approx. to 8, 16 and 20 min, respectively). The combustion process with air separation, for which R = 1/6, is characterized by the shortest duration of high CO emissions and the lowest total emissions of CO2 and CO. This may be the reason to conclude that the large air stream at the beginning of the combustion process did not allow the fuel to be properly ignited. For this reason, the amount of air quickly turned out to be sufficient to completely burn down the occurring CO to CO2.
The largest streams of NOx emission (Figure 7) are accompanied by a rapid decrease in the stream of CO emission. The above observation is consistent with the results of the research presented in [20,47,48].
The shapes of the curves showing changes in SO2 emissions (Figure 8), in the case of combustion processes with air distribution for R = 1/6 and R = 2/3, approximately correspond to the shapes of the curves showing changes in CO2 emissions (it is most evident in the case of air separation for R = 2/3). For the third combustion process, the discussed relationship can be observed only after 13 min.
The information provided in Figure 9 and Figure 10 shows that within the range of the analyzed air distribution R from 1/6 to 2/3, as it increases, a rise in the emissions of CO2, CO and SO2 was reported, respectively by 53%, 125%, and 27%, as well as a drop of NOx emission and the share of combustible parts in the slag by 12% and 79%, respectively. This allows us to assess the impact of air distribution on incomplete and fragmentary fuel combustion and to evaluate the ecological harmfulness of the conducted combustion processes.
The following general comments and observations result from the conducted analyses:
  • The generalized air distribution curve corresponds well with the practical methods of air supply (distribution) in industrial grate furnaces.
  • The time or place of supplying the maximum air stream and its total demand are sufficient parameters to determine the shape of the air distribution function.
  • Air distribution has a significant impact on the quantity and quality of gaseous and solid products of the combustion process.
  • By applying the proper air distribution, it is possible to significantly reduce the emission of selected gaseous substances and to increase the energy efficiency of the furnace operation.
  • In order to determine the most advantageous location of the maximum stream, the furnace characteristics should be determined each time for a given fuel (e.g., coal with specific properties).
When analyzing the obtained measurement results, one should notice the presence of too-high contents of combustible parts in the slag and the related too-low values of CO2 emission. It is caused by too short fuel combustion assumed in the tests. The resulting fact made it possible to more clearly demonstrate the influence of the method of air supply in the grate furnace on the emission of solid and gaseous fuel combustion products.

Author Contributions

Conceptualization, M.K. and J.K.; methodology, M.K. and J.K.; validation, M.K.; formal analysis, J.K.; investigation, M.K.; resources, M.K.; data curation, M.K. and J.K.; writing—original draft preparation, M.K. and J.K.; writing—review and editing, M.K. and J.K.; visualization, M.K.; supervision, J.K.; project administration, M.K.; funding acquisition, M.K. All authors have read and agreed to the published version of the manuscript.

Funding

The APC was funded by the Silesian University of Technology from the research subsidy (SUBB) for 2023, number 08/030/BK_23/0116.

Data Availability Statement

Not applicable.

Conflicts of Interest

The authors declare no conflict of interest.

References

  1. Madanayake, B.N.; Gan, S.; Eastwick, C.; Ng, H.K. Biomass as an energy source in coal co-firing and its feasibility enhancement via pre-treatment techniques. Fuel Process. Technol. 2017, 159, 287–305. [Google Scholar] [CrossRef]
  2. Ozawa, M.; Asano, H. (Eds.) Advances in Power Boilers; Elsevier: Amsterdam, The Netherlands, 2021. [Google Scholar] [CrossRef]
  3. Orłowski, P.; Dobrzański, W.; Szwarc, E. Kotły Parowe, Konstrukcja i Obliczenia; Wydawnictwa Naukowo-Techniczne: Warszawa, Poland, 1979. [Google Scholar]
  4. Fang, J.; Li, G.; Aunan, K.; Vennemo, H.; Seip, H.M.; Oye, K.A.; Beér, J.M. A proposed industrial-boiler efficiency program in Shanxi: Potential CO2-mitigation, health benefits and associated costs. Appl. Energy 2002, 71, 275–285. [Google Scholar] [CrossRef]
  5. Fang, J.; Zeng, T.; Yang, L.I.; Oye, K.A.; Sarofim, A.F.; Beér, J.M. Coal utilization in industrial boilers in China —A prospect for mitigating CO2 emissions. Appl. Energy 1999, 63, 35–52. [Google Scholar] [CrossRef]
  6. Lin, P.; Ji, J.; Luo, Y.; Wang, Y. A non-isothermal integrated model of coal-fired traveling grate boilers. Appl. Therm. Eng. 2009, 29, 3224–3234. [Google Scholar] [CrossRef]
  7. Greinert, A.; Mrówczyńska, M.; Grech, R.; Szefner, W. The Use of Plant Biomass Pellets for Energy Production by Combustion in Dedicated Furnaces. Energies 2020, 13, 463. [Google Scholar] [CrossRef]
  8. Variny, M.; Varga, A.; Rimár, M.; Janošovský, J.; Kizek, J.; Lukáč, L.; Jablonský, G.; Mierka, O. Advances in Biomass Co-Combustion with Fossil Fuels in the European Context: A Review. Processes 2021, 9, 100. [Google Scholar] [CrossRef]
  9. Zhang, X.; Chen, Q.; Bradford, R.; Sharifi, V.; Swithenbank, J. Experimental investigation and mathematical modelling of wood combustion in a moving grate boiler. Fuel Process. Technol. 2010, 91, 1491–1499. [Google Scholar] [CrossRef]
  10. Yin, C.; Rosendahl, L.A.; Kær, S.K. Grate-firing of biomass for heat and power production. Prog. Energy Combust. Sci. 2008, 34, 725–754. [Google Scholar] [CrossRef]
  11. Pham, T.P.T.; Kaushik, R.; Parshetti, G.K.; Mahmood, R.; Balasubramanian, R. Food waste-to-energy conversion technologies: Current status and future directions. Waste Manag. 2015, 38, 399–408. [Google Scholar] [CrossRef]
  12. Jančauskas, A.; Buinevičius, K. Combination of Primary Measures on Flue Gas Emissions in Grate-Firing Biofuel Boiler. Energies 2021, 14, 793. [Google Scholar] [CrossRef]
  13. Regueiro, A.; Patiño, D.; Porteiro, J.; Granada, E.; Míguez, J.L. Effect of Air Staging Ratios on the Burning Rate and Emissions in an Underfeed Fixed-Bed Biomass Combustor. Energies 2016, 9, 940. [Google Scholar] [CrossRef]
  14. Kozioł, M. Możliwości Substytucji Węgla Paliwami z Odpadów w Warunkach Polskich. Rynek Energii 2022, 3, 64–70. Available online: http://rynek-energii.pl/pl/RE160 (accessed on 22 September 2022).
  15. Makarichi, L.; Jutidamrongphan, W.; Techato, K.-A. The evolution of waste-to-energy incineration: A review. Renew. Sustain. Energy Rev. 2018, 91, 812–821. [Google Scholar] [CrossRef]
  16. Song, J.; Sun, Y.; Jin, L. PESTEL analysis of the development of the waste-to-energy incineration industry in China. Renew. Sustain. Energy Rev. 2017, 80, 276–289. [Google Scholar] [CrossRef]
  17. Leckner, B.; Lind, F. Combustion of municipal solid waste in fluidized bed or on grate—A comparison. Waste Manag. 2020, 109, 94–108. [Google Scholar] [CrossRef] [PubMed]
  18. Dai, J.; Sokhansanj, S.; Grace, J.R.; Bi, X.; Lim, C.J.; Melin, S. Overview and some issues related to co-firing biomass and coal. Can. J. Chem. Eng. 2008, 86, 367–386. [Google Scholar] [CrossRef]
  19. Xin-Gang, Z.; Gui-Wu, J.; Ang, L.; Yun, L. Technology, cost, a performance of waste-to-energy incineration industry in China. Renew. Sustain. Energy Rev. 2016, 55, 115–130. [Google Scholar] [CrossRef]
  20. Wilk, R.K. Low-Emission Combustion; Wydawnictwo Politechniki Śląskiej: Gliwice, Poland, 2002. [Google Scholar]
  21. Nugraha, M.; Saptoadi, H.; Hidayat, M.; Andersson, B.; Andersson, R. Particulate Matter Reduction in Residual Biomass Combustion. Energies 2021, 14, 3341. [Google Scholar] [CrossRef]
  22. Vakkilainen, E.K. Steam Generation from Biomass. Construction and Design of Large Boilers; Butterworth-Heinemann/Elsevier: Oxford, UK, 2016. [Google Scholar] [CrossRef]
  23. Hoang, Q.N.; Vanierschot, M.; Blondeau, J.; Croymans, T.; Pittoors, R.; Van Caneghem, J. Review of numerical studies on thermal treatment of municipal solid waste in packed bed combustion. Fuel Commun. 2021, 7, 100013. [Google Scholar] [CrossRef]
  24. Koziol, J.; Kozioł, M. Determining operating characteristics of co-firing processes in grate furnaces. Fuel 2019, 258, 116164. [Google Scholar] [CrossRef]
  25. Jiao, L.; Kuang, M.; Chen, Y.; Liu, S.; Wang, X. Detailed measurements of in-furnace gas temperature and species concentration distribution regarding the primary-air distribution mode in a spreader and reversal chain-grate furnace. Energy 2021, 235, 121384. [Google Scholar] [CrossRef]
  26. Hoang, Q.N.; Van Caneghem, J.; Croymans, T.; Pittoors, R.; Vanierschot, M. A novel comprehensive CFD-based model for municipal solid waste incinerators based on the porous medium approach. Fuel 2022, 326, 124963. [Google Scholar] [CrossRef]
  27. Zhuang, J.; Tang, J.; Aljerf, L. Comprehensive review on mechanism analysis and numerical simulation of municipal solid waste incineration process based on mechanical grate. Fuel 2022, 320, 123826. [Google Scholar] [CrossRef]
  28. Frey, H.-H.; Peters, B.; Hunsinger, H.; Vehlow, J. Characterization of municipal solid waste combustion in a grate furnace. Waste Manag. 2003, 23, 689–701. [Google Scholar] [CrossRef] [PubMed]
  29. Scholz, R.; Beckmann, M.; Schulenburg, F. Entwicklungsmöglichkeiten der Prozeßführung bei Rostsystemen zur Abfallbehandlung; FDBR-Symposium: Rostock, Germany, 1996. [Google Scholar]
  30. Wissing, F.; Wirtz, S.; Scherer, V. Simulating municipal solid waste incineration with a DEM/CFD method—Influences of waste properties, grate and furnace design. Fuel 2017, 206, 638–656. [Google Scholar] [CrossRef]
  31. Gu, T.; Ma, W.; Guo, Z.; Berning, T.; Yin, C. Stable and clean co-combustion of municipal sewage sludge with solid wastes in a grate boiler: A modeling-based feasibility study. Fuel 2022, 328, 125237. [Google Scholar] [CrossRef]
  32. Costa, M.; Massarotti, N.; Mauro, A.; Arpino, F.; Rocco, V. CFD modelling of a RDF incineration plant. Appl. Therm. Eng. 2016, 101, 710–719. [Google Scholar] [CrossRef]
  33. Tu, Y.; Zhou, A.; Xu, M.; Yang, W.; Siah, K.B.; Prabakaran, S. Experimental and numerical study on the combustion of a 32 MW wood-chip grate boiler with internal flue gas recirculation technology. Energy Procedia 2017, 143, 591–598. [Google Scholar] [CrossRef]
  34. Rajh, B.; Yin, C.; Samec, N.; Hriberšek, M.; Zadravec, M. Advanced modelling and testing of a 13 MW th waste wood-fired grate boiler with recycled flue gas. Energy Convers. Manag. 2016, 125, 230–241. [Google Scholar] [CrossRef]
  35. Xia, Z.; Shan, P.; Chen, C.; Du, H.; Huang, J.; Bai, L. A two-fluid model simulation of an industrial moving grate waste incinerator. Waste Manag. 2020, 104, 183–191. [Google Scholar] [CrossRef]
  36. Karim, R.; Naser, J. CFD modelling of combustion and associated emission of wet woody biomass in a 4 MW moving grate boiler. Fuel 2018, 222, 656–674. [Google Scholar] [CrossRef]
  37. Jiang, M.; Lai, A.; Law, A. Solid Waste Incineration Modelling for Advanced Moving Grate Incinerators. Sustainability 2020, 12, 8007. [Google Scholar] [CrossRef]
  38. Zhou, A.; Xu, H.; Tu, Y.; Zhao, F.; Zheng, Z.; Yang, W. Numerical investigation of the effect of air supply and oxygen enrichment on the biomass combustion in the grate boiler. Appl. Therm. Eng. 2019, 156, 550–561. [Google Scholar] [CrossRef]
  39. Waldner, M.; Halter, R.; Sigg, A.; Brosch, B.; Gehrmann, H.; Keunecke, M. Energy from Waste—Clean, efficient, renewable: Transitions in combustion efficiency and NOx control. Waste Manag. 2013, 33, 317–326. [Google Scholar] [CrossRef] [PubMed]
  40. PKN. PN-Z-15008-03:1993 Badania Właściwości Paliwowych—Oznaczanie Zawartości Części Palnych i Niepalnych. Available online: https://sklep.pkn.pl/pn-z-15008-03-1993p.html (accessed on 14 July 2021).
  41. MRU Sp. z o.o.: Instrukcja Obsługi i Serwisu MGA 5 (MGA 5 Flue Gas Analyzer User Manual); MRU GmbH: Neckarsulm, Germany, 2006.
  42. PKN: PN-ISO 1928:2002 Paliwa Stałe—Oznaczanie Ciepła Spalania Metodą Spalania w Bombie Kalorymetrycznej i Obliczanie Wartości Opałowej. Available online: https://sklep.pkn.pl/pn-iso-1928-2002p.html?options=cart (accessed on 20 July 2021).
  43. PKN: PN-Z-15008-05:1993 Odpady Komunalne Stałe—Badania Właściwości Paliwowych—Oznaczanie Zawartości Węgla i Wodoru. Available online: https://sklep.pkn.pl/pn-z-15008-05-1993p.html (accessed on 14 July 2021).
  44. PKN: PN-G-04523:1992 Paliwa Stałe—Oznaczanie Zawartości Azotu Metodą Kjeldahla. Available online: https://sklep.pkn.pl/pn-g-04523-1992p.html?options=cart (accessed on 14 July 2021).
  45. PKN: PN-ISO 334:1997 Paliwa Stałe—Oznaczanie Siarki Całkowitej—Metoda Eschki. Available online: https://sklep.pkn.pl/pn-iso-334-1997p.html?options=cart (accessed on 14 July 2021).
  46. PKN: PN-G-04511:1980 Paliwa Stałe—Oznaczanie Zawartości Wilgoci. Available online: https://sklep.pkn.pl/pn-g-04511-1980p.html (accessed on 5 July 2021).
  47. Kruczek, H.; Modliński, Z.; Ferens, W. Study of NOx formation for lean and rich stirred reactors flames in the presence of sulphur species. In Proceedings of the XIIIth International Symposium on Combustion Processes, Kraków, Poland, 22–24 September 1993. [Google Scholar]
  48. Scholz, R.; Beckmann, M.; Davidivic, M.; Busch, M.; Schmidt, W. Vergasung von Restabfall auf Rosten; Heft 13; Veröffentlichungen des Zentrums für Abfallforschung der Technischen Universität Braunschweig: Braunschweig, Germany, 1998. [Google Scholar]
Figure 1. Test stand scheme: A—flue gas analyzer, S—boiler control system, W—fan, 1—rotameter, 2—valve, 3—moveable bed with grate, 4—grate, 5—surge tank (firepan), 6—rail, 7—air supply nozzle, 8—heating element (electrical), 9—water jacket, 10—discharge tunnel, 11—measurement probe, 12—probe head, 13—heated hose, 14—electric cables, 15—cooling water circulation, 16—water/air heat exchanger (cooler), 17—circulation pump, 18—surroundings.
Energies 16 01647 g001
Figure 2. View of the test stand: 1—lower part of the stand (heated), 2—upper part of the stand (water-cooled), 3—movable bed with a grate (inserted), 4—connection point for the primary air duct, 5—water/air heat exchanger (cooler), 6—measurement point of exhaust gas composition, 7—raised furnace closure (lowered for the heating time of the stand).
Energies 16 01647 g002
Figure 3. Theoretical distributions of air streams for the values R analyzed in the study.
Energies 16 01647 g003
Figure 4. Average values of air streams delivered to individual zones during laboratory tests.
Energies 16 01647 g004
Figure 5. Dynamics of CO2 emission determined during the tests at individual primary air distributions.
Energies 16 01647 g005
Figure 6. Dynamics of CO emission determined during the tests for individual primary air distributions.
Energies 16 01647 g006
Figure 7. Dynamics of NOx emission determined during the tests for individual primary air distributions.
Energies 16 01647 g007
Figure 8. Dynamics of SO2 emission determined during the tests for individual primary air distributions.
Energies 16 01647 g008
Figure 9. Curves describing changes in total emission of CO2, CO, NOx, and SO2 as a function of the R parameter. Dashed lines—extrapolated trend lines beyond the test range (value 0.1 of the R parameter).
Energies 16 01647 g009
Figure 10. Curve describing changes in the content of combustible parts in the slag as a function of R parameter. The dashed line—extrapolated trend line beyond the test range (by the value of 0.1 of the R parameter).
Energies 16 01647 g010
Table 1. Calculated values of α (ratio of air stream to dry exhaust gas stream) for the exemplary fuels and for the values λ = 1.0; 1.4; 1.6 (λ—excess air ratio).
Fuel TypeCalorific Value MJ/kgα
λ = 1.0λ = 1.4λ = 1.6
Anthracite31.41.0251.0171.015
Fat coal31.81.0371.0271.023
Gas coal31.41.0381.0271.023
Lean coal31.41.0371.0261.023
Gas coal *26.81.0201.0141.014
Dried peat13.51.0291.0201.018
Lignite9.61.0331.0241.021
Sewage sludge *10.31.0431.0301.025
Mix * of coal + sludge24.51.0221.0161.014
*—fuel used in the presented research.
Table 2. Selected parameters of sludge used in the tests (d.w.—dry weight).
SpecificationUnitValuesStand. Dev.Determination Method/Standard
Calorific value d.w.kJ/kg10,330680PN-ISO 1928:2002 [42]
Combustible parts% d.w.62.040.61PN-Z-15008-03:1993 [40]
Elementary composition:
Carbon% d.w.30.130.72PN-Z-15008-05:1993 [43]
Hydrogen% d.w.4.350.34PN-Z-15008-05:1993 [43]
Nitrogen% d.w.3.670.26PN-G-04523:1992 [44]
Sulphur% d.w.1.410.16PN-ISO 334:1997 [45]
Oxygen% d.w.19.300.85Calculation method *
* oxygen content = 100%−carbon content %−hydrogen content %−nitrogen content %−sulfur content %−content of noncombustible parts %.
Table 3. Selected parameters of coal used in the research.
SpecificationUnitValuesStand. Dev.Determination Method/Standard
Calorific value d.w.kJ/kg26,7902040PN-ISO 1928:2002 [42]
Combustible parts% d.w.93.650.104PN-Z-15008-03:1993 [40]
Elementary composition:
Carbon%73.010.97PN-Z-15008-05:1993 [43]
Hydrogen%4.570.08PN-Z-15008-05:1993 [43]
Nitrogen%1.530.04PN-G-04523:1992 [44]
Sulphur%0.370.01PN-ISO 334:1997 [45]
Oxygen%9.661.01Calculation method *
Humidity%4.790.25PN-G-04511:1980 [46]
* oxygen content = 100%−carbon content %−hydrogen content %−nitrogen content %−sulfur content %−content of non-combustible parts %−humidity content %.
Disclaimer/Publisher’s Note: The statements, opinions and data contained in all publications are solely those of the individual author(s) and contributor(s) and not of MDPI and/or the editor(s). MDPI and/or the editor(s) disclaim responsibility for any injury to people or property resulting from any ideas, methods, instructions or products referred to in the content.

