Article

Study of Chelating Agent—Surfactant Interactions on the Interphase as Possibly Useful for the Well Stimulation

by
Timur Ildarovich Yunusov
1,2,*,
Lyutsia Faritovna Davletshina
1,
Lyubov Abdulaevna Magadova
1 and
Mikhail Alexandrovich Silin
1
1
Department of Chemicals for Oil and Gas Industry, National University of Oil and Gas (Gubkin Universiy), 119991 Moscow, Russia
2
Center for Petroleum Science and Engineering, Skolkovo Institute of Science and Technology, 12205 Moscow, Russia
*
Author to whom correspondence should be addressed.
Energies 2023, 16(4), 1679; https://doi.org/10.3390/en16041679
Submission received: 28 December 2022 / Revised: 2 February 2023 / Accepted: 4 February 2023 / Published: 8 February 2023

Abstract

:
Chelating agents’ application for EOR and well stimulation is fast growing nowadays. However, reagents of this class have some drawbacks, with high values of interfacial tension (IFT) being among them. IFT may be lowered with the addition of surfactants; however, the simultaneous application of chelating agents and surfactants has not yet been widely studied. This paper focuses on the experimental and theoretical investigation of the interaction between chelating agent (ethylenediaminetetraacetic acid, EDTA) and surfactants of anionic and cationic types (sodium dodecyl sulfate, SDS, and dodecyl trimethynlammonium bromide, DTAB). IFT measurement was performed at ambient conditions, with normal octane being as the reference hydrocarbon to eliminate the temperature and salinity effects and compare surfactant-containing systems. The experimental results show that chelating agents’ addition to the solutions of surfactants leads to a decrease in IFT value. Moreover, surfactants’ critical micelle concentration is lowered, whereas their effectiveness and efficiency are increased, which points to the salting-out nature of chelating agents. Molecular dynamics reveal that chelating agent addition causes closer packing of surfactant layer, the decrease in head groups’ hydration, and, at least in the case of SDS, specific surfactant–chelating agent attractive interaction. These molecular-level insights, experimental dependencies, and the combined methodology may be useful for the proper selection of fluids for real-field operations.

1. Introduction

Chelating agents are widely used in different fields of industry. Their ability to sequester metal ions and solubilize compounds that are normally insoluble in water make them indispensable in the production of detergents, fertilizers, and drugs [1]. They can also be used for soil remediation or waste treatment [2,3].
Chelating agents are also found in a huge variety of applications in oil industry. In the upstream and midstream, chelating agents may be used for scale removal and mineral fouling prevention in pipes and equipment [4,5]. However, the most widespread use of chelating agents is the injection into wellbores and reservoirs to reach different aims, which include, but are not limited to [6]:
  • Scale removal;
  • Scale formation inhibition;
  • Iron control during acid treatments;
  • Hydraulic fracturing fluid additives;
  • Well stimulation;
  • Enhanced oil recovery (EOR).
The two latter operations are of particular interest for this work, because the eventual effectiveness of chelating agents for these jobs greatly depends on the oil/aqueous fluid interfacial tension (IFT).
Chelating agents’ application in well stimulation is based on their ability to dissolve rock minerals with the formation of highly conductive channels in carbonate reservoirs [7,8] or mitigating porous media damage in sandstone reservoirs [9]. The surface complexation mechanism was found to be the reason for the rock dissolution [10]. It was shown that the rock dissolution rate in chelating agents is order-of-magnitude lower than in acids such as HCl or HCl+HF, which are ordinarily used for well stimulation [11,12]. This property is especially important at high temperatures (>110 °C). In carbonates, this circumstance would result in the formation of longer and less branched channels with less volume of acid spent [7,13]. In sandstones, deeper acid penetration and cleaning capacity are ensured with the decrease of well stimulation fluid reaction rate. Moreover, chelating agents are usually compatible with crude oil [14], do not cause ferrous scale formation, and do not possess high corrosiveness towards metal [15,16] (some of the chelating agents may even act as corrosion inhibitors [17]). Chelating agents, such as ethylenediaminetetraacetic acid (EDTA), hydroxyethyldiaminetriacetic acid (HEDTA), glutamic diacetic acid (GLDA) and diethylenetrieminepentaacetic acid (DTPA), are studied in laboratories and used on fields nowadays.
It is necessary that well stimulation fluid should have the lowest possible IFT with reservoir oil, to ease its injection into the reservoir and its removal after the stimulation is complete [18]. For this reason, surfactants are often added to the acidic or chelating fluids [19].
The application of chelating agents as EOR chemicals has not gone beyond laboratory studies so far. However, a decrease of residual oil after chelates injection as tertiary recovery agents in sandstones and carbonates was proved in different laboratory studies [20,21]. It is believed that the reasons for enhanced oil displacement are IFT reduction and wettability alteration. Wettability alteration occurs because of metal ions leaching from the rock surface [22], which makes the surface more negative and decreases zeta potential. A decrease in zeta potential, in turn, means that the water film on the rock surface expands, which promotes oil desorption and recovery enhancement. Moreover, it is expected that the chelating agent would not be retained by the rock surface, which is common for surfactants.
However, IFT reduction in the case of chelating agent application is not as significant, as it is expected in surfactant flooding [23], although recent studies show that the effect of IFT reduction may be more important for EOR (at least for some reservoirs) than wettability alteration [24].
Therefore, the necessity to add surfactants to compositions of chelating agents is evident. There are some papers, mainly from the medical field, dedicated to the interactions between chelating agents and surfactants. Some medical papers describe the influence of EDTA–surfactant solutions on the dissolution of bile salts [25] and root dentin [26,27]. Some works consider solutions of chelating agents and surfactants to be prospective for soil remediation [28]. It was shown [29,30] that. at the presence of EDTA in concentrations near 10−2 M, the surface tension of anionic surfactants may decrease.
There are some papers considering simultaneous surfactants–chelating agents’ application in the oil industry. Janjua et al [31] studied the effect of 0.3% wt. viscoelastic surfactant (VES) erucamidopropyl sulfobetaine and 0.3% wt. DTPA on the IFT between aqueous solutions and crude oil, zeta potential alteration, and oil recovery. They found that injection of DTPA and VES may lead to an additional oil recovery of 9.46%. However, a difference in zeta potential alteration in cases of rock treatment with VES and VES-chelating agent was negligible, as well as IFT reduction (although, in both cases, its values were at the level of 10−1 mN/m).
The term “synergy between surfactants and chelating agents” was used in the paper by Deng et al. [32]. They found that the addition of GLDA, EDTA, and DTPA in concentrations 0.3–3% wt. to the erucamidopropyl betaine (0.3% wt.) enhanced the wettability alteration of the oil-wet Indiana limestone sample. For example, for the plain VES solution, the contact angle difference was near 20°, but, when 3.0% wt. DTPA was added, the difference became 100°. Some other works also dealt with the combined effect of surfactants–chelating agents’ wettability alteration of rocks [33,34].
Some kind of discrepancy is present in experimental results. In some cases, chelating agents decreased IFT values; in other cases, these stayed at the same level, which means that this question requires additional investigation. This can be problematic in itself, because of an infinite number of experiments being faced. It is almost impossible to study all the concentrations, types of chelating agents and surfactants, as well as all pH values, temperatures, salinities, and pressures. Moreover, every oil sample is unique, meaning every field requires its optimal composition.
IFT measurement results depend on the measurement conditions. The presence of impurities, proper temperature and pressure conditions, and method type can give different results, even for systems which seem to be the same. The technique of IFT measurement also determines equilibrium result [35]. The most common methods for the IFT methods are spinning drop and pendant drop, which are based on the measurement of oil drop geometrical properties in the centrifugal and gravitational force field, relatively. However, establishing temperature (especially higher than 100 °C) and pressure conditions is complicated. Finally, equilibrium IFT is never reached under reservoir conditions because of adsorption, dilution and other effects. Therefore, to select a surfactant for technological fluids, it is necessary to consider dynamic IFT values and IFT dependence on concentration [36].
A possible solution to select proper combinations may be computational chemistry methods. Molecular dynamics (MD) simulation is one of them. Ghasemi [37] reviewed its main features and applications for surfactant flooding. This method allows quantitative and qualitative assessment of surfactants’ behavior on the micro scale, and prediction of experimental effects. This field is actively developing [38,39], which means that calculations will be much faster and more accurate, allowing better screening of reagents for oil field chemistry.
There are a lack of studies which consider simultaneous application of chelating agents and surfactants and investigate their combined effects on the rock–fluid and fluid–fluid interfacial properties. However, these effects may be beneficial for the oil industry, as well stimulation and EOR effectiveness relies on these properties. Therefore, in this paper, we attempt to study interfacial boundary between the hydrocarbon phase and the chelating agent–surfactant solution by the means of experiment and MD. First, experimental IFT measurement was performed to understand the general behavior of IFT curves upon chelating agent addition to the solutions of anionic and cationic surfactants with the equal hydrocarbon chains. IFT curves displacement and CMC alteration upon chelating agent addition, as well as effectiveness and efficiency changes, are to be assessed with IFT experiments. To eliminate the influence of the temperature, pressure, water salinity and the presence of surfactants in crude oil and study bare oil–water–surfactant interface, IFT measurements were conducted at ambient conditions with normal octane. To explain observed effects, the system was reconstructed with all-atomic MD. Microscopic properties, i.e., density profiles, radial distribution functions and hydrogen bonding, are extracted to understand the main tendencies of macroscopic behavior. The data are used to substantiate experimental results. Workflow of the study is given in Figure S1. The combination of these methods allowed us to substantiate the existence of synergism between chelating agents and surfactants in terms of IFT reduction.

2. Materials and Methods

2.1. Materials

Disodium EDTA (99.2%), NaOH (99%), citric acid (99%), sodium dodecyl sulfate (SDS, 95.5%), and normal octane (reference grade) were purchased at Rushim, Moscow, Russia. Dodecyl ammonium bromide (DTAB) (98%) was purchased at Sigma-Aldrich (St. Louis, MO, USA). All the solutions were prepared in bi-distilled water. The structures of surfactants used in this work are shown in Figure 1.

2.2. Methods

2.2.1. Solutions Preparation

In a series of experiments, the chelating agent composition consisted of 0.4 M EDTA-Na2 and 0.05 M citric acid (CA). This composition has a pH value of 6.74. In our previous study [40] it was found that this composition possessed the best dissolution capacity toward carbonate rock. EDTA is a commonly accepted chelating agent in oil field chemistry [11], whereas citric acid is used to increase dissolution capacity of the chelating agent-based well stimulation fluid (the increase is about 10% at 120 °C and 2 MPa if compared with plain EDTA). The effect is believed to be based on the combination of surface complexation mechanism and proton attack, both of which are intrinsic for EDTA and citric acid. The solution was prepared as follows: 0.4 M EDTA-Na2, 0.4 M NaOH, and 0.05 M citric acid were loaded into a 1 L calibrated cylinder, and water was poured into it in such a way that the water level did not reach the mark (about 800 mL). The cylinder was heated in a water bath at 65 °C for 10 min and agitated manually until complete dissolution. A pre-calculated amount of 1% surfactant aqueous solution was then added, and the rest of the water was poured at the last stage. Solutions were left cooling overnight in closed flasks.
Plain solutions of surfactants were prepared by preparing 1% wt. surfactant water solution and adding the necessary amount of water to it.

2.2.2. IFT Measurement

The aqueous phase was poured into a cuvette, which was placed on the DataPhysics (Filderstadt, Germany) OCA 15Pro instrument for contact angle measurement and drop shape analysis. The syringe with a U-shaped needle was then filled with octane, and air bubbles were removed from the syringe and needle. The syringe was placed in a special holder under the piston. Interfacial tension was measured using “pendant drop” method and calculations were carried out according to the Young–Laplace fitting method. At least three parallel measurements were made. The temperature of the room was 25 °C.
Dynamic IFT value was expected to reach a plateau, considered to be an equilibrium IFT value, which was used in this work. However, in cases where the concentration of surfactant was 0.001%, stabilization required long periods. To eliminate IFT measurement artifacts related to drop evaporation, the first 500 s of the measurement were approximated with the Equation (1) using Origin 2021 [41].
γ = γ e + ( γ 0 γ e ) e t τ
where γ is the current IFT value, γ0 is the IFT at the zero point, γe is the equilibrium IFT, τ is the parameter related to the relaxation time, t is the time from the start of the measurement. Equilibrium IFT values (γe) were used in this work to compare equilibrium state in the simulation and experiments, which is a limitation of the study.

2.2.3. Simulation Details

All simulations were performed using BIOVIA Materials Studio 2017 software, utilizing Amorphous Cell and Forcite modules. MD simulation is based on the iterative calculations of the potentials and forces between atoms and molecules, with the subsequent calculation of particles’ positions. Calculations are performed with a set of constants and equations, describing interactions between atoms, which is called forcefield. COMPASS forcefield was used in this work as the method proved to be effective in works related to interfacial properties in surfactant-containing systems [42,43].
Four different systems were under investigation:
  • Water/octane/SDS;
  • Water+chelate/octane/SDS;
  • Water/octane/DTAB;
  • Water+chelate/octane/DTAB.
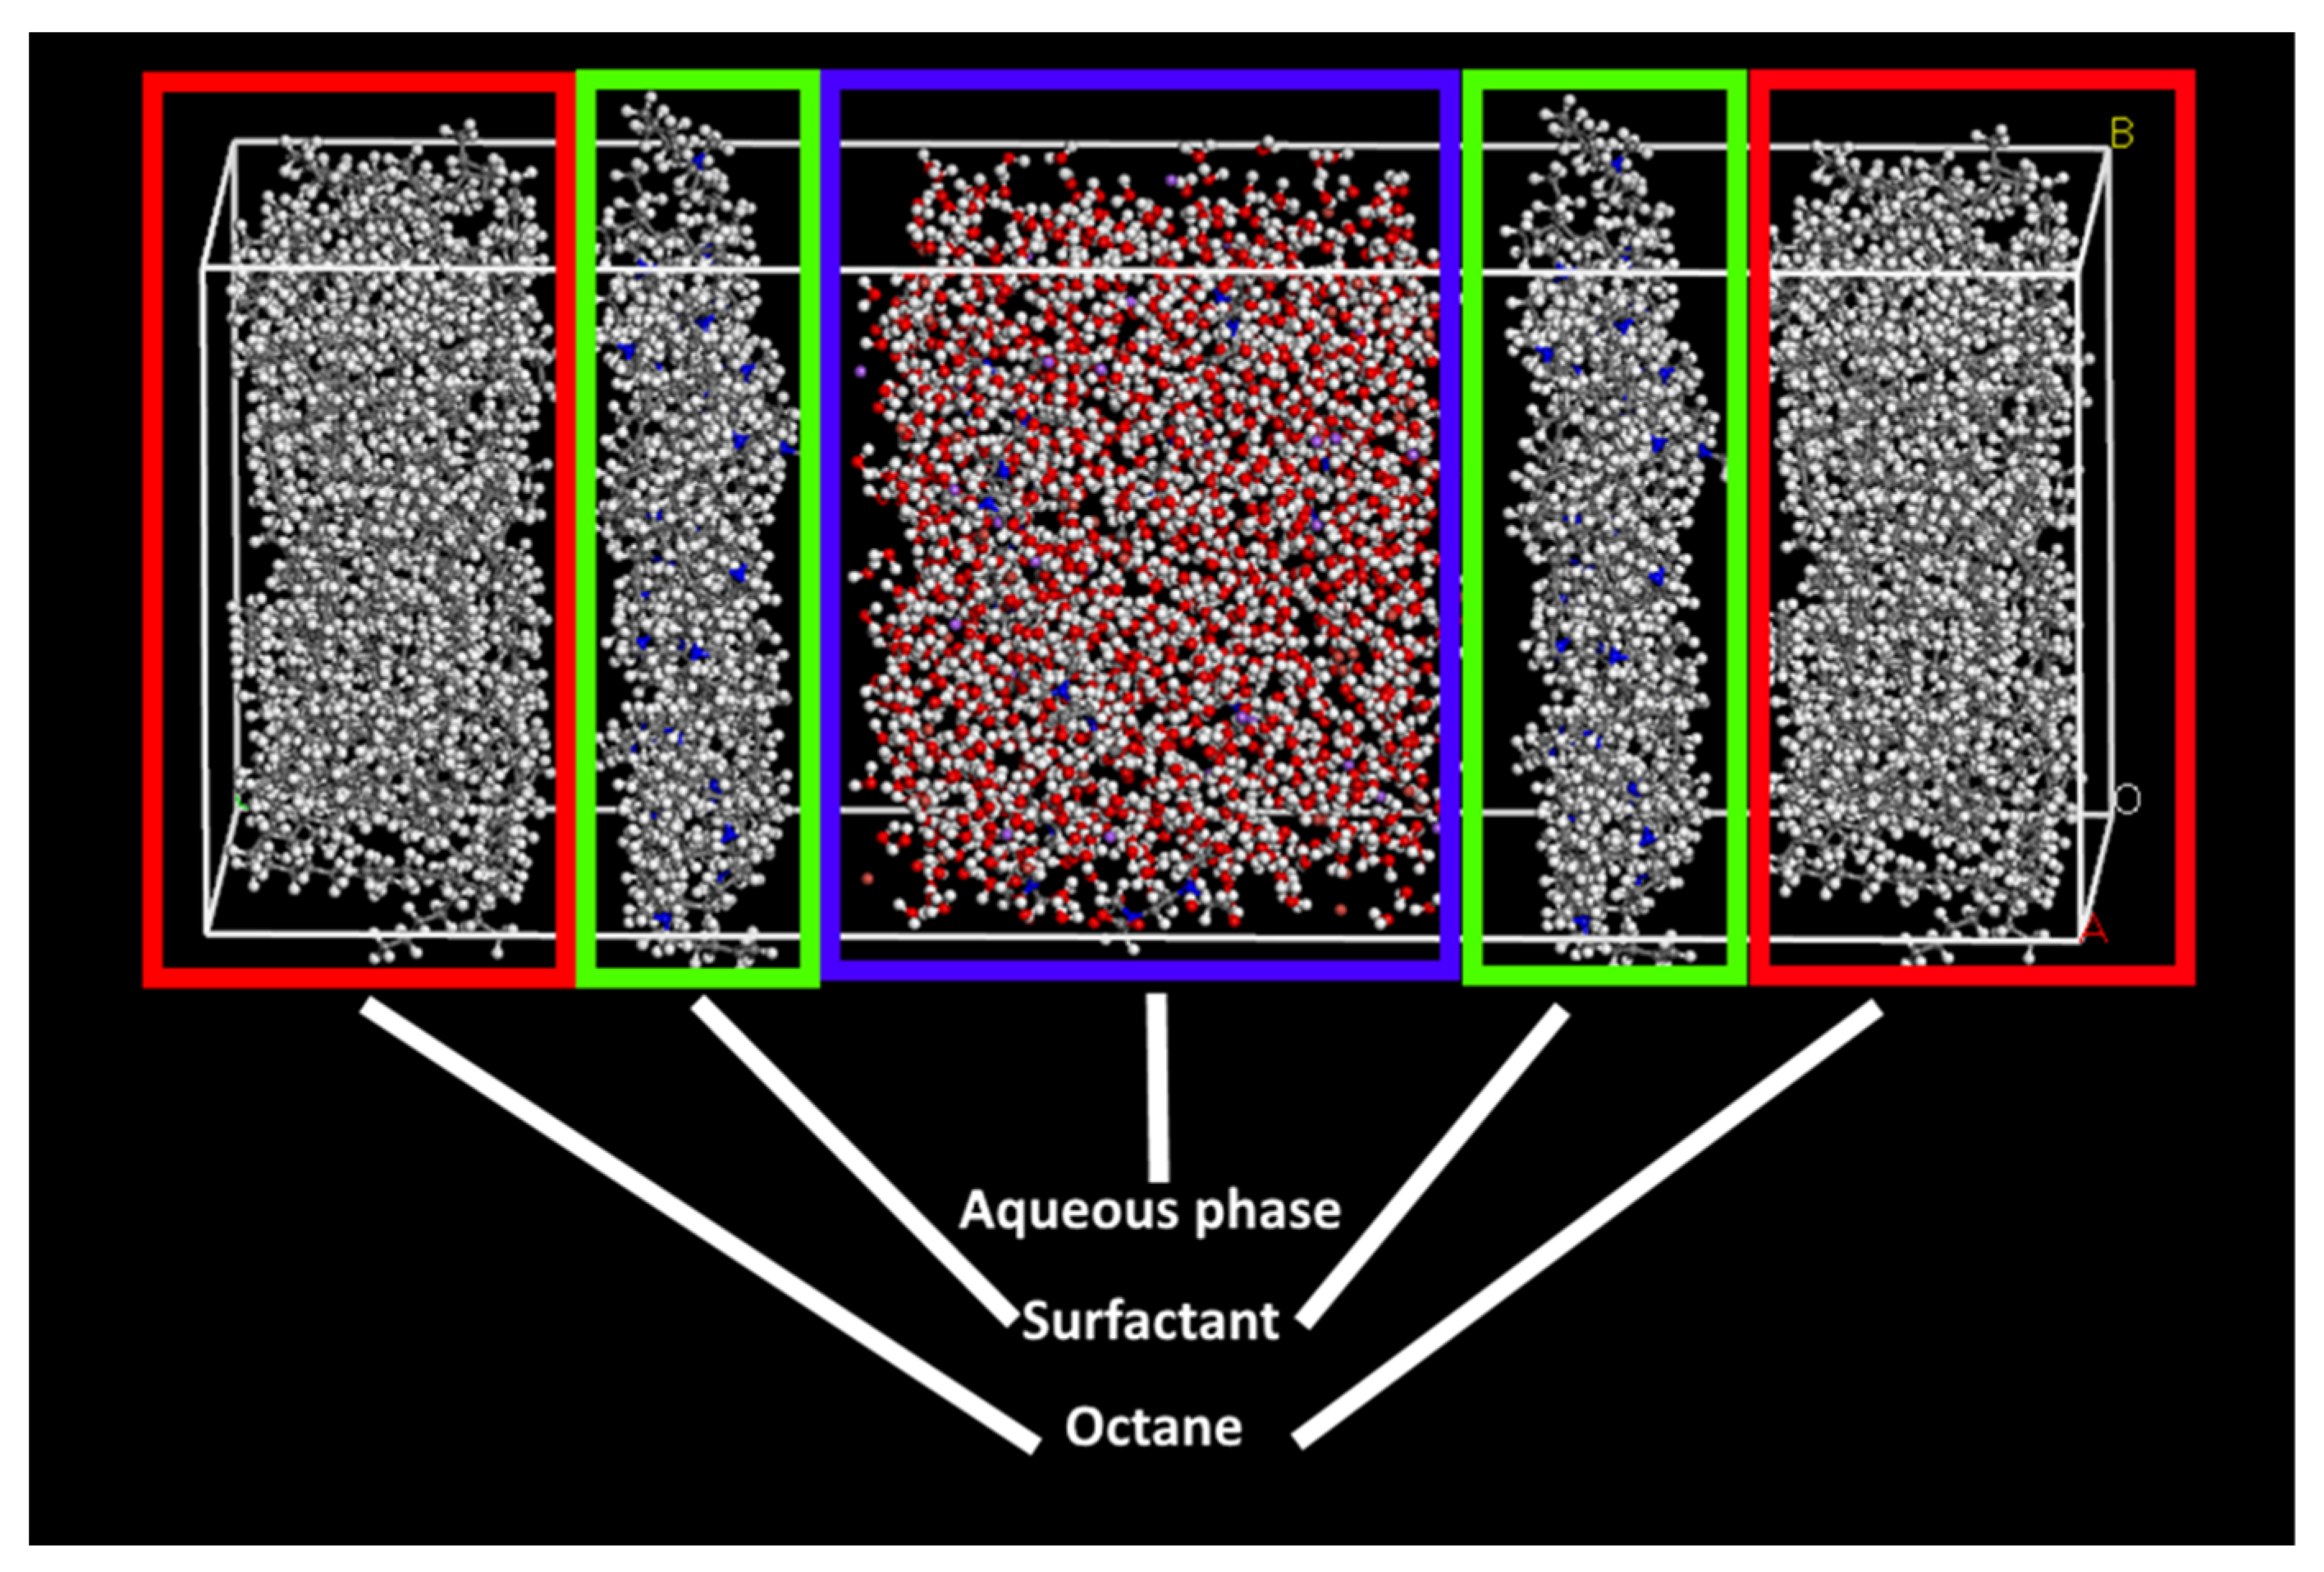
The compositions and dimensions of these systems are shown in Table 1. As surfactants dissociated to counter ion (Br or Na+) and organic part (“Surfactant”), they are given in Table 1 separately. An example of the initial system is shown in Figure 2. It should be noted that the dimensions of systems containing SDS and DTAB differ from each other. As was observed during the study, if the dimensions of DTAB systems are close to those of SDS systems, the bulk density of the aqueous phase would not be reached. This fact points to the insufficiency of simulations at these conditions.
All studied systems included two normal octane layers, one aqueous layer, and two layers of surfactant molecules. The octane layer included only n-octane molecules in all cases. The density of the layer during its construction was 0.702 g/cm3. The aqueous layer included water molecules and, if necessary, EDTA2− and EDTA3− in molar ratio 1:3 (according to EDTA species distribution at pH value 6.74), fully deprotonated CA, and counter-ions of EDTA, CA, and surfactant to ensure electrical neutrality of the system. If only water was used, then the density was 1.00 g/cm3; if chelate was added, then the density was 1.07 g/cm3. Each of the surfactants’ layers consisted of 36 molecules. This value was chosen because both SDS and DTAB occupy nearly 44–48 Å2 on the interphase in the monolayer [44,45]. We also studied reference systems, which included only aqueous and hydrocarbon phases.
Each layer was constructed separately. Geometrical optimization was performed for each layer, and they were combined with the subsequent geometrical optimization.
Simulations were carried out as follows. The first step was 200 ps NVT equilibration; the second step was 400 ps NPT equilibration. Then, main production run of 1 ns was carried out. The last 500 ps were used for analysis. Temperature was maintained at 298 K; a Nose–Hoover thermostat was used; Berendsen barostat for 1 atm was applied; the time step was 1.0 fs.

3. Results

3.1. IFT Measurement

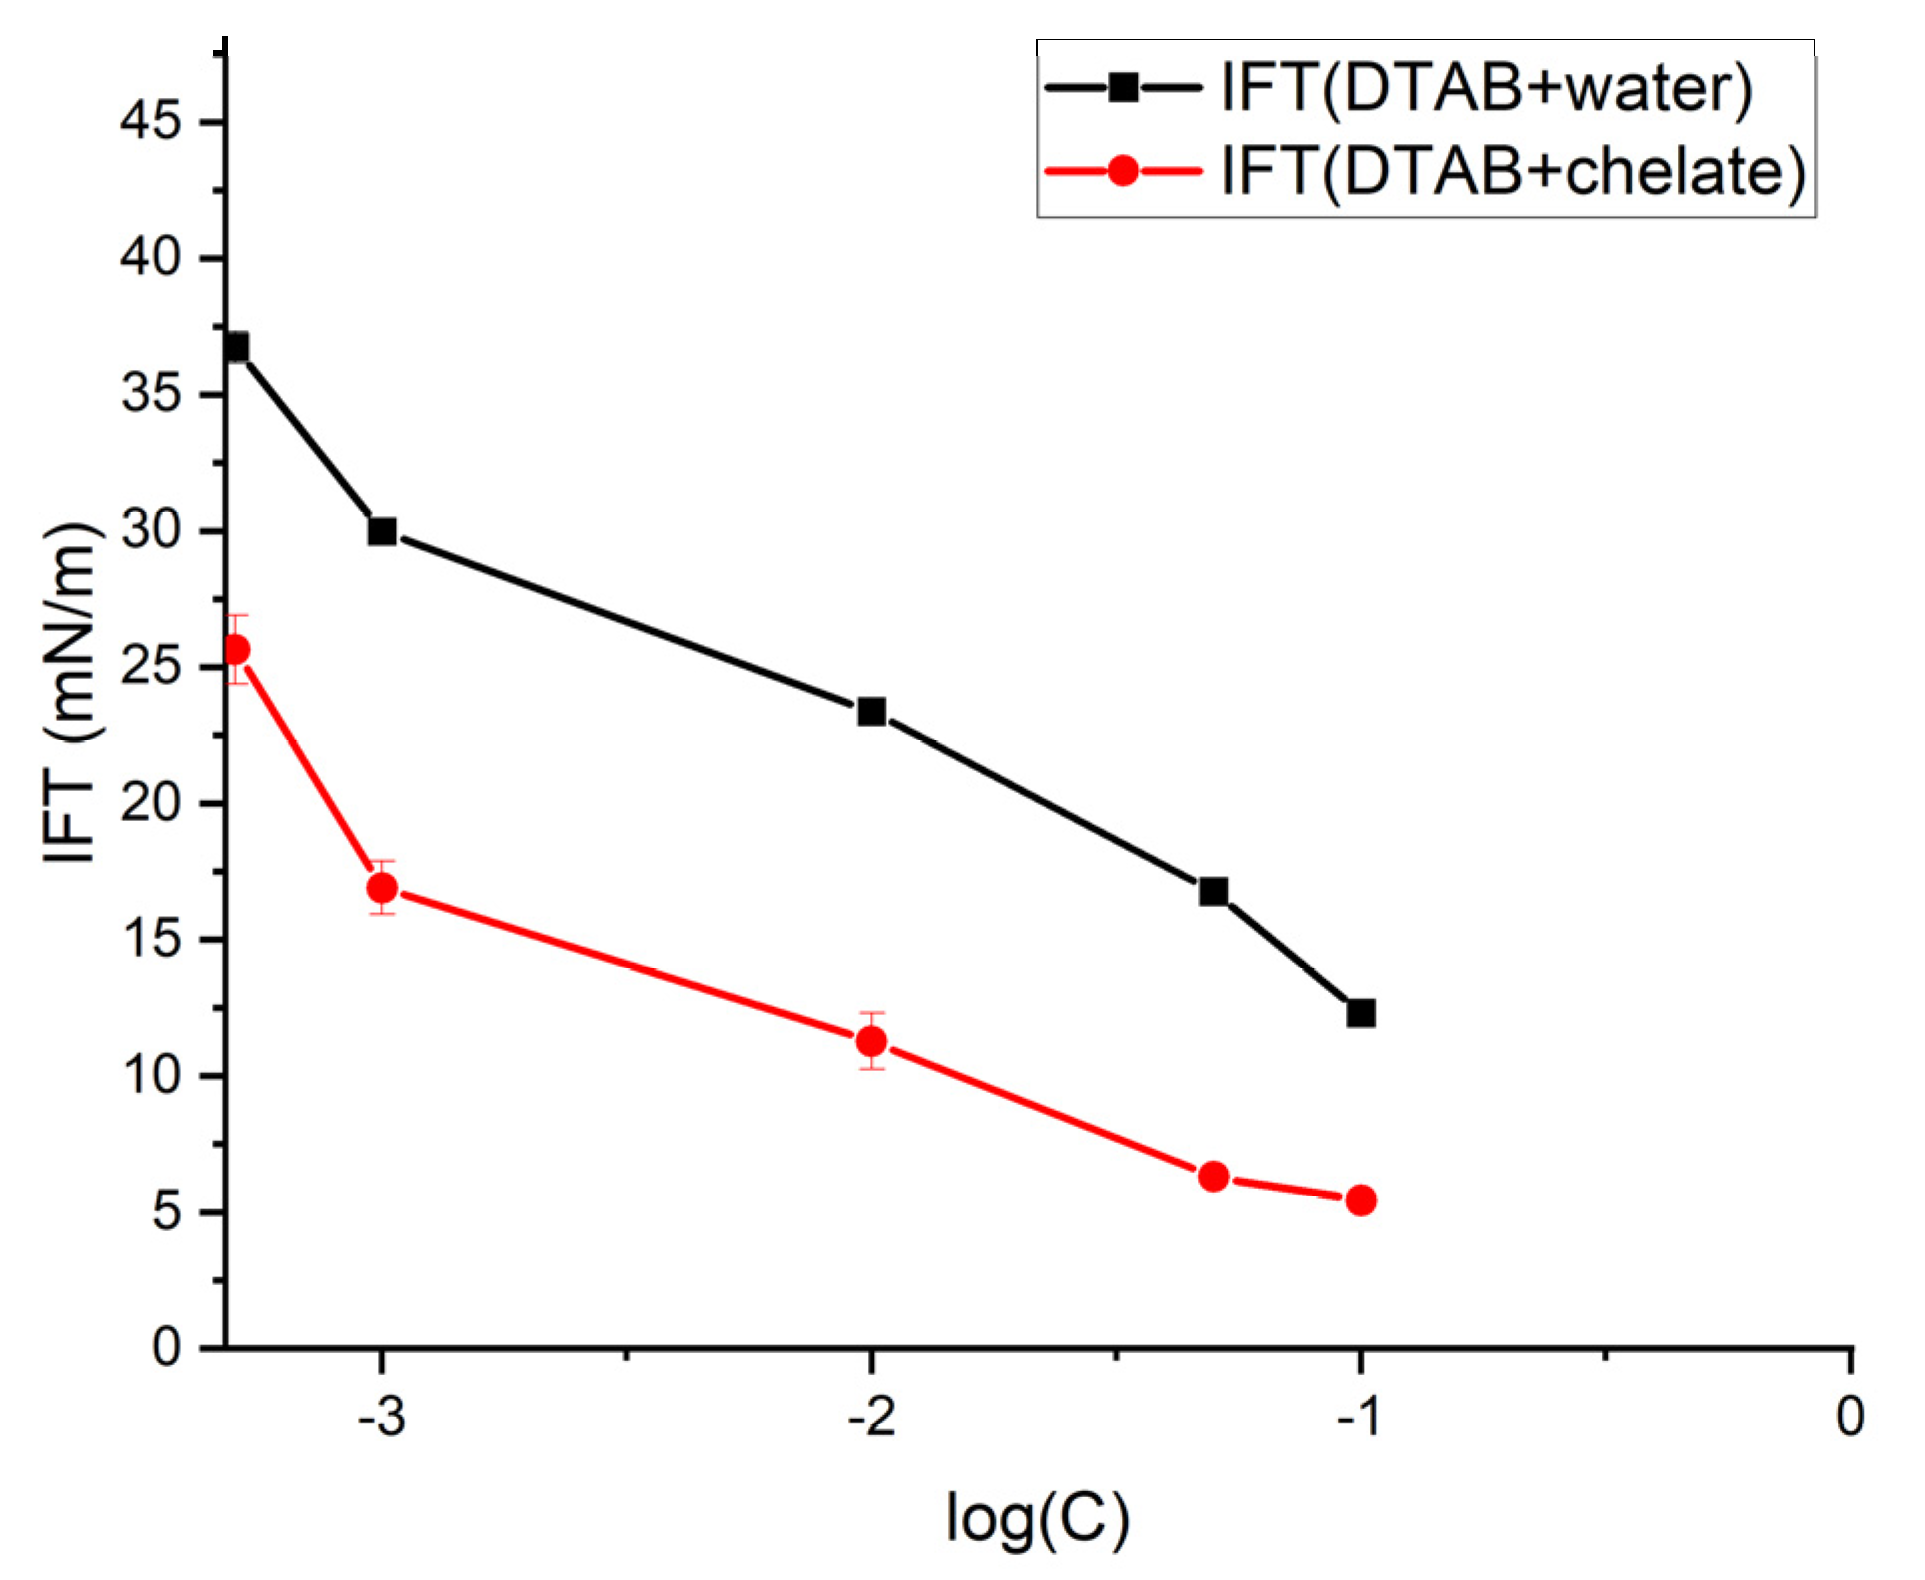
Figure 3 and Figure 4 show the results of IFT measurements in the systems with and without adding chelating composition. Studied concentrations were 0.001% wt., 0.01%wt., 0.05% wt., 0.1% wt. and 0.3% wt., as these were the most widely used in well stimulation jobs. IFT with reservoir oil under reservoir conditions is expected to be lower because of IFT decrease with temperature and salinity [46], and the presence of native surfactants (such as resins, asphaltenes, and naphtenic acids) in oil. The main tendencies of IFT curves should stay the same, as the nature of contacting phases does not change.
It should be noted that water/octane IFT was 36.74 ± 0.57 mN/m, and chelate/octane IFT was 25.64 ± 1.27 mN/m. It can be concluded that the chelating composition itself is a weak surfactant, which decreases IFT value. This is consistent with data shown by Eastoe [29] and Hassan [47]. Chelate/surfactant IFT is also lower than in the case of plain surfactant solutions. It cannot be explained by the additive properties of surfactant and EDTA, because IFT reduction is determined primarily by surfactant adsorption on the hydrocarbon–aqueous fluid interphase. It seems that the state of adsorbed surfactant changes when chelating agent is added. Therefore, to explain this effect, one should refer to the surfactant and chelate interactions in the bulk and on the interfacial boundary.
To study bulk interactions, the critical micelle concentrations (CMC) of surfactants in water and chelating composition were measured. To do it, IFT was measured at additional points. CMC was calculated based on the linear fitting of the IFT decrease region and plateau and finding the intersection point. Obtained results are shown in Figures S2 and S3 and Table 2.
There is a good consistency with previously published results, especially for DTAB. We also observe CMC decrease upon chelating agent addition. This fact points to the salting-out effect of EDTA, which means that it is a water structure promoter (according to Hoffmeister lyotropic series). Salting-out EDTA ions concentrate water molecules around themselves (“promote water structure”), which makes hydrocarbon chains’ presence in the water phase energetically unfavorable. This effect makes surfactant chains stick to each other, penetrate deeper into non-aqueous phase, and form micelles at a lower concentration than in distilled water [50].
EDTA also increases both the efficiency (concentration needed to reach a particular value of IFT) and effectiveness (IFT value at CMC) of the surfactants, which is also characteristic of water structure promoters. There may be two reasons for this effect. The first one is the high hydration degree of EDTA and (possibly) citric acid ions, which makes hydrophobic chains’ contacts with water energetically unfavorable and leads to the enhanced adhesion of the surfactants chains to each other and micelles formation. The second one is the screening of repulsion between head groups of surfactant molecules. There are negatively charged (-COO) and partially positively charged (tertiary N atom) groups in EDTA. Therefore, an attraction between EDTA (which is a weak surfactant) and surfactant molecules is expected, which mitigates repulsion between charged groups in the interfacial layer. However, these assumptions need to be proved by MD.

3.2. MD Results

MD simulation was carried out to substantiate experimental findings and study processes at the interfacial boundary. During this work, information about density profiles, hydrogen bonding, and radial distribution functions (RDFs) were used to study interfacial processes.

3.2.1. Density Profiles

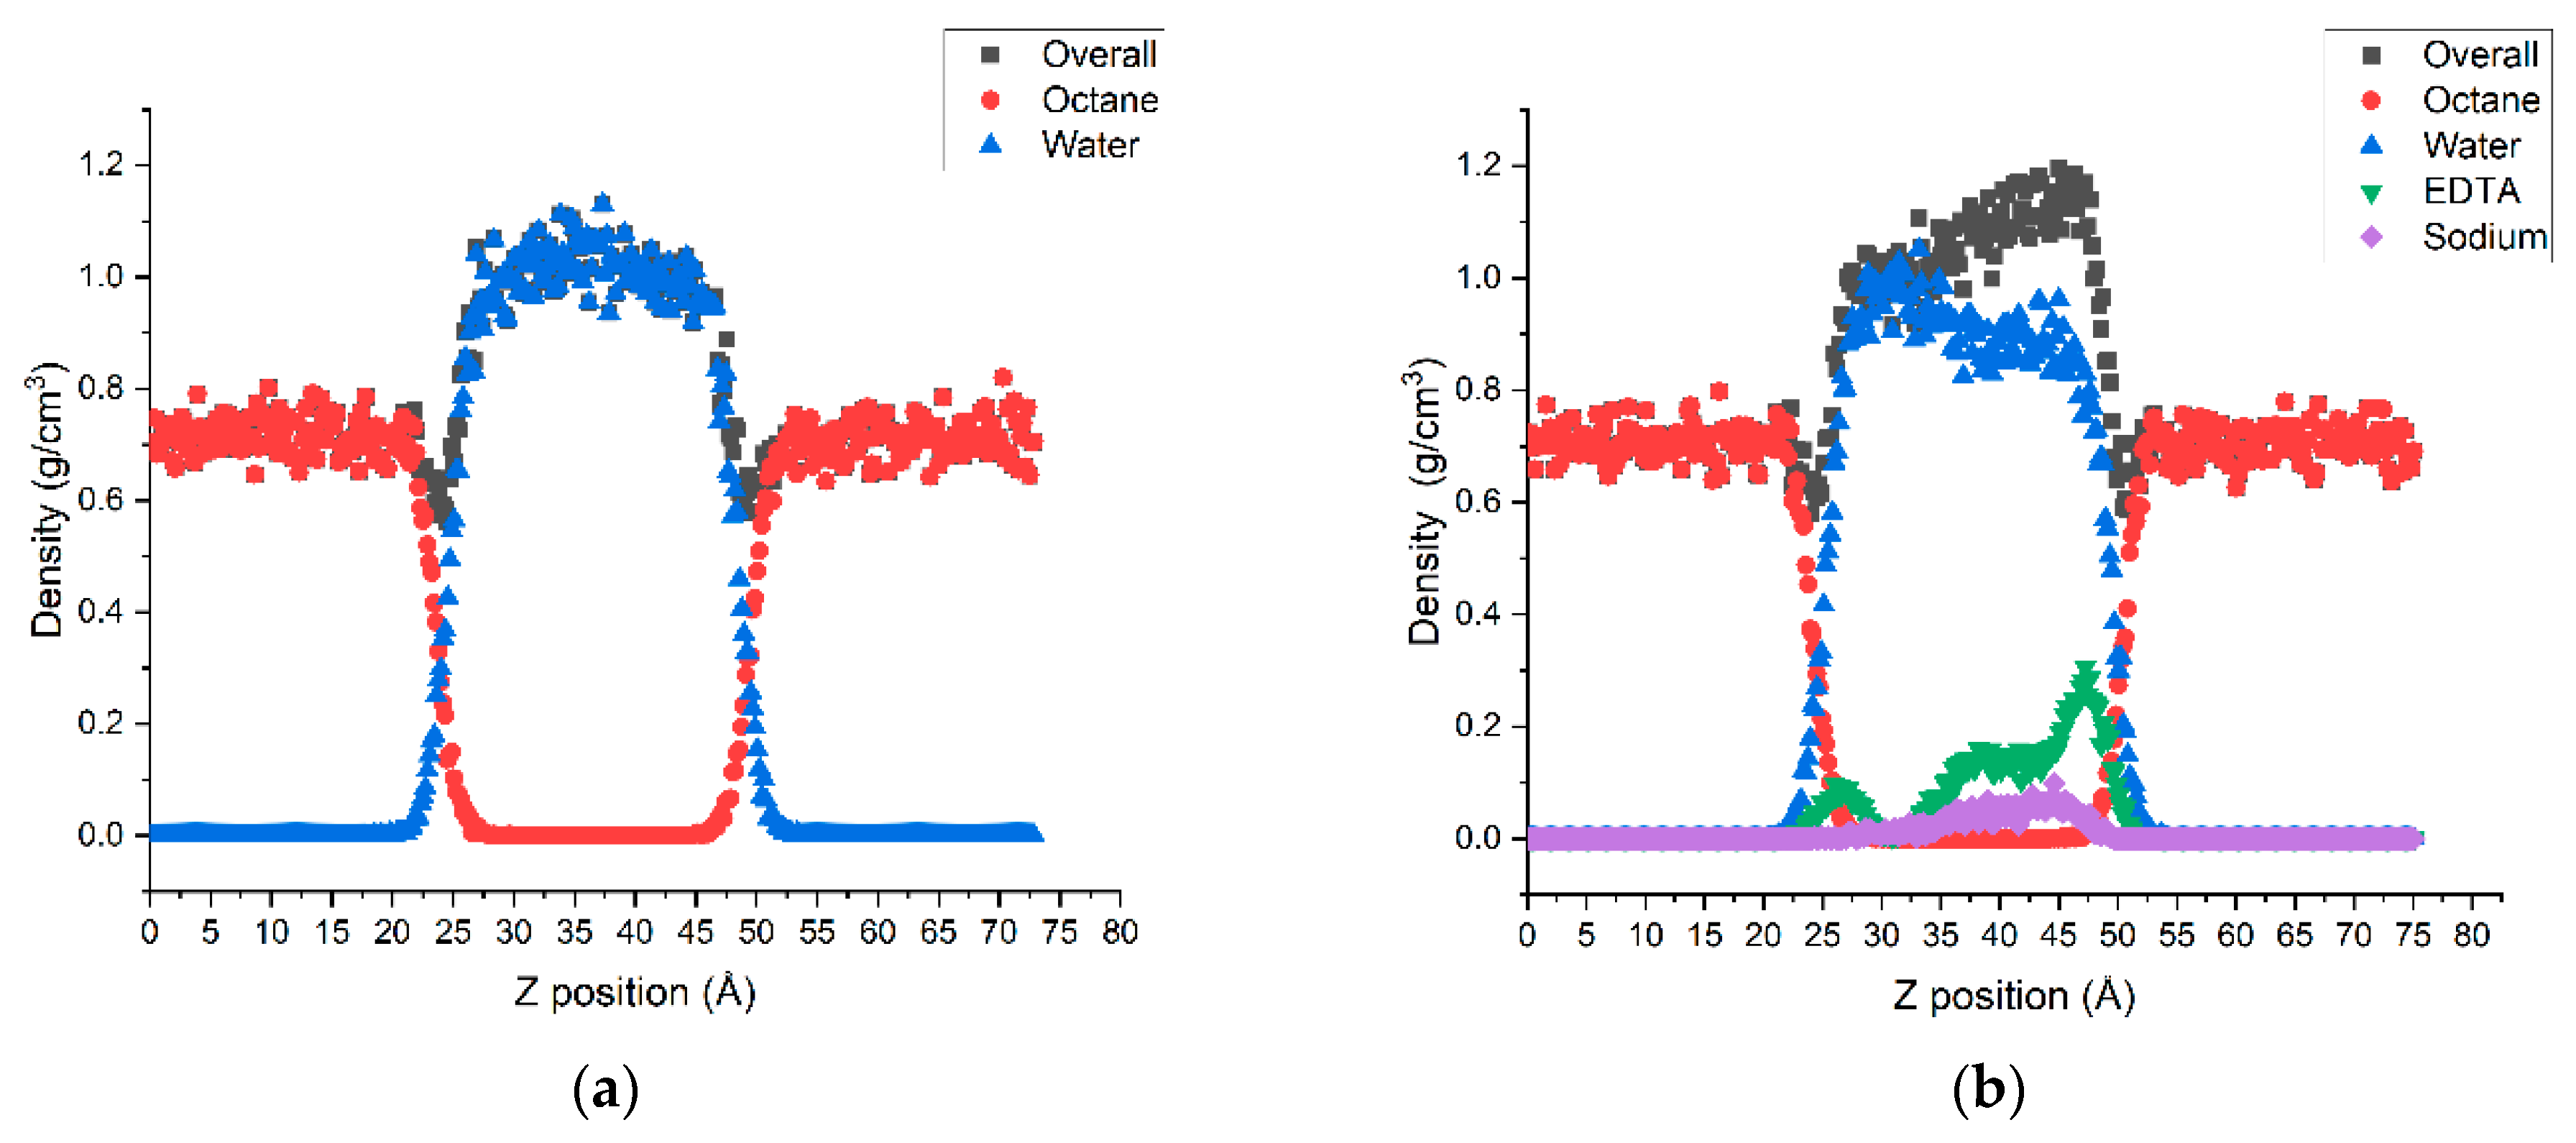
To study MD applicability for investigated systems and find spatial distribution of molecules, density profiles along Z-axis were analyzed. Density profiles for the reference systems without surfactants are shown in Figure 5.
It can be seen that both water and octane reach their bulk density. The average density of water is 1.00 g/cm3, the average density of octane is 0.706 g/cm3, and the average density of chelating composition is 1.06 g/cm3. These are close to a true density of water (0.99 g/cm3), octane (0.70 g/cm3), and chelating agent solution (1.07 g/cm3).
EDTA ions also concentrate near the interface (Figure 5, right). It means that EDTA shows positive adsorption at the water-hydrocarbon interface, which proves experimental results of EDTA’s surface activity properties. It is also proved by interfacial thickness values (IT), calculated with the “10–90 rule”. For the plain system, IT is 4.01 Å (which shows good consistency with previous results [51]), and for the system with chelating agents, IT is 4.22 Å. Different works show that, in systems of the same nature, higher IT value leads to lower IFT [52], which is true for studied systems too.
In the next stage, density profiles for systems with surfactant molecules were studied. Results are shown in Figure 6 and Figure 7.
The system with larger dimensions was used for DTAB than for the SDS case because MD in the system with smaller dimensions led to insufficient bulk density of water. It is caused by deeper penetration of cationic surfactant into the aqueous phase. If dimensions of DTAB-containing system are increased, at least one “water” point reached its bulk density in our study.
As evident, both surfactants concentrate at the water–hydrocarbon interphase and form an interfacial layer. In the case of SDS, sodium ions concentrate near surfactants’ head groups, which is due to mutual electrostatic attraction. In the case of DTAB, counter ions concentration is not evident. To elaborate on the role of chelating agents’ addition, IT was calculated with the “90–90 rule”, i.e., the difference in positions in which octane and water reach 90% of their bulk density. Results are shown in Table 3.
IT values after surfactant addition are much higher than in the cases of plain systems, indicating that IFT reduction is caused primarily by the adsorption of surfactants on the interphase. IT values are also increased upon chelating agent addition, which is consistent with lower IFT measurements. Therefore, the first reason behind IFT reduction is the increase in IT. However, IT values of DTAB are higher than of SDS, although IFT values of DTAB are higher, which points to some other mechanisms that determine IFT values for surfactant-containing systems.

3.2.2. Hydrogen Bonding

Calculation of hydrogen bonds in different systems containing chelating agents and surfactants may shed light on interactions between all the molecules present in the solution.
First, the number of hydrogen bonds was calculated only between water molecules in reference systems. As investigated systems contain a different number of water molecules, we calculated hydrogen bonds number per water molecule. In the plain water/octane system, this number is 1.85 ± 0.02; in the water-chelate/octane system, this number is 1.74 ± 0.02. Therefore, chelating agent addition breaks water structure in terms of hydrogen bonds. This behavior is typical [53] for true salting-out ions, such as Cl, and thus salting-out behavior can be expected for the chelating agent.
Then we calculated the number of hydrogen bonds per water or surfactant molecule for systems which contain surfactants. The data are shown in Table 4.
The trend of decreasing hydrogen bonds number upon the addition of chelating composition is preserved for both water and SDS molecules. There are no hydrogen bonds between DTAB and water, which may be explained by the surfactant structure: three methyl groups are present in the headgroup, which creates a steric hindrance for water approaching nitrogen atom. Headgroups of SDS become less hydrated after chelating agent addition. This may be explained by the high hydration of EDTA, which binds water molecules, making them unavailable for the hydration of surfactant hydrophilic groups.

3.2.3. RDF

RDF is a useful tool to study interactions between molecules on the microscopic scale. Mathematically, RDF is a function, showing the probability to find a certain atom at a certain distance r from the other certain atom.
First, RDF was calculated between polar atoms in surfactant headgroups (OSDS and NDTAB), and oxygen atoms in water (Ow). The results are presented in Figure 8.
For SDS, the first sharp peak is located at 2.38 Å, which is close to the length of the hydrogen bond between the headgroup and the first hydration shell [54]. However, the height of the first peak is decreased upon the addition of a chelating agent, which is also consistent with the postulated decrease of surfactant hydration from the hydrogen bonds calculation. For DTAB, the first peak occurs at nearly 4.35–4.65 Å, which is also consistent with previous studies [55]. Such a high distance between the nitrogen atom and water molecule is also a reason for the absence of hydrogen bonds between surfactant and water. However, in this case, we can see the decrease in RDF between surfactant and water upon the addition of the chelating agent again.
A decrease in surfactant headgroups hydration would make them approach each other, so closer packing in the monolayer would be expected. Therefore, more molecules may adsorb at the interface, leading to a lower IFT value. This statement can be proved by RDFs between sulfur in SDS (SSDS-SSDS) and nitrogen in DTAB (NDTAB-NDTAB) (Figure 9).
RDFs plots show that adjacent surfactant atoms can be found at a lower distance if a chelating agent is added, which proves the hypothesis of monolayer packing enhancement. At the same time, the DTAB monolayer is generally looser than the SDS monolayer; therefore, the reason for higher IFT values of DTAB solutions may be poorer adsorption. Nevertheless, the tendency towards closer packing upon the addition of chelating agent stays the same.
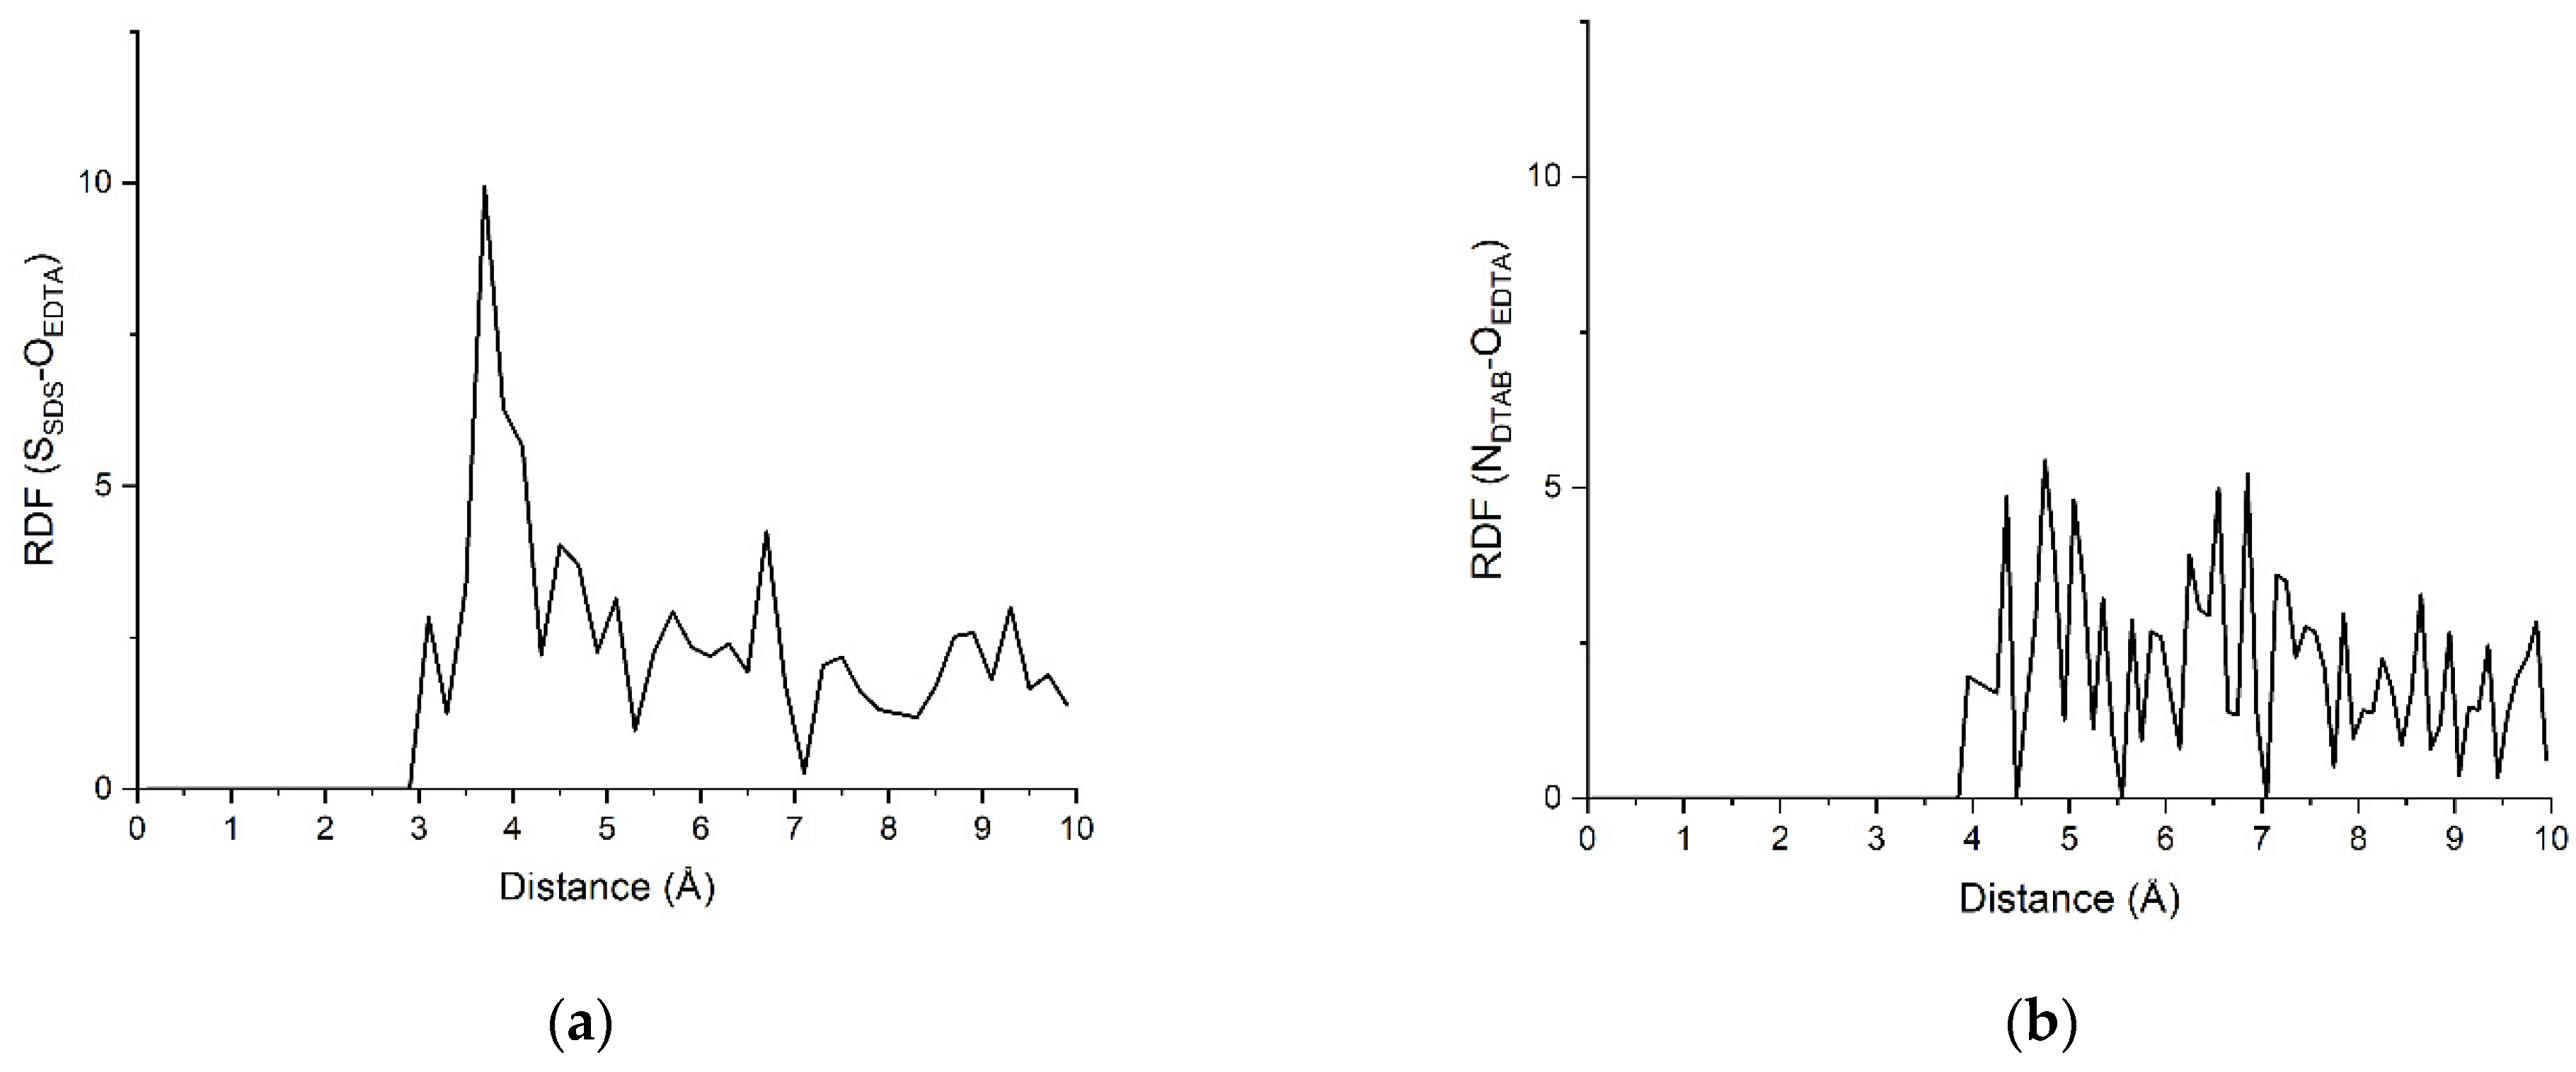
At least for SDS, the reason for this phenomenon may be the electrostatic interaction between surfactant and chelate. Charged or partially charged heteroatoms are present in both surfactants, which is also true for EDTA. RDFs between SSDS-OEDTA for SDS and NDTAB-OEDTA for DTAB were plotted to find the reason for this interaction (Figure 10).
The plots are completely different. The existence of a high peak for SSDS-OEDTA RDF proves that these compounds attract each other. Therefore, the IT of the system is increased, repulsion between headgroups decreases additionally because of electrostatic screening, and SDS molecules do not penetrate deeper into the hydrocarbon phase because EDTA molecules keep them near the interface. However, that is not the case for DTAB, as the plot looks even and the probability to find EDTA molecule is nearly equal at any distance higher than 4 Å. Surfactant–chelate interaction does not exist in this case; however, salting-out effects still take place and result in a decrease in IFT.

4. Conclusions

Experimental IFT measurements and MD simulations were employed to investigate chelate–surfactant interactions in the bulk and at the interphase with hydrocarbon. The chelating agent composition was composed of 0.4 M EDTA and 0.05 M citric acid (pH = 6.74) and can be used as a well stimulation fluid. It was established that this composition itself possessed weak surface-active properties. We found experimentally that the addition of the chelating agent decreased IFT between SDS/DTAB and normal octane. Moreover, its addition led to the decrease of surfactants’ CMC and enhanced its effectiveness.
The reasons for such behavior were elaborated with all-atomic MD simulations. According to density profiles, EDTA concentrated near the interphase, leading to higher interfacial thickness. Higher interfacial thickness was also observed for surfactant-containing systems, when the chelating composition was added. EDTA also broke hydrogen bonding between water molecules and between water and surfactant molecules. Therefore, this chelating agent can be described as a salting-out compound. Decrease of surfactants hydration and monolayer packing enhancement by electrostatic repulsion were proved by RDF calculation. Additionally, we found that the chelating agent and SDS attracted to each other which enhanced surfactant adsorption and led to a lower IFT value.
Chelating agents-based well stimulation fluids may be modified by the addition of surfactants to lower IFT to promote better liquid flow into the reservoir and from it. Although this work was concentrated on model surfactants and hydrocarbon fluids and all the experiments were performed at ambient conditions, even lower IFT values under reservoir conditions are expected.

Supplementary Materials

The following supporting information can be downloaded at: https://www.mdpi.com/article/10.3390/en16041679/s1, Figure S1: Workflow of the study; Figure S2: CMC calculation for SDS in water (a) and SDS in chelating agent (b); Figure S3: CMC calculation of DTAB in water (a) and DTAB in chelating agent (b).

Author Contributions

Conceptualization: T.I.Y., L.F.D., L.A.M. and M.A.S.; Data Curation: T.I.Y. and L.F.D.; Funding: Acquisition: L.A.M. and M.A.S.; Investigation: T.I.Y. and L.F.D.; Methodology: L.F.D. and L.A.M.; Software: T.I.Y.; Validation: T.I.Y. and L.F.D.; Visualization: T.I.Y.; Writing—orginal draft: T.I.Y.; Writing—review and editing: T.I.Y., L.F.D., L.A.M. and M.A.S. All authors have read and agreed to the published version of the manuscript.

Funding

This work was supported by the Ministry of Science and Higher Education of the Russian Federation under agreement №075-15-2022-300 dated 18 April 2022 within the framework of the development program for a world-class Research Centre “Efficient development of the global liquid hydrocarbon reserves.

Institutional Review Board Statement

Not applicable.

Informed Consent Statement

Not applicable.

Conflicts of Interest

The authors declare no conflict of interest.

References

  1. Kołodyńska, D. Complexing Agents. In Kirk-Othmer Encyclopedia of Chemical Technology, 5th ed.; John Wiley and Sons: Hoboken, NJ, USA, 2019; pp. 1–26. [Google Scholar]
  2. Kołodyńska, D. The Effect of the Novel Complexing Agent in Removal of Heavy Metal Ions from Waters and Waste Waters. Chem. Eng. J. 2010, 165, 835–845. [Google Scholar] [CrossRef]
  3. Leštan, D.; Luo, C.-l.; Li, X.-d. The Use of Chelating Agents in the Remediation of Metal-Contaminated Soils: A Review. Environ. Pollut. 2008, 153, 3–13. [Google Scholar] [CrossRef] [PubMed]
  4. Abdul-Latif, N.A.; Al-Madfai, S.H.F.; Ghanim, A.N. Removal of Scale Deposited on Heat-Transfer Surfaces Using Chemical Methods. Ind. Eng. Chem. Res. 1988, 27, 1548–1551. [Google Scholar] [CrossRef]
  5. Teng, K.H.; Amiri, A.; Kazi, S.N.; Bakar, M.A.; Chew, B.T.; Al-Shamma’a, A.; Shaw, A. Retardation of Heat Exchanger Surfaces Mineral Fouling by Water-Based Diethylenetriamine Pentaacetate-Treated CNT Nanofluids. Appl. Therm. Eng. 2017, 110, 495–503. [Google Scholar] [CrossRef]
  6. Hassan, A.; Mahmoud, M.; Bageri, B.S.; Aljawad, M.S.; Kamal, M.S.; Barri, A.A.; Hussein, I.A. Applications of Chelating Agents in the Upstream Oil and Gas Industry: A Review. Energy Fuels 2020, 34, 15593–15613. [Google Scholar] [CrossRef]
  7. Fredd, C.N.; Scott Fogler, H. Influence of Transport and Reaction on Wormhole Formation in Porous Media. AIChE J. 1998, 44, 1933–1949. [Google Scholar] [CrossRef]
  8. Shafiq, M.U.; Ben Mahmud, H.K.; Ghasemi, M. Integrated Mineral Analysis of Sandstone and Dolomite Formations Using Different Chelating Agents during Matrix Acidizing. Petroleum 2019, 5, 67–76. [Google Scholar] [CrossRef]
  9. Mahmoud, M. Reaction of Chelating Agents and Catalyst with Sandstone Minerals During Matrix Acid Treatment. Arab. J. Sci. Eng. 2018, 43, 5745–5756. [Google Scholar] [CrossRef]
  10. Fredd, C.N.; Fogler, H.S. The Influence of Chelating Agents on the Kinetics of Calcite Dissolution. J. Colloid Interface Sci. 1998, 204, 187–197. [Google Scholar] [CrossRef]
  11. Fredd, C.N.; Fogler, H.S. Alternative Stimulation Fluids and Their Impact on Carbonate Acidizing. SPE J. 1998, 3, 34–40. [Google Scholar] [CrossRef]
  12. Frenier, W.; Brady, M.; Al-Harthy, S.; Arangath, R.; Chan, K.S.; Flamant, N.; Samuel, M. Hot Oil and Gas Wells Can Be Stimulated without Acids. In Proceedings of the SPE International Formation Damage Control Symposium, Lafayette, LA, USA, 18–20 February 2004. [Google Scholar]
  13. Huang, T.; McElfresh, P.M.; Gabrysch, A.D. Carbonate Matrix Acidizing Fluids at High Temperatures: Acetic Acid, Chelating Agents or Long-Chained Carboxylic Acids? In Proceedings of the SPE European Formation Damage Conference, Hague, The Netherlands, 13–14 May 2003. [Google Scholar]
  14. Panait, E.; Isac, C.; Marton, C.; Dos Santos, A.; Girardi, S. Effective Matrix Acidizing Based in Chelating Agents: A Case Study in Romanian Heavy Oil Reservoirs. In Proceedings of the SPE International Heavy Oil Conference and Exhibition, Kuwait City, Kuwait, 12 December 2018. [Google Scholar]
  15. Ng, J.H.; Almubarak, T.; Nasr-El-Din, H.A. Low-Carbon-Steel Corrosion at High Temperatures by Aminopolycarboxylic Acids. SPE Prod. Oper. 2018, 33, 131–144. [Google Scholar] [CrossRef]
  16. Almubarak, T.; Ng, J.H.; Nasr-El-Din, H. A Review of the Corrosivity & Degradability of Aminopolycarboxylic Acids. In Proceedings of the Annual Offshore Technology Conference, Houston, TX, USA, 1–4 May 2017. [Google Scholar]
  17. Kavipriya, K.; Rajendran, S.; Sathiyabama, J.; Suriya Prabha, A. A Critical Review of Corrosion Inhibition by Phosphonic Acids. Eur. Chem. Bull. 2012, 1, 366–374. [Google Scholar]
  18. Nasr-El-Din, H.A.; Al-Othman, A.M.; Taylor, K.C.; Al-Ghamdi, A.H. Surface Tension of HCl-Based Stimulation Fluids at High Temperatures. J. Pet. Sci. Eng. 2004, 43, 57–73. [Google Scholar] [CrossRef]
  19. Silin, M.A.; Magadova, L.A.; Tolstykh, L.I.; Davletshina, L.F.; Vlasova, V.D.; Yunusov, T.I.; Makarova, A.M. Aspects of Interaction of Surfactant—Acid Compositions at Phase Boundary with Hydrocarbons. Russ. J. Appl. Chem. 2019, 92, 1810–1819. [Google Scholar] [CrossRef]
  20. Mahmoud, M.; Attia, M.; Al-Hashim, H. EDTA Chelating Agent/Seawater Solution as Enhanced Oil Recovery Fluid for Sandstone Reservoirs. J. Pet. Sci. Eng. 2017, 152, 275–283. [Google Scholar] [CrossRef]
  21. Nasr El-Din Mahmoud, M.A.; Abdelgawad, K.Z. Chelating-Agent Enhanced Oil Recovery for Sandstone and Carbonate Reservoirs. SPE J. 2015, 20, 483–495. [Google Scholar] [CrossRef]
  22. Hassan, A.M.; Al-Hashim, H.S. Surface Charge Study of EDTA Interaction with Carbonate Rock during Chelating Agent Flooding. J. Pet. Sci. Eng. 2020, 191, 107163. [Google Scholar] [CrossRef]
  23. Kamal, M.S.; Hussein, I.A.; Sultan, A.S. Review on Surfactant Flooding: Phase Behavior, Retention, IFT, and Field Applications. Energy and Fuels 2017, 31, 7701–7720. [Google Scholar] [CrossRef]
  24. Zhang, Z.; Azad, M.S.; Trivedi, J.J. IFT or Wettability Alteration: What Is More Important for Oil Recovery in Oil-Wet Formation? Fuel 2021, 291, 119986. [Google Scholar] [CrossRef]
  25. Tatsumoto, N.; Fujii, S. The Effect of Ultrasonic Waves on the Chemical Dissolution of Calcium Salts: Urinary Stone and Gypsum. J. Acoust. Soc. Japan 1985, 5, 105–112. [Google Scholar] [CrossRef]
  26. Akcay, I.; Sen, B.H. The Effect of Surfactant Addition to EDTA on Microhardness of Root Dentin. J. Endod. 2012, 38, 704–707. [Google Scholar] [CrossRef] [PubMed]
  27. Güzel, C.; Uzunoglu, E.; Dogan Buzoglu, H. Effect of Low–Surface Tension EDTA Solutions on the Bond Strength of Resin-Based Sealer to Young and Old Root Canal Dentin. J. Endod. 2018, 44, 485–488. [Google Scholar] [CrossRef] [PubMed]
  28. Garcia-Blas, N.; Jimenez-Relinque, E.; Castellote, M. Surfactants in Electrokinetic Remediation of Sediments to Enhance the Removal of Metals. J. Soils Sediments 2022, 22, 2853–2864. [Google Scholar] [CrossRef]
  29. Eastoe, J.; Dalton, J.S. Dynamic Surface Tension and Adsorption Mechanisms of Surfactants at the Air-Water Interface. Adv. Colloid Interface Sci. 2000, 85, 103–144. [Google Scholar] [CrossRef] [PubMed]
  30. Li, Z.X.; Lu, J.R.; Thomas, R.K. Neutron Reflectivity Studies of the Adsorption of Aerosol-OT at the Air/Water Interface: The Surface Excess. Langmuir 1997, 13, 3681–3685. [Google Scholar] [CrossRef]
  31. Janjua, A.N.; Sultan, A.S.; Saikia, T.; Kamal, M.S.; Mahmoud, M. Experimental Investigation of Noble Viscoelastic Surfactant and Chelating Agent for Heavy Oil Enhanced Oil Recovery in High-Pressure–High-Temperature Carbonate Reservoirs. J. Surfactants Deterg. 2021, 24, 289–300. [Google Scholar] [CrossRef]
  32. Deng, X.; Patil, S.; Kamal, M.S.; Mahmoud, M.; Sultan, A.; Saikia, T. Wettability Alteration of Carbonate Rock by Chelating Agents and Viscoelastic Surfactants: Synergetic Impact. Energy Fuels 2022, 36, 7391–7401. [Google Scholar] [CrossRef]
  33. Chen, P.; Mohanty, K.K. Wettability Alteration in High Temperature Carbonate Reservoirs. In Proceedings of the 18th SPE Improved Oil Recovery Symposium, Tulsa, OK, USA, 12–16 April 2014. [Google Scholar]
  34. Chen, P.; Mohanty, K.K. Surfactant-Mediated Spontaneous Imbibition in Carbonate Rocks at Harsh Reservoir Conditions. SPE J. 2013, 18, 124–133. [Google Scholar] [CrossRef]
  35. Yeung, A.; Dabros, T.; Masliyah, J. Does Equilibrium Interfacial Tension Depend on Method of Measurement? J. Colloid Interface Sci. 1998, 208, 241–247. [Google Scholar] [CrossRef]
  36. Mirchi, V.; Saraji, S.; Akbarabadi, M.; Goual, L.; Piri, M. A Systematic Study on the Impact of Surfactant Chain Length on Dynamic Interfacial Properties in Porous Media: Implications for Enhanced Oil Recovery. Ind. Eng. Chem. Res. 2017, 56, 13677–13695. [Google Scholar] [CrossRef]
  37. Ghasemi, M.; Shafiei, A.; Foroozesh, J. A Systematic and Critical Review of Application of Molecular Dynamics Simulation in Low Salinity Water Injection. Adv. Colloid Interface Sci. 2022, 300, 102594. [Google Scholar] [CrossRef]
  38. Alonso, G.; Gamallo, P.; Mejía, A.; Sayós, R. Assessing Salt-Surfactant Synergistic Effects on Interfacial Tension from Molecular Dynamics Simulations. J. Mol. Liq. 2020, 299, 112223. [Google Scholar] [CrossRef]
  39. Kopanichuk, I.; Scerbacova, A.; Ivanova, A.; Cheremisin, A.; Vishnyakov, A. The Effect of the Molecular Structure of Alkyl Ether Carboxylate Surfactants on the Oil-Water Interfacial Tension. J. Mol. Liq. 2022, 360, 119525. [Google Scholar] [CrossRef]
  40. Silin, M.A.; Magadova, L.A.; Davletshina, L.F.; Yunusov, T.I.; Mikulov, V.A. Experimental and Theoretical Study of Carbonate Rocks Dissolution in Chelating Reagents. Proc. Gubkin Univ. 2022, 307, 20–36. [Google Scholar] [CrossRef]
  41. Kumar, B. Effect of Salinity on the Interfacial Tension of Model and Crude Oil Systems. Master’s Thesis, University of Calgary, Calgary, AB, Canada, 2012. [Google Scholar]
  42. Ahmadi, M.; Chen, Z. Comprehensive Molecular Scale Modeling of Anionic Surfactant-Asphaltene Interactions. Fuel 2021, 288, 119729. [Google Scholar] [CrossRef]
  43. Ahmadi, M.; Chen, Z. Insight into the Interfacial Behavior of Surfactants and Asphaltenes: Molecular Dynamics Simulation Study. Energy Fuels 2020, 34, 13536–13551. [Google Scholar] [CrossRef]
  44. Domínguez, H.; Rivera, M. Mixtures of Sodium Dodecyl Sulfate/Dodecanol at the Air/Water Interface by Computer Simulations. Langmuir 2005, 21, 7257–7262. [Google Scholar] [CrossRef]
  45. Lyttle, D.J.; Lu, J.R.; Su, T.J.; Thomas, R.K.; Penfold, J. Structure of a Dodecyltrimethylammonium Bromide Layer at the Air/Water Interface Determined by Neutron Reflection: Comparison of the Monolayer Structure of Cationic Surfactants with Different Chain Lengths. Langmuir 1995, 11, 1001–1008. [Google Scholar] [CrossRef]
  46. Karnanda, W.; Benzagouta, M.S.; AlQoraishi, A.; Amro, M.M. Effect of temperature, pressure, salinity, and surfactant concentration on IFT for surfactant flooding optimization. Arab. J. Geosci. 2013, 6, 3535–3544. [Google Scholar] [CrossRef]
  47. Hassan, A.; Mahmoud, M.; Patil, S. Impact of Chelating Agent Salt Type on the Enhanced Oil Recovery from Carbonate and Sandstone Reservoirs. Appl. Sci. 2021, 11, 7109. [Google Scholar] [CrossRef]
  48. Khan, A.M.; Shah, S.S. Determination of Critical Micelle Concentration of Sodium Dodecyl Sulfate (SDS) and the Effect of Low Concentration of Pyrene on Its CMC Using ORIGIN Software. J. Chem. Soc. Pak. 2008, 30, 186–191. [Google Scholar]
  49. Oremusová, J. Micellization of Alkyl Trimethyl Ammonium Bromides in Aqueous Solutions-Part 1: Critical Micelle Concentration (Cmc) and Ionization Degree. Tenside Surfactants Deterg. 2012, 49, 231–240. [Google Scholar] [CrossRef]
  50. Rosen, M.J.; Kunjappu, J.T. Surfactants and Interfacial Phenomena, 4th ed.; John Wiley and Sons: Hoboken, NJ, USA, 2012. [Google Scholar]
  51. Patel, H.A.; Bruce Nauman, E.; Garde, S. Molecular Structure and Hydrophobic Solvation Thermodynamics at an Octane-Water Interface. J. Chem. Phys. 2003, 119, 9199–9206. [Google Scholar] [CrossRef]
  52. Liu, Z.Y.; Wang, C.; Zhou, H.; Wang, Y.; Zhang, L.; Zhang, L.; Zhao, S. Characterizing the Impact of Surfactant Structure on Interfacial Tension: A Molecular Dynamics Study. J. Mol. Model. 2017, 23, 112. [Google Scholar] [CrossRef]
  53. Li, R.; Jiang, Z.; Chen, F.; Yang, H.; Guan, Y. Hydrogen Bonded Structure of Water and Aqueous Solutions of Sodium Halides: A Raman Spectroscopic Study. J. Mol. Struct. 2004, 707, 83–88. [Google Scholar] [CrossRef]
  54. Volkov, N.A.; Tuzov, N.V.; Shchekin, A.K. Molecular Dynamics Study of Salt Influence on Transport and Structural Properties of SDS Micellar Solutions. Fluid Phase Equilib. 2016, 424, 114–121. [Google Scholar] [CrossRef]
  55. Yuan, S.; Ma, L.; Zhang, X.; Zheng, L. Molecular Dynamics Studies on Monolayer of Cetyltrimethylammonium Bromide Surfactant Formed at the Air/Water Interface. Colloids Surfaces A Physicochem. Eng. Asp. 2006, 289, 1–9. [Google Scholar] [CrossRef]
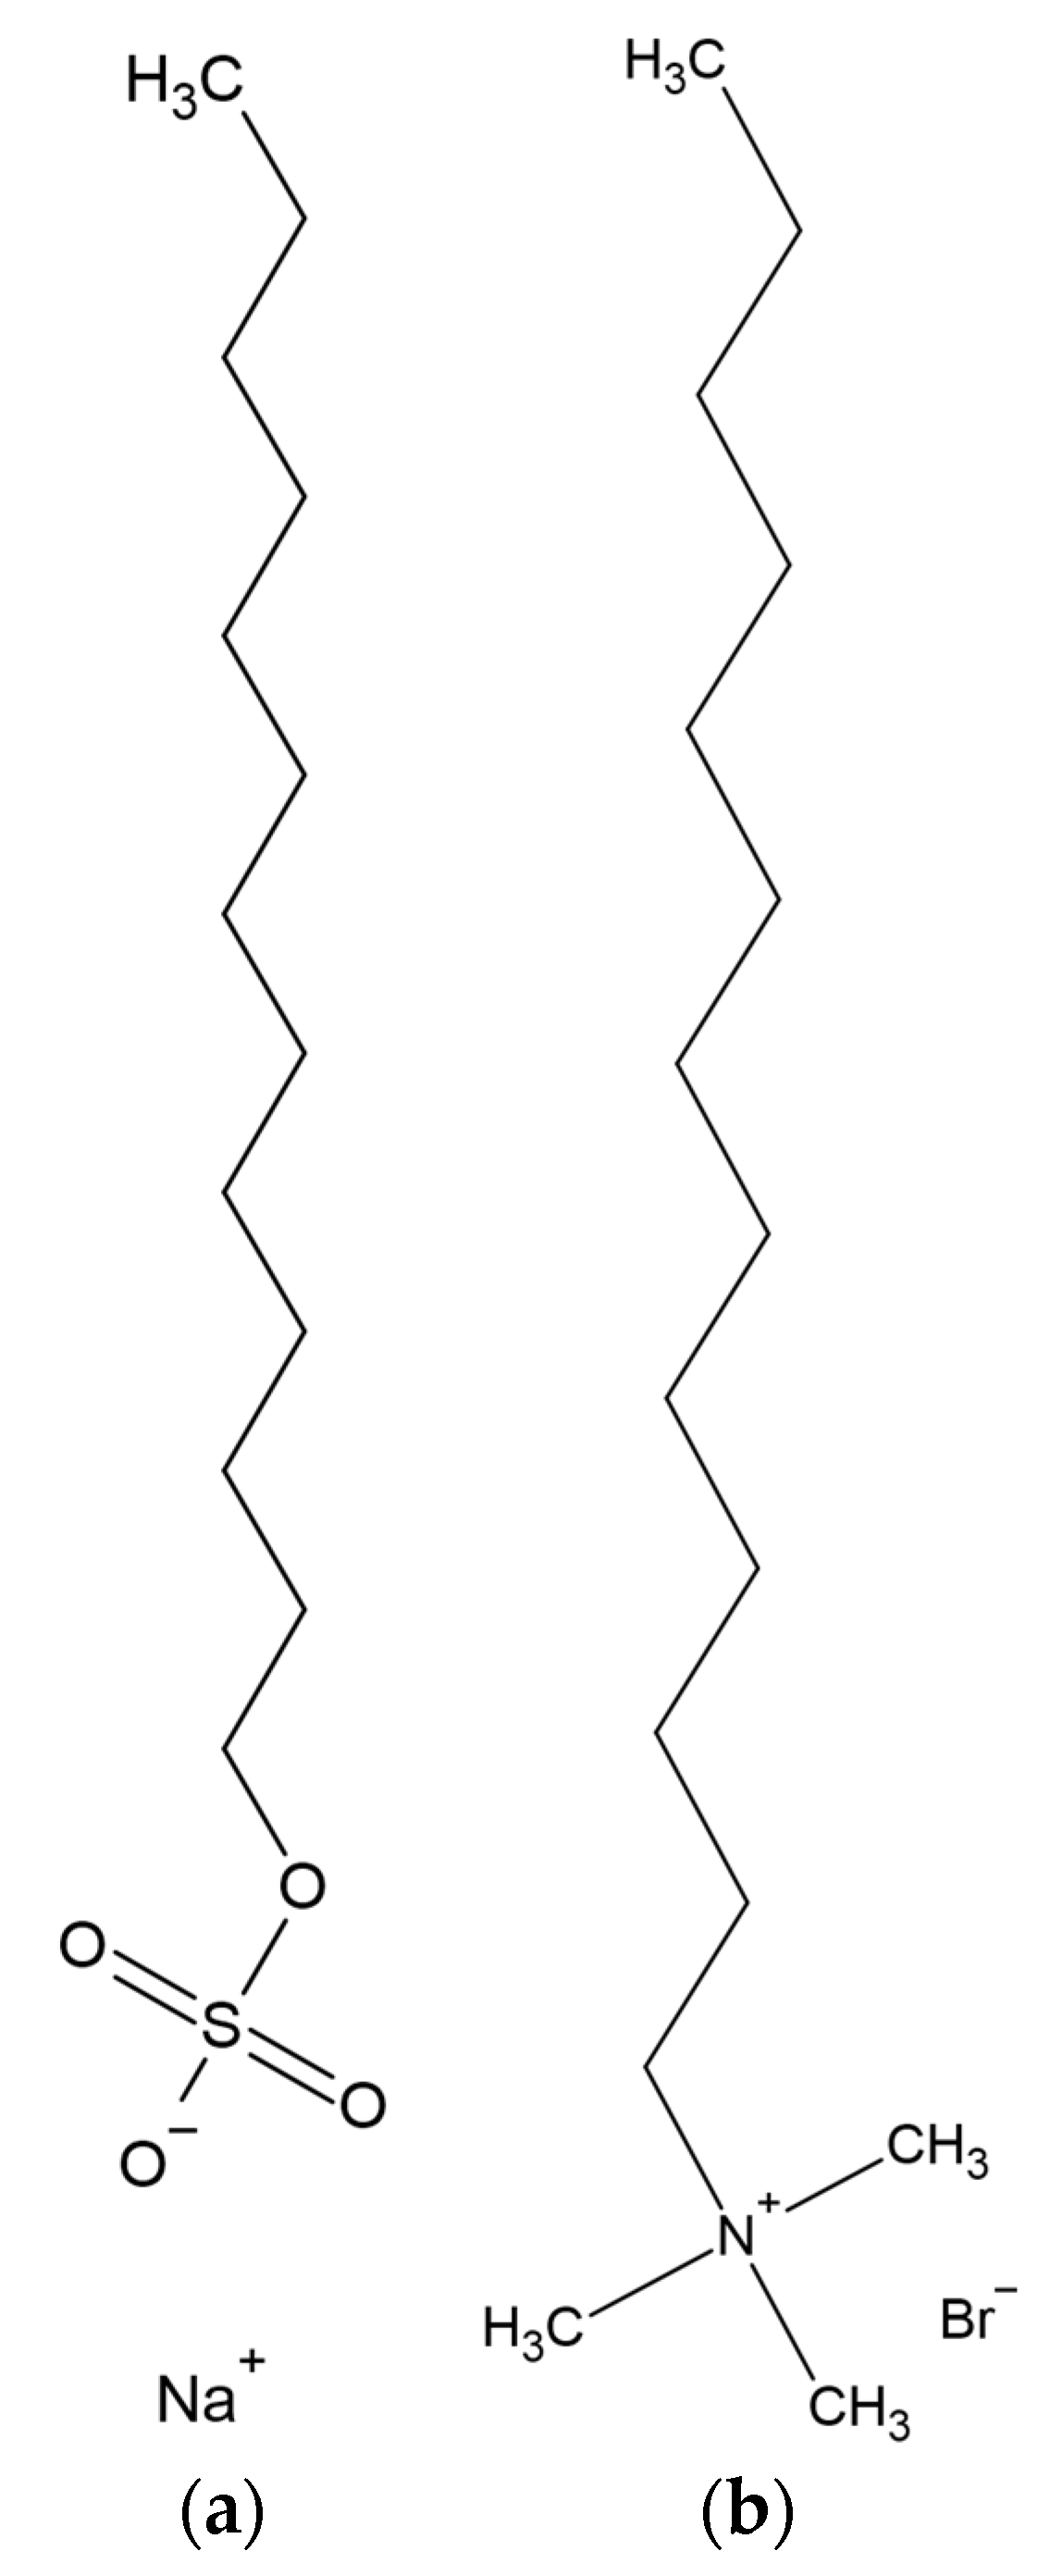
Figure 1. SDS (a), DTAB (b).
Energies 16 01679 g001
Figure 2. General view of systems under investigation.
Energies 16 01679 g002
Figure 3. IFT of SDS solutions. Error bars are hidden by markers. Results of control experiments are given on the OY axis.
Energies 16 01679 g003
Figure 4. IFT of DTAB solutions. Error bars are hidden by markers. Results of control experiments are given on the OY axis.
Energies 16 01679 g004
Figure 5. Density profiles for plain system (a) and system with chelating agents (b).
Energies 16 01679 g005
Figure 6. System with SDS without chelating agent (a) and with chelating agent (b).
Energies 16 01679 g006
Figure 7. System with DTAB without chelating agents (a) and with chelating agents (b).
Energies 16 01679 g007
Figure 8. RDF between SDS (a) and DTAB (b) headgroups and water.
Energies 16 01679 g008
Figure 9. RDF for SSDS-SSDS (a) and NDTAB-NDTAB (b).
Energies 16 01679 g009
Figure 10. RDF between SSDS-OEDTA (a) and NDTAB-OEDTA (b).
Energies 16 01679 g010
Table 1. Systems’ compositions and dimensions.
SystemComposition, Molecules NumberDimensions
OctaneWaterEDTA2−EDTA3−Na+BrCASurfactantl × h × w, Å
1118 × 2106726720036 × 289 × 40 × 40
2118 × 295726970136 × 289 × 40 × 40
3118 × 2159339072036 × 2111 × 40 × 40
4118 × 21435393672136 × 2111 × 40 × 40
Table 2. CMC of surfactants in water and chelating agent.
SurfactantSolutionMeasured, % wt.Reference Value, % wt.
SDSWater0.1450.230 [48]
Chelating agent0.0014-
DTABWater0.5330.547 [49]
Chelating agent0.061-
Table 3. Interfacial thickness of systems under investigation.
SurfactantSolutionInterfacial Thickness, Å
SDSWater18.18
Chelating agent19.98
DTABWater31.43
Chelating agent32.59
Table 4. Hydrogen bonding parameters for systems under investigation.
SurfactantSolutionNumber of Hydrogen Bonds per Water MoleculeNumber of Hydrogen Bonds per Surfactant Molecule
SDSWater1.69 ± 0.024.35 ± 0.18
Chelating agent1.59 ± 0.023.89 ± 0.13
DTABWater1.62 ± 0.010
Chelating agent1.50 ± 0.0140
Disclaimer/Publisher’s Note: The statements, opinions and data contained in all publications are solely those of the individual author(s) and contributor(s) and not of MDPI and/or the editor(s). MDPI and/or the editor(s) disclaim responsibility for any injury to people or property resulting from any ideas, methods, instructions or products referred to in the content.