Article

Well Placement Optimization through the Triple-Completion Gas and Downhole Water Sink-Assisted Gravity Drainage (TC-GDWS-AGD) EOR Process

by
Watheq J. Al-Mudhafar
1,*,
David A. Wood
2,
Dahlia A. Al-Obaidi
3 and
Andrew K. Wojtanowicz
4
1
Basrah Oil Company, Basrah 61001, Iraq
2
DWA Energy Limited, Lincoln LN5 9JP, UK
3
Department of Petroleum Engineering, College of Engineering, University of Baghdad, Baghdad 10071, Iraq
4
Craft & Hawkins Department of Petroleum Engineering, Louisiana State University, Baton Rouge, LA 70803, USA
*
Author to whom correspondence should be addressed.
Energies 2023, 16(4), 1790; https://doi.org/10.3390/en16041790
Submission received: 6 January 2023 / Revised: 4 February 2023 / Accepted: 8 February 2023 / Published: 10 February 2023
(This article belongs to the Section H1: Petroleum Engineering)

Abstract

:
Gas and downhole water sink-assisted gravity drainage (GDWS-AGD) is a new process of enhanced oil recovery (EOR) in oil reservoirs underlain by large bottom aquifers. The process is capital intensive as it requires the construction of dual-completed wells for oil production and water drainage and additional multiple vertical gas-injection wells. The costs could be substantially reduced by eliminating the gas-injection wells and using triple-completed multi-functional wells. These wells are dubbed triple-completion-GDWS-AGD (TC-GDWS-AGD). In this work, we design and optimize the TC-GDWS-AGD oil recovery process in a fictitious oil reservoir (Punq-S3) that emulates a real North Sea oil field. The design aims at maximum oil recovery using a minimum number of triple-completed wells with a gas-injection completion in the vertical section of the well, and two horizontal well sections—the upper section for producing oil (from above the oil/water contact) and the lower section for draining water below the oil/water contact. The three well completions are isolated with hydraulic packers and water is drained from below the oil–water contact using the electric submersible pump. Well placement is optimized using the particle swarm optimization (PSO) technique by considering only 1 or 2 TC-GDWS-AGD wells to maximize a 12-year oil recovery with a minimum volume of produced water. The best well placement was found by considering hundreds of possible well locations throughout the reservoir for the single-well and two-well scenarios. The results show 58% oil recovery and 0.28 water cut for the single-well scenario and 63.5% oil recovery and 0.45 water cut for the two-well scenario. Interestingly, the base-case scenario using two wells without the TC-GDWS-AGD process would give the smallest oil recovery of 55.5% and the largest 70% water cut. The study indicates that the TC-GDWS-AGD process could be more productive by reducing the number of wells and increasing recovery with less water production.

1. Introduction

In the petroleum industry, enhanced oil recovery (EOR) technologies sometimes make it possible to substantially increase ultimate resource recovery (50–70%, or more) of the initial oil in place (IOIP) from a reservoir, thereby improving on the performances of primary and secondary oil recovery technologies [1]. Gas-injection technologies have become some of the most effective EOR processes applied. Natural gas, carbon dioxide, nitrogen, and other gases have all been successfully used in multiple oil reservoirs for EOR purposes in either miscible or immiscible processes. These gases can increase or maintain reservoir energy and reduce the viscosity of oil [2,3]. Many factors affecting the gas-injection process must be taken into account, such as reservoir inhomogeneity and unwanted movements within the reservoir of oil and/or gas, including gas coning problems and issues of low sweep efficiency [4,5,6,7,8].
There are several applicable gas-injection methods, and each tends to work best in specific types of oil reservoirs. Each method has its own characteristics, advantages, and disadvantages. The established gas-injection-EOR methods include continuous gas injection (CGI), huff-n-puff or intermittent gas injection (H-n-P), water-alternating gas (WAG) [9], gas-assisted gravity drainage (GAGD), and gas-downhole water sink-assisted gravity drainage (GDWS-AGD). GAGD exploits the gravity impacts of gas injection in either immiscible or miscible conditions. Applied in field tests, GAGD has achieved about 70% recovery of IOIP [2]. Such performance has also been achieved by laboratory-based GAGD core-flooding tests [3]. In this method, typically, vertical gas-injection wells are completed close to the top of the reservoir. These injectors are accompanied by horizontal oil-production wells positioned close to the base of the pay zone but crucially above the oil/water contact (OWC) [10,11].
The injected gas in the GAGD process tends to accumulate at the top of the reservoir and gradually results in gas cap formation. This growing gas cap provides additional reservoir energy that assists the downward drainage of oil towards the horizontal-water-producer wells, exploiting gravity impacts on the contrasting fluid densities (gas < oil < water). Figure 1 presents the schematic illustration of the gas-assisted gravity drainage (GAGD) process. Gravity segregation tends to enhance reservoir sweep efficiency and thereby achieve its EOR objectives [12]. An additional benefit of the GAGD process is that it delays gas breakthrough into the oil-production wells [4,13,14,15,16]. However, GAGD sometimes has negative reservoir consequences resulting in high water-cut levels and/or a high tendency for water coning/cresting to occur, particularly when applied to reservoirs associated with strong water aquifers [17,18,19,20].
The GDWS-AGD method was developed specifically to address the recognized GAGD limitations. It integrates GAGD with downhole-water-sink (DWS) technology. It achieves this by injecting gas through a stand-alone near-vertical injector well completed in a top-reservoir position. This gas injector is accompanied by multiple horizontal-water-producer wells positioned beneath the OWC, and multiple horizontal-oil-producer wells positioned above the OWC. In some cases, individual horizontal wells, equipped with dual completions separated by hydraulic packers, can simultaneously produce oil from above the OWC and water from below the OWC [17,18,21]. Figure 2 provides a schematic diagram of a classic GDWS-AGD well configuration.
To further reduce premature gas breakthrough and high-water-cut tendencies of GDWS-AGD, it is possible to use triple-completed (TC) wells, incorporating water/oil-production and gas-production completions in each well drilled. This TC-GDWS-AGD approach eliminates the need for drilling separate, vertical gas-injection wells. More specifically, the gas injection is implemented through the wellbore annulus, and oil and water production is accomplished through 2 2⅜-inch strings of tubing drawing production from perforations located above and below the OWC, respectively. In order to achieve maximum performance of the TC-GDWS-AGD process, it is essential to determine the optimal well placement into the reservoir to attain maximum oil production along with minimum gas injection and minimum water cut. The well placement optimization is a challenging procedure as it is impacted by the fluid properties, reservoir heterogeneity, and the developing history of the reservoir. Thus, the optimal well placement or location has a significant impact on the economic profit of oil field development and thus on the net present value (NPV). The objective function of well placement optimization is a highly nonlinear constraint, and due to reservoir heterogeneity, the decision variables are multi-modal. These optimization problems are typically computationally expensive as they entail full reservoir heterogeneity. Thus, finding optimal well locations with less time and fewer function evaluations is crucial [22,23,24,25,26,27,28,29].
To overcome the unavailability of mathematical model-based approaches, particle swarm optimization (PSO) and genetic algorithm (GA) are commonly applied to well placement optimization problems [30,31,32]. Sometimes, these methodologies suffer from premature local optimization issues. Therefore, to achieve improved performance, classical techniques have been integrated with non-classical techniques to develop many hybrid algorithms [33,34,35]. Particles in the PSO algorithm are initialized randomly and change their position with time to identify the optimum solution in a search space [36,37]. To effectively find the global optimum, a modified GA algorithm has been implemented for well placement optimization in a gas condensate field [38], and under geological uncertainties as a multi-objective problem [39]. A combination of PSO with a local generalized pattern search (GPS) strategy was implemented to handle general constraints by establishing a ranking system [35]. However, they concluded that it is necessary to consider more sophisticated constraint-handling methods for well-placement optimization.
In this study, the feasibility of the TC-GDWS-AGD technique was evaluated through simulation-flow modeling applied on the PUNQ-S3 synthetic reservoir based on a real North Sea oil field. This process reduces the number of required injector wells by utilizing some wells for combined gas injection and oil/water production, making it more commercially viable. TC-GDWS-AGD also aims to achieve maximum oil recovery resulting from a minimum gas-injection rate and minimum water cut. PSO was employed to determine the best well completion locations and to identify the optimal production and injection control parameters. The operational decision parameters considered by the production scenarios evaluated by PSO include the maximum oil-production rate (STO) at the wellhead, the minimum bottom-hole pressure (BHP) of oil well completions, maximum surface-water-production rate (STW) at the wellhead, minimum BHP of the water-production well completions, maximum surface gas-injection rate, and maximum BHP of gas-injection well completions. These operational decision parameters govern the ultimate maximum oil recovery, gas breakthrough, and water cut achieved by the triple-completion well configurations.
Previous research on the GDWS-AGD has focused on implementing the technique by applying dual-completed, horizontal wells for oil production and water injection combined with multiple additional, vertical, gas-injection wells. This approach is expensive based on the total wellbore lengths that need to be drilled. For the first time, this study evaluates an implementation (TC-GDWS-AGD) aimed at substantially reducing well costs by eliminating the requirement for separate gas-injection wells. The new method achieves this by incorporating triple-completed wells that charge a reservoir’s gas cap from the upper gas-injection completion, while simultaneously segregating production of oil and water from two lower well completions, with produced water being re-injected into the reservoir’s water zone from the lowest completion. This study also demonstrates a novel application for the PSO algorithm for improving reservoir development designs relating to the TC-GDWS-AGD method by simultaneously seeking designs that optimize oil production while minimizing water cut.

2. TC-GDWS-AGD Well Configurations

Increasing oil recovery by improving sweep efficiency and reducing water cut is the main objective of the application of the GDWS-AGD technology [14,18,40]. Reducing the number of production wells is one way to improve its commercial viability. One way to achieve this is to produce oil and water from each production well through two isolated completions while in the same wellbore to inject gas via the annulus through the casing [41,42]. This TC-GDWS-AGD technique, for maximum effect, should inject gas as close to the highest point of the oil pay zone as possible to gradually cause the reservoir to develop a gas cap. This is best achieved by injecting gas through a near-vertical section of the wellbore utilizing a set of perforations isolated from the rest of the well via a packer.
For the oil and water dual completions in separate horizontal wellbore sections, depending on the diameter of the well drilled, 2 separate strings of production casing are installed (for example, each with a 7-inch diameter): one in the oil zone, and one in the water zone. Each production casing is perforated and completed, for example, with 2⅜-inch diameter horizontal tubing. The oil-production section needs to be positioned near horizontally above but close to the OWC, whereas the water-production section needs to be positioned near-horizontally, below but close to the OWC. A submersible pump is required to extract water through the water-production completion at high rates, as required. Hydraulic packers are required to isolate each of the production completions. Both production well sections are typically drilled with similar horizontal lengths and wellbore diameters for the TC-GDWS-AGD to be most effective (Figure 3).

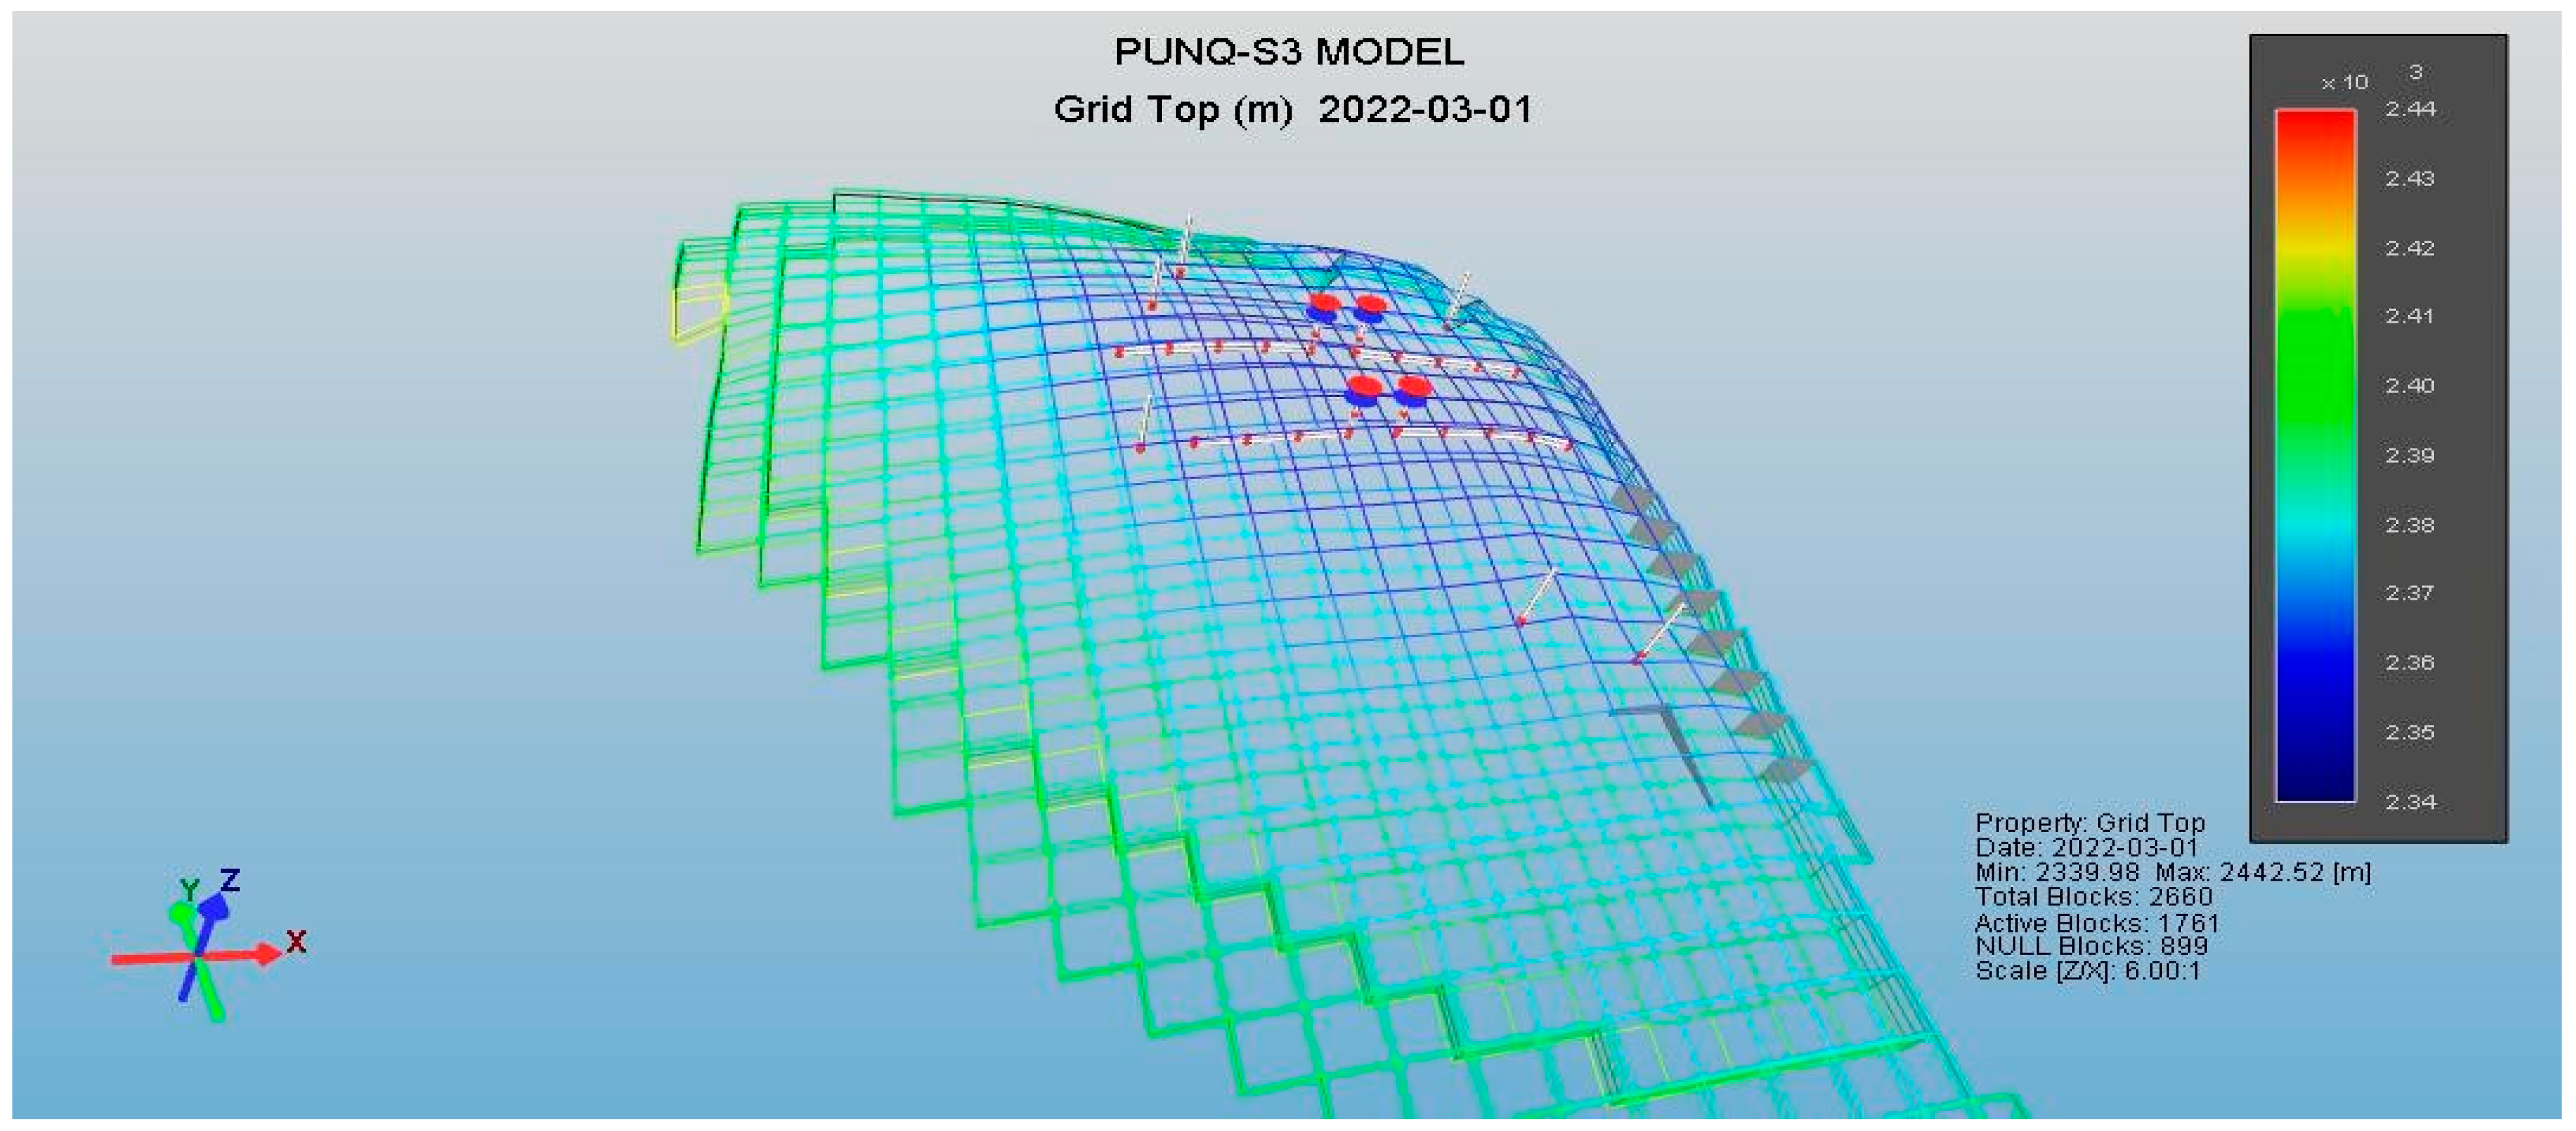
3. PUNQ-S3 Truth Case Description

The viability of the TC-GDWS-AGD technique for gas injection and its efficiency in maximizing oil production and minimizing water cut are evaluated in this study with simulations applied, with the aid of an optimizer, to the PUNQ-S3, three-phase, three-dimensional, synthetic reservoir [43]. Production uncertainty quantification (PUNQ)-S3 is a heterogeneous saturated-oil synthetic reservoir with a gas cap and strong water drive based on an actual North Sea field. This synthetic reservoir has been widely used in recent years for reservoir development optimization studies [44,45].
PUNQ involves a modest-sized, 5-layered reservoir extending over 4260 acres, and simulated with 1761 active cells (originally 19 × 28 × 5 grid blocks; 2660 total grid blocks). The depth to the top of the reservoir at the crest of the structure is 2430 m with flanks dipping at 1.5°. A gas cap is located beneath the crest of the structure surrounded by an oil rim. The grid block size is set to 180 m × 180 m × 4.42 m. Pressure and temperature for this reservoir are 3400 psi, 220 °F, respectively. The reservoir includes fault boundaries on its eastern and southern sides, but is fully connected to strong aquifers located to the west and north. The first (uppermost) layer incorporates a small gas cap positioned near the crest of the domal trap. A total of 6 horizontal-producing wells are positioned below the gas–oil contact (GOC) with prevailing BHPs of 1740 psi. Water injection is not required to maintain reservoir pressure due to the presence of a strong aquifer [43]. Figure 4 represents a top structure map and well locations for the PUNQ-S3 reservoir.
Porosity and permeability maps of the reservoir were constructed with a geostatistical model. The PUNQ-S3 synthetic model lacks capillary pressure data but it does include reservoir permeability curves, PVT data, and an aquifer dataset [43]. Average porosity and vertical and horizontal permeability are provided for each reservoir layer (Table 1).

4. TC-GDWS-AGD Simulation Applied to PUNQ-S3 Reservoir

A black-oil-reservoir simulation model was applied, with a twelve-year prediction horizon, to the PUNQ-S3 reservoir incorporating TC-GDWS-AGD. Horizontal wells with multiple completions were positioned in the reservoir to replace the six producing wells incorporated into the basic reservoir model. These two MC wells each include gas-injection completions (G-INJ1and G-INJ2) in the annulus of their vertical sections, horizontal oil-producing completions in a separate lateral branch above the OWC (OIL WELL1, OIL WELL2), and water-producing completions in a separate lateral branch below the OWC (DWS1, DWS2). A miscible gas injection is initiated from the two wells into the (upper) reservoir layer one. The two horizontal oil-producer wells were completed in reservoir layer four, and the two horizontal water-producer wells were completed in reservoir layer five. Figure 5 displays the trajectories of the two MC wells within the PUNQ-S3 reservoir grid. Each wellbore contains three distinct completed sections (GAS INJ1, OIL WELL1, and DWS1).
A key advantage of the TC-GDWS-AGD configuration over the base case PUNQ-S3 simulation is that two TC wells, each with three distinct completed zones, replace the six base-case horizontal wellbores. The Carter–Tracy approach was used to model three distinct zones associated with the active and infinite water-drive aquifer providing the naturally occurring reservoir-drive mechanism. The TC-GDWS-AGD-configured simulation, with the two MC wells, was set up to calculate reservoir pressure, recovery factor, cumulative oil production, oil-flow rate, and the cumulative water cut fraction from a two-well production system extending over 12 years. The TC-GDWS-AGD simulated results are compared with the results achieved by GDWS-AGD and GAGD simulations applied to the reservoir involving the six base-case horizontal wellbore.
The operational constraints applied to the TC-GDWS-AGD, GDWS-AGD, and GAGD simulations included maximum gas-injection rate, bottom-hole-flowing pressure each injection-well completion, maximum flow rate at the wellhead, and minimum bottom-hole-flowing pressure for each horizontal (oil and water) production completion. Table 2 lists the values of these constraints as applied to the TC-GDWS-AGD, GDWS-AGD, and GAGD EOR configurations and to the primary base-case production case.
Figure 6 displays a comparison between TC-GDWS-AGD, GDWS-AGD, GAGD, and primary production simulation cases. The results are shown for stock-tank cumulative oil production (m3) and oil-production daily rate (m3/day) extending over the twelve-year production horizon. The results reveal cumulative oil production of 1.47 × 10⁶ m3 generated by the primary (base-case) production simulation from 6 horizontal producers with no EOR technique applied. On the other hand, 1.6 × 10⁶ m3 of cumulative oil production is generated from the TC-GDWS-AGD simulation incorporating just 2 TC wells (a total of 6 completed reservoir zones), and the GDWS-AGD simulation incorporating 6 separate horizontal wells generates 1.7 × 10⁶ m3 of cumulative oil production. Figure 7 reveals that the overall water cut is substantially reduced from 90% for the primary (base-case) simulation, to 74% for the GAGD simulation, and to 57% for the TC-GDWS-AGD simulation.
Figure 8 displays the average reservoir pressure trends associated with each simulation configuration expressed over the twelve-year production horizon. In the TC-GDWS-AGD simulation, the average reservoir pressure decreased due to the DWS wells. This decrease in reservoir pressure is associated with improved cumulative oil production and a reduction in the water cut compared with the other simulated cases.
Figure 9 displays the oil-recovery factor trends over the twelve-year planning horizon for each of the simulated cases. After 12 years of production, the oil-recovery factor increased to 9%, 14.5%, and 15% for GAGD, TC-GDWS-AGD, and GDWS-AGD simulated cases, respectively, compared with 8% for the primary (base-case) simulation.
The GDWS simulation generates slightly superior results to TC-GDWS-AGD in the key objectives (Table 3). On the other hand, implementing the TC-GDWS-AGD configuration substantially lowers the well costs by involving just two MC wells compared with the six wells required by the GDWS configuration.

5. Well Placement Optimization

Optimization is conducted to determine the optimal simulation solution that achieves maximum oil production, minimum gas breakthrough, and minimum water cut. The optimization of the TC-GDWS-AGD process was conducted based on a series of simulation runs using the CMG-CMOST 2015.10 package [46]. The optimization assesses each simulation solution by taking into account a range of possible uncertainties regarding the operational decision parameters affecting the reservoir fluid flows generated. In addition to the well locations, the operational parameters include BHP in each of the injection- and production-well completions, gas-injection rate, oil-production rate, and water-production rate in the production wells. The optimal case is selected based on the maximum oil-recovery factor combined with the minimum possible water cut.

6. Particle Swarm Optimization

Particle Swarm Optimization (PSO) has been adopted for the optimization of reservoir flow responses in limited petroleum engineering applications, such as well placement optimization [47], minimum miscibility pressure [48], recovery optimization in geothermal reservoirs [49], wellbore trajectory optimization [50], gas lift optimization [51], recovery optimization in shale oil reservoirs [52], and history matching and uncertainty quantification [53].
PSO was the optimizer selected to solve the uncertainties associated with the decision parameters. It conducted this by generating random solutions within the feasible solution space [54]. Each simulation solution generated represents one “particle” in the PSO algorithm's swarm of generated “particles”. Each particle in the swarm has a calculated velocity that moves it progressively through the search space by updating its position in each of a series of PSO iterations to ultimately identify a global best or optimal solution. PSO particles affect each other based on the relative performance of the solutions in respect of the dependent variables (oil-recovery factor and water cut) through the sequence of iterations executed. The PSO algorithm terminates after completing a specified number of iterations. A multi-objective PSO configuration is applied to enable it to assess more than one objective in locating its optimal (global best) solution.
The PSO algorithm was configured to optimize two key objective reservoir variables: (1) maximize the oil-recovery factor; and (2) minimize water cut. For the TC-GDWS-AGD simulation cases, the well completion locations were modified in one or both MC wells by varying the reservoir locations of the completed sections in each well together with the values of specified operational decision variables used across the twelve-year production horizon. The operational decision variables modified were: maximum gas-injection rate, maximum BHP in the gas-injection completions, maximum oil-production rate and minimum BHP in the oil-production completions, and maximum water-production rate and minimum BHP in the water-production completions. The proposed triple-completion method, involving simultaneous gas injection coupled with oil and water production, can be optimized to achieve optimal reservoir flow responses that combine the highest oil production and the lowest water cut. Therefore, the aforementioned operational decision parameters that control the injection and production activities are included as part of the well placement optimization process. The incorporation of these parameters could be auto-optimized using intelligent completion technologies as part of the real-field implementation [55,56].
In scenario one, and to achieve maximum areal coverage of the reservoir by the completion locations evaluated, each TC well was split into two trajectories: one extending to the left of the surface location, and one extending to the right sides of the surface location, as shown for one example simulation solution in Figure 10. The PSO algorithm is then deployed to determine the optimal well completion placement that achieves the maximum oil recovery and minimum water cut. Five hundred what-if-simulation runs were evaluated and fed into the PSO algorithm from which it identified the optimal case. Figure 11 displays the reservoir performance over time, in terms of water cut, reservoir pressure, and oil-recovery factor, for the historical production from the six existing wellbores for the pre-prediction period combined with that of the two TC wells for all five hundred simulation cases evaluated.
In Figure 11, two solutions are highlighted involving the TC wells. The dark red curve identified the PSO optimal TC-GDWS-AGD solution and the thick black curve identifies the base case TC-GDWS-AGD assumptions. The PSO optimal case is associated with the highest oil-recovery factor combined with the minimum water cut. Specifically, the oil recovery was increased from 0.55 for the base-case TC-GDWS-AGD decision variable values to 0.58 in the optimal solution, whereas the water cut decreased from 0.72 for the base-case TC-GDWS-AGD decision variable values to 0.57 in the optimal solution. A comparison of the values of the key decision variables between the base-case TC-GDWS-AGD and the optimal-case TC-GDWS-AGD simulation evaluated is presented in Table 4.
Sobol analysis was applied to identify the most influential decision variables affecting the performance of the TC-GDWS-AGD simulation. Figure 12 displays the results of the Sobol analysis for the oil-recovery factor, identifying that the minimum BHP in the DWS well completion section (Well 2) was most influential (37%) and the location of Well 2 was the next most influential decision variable (35%). On the other hand, the least influential decision variable was the maximum surface gas rate (MAX_STG). The value of permeability in the PUNQ-S3 reservoir layer two is very low; consequently, the effect of the gas-injection rate on the simulation outcomes is low because the transfer of gas from reservoir layer one to reservoir layer three cannot be effectively increased by increasing the gas-injection rate. Among the five hundred simulation cases evaluated, a completion location with the lowest possible water cut did not coincide with the best-performing oil-production completion locations, which are primarily located in relatively high water-saturation areas of the reservoir. In order to further address this conflict, the cases evaluated gradually increased the surface-water-production rate (STW) to values that generated lower water cuts (MAX_STW = 20,000 m3/day).
Figure 13 reveals the substantial effect of STW on water cut for the TC-GDWS-AGD-simulated cases. By allowing MAX_STW to increase, the oil-recovery factor was increased from 59% to 63.5%, whereas the water cut was reduced to 0.45 coupled with a substantial decrease in reservoir pressure as a consequence of the additional produced water extracted from the reservoir.
In scenario two of well placement optimization, two wells were placed to the right side and two wells to the left side of the reservoir, as shown in Figure 14. Table 5 shows the operational decision parameters used in this optimization scenario. The related general solutions of the oil recovery for the four new wells are illustrated in Figure 15.
From the Sobol analysis for scenario 2, the most influential variables with respect to oil recovery are the locations of Well 4 and Well 3 with 24% and 17% main effect and 2% and 1.7% interaction effect, respectively. The optimal locations are positioned in high-oil-saturation zones. On the other hand, the least influential decision variable was the maximum surface oil rate with only a 1.3% main effect, as illustrated in Figure 16.

7. Summary and Conclusions

In this study, a black-oil reservoir simulation was conducted on the Punq-S3 heterogeneous reservoir to evaluate and determine the optimal setting of the triple-completion gas and downhole water sink-assisted gravity drainage (TC-GDWS-AGD) process. The evaluation and well placement optimization procedures of the TC-GDWS-AGD process were conducted to achieve maximum oil production with minimum water cut through a 12-year prediction period in a comparison with GDWS-AGD and GAGD processes. The operational decision parameters that were included in the well placement optimization along with the potential well locations included maximum surface oil rate and minimum bottom hole pressure of oil producers; maximum surface water rate and minimum bottom hole pressure of water producers; and maximum surface gas rate and maximum bottom hole pressure in gas injectors. The following points are the main conclusions retrieved from the evaluation and optimization procedures:
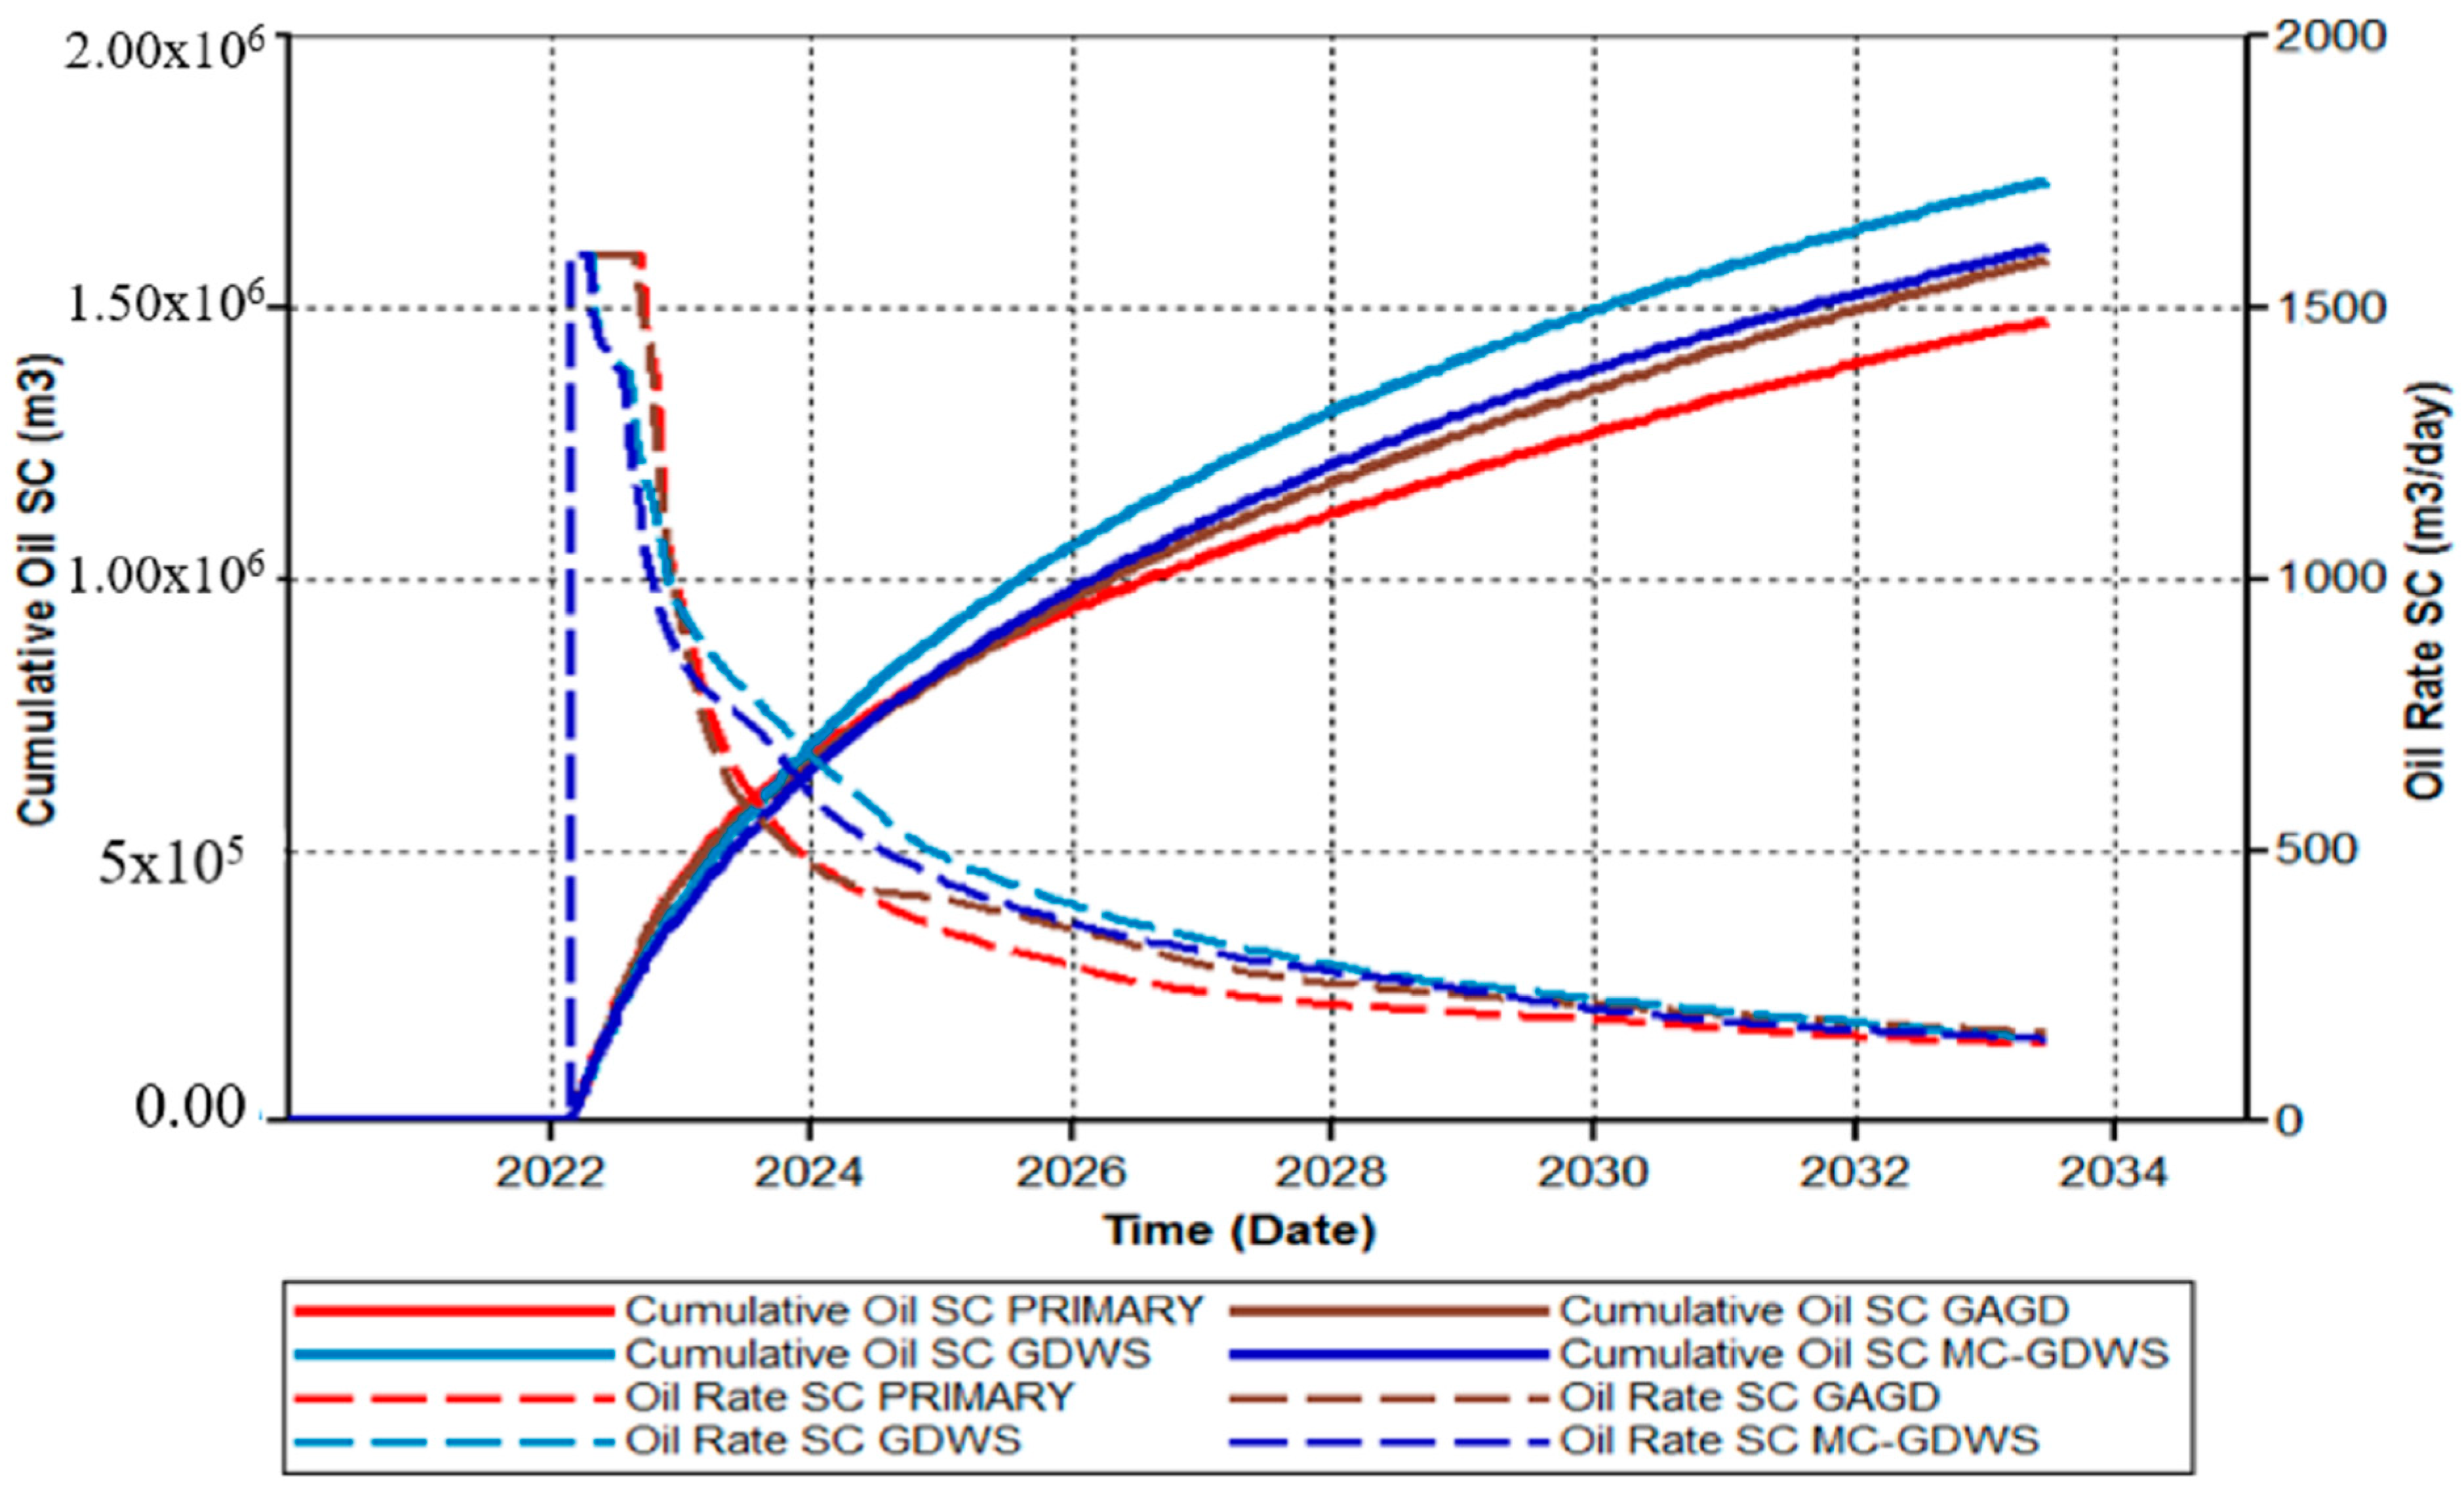
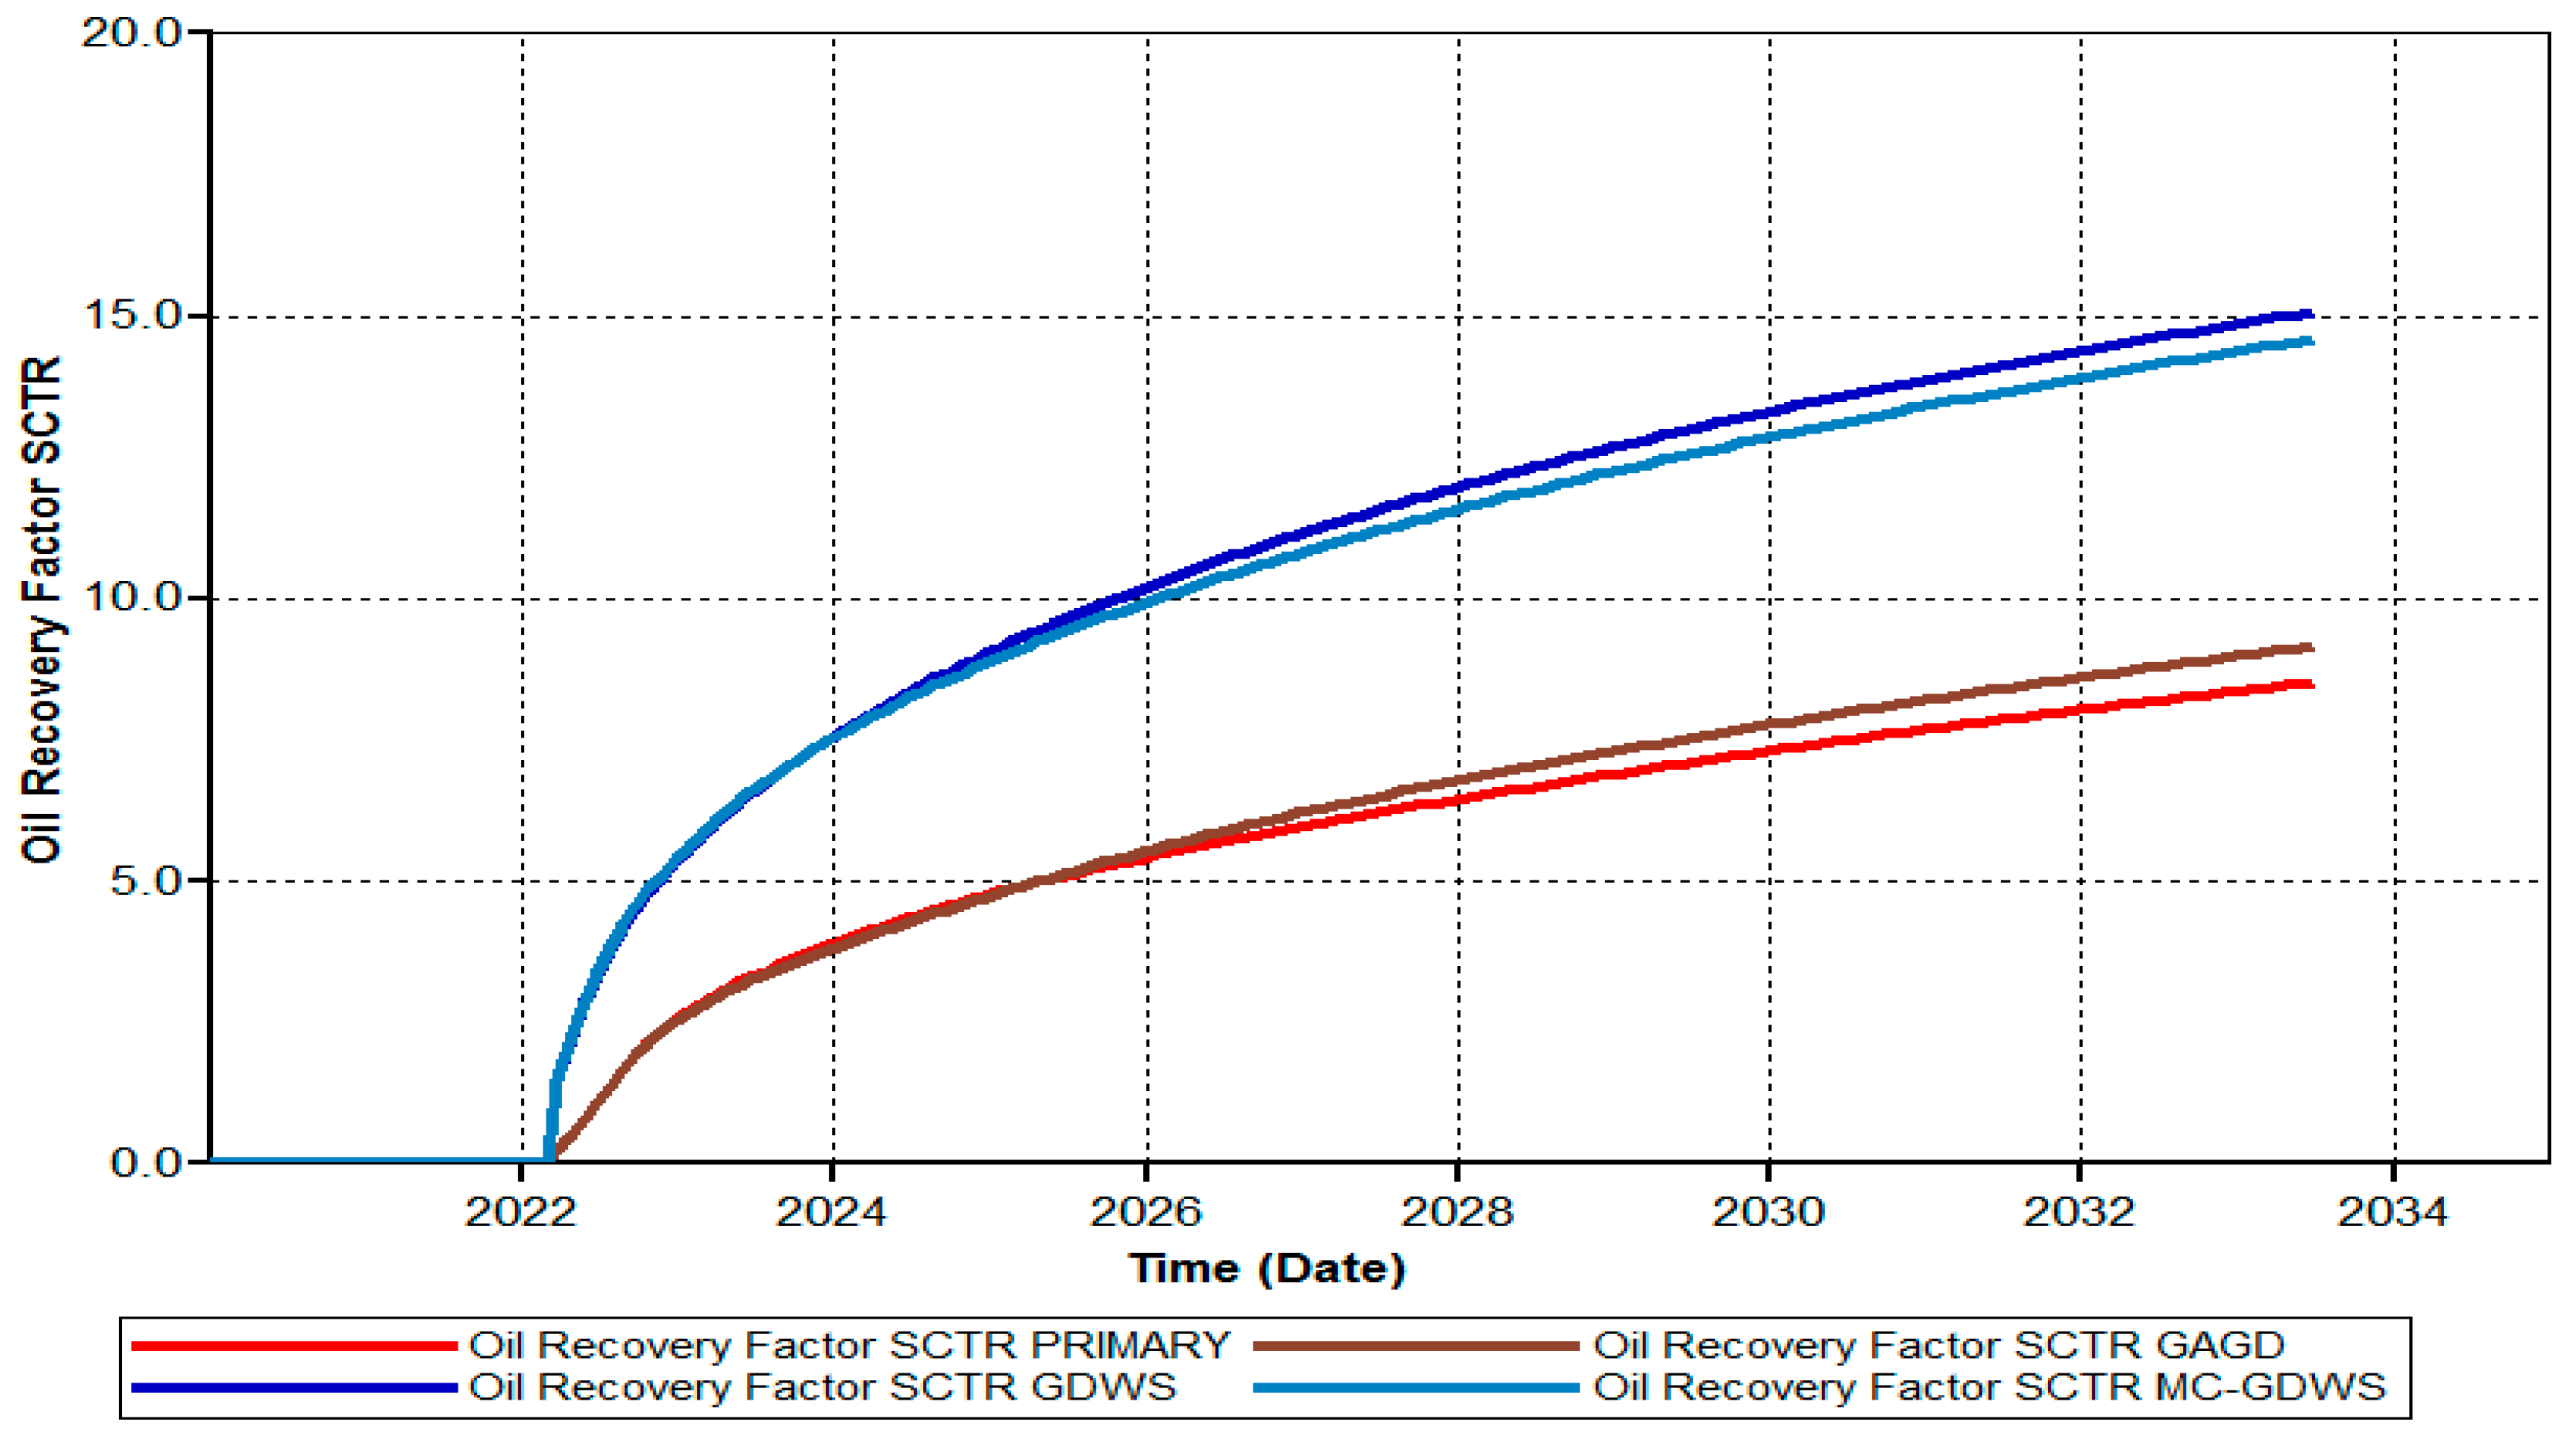
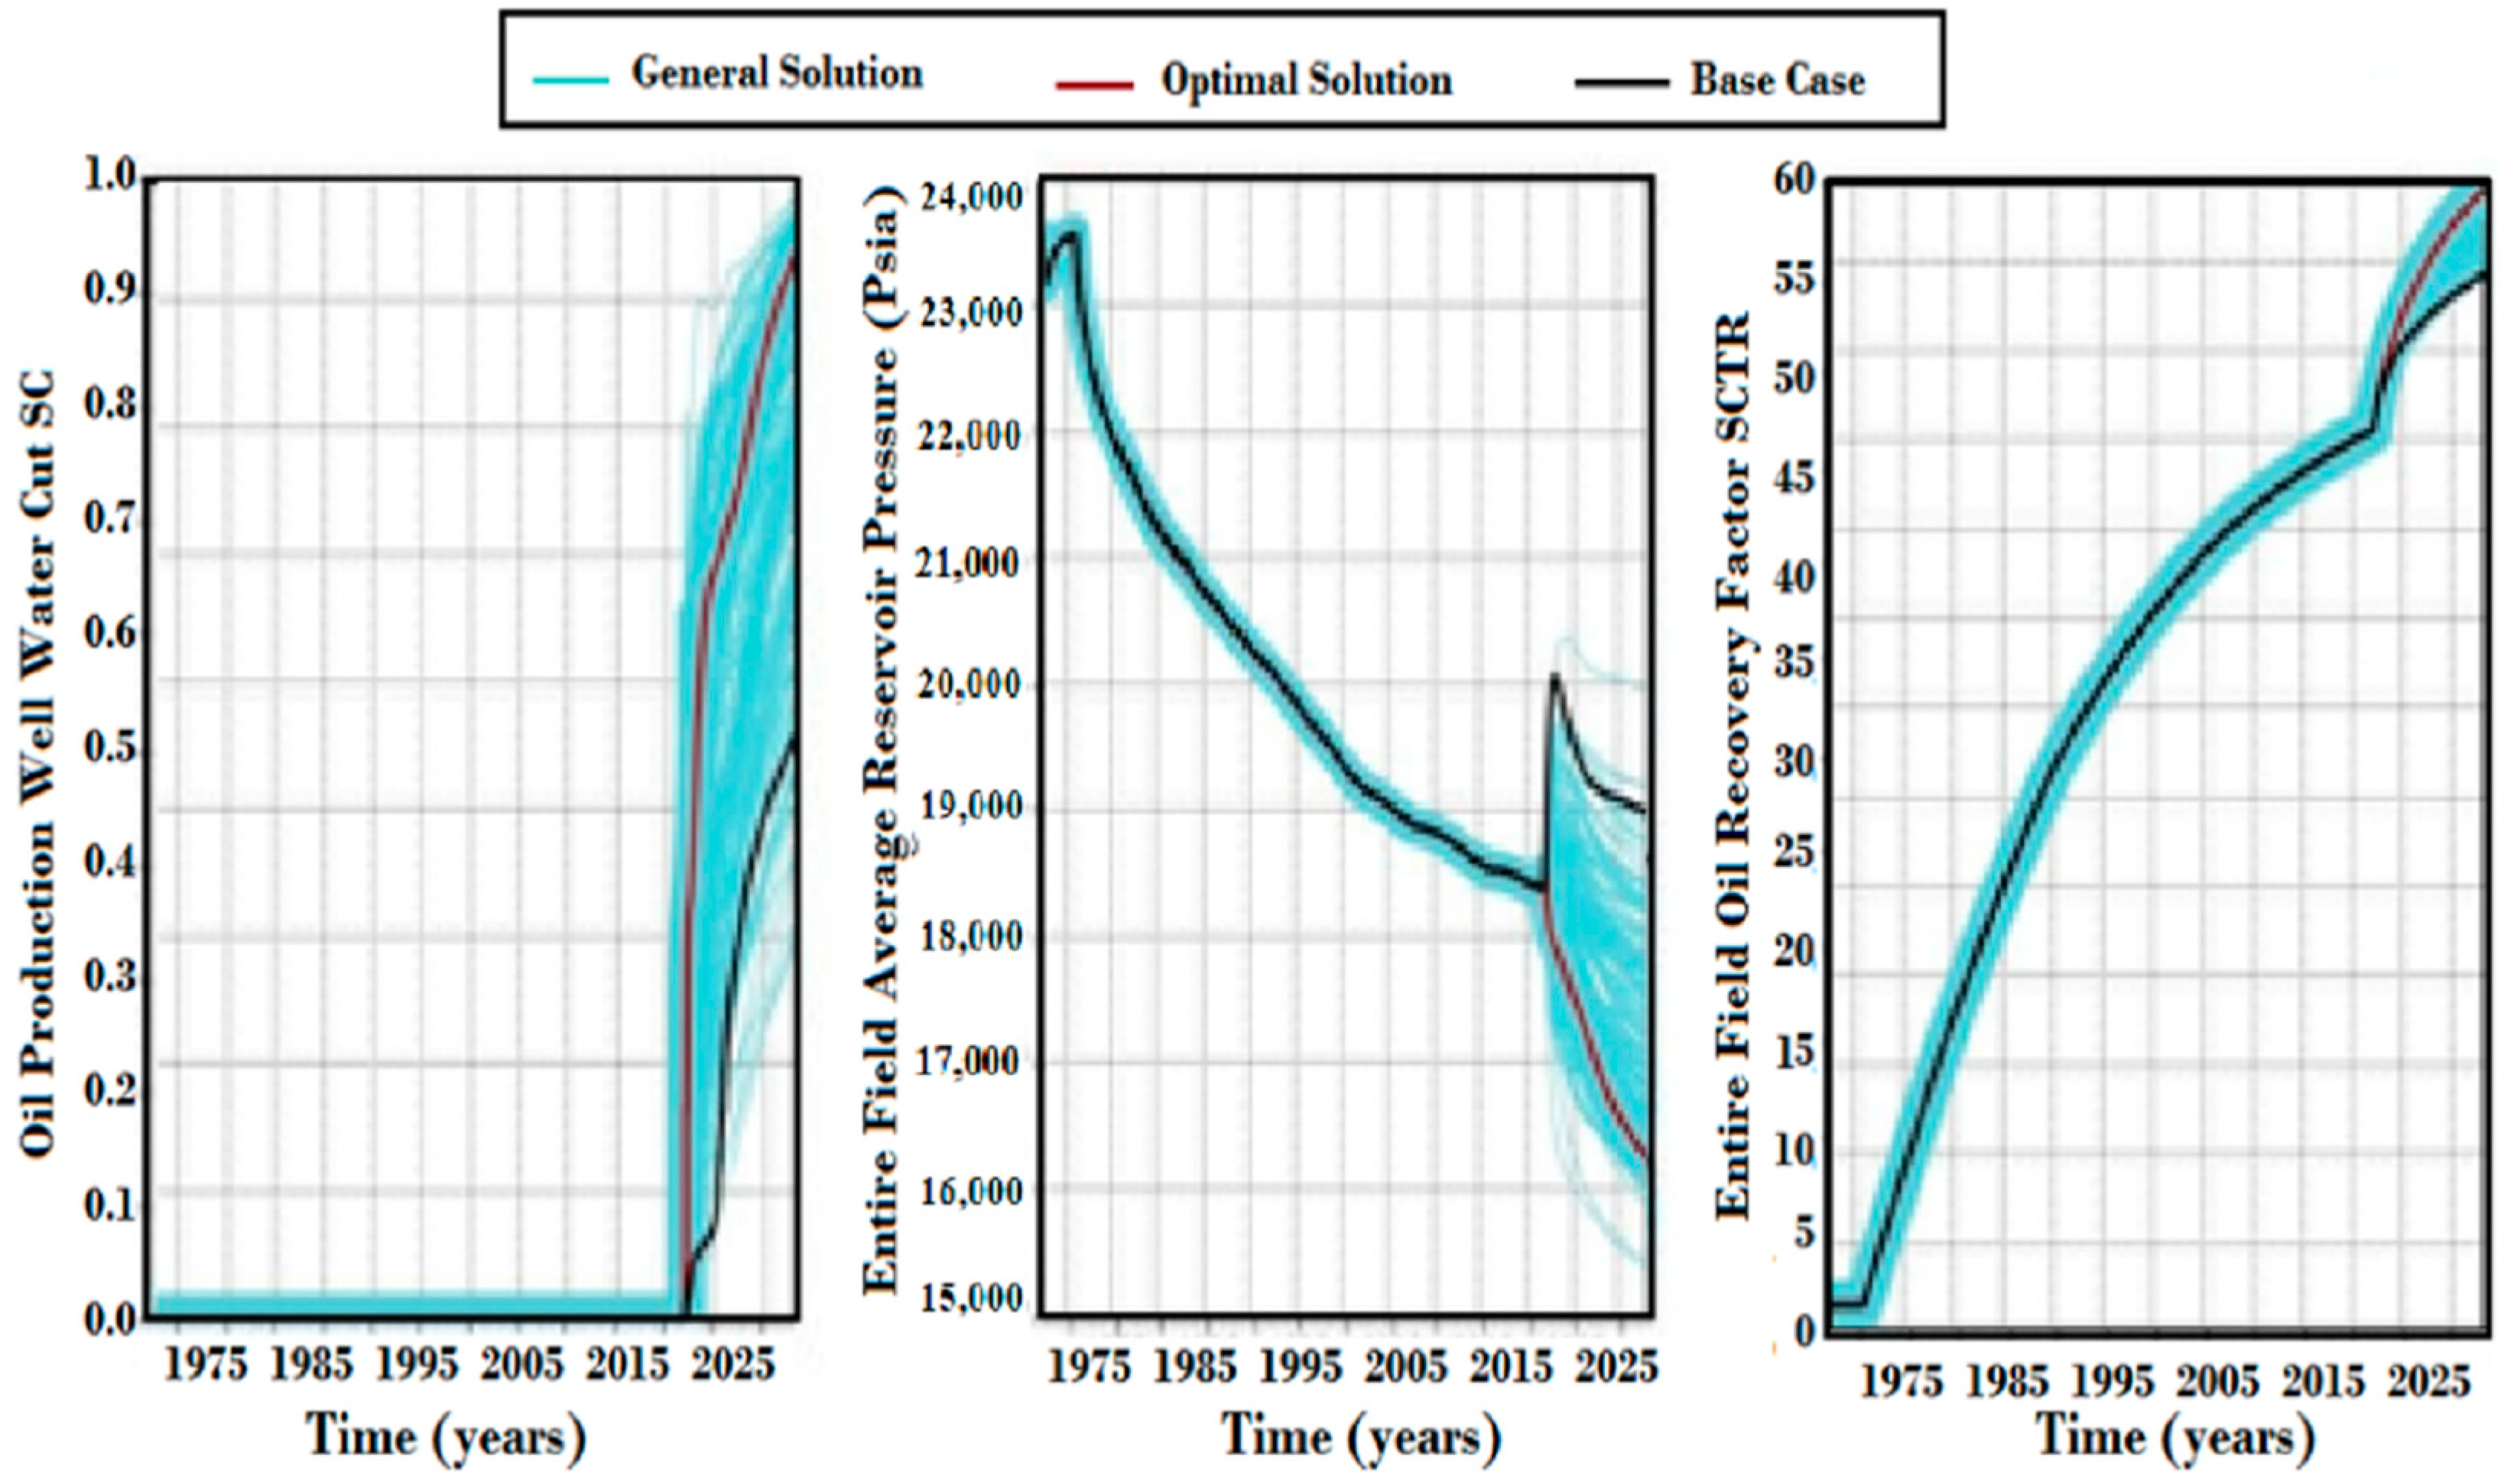
  • The effectiveness of the TC-GDWS-AGD enhanced oil recovery (EOR) technique was confirmed by this simulation study in terms of its ability to increase oil recovery and decrease water cut compared with applying gas-assisted gravity drainage (GAGD) and gas-downhole water sink (GDWS) EOR processes to the Punq-S3 synthetic reservoir.
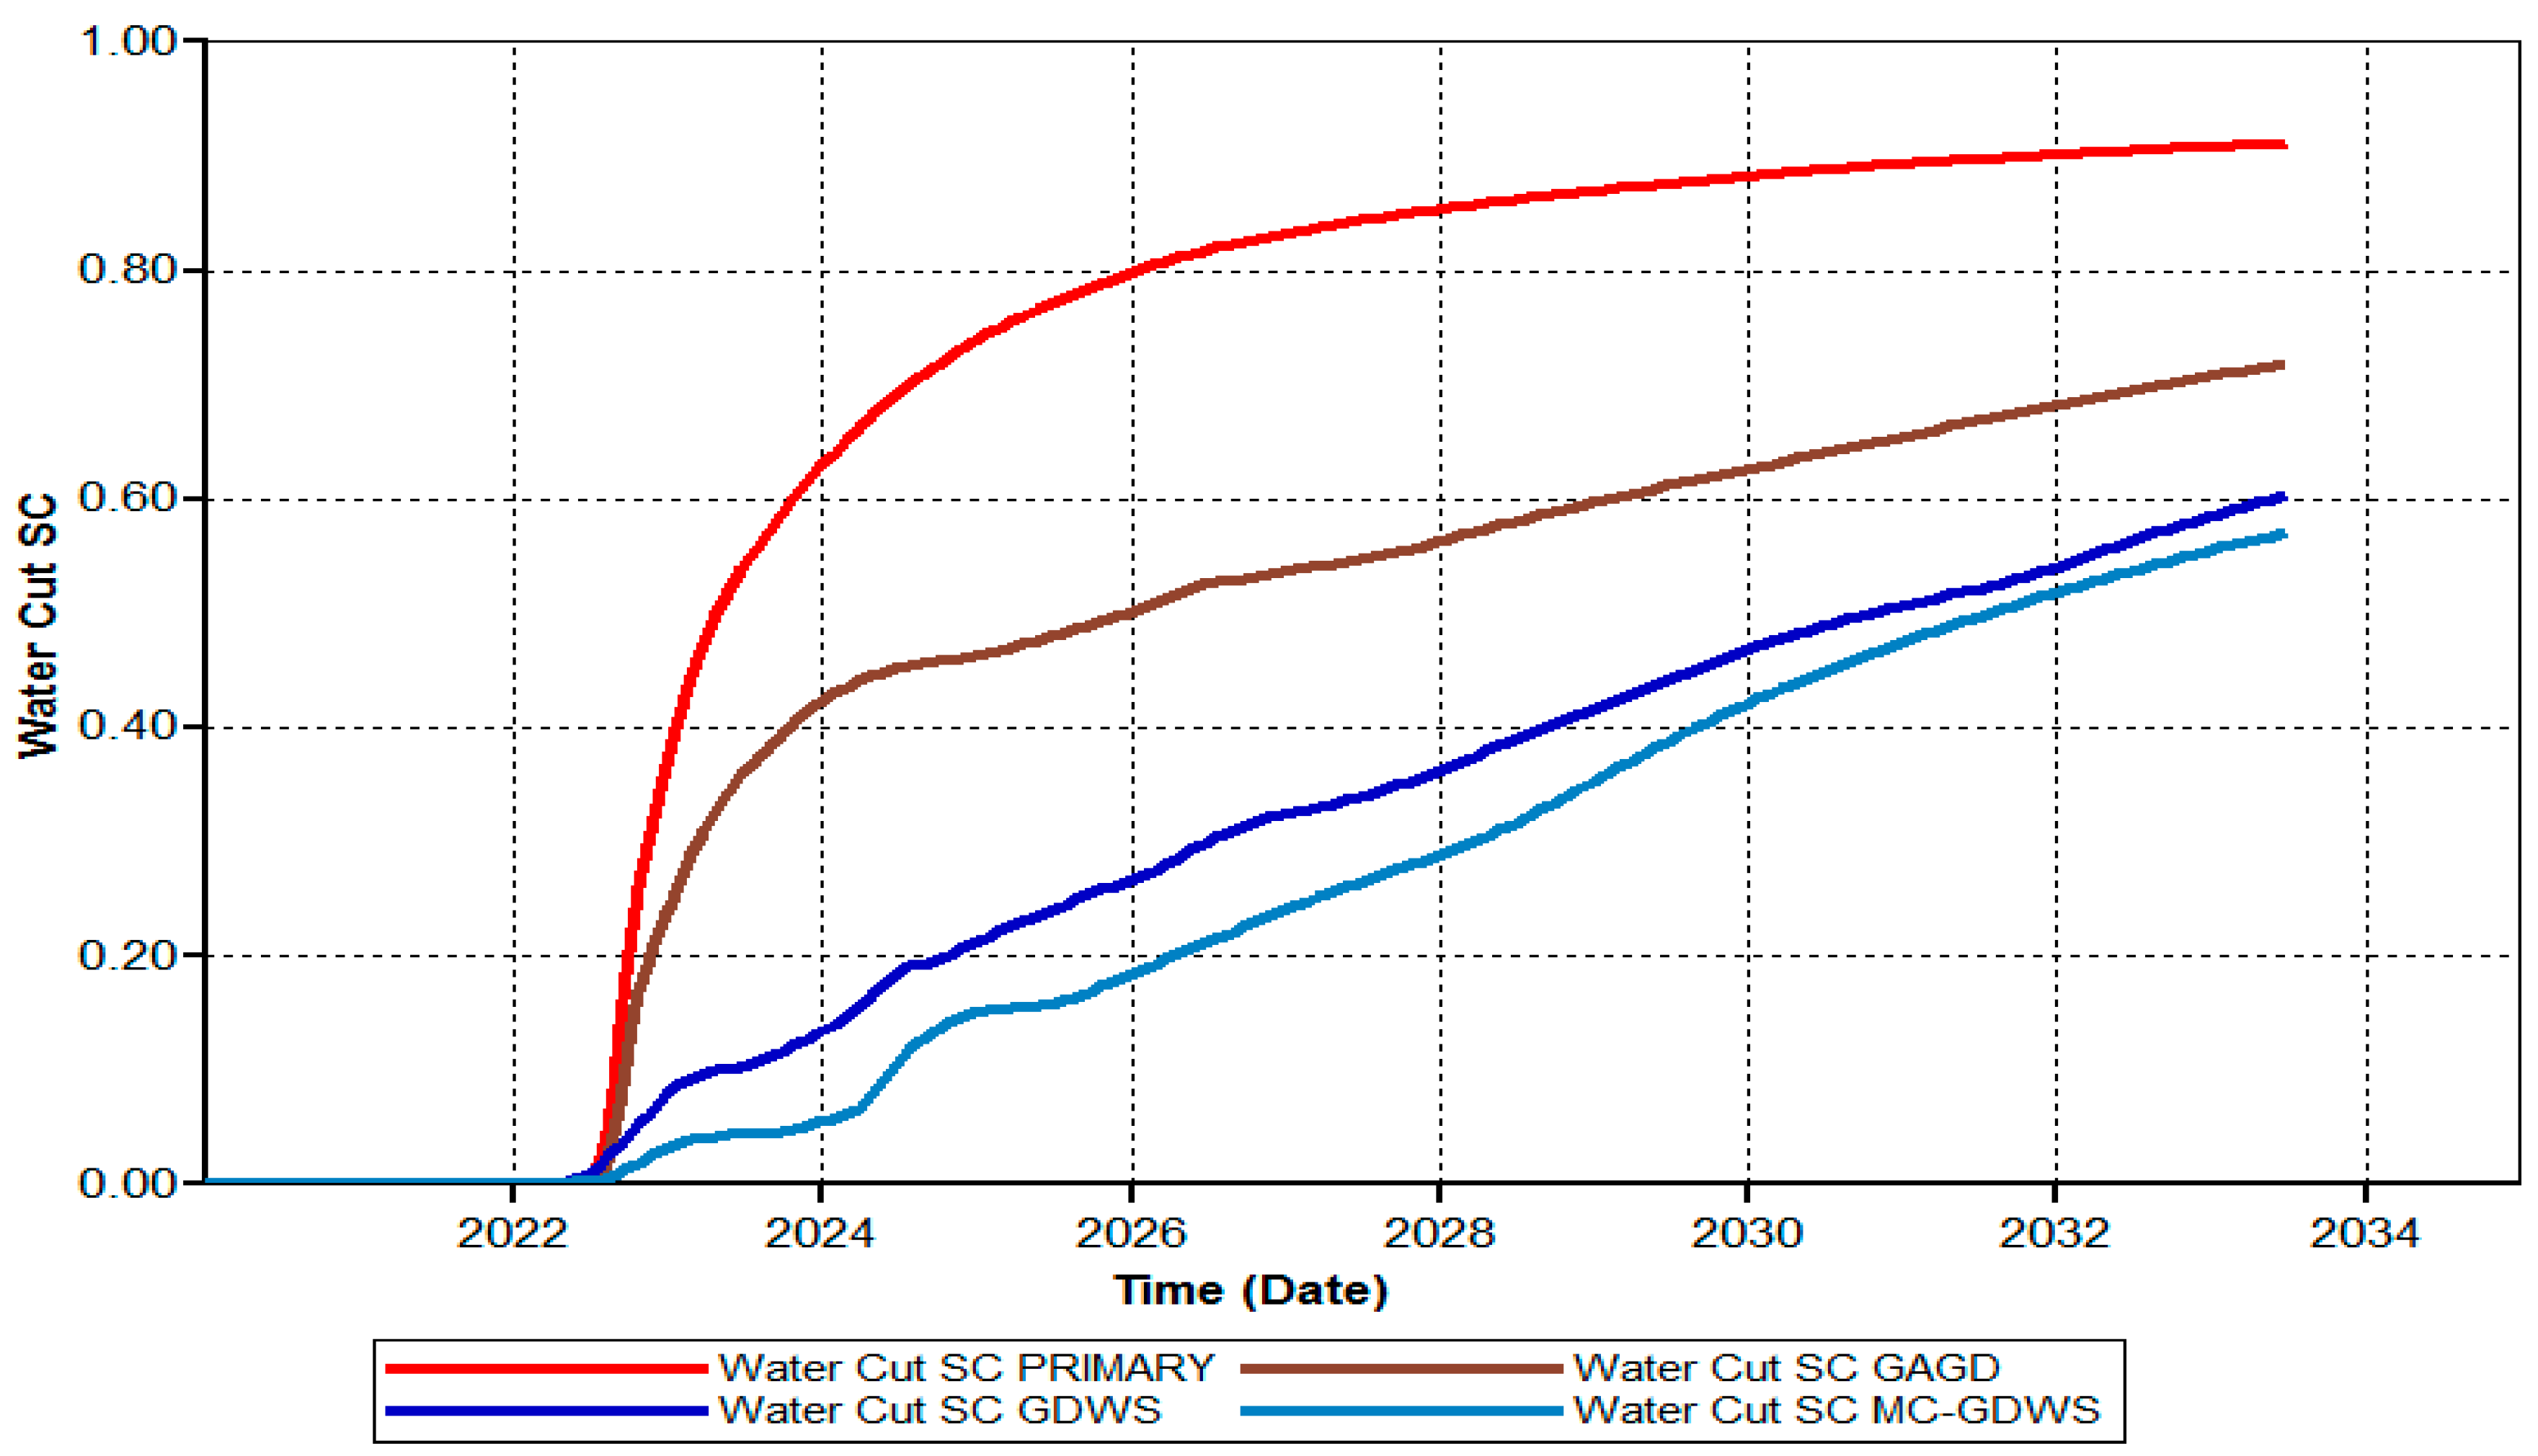
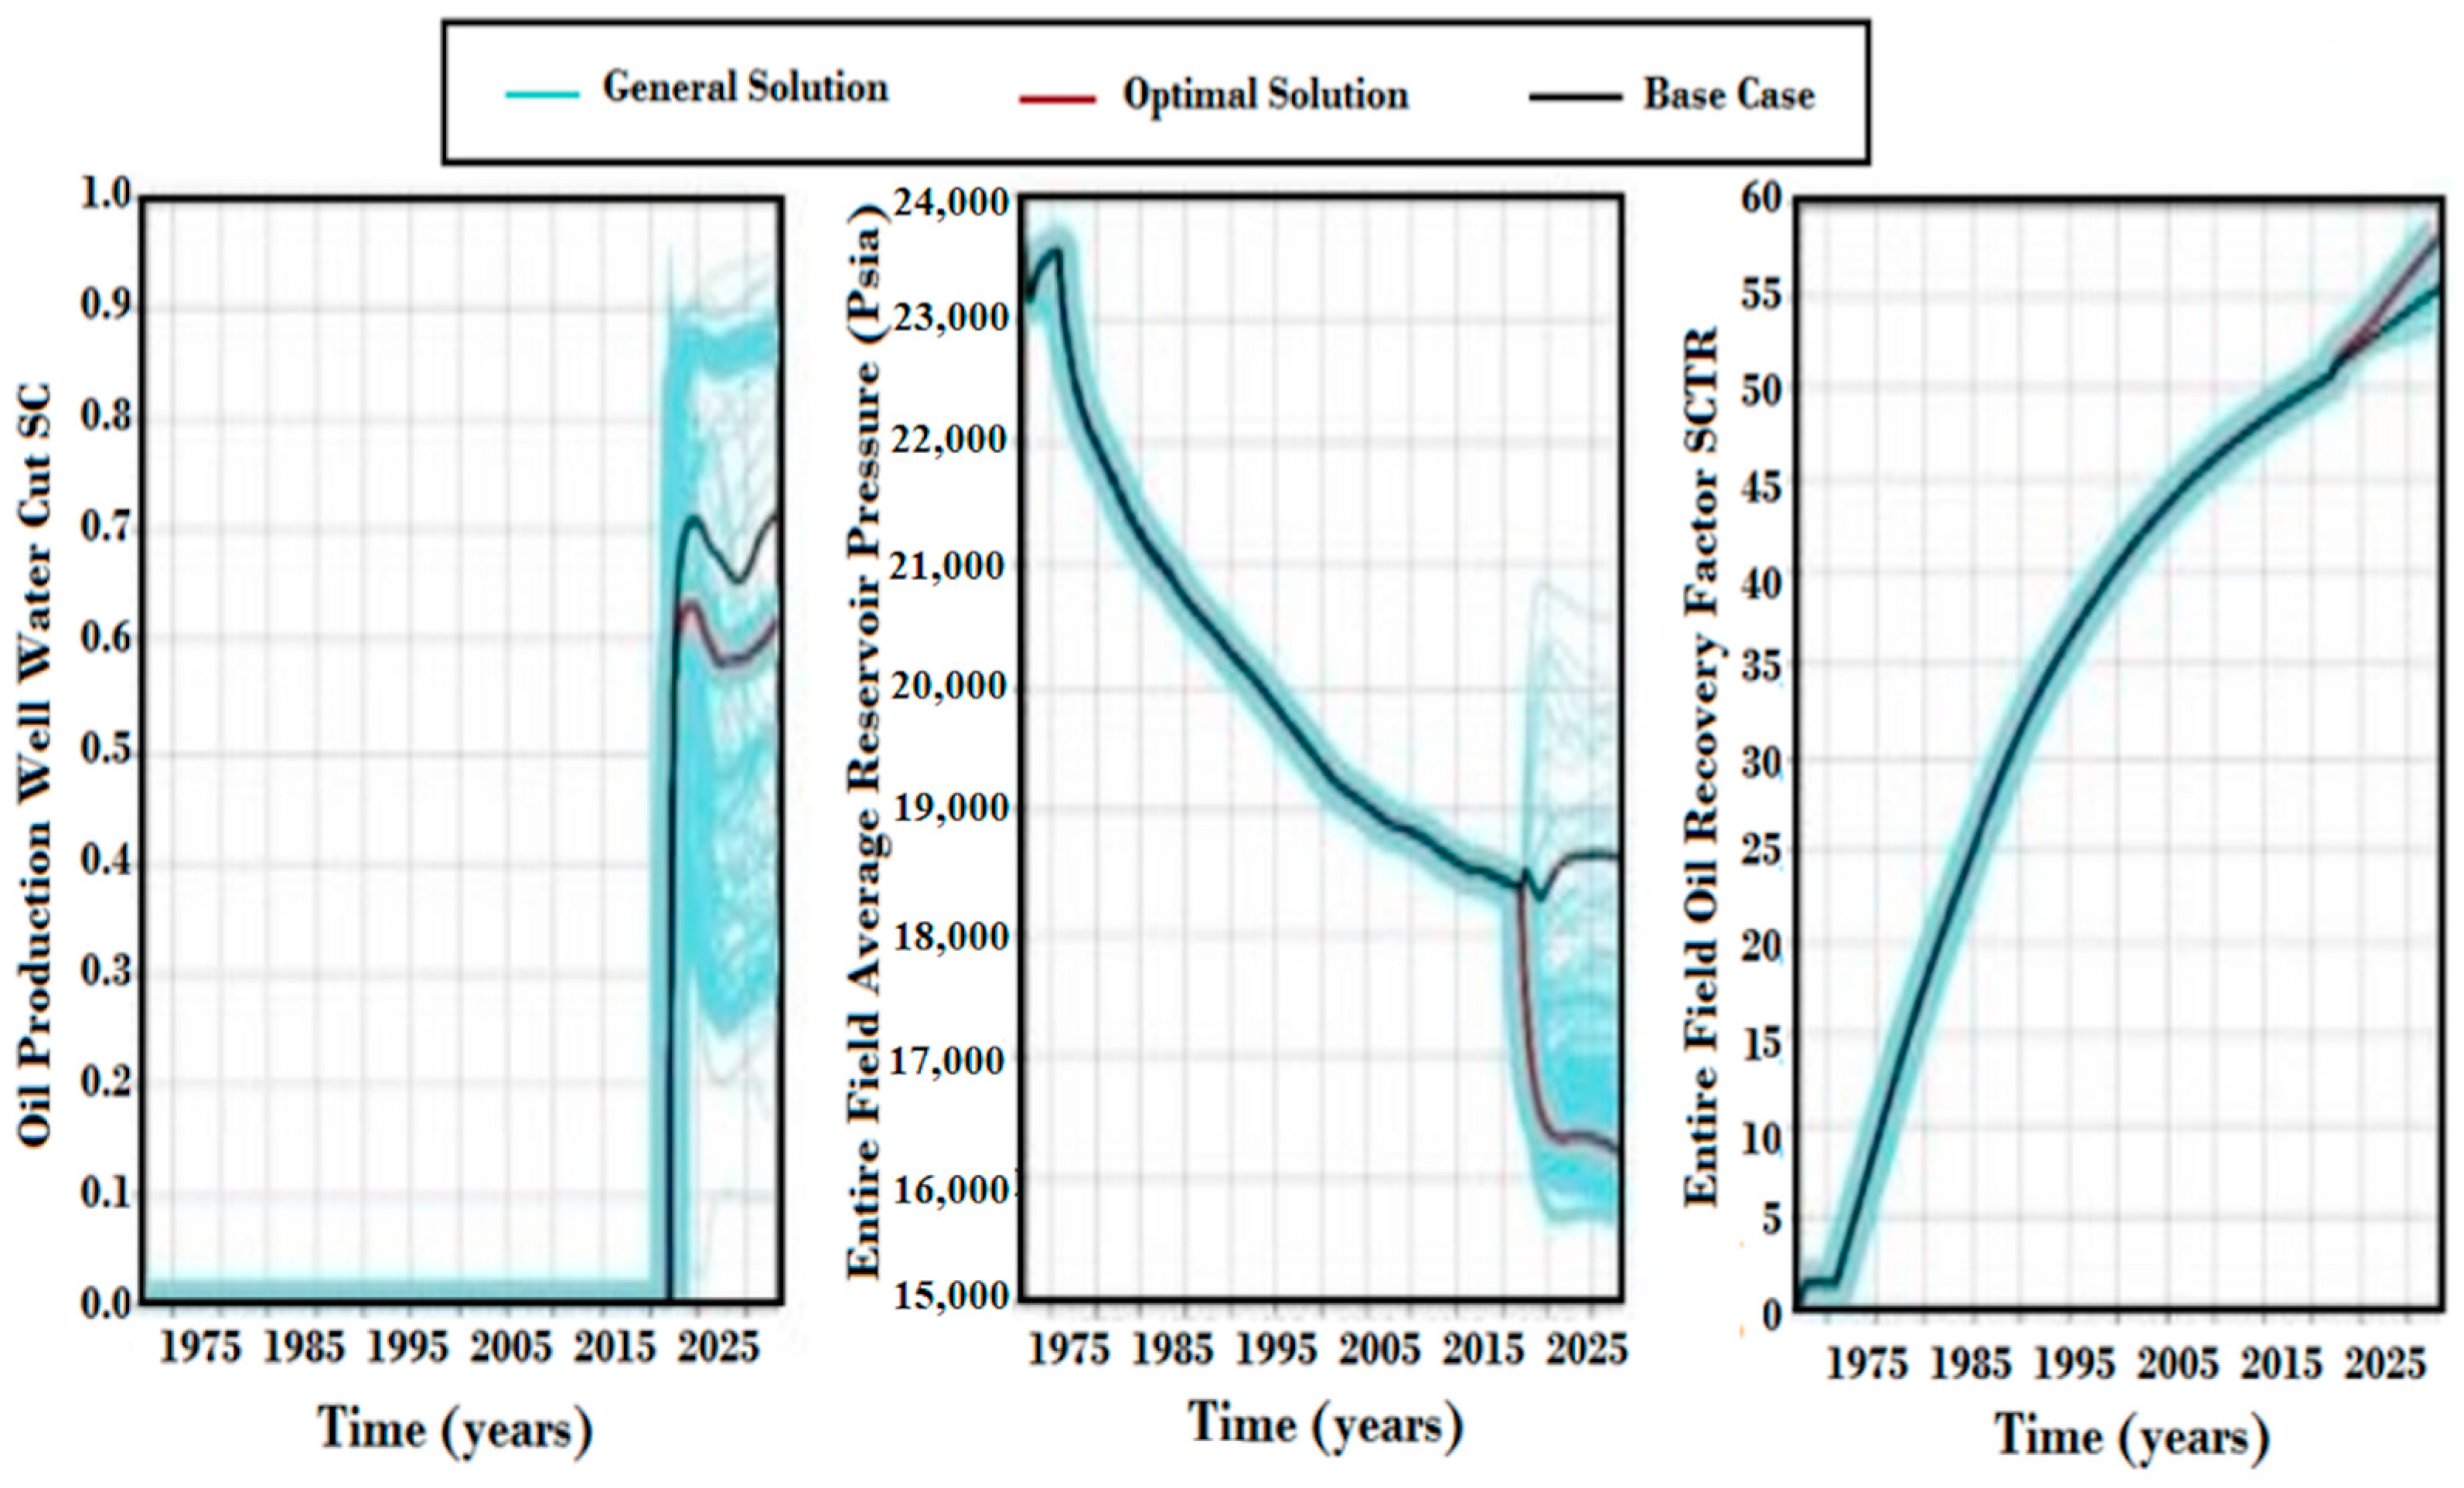
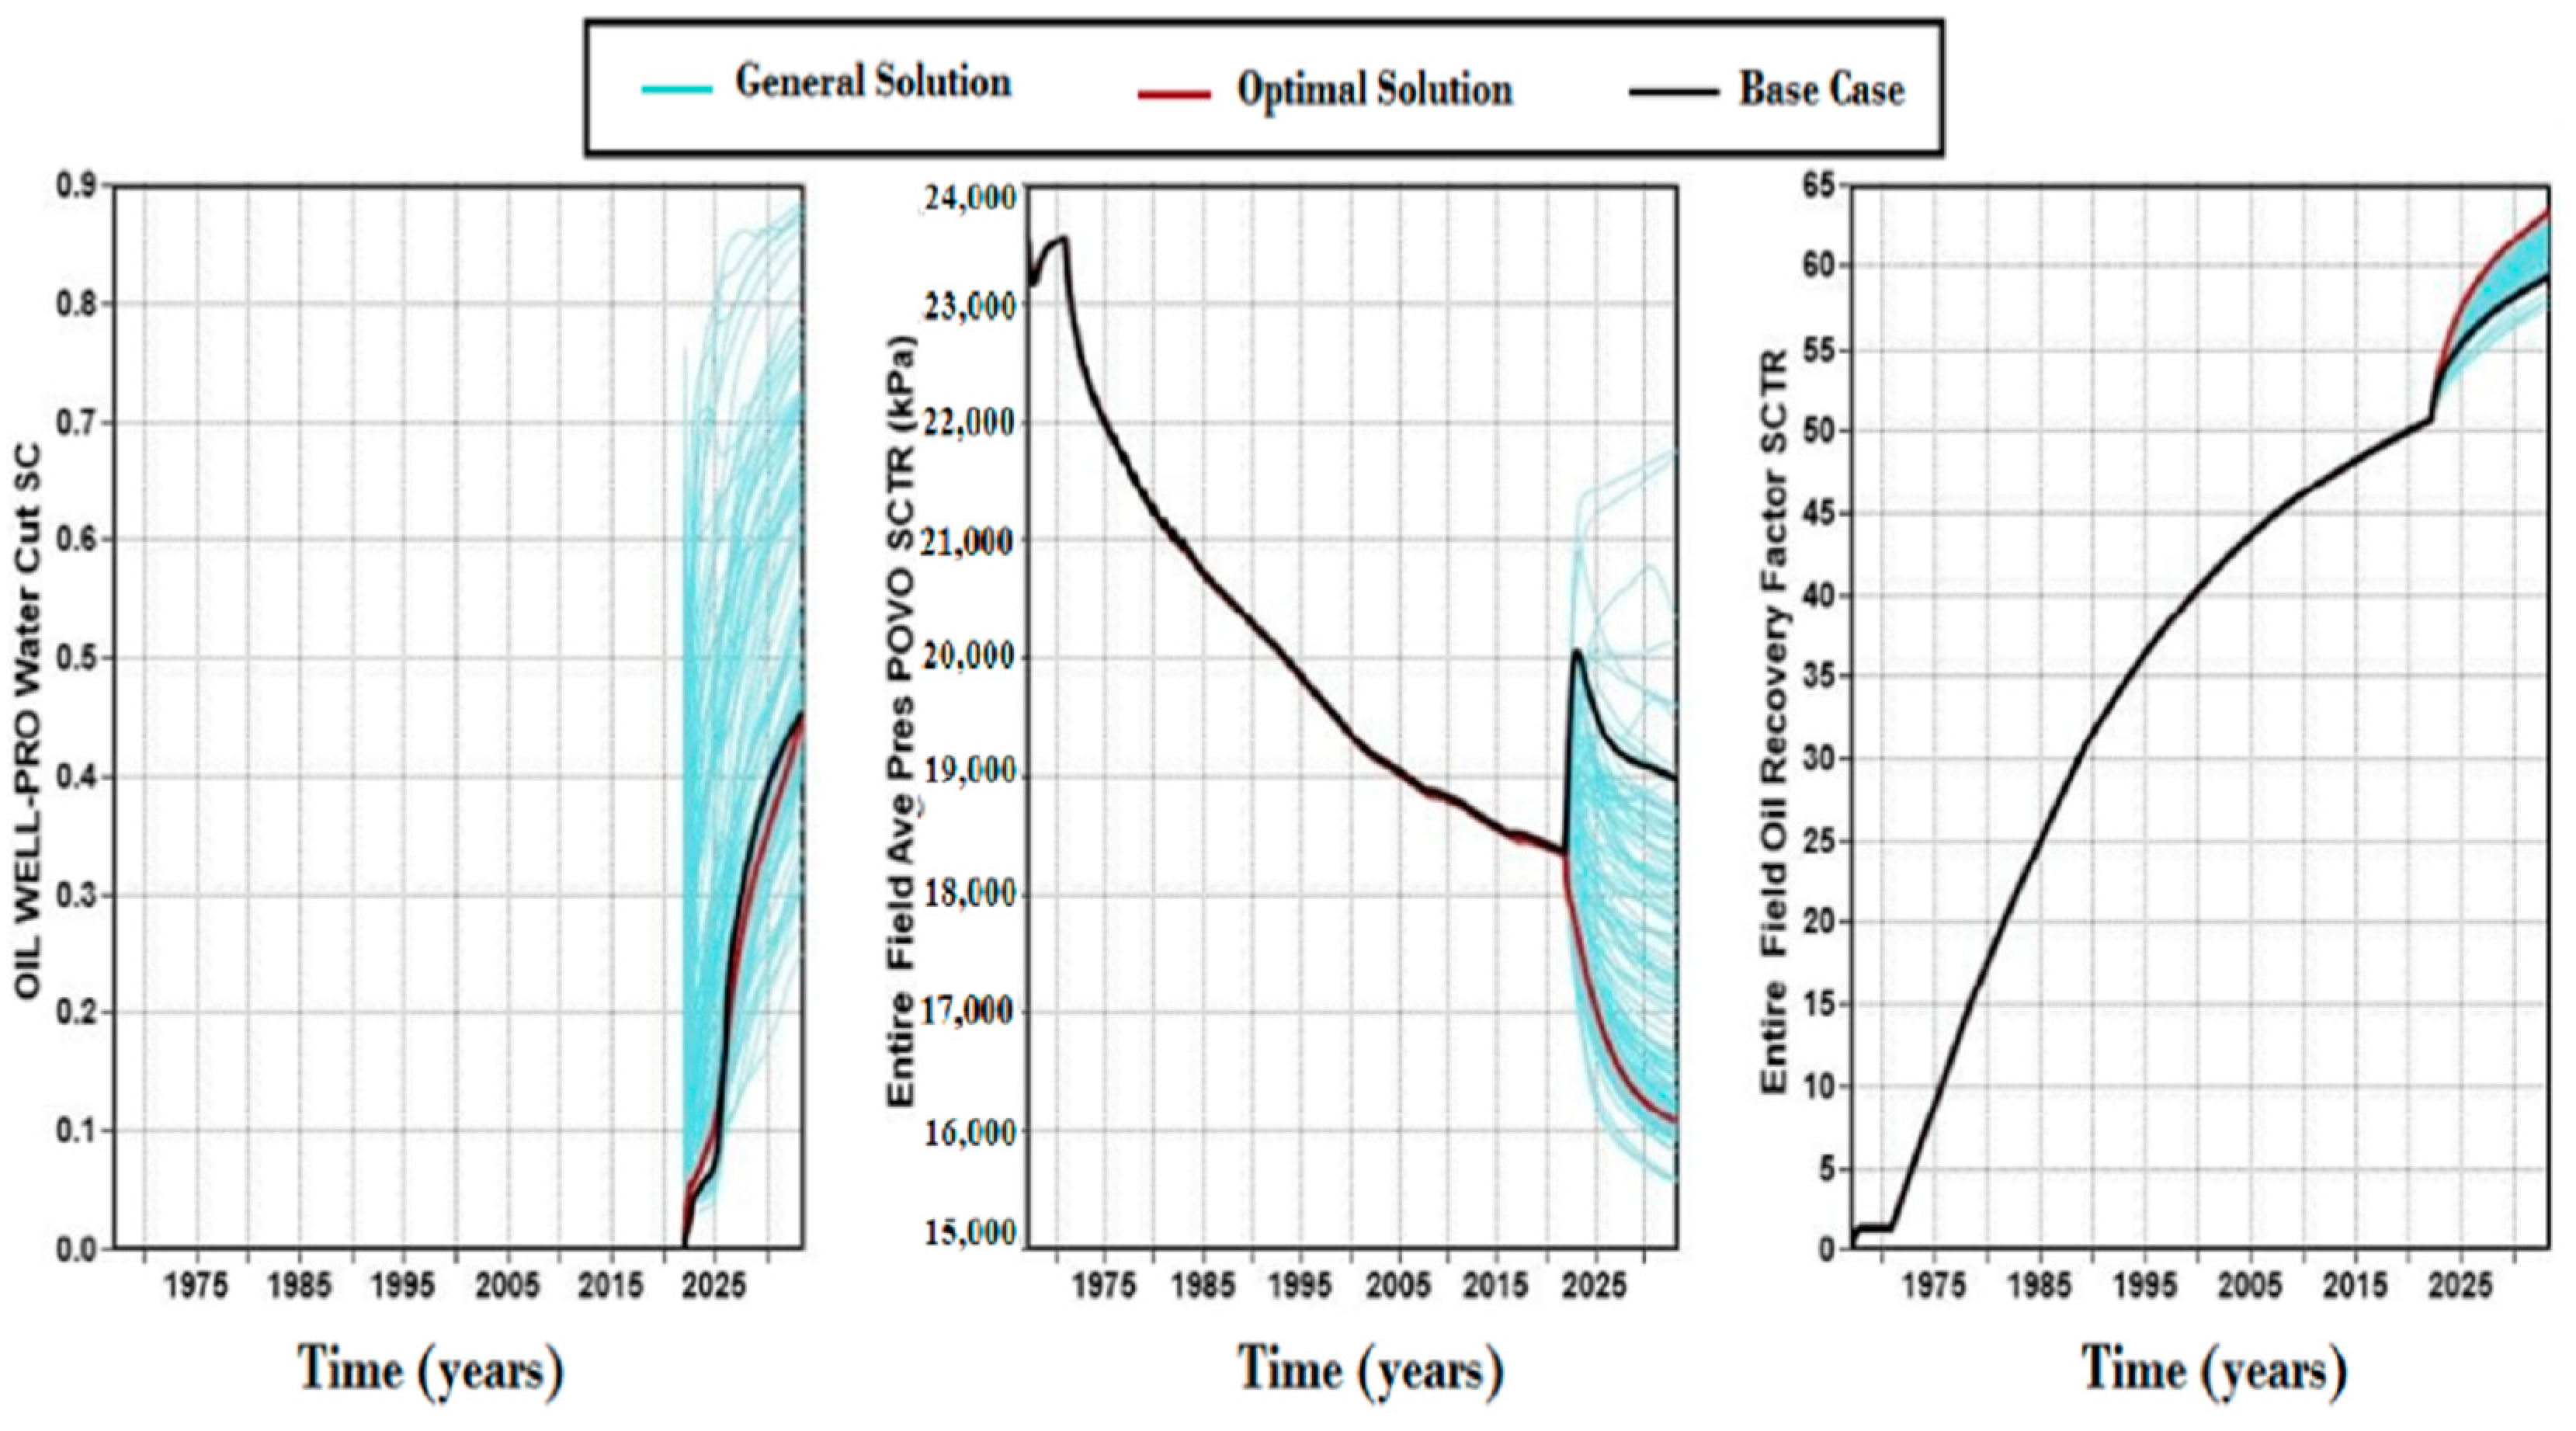
  • The TC-GDWS-AGD completions are effective in reducing water cut and increasing cumulative oil production. Cumulative oil was increased from 1.47 × 10⁶ m3 from the primary process to 1.6 × 10⁶ m3 from the best TC-GDWS-AGD case with an oil recovery factor of 0.58, whereas water cut decreased from 70% in the GAGD process to 57% in the best TC-GDWS-AGD case.
  • As the TC-GDWS-AGD gas-injection rate was enhanced from 350,000 m3 to 500,000 m3, the water cut decreased from 0.57 to 0.50. When the maximum surface-water-production rate (STW) constraint was raised to 20,000 m3/day, the PSO algorithm was able to find locations that achieved high oil recovery with the lowest overall water cut (0.45) for the two-TC-well cases.
  • The PSO algorithm was highly effective at identifying the optimum well completion locations for maximizing oil recovery and minimizing water cut in the studied reservoir. To achieve maximum reservoir coverage, for each simulated scenario, one well completion was placed to the right side of a surface location and one well to the left side.
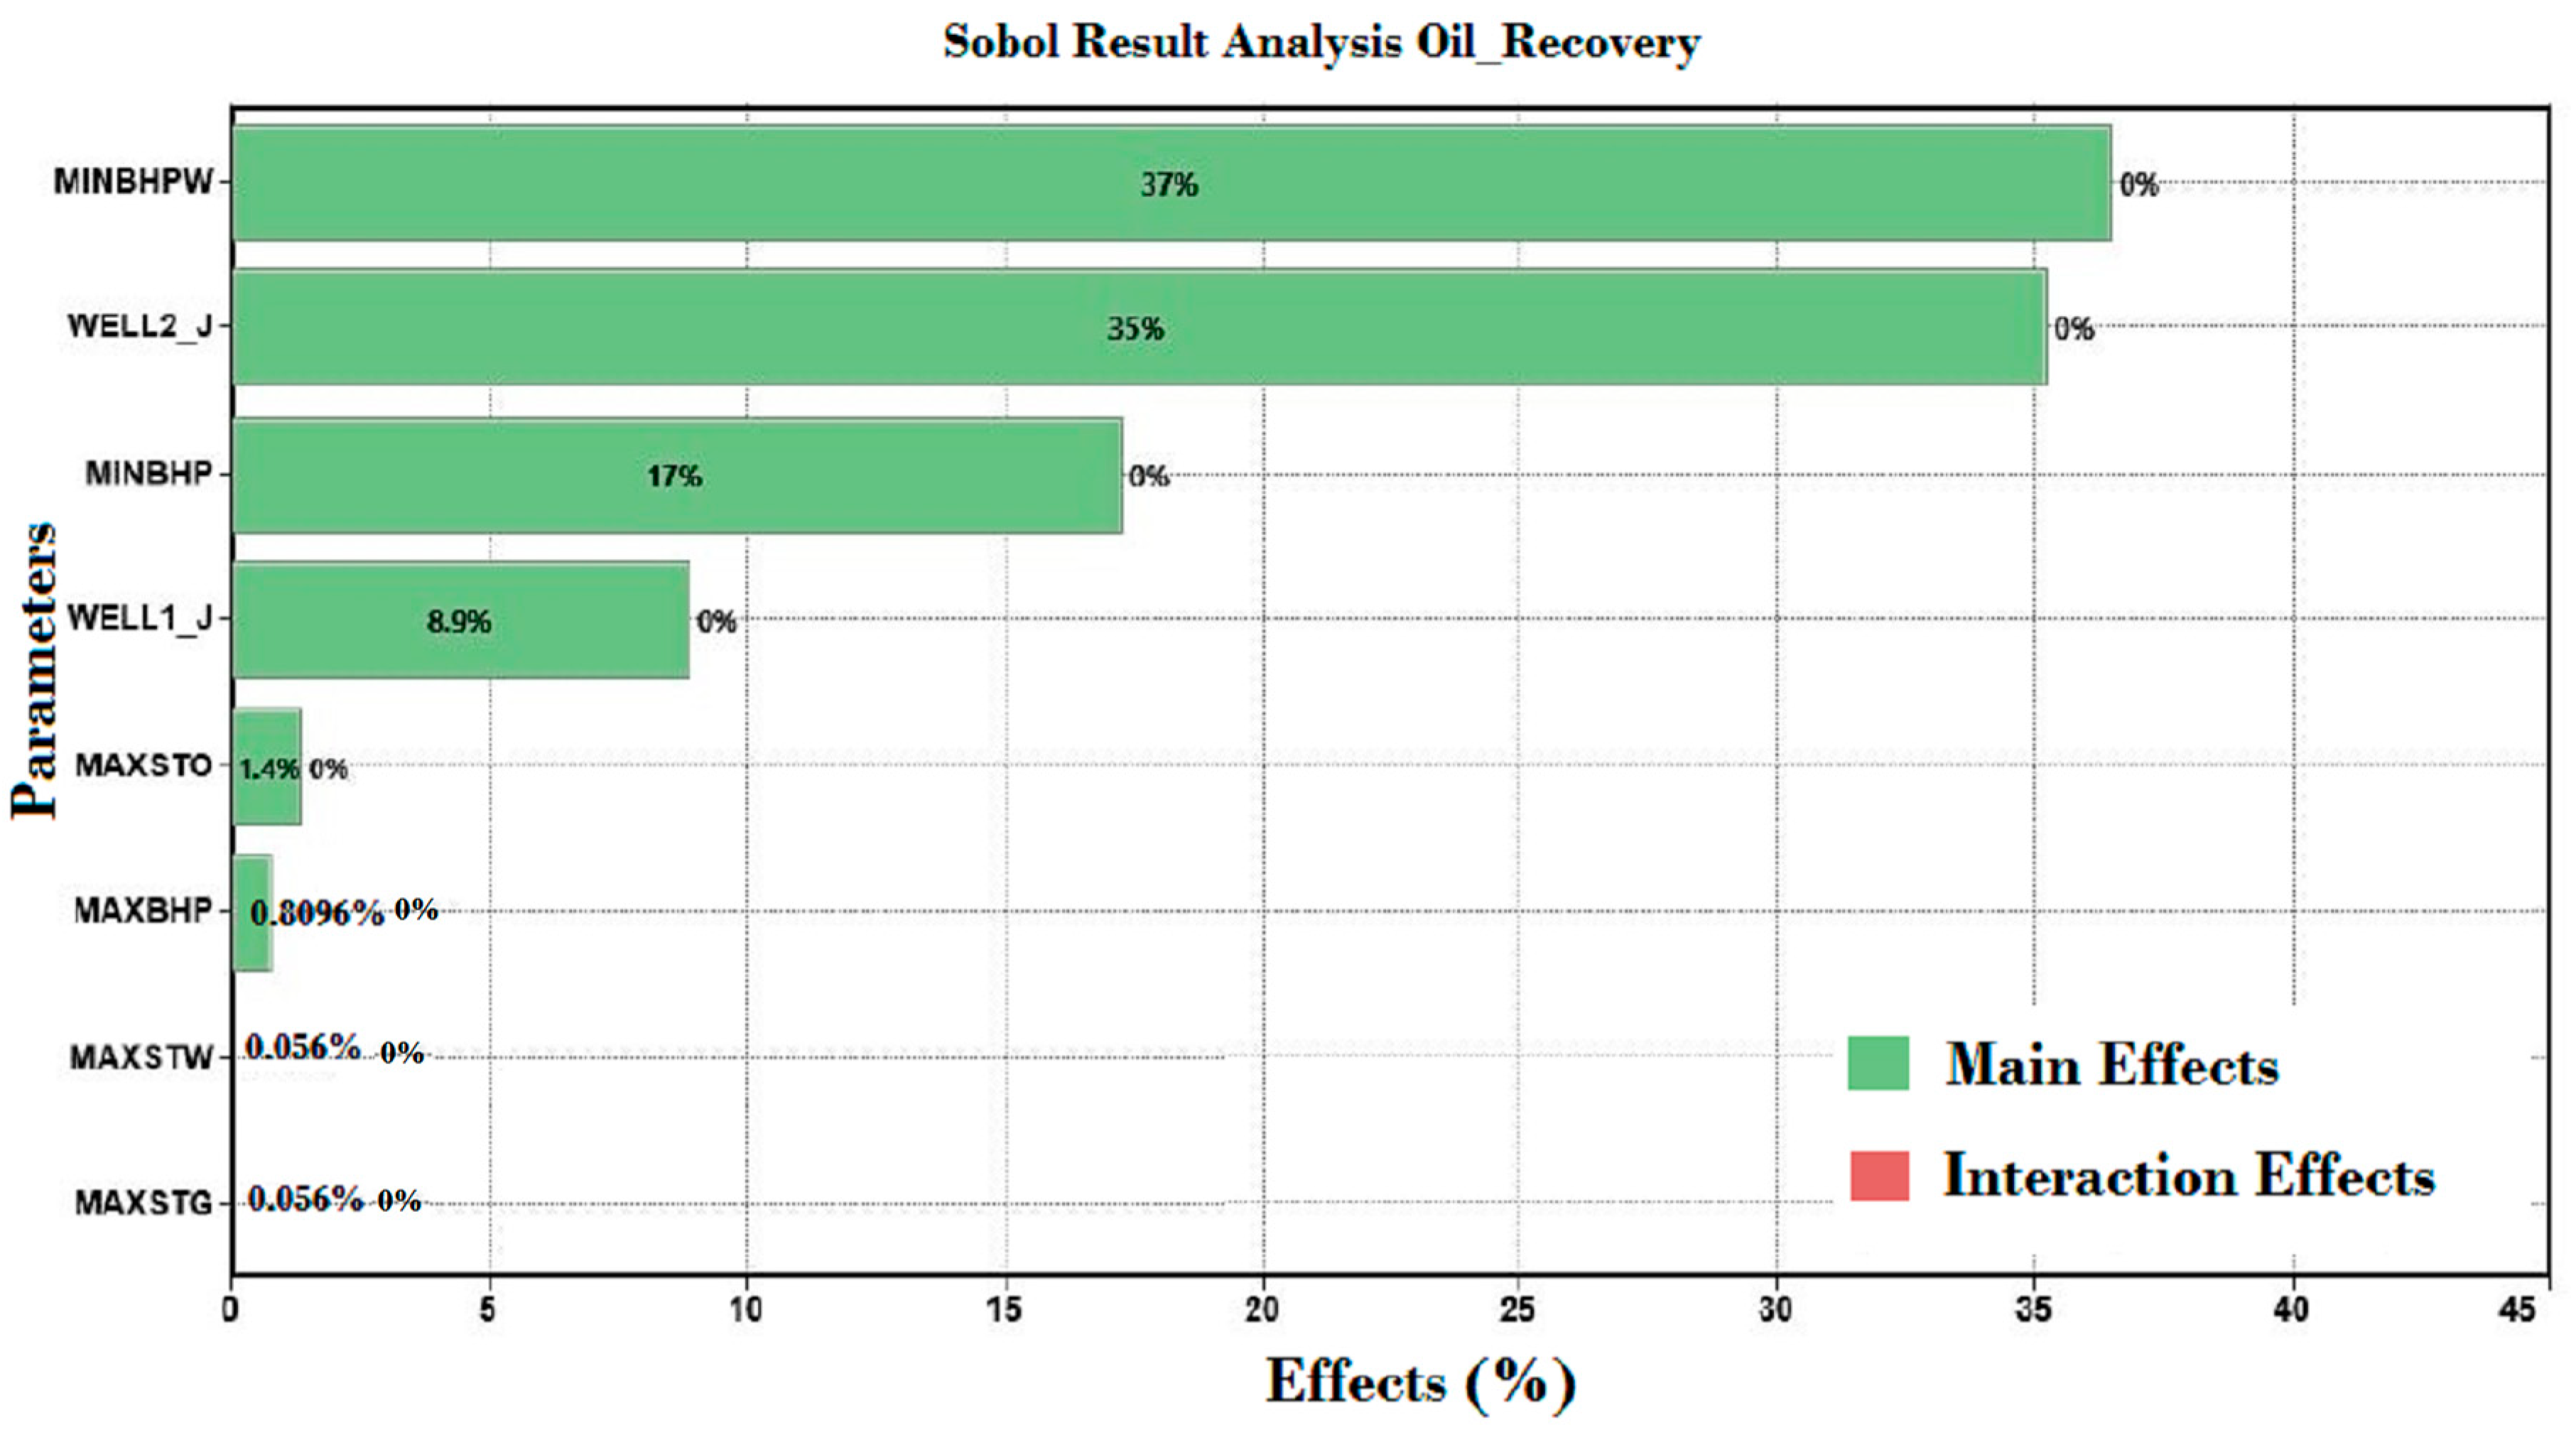
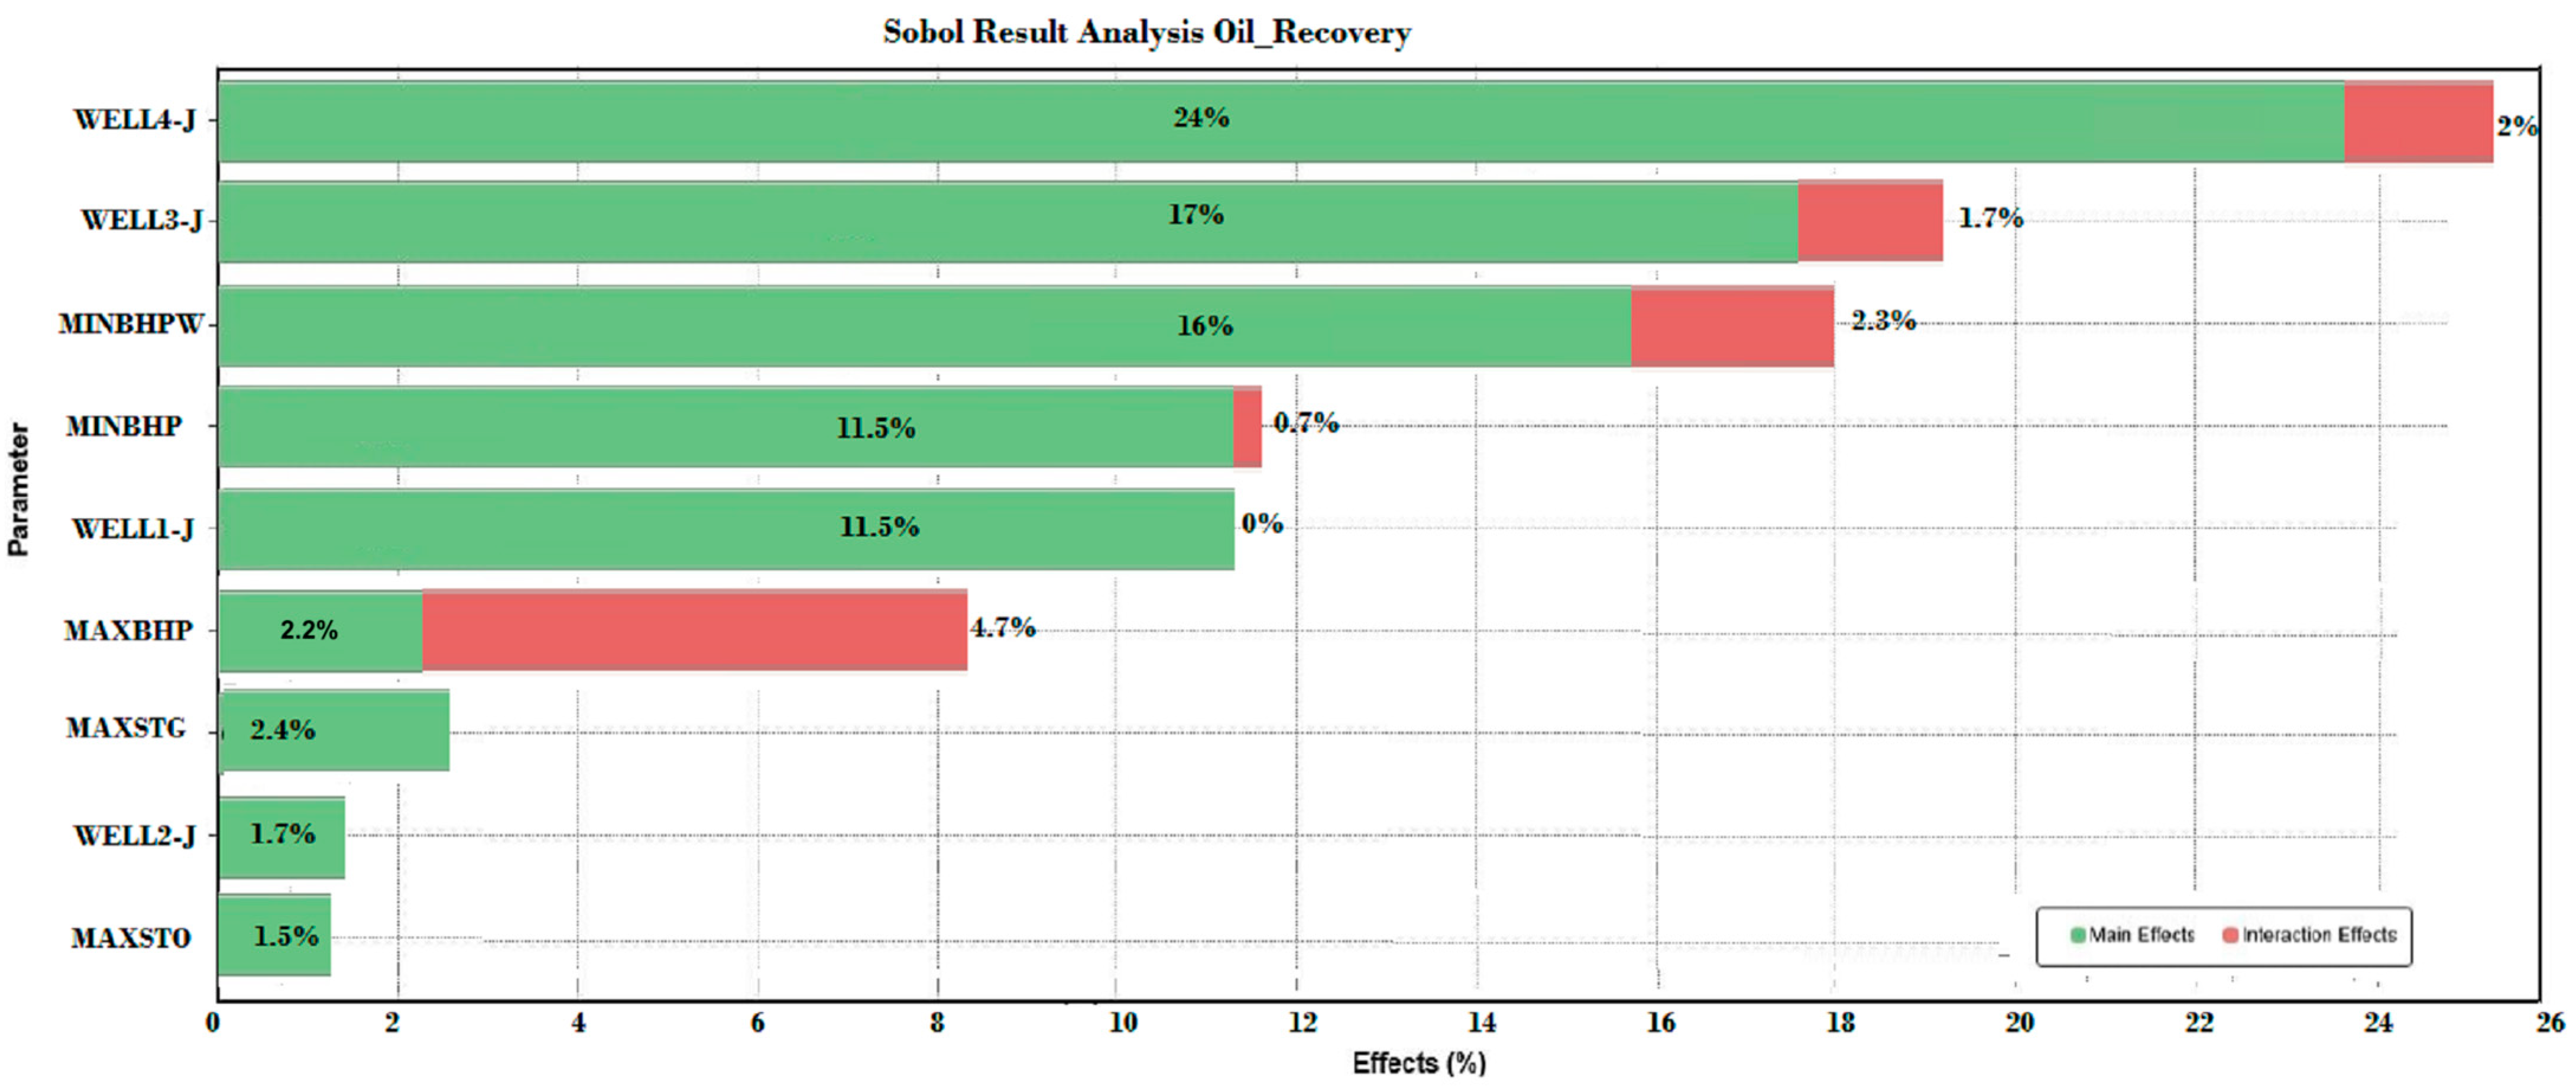
  • The gas injection rate (STG) had only a minor impact on oil recovery volumes because the permeability of the reservoir layer two was very low. In fact, the transfer of gas from reservoir layer one to reservoir layer three was found to decrease as the gas injection rate increased.

Author Contributions

Conceptualization, W.J.A.-M.; Methodology, W.J.A.-M. and A.K.W.; Software, W.J.A.-M.; Validation, D.A.W.; Formal analysis, D.A.W.; Investigation, D.A.W. and D.A.A.-O.; Resources, D.A.A.-O.; Writing—original draft, W.J.A.-M.; Writing—review & editing, D.A.W. and D.A.A.-O.; Supervision, A.K.W. All authors have read and agreed to the published version of the manuscript.

Funding

This research received no external funding.

Data Availability Statement

Data can be provided by contacting the corresponding author.

Conflicts of Interest

The authors declare no conflict of interest.

References

  1. Al-Azmi, N.H.; Aladwani, F.A.; Kasaraneni, P.R. Water Control Management Utilizing Downhole Water Sink Technology: Application of a Reservoir in the Middle East. In Proceedings of the SPE Kuwait Oil & Gas Show and Conference, Kuwait City, Kuwait, 16 October 2017. [Google Scholar] [CrossRef]
  2. Al-Mudhafar, W.J.; Rao, D. Lessons learned from the field-scale simulation of the gas-assisted gravity drainage GAGD process in heterogeneous sandstone oil reservoirs. In Proceedings of the SPE Western Regional Meeting, Bakersfield, CA, USA, 23–27 April 2017. [Google Scholar] [CrossRef]
  3. Rao, D.; Ayirala, S.; Kulkarni, M.; Sharma, A. Development of gas assisted gravity drainage (GAGD) process for improved light oil recovery. In Proceedings of the SPE/DOE Symposium on Improved Oil Recovery, Tulsa, OK, USA, 17–21 April 2004. [Google Scholar] [CrossRef]
  4. Al-Mudhafar, W.J.; Rao, D.N.; Srinivasan, S.; Wood, D.A. Bayesian averaging sensitivity analysis of reservoir heterogeneity and anisotropy of carbon dioxide assisted gravity drainage of a large clastic oil reservoir. Fuel 2023, 337, 127200. [Google Scholar] [CrossRef]
  5. Gugl, R.; Kharrat, R.; Shariat, A.; Ott, H. Evaluation of Gas-Based EOR Methods in Gas-Invaded Zones of Fractured Carbonate Reservoir. Energies 2022, 15, 4921. [Google Scholar] [CrossRef]
  6. Sorokin, A.; Bolotov, A.; Varfolomeev, M.; Minkhanov, I.; Gimazov, A.; Sergeyev, E.; Balionis, A. Feasibility of Gas Injection Efficiency for Low-Permeability Sandstone Reservoir in Western Siberia: Experiments and Numerical Simulation. Energies 2021, 14, 7718. [Google Scholar] [CrossRef]
  7. Al-Ghanim, W.; Gharbi, R.; Algharaib, M.K. Designing a simultaneous water alternating gas process for optimizing oil recovery. In Proceedings of the SPE EUROPEC/EAGE Conference and Exhibition, Amsterdam, The Netherlands, 8–11 June 2009. [Google Scholar] [CrossRef]
  8. Mahmoud, T.N.; Rao, D.N. Mechanisms and Performance Demonstration of the Gas-Assisted Gravity-Drainage Process Using Visual Models. In Proceedings of the SPE Annual Technical Conference and Exhibition, Anaheim, CA, USA, 11–14 November 2007. [Google Scholar] [CrossRef]
  9. Vo Thanh, H.; Sugai, Y.; Nguele, R.; Sasaki, K. Robust Optimization of CO2 Sequestration through a Water Alternating Gas Process under Geological Uncertainties in Cuu Long Basin, Vietnam. J. Nat. Gas Sci. Eng. 2020, 76, 103208. [Google Scholar] [CrossRef]
  10. Munawar, M.D.; Rao, D.; Khan, M. Evaluation of Gas Assisted Gravity Drainage (GAGD) Using CO2 in a Limestone Formation through Compositional Simulation. In Proceedings of the SPE/PAPG Pakistan Section Annual Technical Conference and Exhibition, Islamabad, Pakistan, 22–23 November 2017. [Google Scholar] [CrossRef]
  11. Baruah, N.; Mandal, D.; Jena, S.S.; Sahu, S.K. Gas Assisted Gravity Drainage GAGD for Improving Recovery from a Field in North-East India. In Proceedings of the SPE Oil and Gas India Conference and Exhibition, Mumbai, India, 11 April 2019. [Google Scholar] [CrossRef]
  12. Al-Obaidi, D.A.; Al-Jawad, M.S. Immiscible CO2-Assisted Gravity Drainage Process for Enhancing Oil Recovery in Bottom Water Drive reservoir. Assoc. Arab. Univ. J. Eng. Sci. 2020, 27, 60–66. [Google Scholar] [CrossRef]
  13. Al-Mudhafar, W.J.; Rao, D.N. Proxy-based metamodeling optimization of the gas-assisted gravity drainage GAGD process in heterogeneous sandstone reservoirs. In Proceedings of the SPE Western Regional Meeting, Bakersfield, CA, USA, 23–27 April 2017. [Google Scholar] [CrossRef]
  14. Al-Mudhafar, W.J.; Al-Obaidi, D.A.; Saini, D.; Wojtanowicz, A.K.; Al-Jawad, M.S. Feasibility of the Gas and Downhole Water Sink-Assisted Gravity Drainage (GDWS-AGD) Process to Enhance the Recovery of Oil in Reservoirs with Strong Aquifer. In Macromolecular Characterization of Hydrocarbons for Sustainable Future. Green Energy and Technology; Springer: Singapore, 2021; pp. 91–106. [Google Scholar] [CrossRef]
  15. Al-Obaidi, D.A.; Al-Mudhafar, W.J.; Al-Jawad, M.S. Experimental evaluation of Carbon Dioxide-Assisted Gravity Drainage process (CO2-AGD) to improve oil recovery in reservoirs with strong water drive. Fuel 2022, 324, 124409. [Google Scholar] [CrossRef]
  16. Al-Mudhafar, W.J.; Rao, D.N.; Srinivasan, S.; Thanh, H.V.; Al Lawe, E.M. Rapid Evaluation and Optimization of Carbon Dioxide-enhanced Oil Recoveryusing Reduced-physics Proxy Models. Energy Sci. Eng. 2022, 10, 4112–4135. [Google Scholar] [CrossRef]
  17. Al-Mudhafar, W.J.; Wojtanowicz, A.K.; Rao, D.N. Hybrid Process of Gas and Downhole Water Sink-Assisted Gravity Drainage (G&DWS-AGD) to Enhance Oil Recovery in Reservoirs with Water Coning. In Proceedings of the Carbon Management Technology Conference, Houston, TX, USA, 17–20 July 2017. [Google Scholar] [CrossRef]
  18. Al-Mudhafar, W.J.; Wojtanowicz, A.K.; Rao, D.N. Gas and Downhole Water Sink-Assisted Gravity Drainage GDWS-AGD EOR Process: Field-Scale Evaluation and Recovery Optimization. In Proceedings of the SPE Improved Oil Recovery Conference, Tulsa, OK, USA, 18 April 2018. [Google Scholar] [CrossRef]
  19. Al-Mudhafar, W.J.; Wojtanowicz, A.K. A Comparison Simulation Study of GDWS-AGD EOR Process Performance Using CO2/APG Alternatives in South Rumaila Oil Field, Iraq. In Proceedings of the SPE Improved Oil Recovery Conference, Tulsa, Oklahoma, USA, 31 August–4 September 2020. [Google Scholar] [CrossRef]
  20. Al-Obaidi, D.A.; Al-Jawad, M.S. Numerical Simulation of Immiscible CO2-Assisted Gravity Drainage Process to Enhance Oil Recovery. Iraqi J. Sci. 2020, 61, 2004–2016. [Google Scholar] [CrossRef]
  21. Jupriansyah, J. An Integrated Study of Water Coning Control with Downhole Water Sink Completion Approaches in Multilayered-Strong Water Drive Reservoir to Improve Oil Recovery. In Proceedings of the SPE Oil and Gas India Conference and Exhibition, Mumbai, India, 20–22 January 2010. [Google Scholar] [CrossRef]
  22. Rajabi-Kochi, M.; Khamehchi, E. Integrated production optimization of an oil field based on constructing of a proxy model using DOE methods. J. Pet. Explor. Prod. Technol. 2020, 10, 2465–2482. [Google Scholar] [CrossRef]
  23. Ding, S.; Lu, R.; Xi, Y.; Liu, G.; Ma, J. Efficient well placement optimization coupling hybrid objective function with particle swarm optimization algorithm. Appl. Soft Comput. 2020, 95, 106511. [Google Scholar] [CrossRef]
  24. Raji, S.; Dehnamaki, A.; Somee, B.; Mahdiani, M.R. A new approach in well placement optimization using metaheuristic algorithms. J. Pet. Sci. Eng. 2022, 215, 110640. [Google Scholar] [CrossRef]
  25. Yousefzadeh, R.; Ahmadi, M.; Kazemi, A. Toward investigating the application of reservoir opportunity index in facilitating well placement optimization under geological uncertainty. J. Pet. Sci. Eng. 2022, 215, 110709. [Google Scholar] [CrossRef]
  26. Arouri, Y.; Ciaurri, D.E.; Sayyafzadeh, M. A study of simulation-based surrogates in well-placement optimization for hydrocarbon production. J. Pet. Sci. Eng. 2022, 216, 110639. [Google Scholar] [CrossRef]
  27. Zou, A.; Ye, T.; Volkov, O.; Durlofsky, L.J. Effective treatment of geometric constraints in derivative-free well placement optimization. J. Pet. Sci. Eng. 2022, 215, 110635. [Google Scholar] [CrossRef]
  28. Salehian, M.; Sefat, M.H.; Muradov, K. Multi-solution well placement optimization using ensemble learning of surrogate models. J. Pet. Sci. Eng. 2022, 210, 110076. [Google Scholar] [CrossRef]
  29. Zoeir, A.; Riazi, M.; Kazemzadeh, Y.; Khodapanah, E. To optimize well pattern during miscible gas injection process via heuristic techniques. J. Pet. Sci. Eng. 2022, 208, 109786. [Google Scholar] [CrossRef]
  30. Montes, G.; Bartolome, P.; Udias, A.L. The use of genetic algorithms in well placement optimization. In Proceedings of the SPE Latin American and Caribbean petroleum engineering conference, Buenos Aires, Argentina, 25–28 March 2001. [Google Scholar] [CrossRef]
  31. Yeten, B.; Durlofsky, L.J.; Aziz, K. Optimization of nonconventional well type, location, and trajectory. SPE J. 2003, 8, 200–210. [Google Scholar] [CrossRef]
  32. Lyons, J.; Nasrabadi, H. Well placement optimization under time-dependent uncertainty using an ensemble Kalman filter and a genetic algorithm. J. Pet. Sci. Eng. 2013, 109, 70–79. [Google Scholar] [CrossRef]
  33. Emerick, A.A.; Silva, E.; Messer, B.; Almeida, L.F.; Szwarcman, D.; Pacheco, M.A.C.; Vellasco, M.M.B.R. Well placement optimization using a genetic algorithm with nonlinear constraints. In Proceedings of the SPE Reservoir Simulation Symposium, The Woodlands, TX, USA, 2–4 February 2009. [Google Scholar] [CrossRef]
  34. Aliyev, E. Use of Hybrid Approaches and Metaoptimization for Well Placement Problems. Ph.D. Dissertation, Stanford University, Stanford, CA, USA, 2011. [Google Scholar]
  35. Humphries, T.D.; Haynes, R.D.; James, L.A. Simultaneous and sequential approaches to joint optimization of well placement and control. Comput. Geosci. 2014, 18, 433–448. [Google Scholar] [CrossRef]
  36. Rahman, I.; Vasant, P.; Singh, B.S.M.; Al-Wadud, A.M. Hybrid particle swarm and gravitational search optimization techniques for charging plug-in hybrid electric vehicles. In Sustainable Infrastructure: Breakthroughs in Research and Practice; IGI Global: Hershey, PA, USA, 2020; pp. 195–228. [Google Scholar] [CrossRef]
  37. Vo Thanh, H.; Zamanyad, A.; Safaei-Farouji, M.; Ashraf, U.; Hemeng, Z. Application of Hybrid Artificial Intelligent Models to Predict Deliverability of Underground Natural Gas Storage Sites. Renew. Energy 2022, 200, 169–184. [Google Scholar] [CrossRef]
  38. Morales, A.; Nasrabadi, H.; Zhu, D. A modified genetic algorithm for horizontal well placement optimization in gas condensate reservoirs. In Proceedings of the SPE Annual Technical Conference and Exhibition, Florence, Italy, 20–22 September 2010. [Google Scholar] [CrossRef]
  39. Chang, Y.; Bouzarkouna, Z.; Devegowda, D. Multi-objective optimization for rapid and robust optimal oilfield development under geological uncertainty. Comput. Geosci. 2015, 19, 933–950. [Google Scholar] [CrossRef]
  40. Saikia, B.D.; Rao, D.N. A Single-Well Gas-Assisted Gravity Drainage Enhanced Oil Recovery Process for US Deepwater Gulf of Mexico Operations. Energies 2021, 14, 1743. [Google Scholar] [CrossRef]
  41. Al-Tammimi, M.A.; Al-Maliki, S.Y.; Alabody, M.J.; Al-Mudhafar, W.J.; Wood, D.A.; Wojtanowicz, A.K. Development of A Multi-Completion-Gas and Downhole Water Sink-Assisted Gravity Drainage MC-GDWS-AGD Process to Enhance Oil Recovery and Reduce Water Cresting in Reservoirs with Strong Water Aquifers. In Proceedings of the Offshore Technology Conference, Houston, TX, USA, 5 May 2022. [Google Scholar] [CrossRef]
  42. Al-Obaidi, D.A.; Wood, D.A.; Al-Mudhafar, W.J.; Wojtanowicz, A.K.; Merzoug, A. Development of A Multi-Completion-Gas and Downhole Water Sink-Assisted Gravity Drainage (MC-GDWS-AGD) Process to Improve Oil Recovery and Reduce Water Cut in Reservoirs with Strong Water Aquifers. In Proceedings of the SPE Oklahoma City Oil and Gas Symposium, Oklahoma City, OK, USA, 17–19 April 2023. [Google Scholar] [CrossRef]
  43. Floris, F.J.T.; Bush, M.D.; Cuypers, M.; Roggero, F.; Syversveen, A.-R. Methods for quantifying the uncertainty of production forecasts: A comparative study. Pet. Geosci. 2001, 7, S87–S96. [Google Scholar] [CrossRef]
  44. Hutahaean, J.; Demyanov, V.; Christie, M. Reservoir development optimization under uncertainty for infill well placement in brownfield redevelopment. J. Pet. Sci. Eng. 2019, 175, 444–464. [Google Scholar] [CrossRef]
  45. Roque, W.L.; Araújo, C.P. Production simulations based on a productivity potential proxy function: An application to UNISIM-I-D and PUNQ-S3 synthetic reservoirs. J. Petrol. Explor. Prod. Technol. 2021, 11, 399–410. [Google Scholar] [CrossRef]
  46. CMG. Manual of the Computer Modeling Group’s Reservoir Flow Simulator; Version 2015.10; CMG: Calgary, AB, Canada, 2015. [Google Scholar]
  47. Onwunalu, J.E.; Durlofsky, L.J. Application of a particle swarm optimization algorithm for determining optimum well location and type. Comput. Geosci. 2010, 14, 183–198. [Google Scholar] [CrossRef]
  48. Sayyad, H.; Manshad, A.K.; Rostami, H. Application of hybrid neural particle swarm optimization algorithm for prediction of MMP. Fuel 2014, 116, 625–633. [Google Scholar] [CrossRef]
  49. Ansari, E.; Hughes, R.; White, C.D. Well placement optimization for maximum energy recovery from hot saline aquifers. In Proceedings of the Thirty-Ninth Workshop on Geothermal Reservoir Engineering, Stanford, CA, USA, 24–26 February 2014; Available online: https://pangea.stanford.edu/ERE/pdf/IGAstandard/SGW/2014/Ansari.pdf (accessed on 1 December 2022).
  50. Atashnezhad, A.; Wood, D.A.; Fereidounpour, A.; Khosravanian, R. Designing and optimizing deviated wellbore trajectories using novel particle swarm algorithms. J. Nat. Gas Sci. Eng. 2014, 21, 1184–1204. [Google Scholar] [CrossRef]
  51. Ebrahimi, A.; Khamehchi, E. Developing a novel workflow for natural gas lift optimization using advanced support vector machine. J. Nat. Gas Sci. Eng. 2016, 28, 626–638. [Google Scholar] [CrossRef]
  52. Al-Mudhafar, W.J. Polynomial and nonparametric regressions for efficient predictive proxy metamodeling: Application through the CO2-EOR in shale oil reservoirs. J. Nat. Gas Sci. Eng. 2019, 72, 103038. [Google Scholar] [CrossRef]
  53. Mohamed, L.; Christie, M.; Demyano, V. History matching and uncertainty quantification: Multiobjective particle swarm optimisation approach. In Proceedings of the SPE EUROPEC/EAGE Annual Conference and Exhibition, Vienna, Austria, 23–26 May 2011. [Google Scholar] [CrossRef]
  54. Eberhart, R.; Kennedy, J. A new optimizer using particle swarm theory. In Proceedings of the Sixth International Symposium on Micro Machine and Human Science, Nagoya, Japan, 4–6 October 1995. [Google Scholar]
  55. Reddicharla, N. Automation of Down-hole Completion Data Management Workflow and Visualization. In Proceedings of the Abu Dhabi International Petroleum Exhibition and Conference, Abu Dhabi, United Arab Emirates, 9–12 November 2015. [Google Scholar] [CrossRef]
  56. Dyer, S.; Brett, B. Technology Update: New Intelligent Completion System Enables Compartment-Level Control in Multilateral Wells. J. Pet. Technol. 2016, 68, 18–21. [Google Scholar] [CrossRef]
Figure 1. Schematic illustration of the GAGD process.
Energies 16 01790 g001
Figure 2. GDWS-AGD gas injector, oil-, and water-producer well configurations.
Energies 16 01790 g002
Figure 3. Schematic representation of the triple completions involved in a typical TC-GDWS-AGD-configured wellbore.
Energies 16 01790 g003
Figure 4. PUNQ-S3 top structure map and reservoir well locations [43].
Energies 16 01790 g004
Figure 5. PUNQ-S3 reservoir grid positions of gas-injection, oil- and water-production completions.
Energies 16 01790 g005
Figure 6. Cumulative oil production and daily oil production rate generated by TC-GDWS-AGD, GDWS-AGD, GAGD, and primary (base-case) PUNQ-S3 simulations.
Energies 16 01790 g006
Figure 7. Water cut expressed by year in standard conditions for the TC-GDWS-AGD, GDWS-AGD, GAGD, and primary (base-case) PUNQ-S3 simulations.
Energies 16 01790 g007
Figure 8. Average reservoir pressure expressed by year for the TC-GDWS-AGD, GDWS-AGD, GAGD, and primary (base-case) PUNQ-S3 simulations.
Energies 16 01790 g008
Figure 9. Oil-recovery factor expressed by year for the TC-GDWS-AGD, GDWS-AGD, GAGD, and primary (base-case) PUNQ-S3 simulations.
Energies 16 01790 g009
Figure 10. Well location optimization—scenario 1 for the PUNQ-S3 reservoir simulated with the TC-GDWS-AGD configuration.
Energies 16 01790 g010
Figure 11. PSO optimal flow responses for the five hundred simulation cases evaluated. Left: oil well water cut; middle: average reservoir pressure; and right: oil recovery factor.
Energies 16 01790 g011
Figure 12. Sobol analysis results distinguishing the most influential decision variables affecting the TC-GDWS-AGD simulation cases evaluated by PSO.
Energies 16 01790 g012
Figure 13. PSO-derived optimum water cut solution resulting from the evaluation of five hundred simulation cases. Left: oil well water cut; middle: average reservoir pressure; and right: oil recovery factor.
Energies 16 01790 g013
Figure 14. Well locations in PUNQ reservoir for TC-GDWS-AGD.
Energies 16 01790 g014
Figure 15. PSO-optimal flow responses considering 500 cases for scenario 2. Left: oil well water cut; middle: average reservoir pressure; and right: oil recovery factor.
Energies 16 01790 g015
Figure 16. Sobol most influential decision variables affecting the TC-GDWS process performance using PSO, scenario 2.
Energies 16 01790 g016
Table 1. PUNQ-S3 average of key parameters for each reservoir layer (Al-Mudhafar et al., 2021 [14]).
Reservoir CharacteristicReservoir
Layer 1
Reservoir
Layer 2
Reservoir
Layer 3
Reservoir
Layer 4
Reservoir
Layer 5
Average Porosity (ϕ%)0.170.080.170.160.19
Average Horizontal Permeability (Kh mD)43233432196654
Average Vertical Permeability(Kv mD)1371313764205
Table 2. Well-related constraints applied to the TC-GDWS-AGD, GDWS-AGD, and GAGD EOR cases and the primary base production case for the PUNQ-S3 simulations evaluated.
Well TypeConstraintsTC-GDWS-AGDGDWS-AGDGAGDPrimary
(Base Case)
Gas InjectorMAX STG350,000 m3/day350,000 m3/day350,000 m3/day-
MAX BHP28,000 kpa28,000 kpa28,000 kpa-
Oil ProducerMAX STO800 m3/day800 m3/day800 m3/day800 m3/day
MIN BHP12,000 kpa12,000 kpa12,000 kpa12,000 kpa
Water ProducerMAX STW3800 m3/day3800 m3/day--
MIN BHP12,000 kpa12,000 kpa--
Table 3. Oil recovery and water cut after twelve years of production for the TC-GDWS-AGD, GDWS-AGD, GAGD, and primary (base-case) PUNQ-S3 simulations.
PROCESSTC-GDWS-AGDGDWSGAGDPRIMARY
Oil Recovery14.5%15%9%8.5%
Water Cut57%60%70%90%
Table 4. Base-case and PSO-derived optimal-case operational decision variable values for the TC-GDWS-AGD simulation of the PUNQ-S3 reservoir.
Decision VariablesBase Case
TC-GDWS-AGD
Optimal Case
TC-GDWS-AGD
Maximum Oil Production Rate (MAX_STO; m3/day)800967.33
Minimum Bottom Hole Pressure (Oil) (MIN_BHP; kpa)12,0009533.48
Maximum Gas Injection Rate
(MAX_STG; m3/day)
350,000420,358.11
Maximum Bottom Hole Pressure (Oil)
(MAX_BHP; kpa)
28,00025,926.01
Maximum Water Production Rate
(MAX_STW, m3/day)
38004424.58
Minimum Bottom Hole Pressure (Water)
MIN_BHPW, kpa
12,0009058.99
Location of MC Well 1
(WELL 1_ J)
2022
Location of MC Well 2
(WELL 2_J)
2019
Table 5. Base-case and PSO-derived optimal-case operational decision variable values for TC-GDWS recovery optimization applied to scenario 2.
ParametersBase CaseOptimum Case
MAX_STO, m3/DAY800714.11
MIN_BHP, kpa12,0009031.55
MAX_STG, m3/DAY350,000325,512.06
MAX_BHP, kpa28,00026,894.18
MIN_BHPW, kpa12,0009065.37
WELL 1_J2023
WELL 2_J2020
WELL 3_J1714
WELL 4_J1717
Disclaimer/Publisher’s Note: The statements, opinions and data contained in all publications are solely those of the individual author(s) and contributor(s) and not of MDPI and/or the editor(s). MDPI and/or the editor(s) disclaim responsibility for any injury to people or property resulting from any ideas, methods, instructions or products referred to in the content.

