
Sustainability of Building Materials: Embodied Energy and Embodied Carbon of Masonry


 ,
,  ,
,  and
and
Abstract
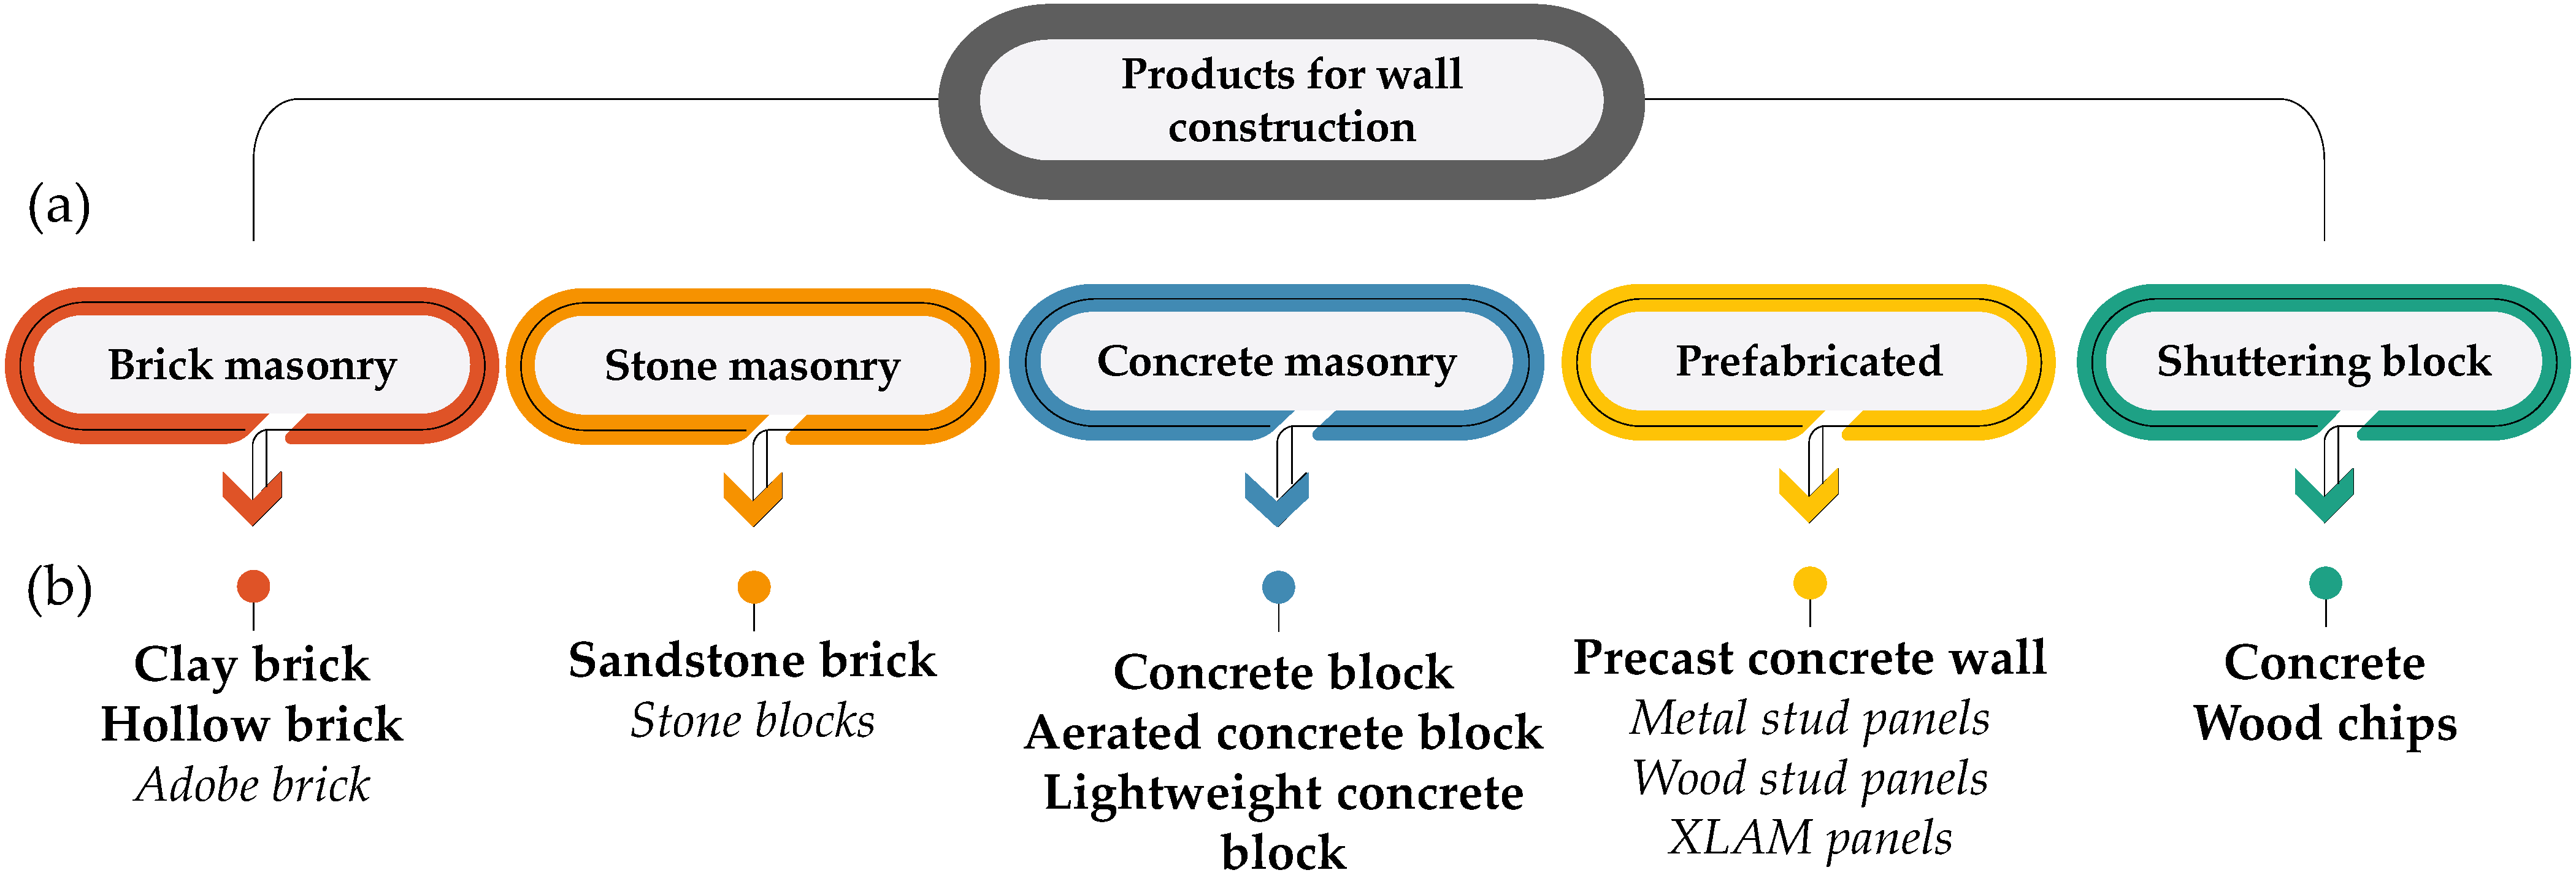
:1. Introduction
- (a)
- the construction technique used for the assembly of the wall;
- (b)
- the kind of the element characterizing the product.
2. State of the Art
2.1. Standards Related to Building Products
 ) for products and goods within the European market (EU No. 305/2011 [31]). The CE label identifies the general requirements and performances to be met in terms of mechanical resistance and stability, safety in case of fire, hygiene, noise protection, energy saving, and sustainable use of natural resources for the construction of buildings.
2.2. Literature Review on Envelope Materials
- −
- Evaluation of the stages with the highest environmental impacts in the entire life cycle of the considered material.
- −
- Proposal of potential improvements of the environmental performances through the entire life cycle.
3. Materials and Methods
- −
- Global Warming Potential (GWP): it is the indicator that evaluates the impact on climate change in kg CO2eq. The time horizon that is usually used is equal to 100 years to account for the degradation of some gases in the atmosphere. Biogenic carbon removals are also considered as a negative contribution if the EN 15804 is taken as a reference.
- −
- Non-Renewable Primary Energy (PENR): it expresses the amount of non-renewable energy (in MJ) both as input energy and input materials necessary in every life cycle stage of the product. It is usually calculated employing the single issues indicator: cumulative energy demand [63].
- −
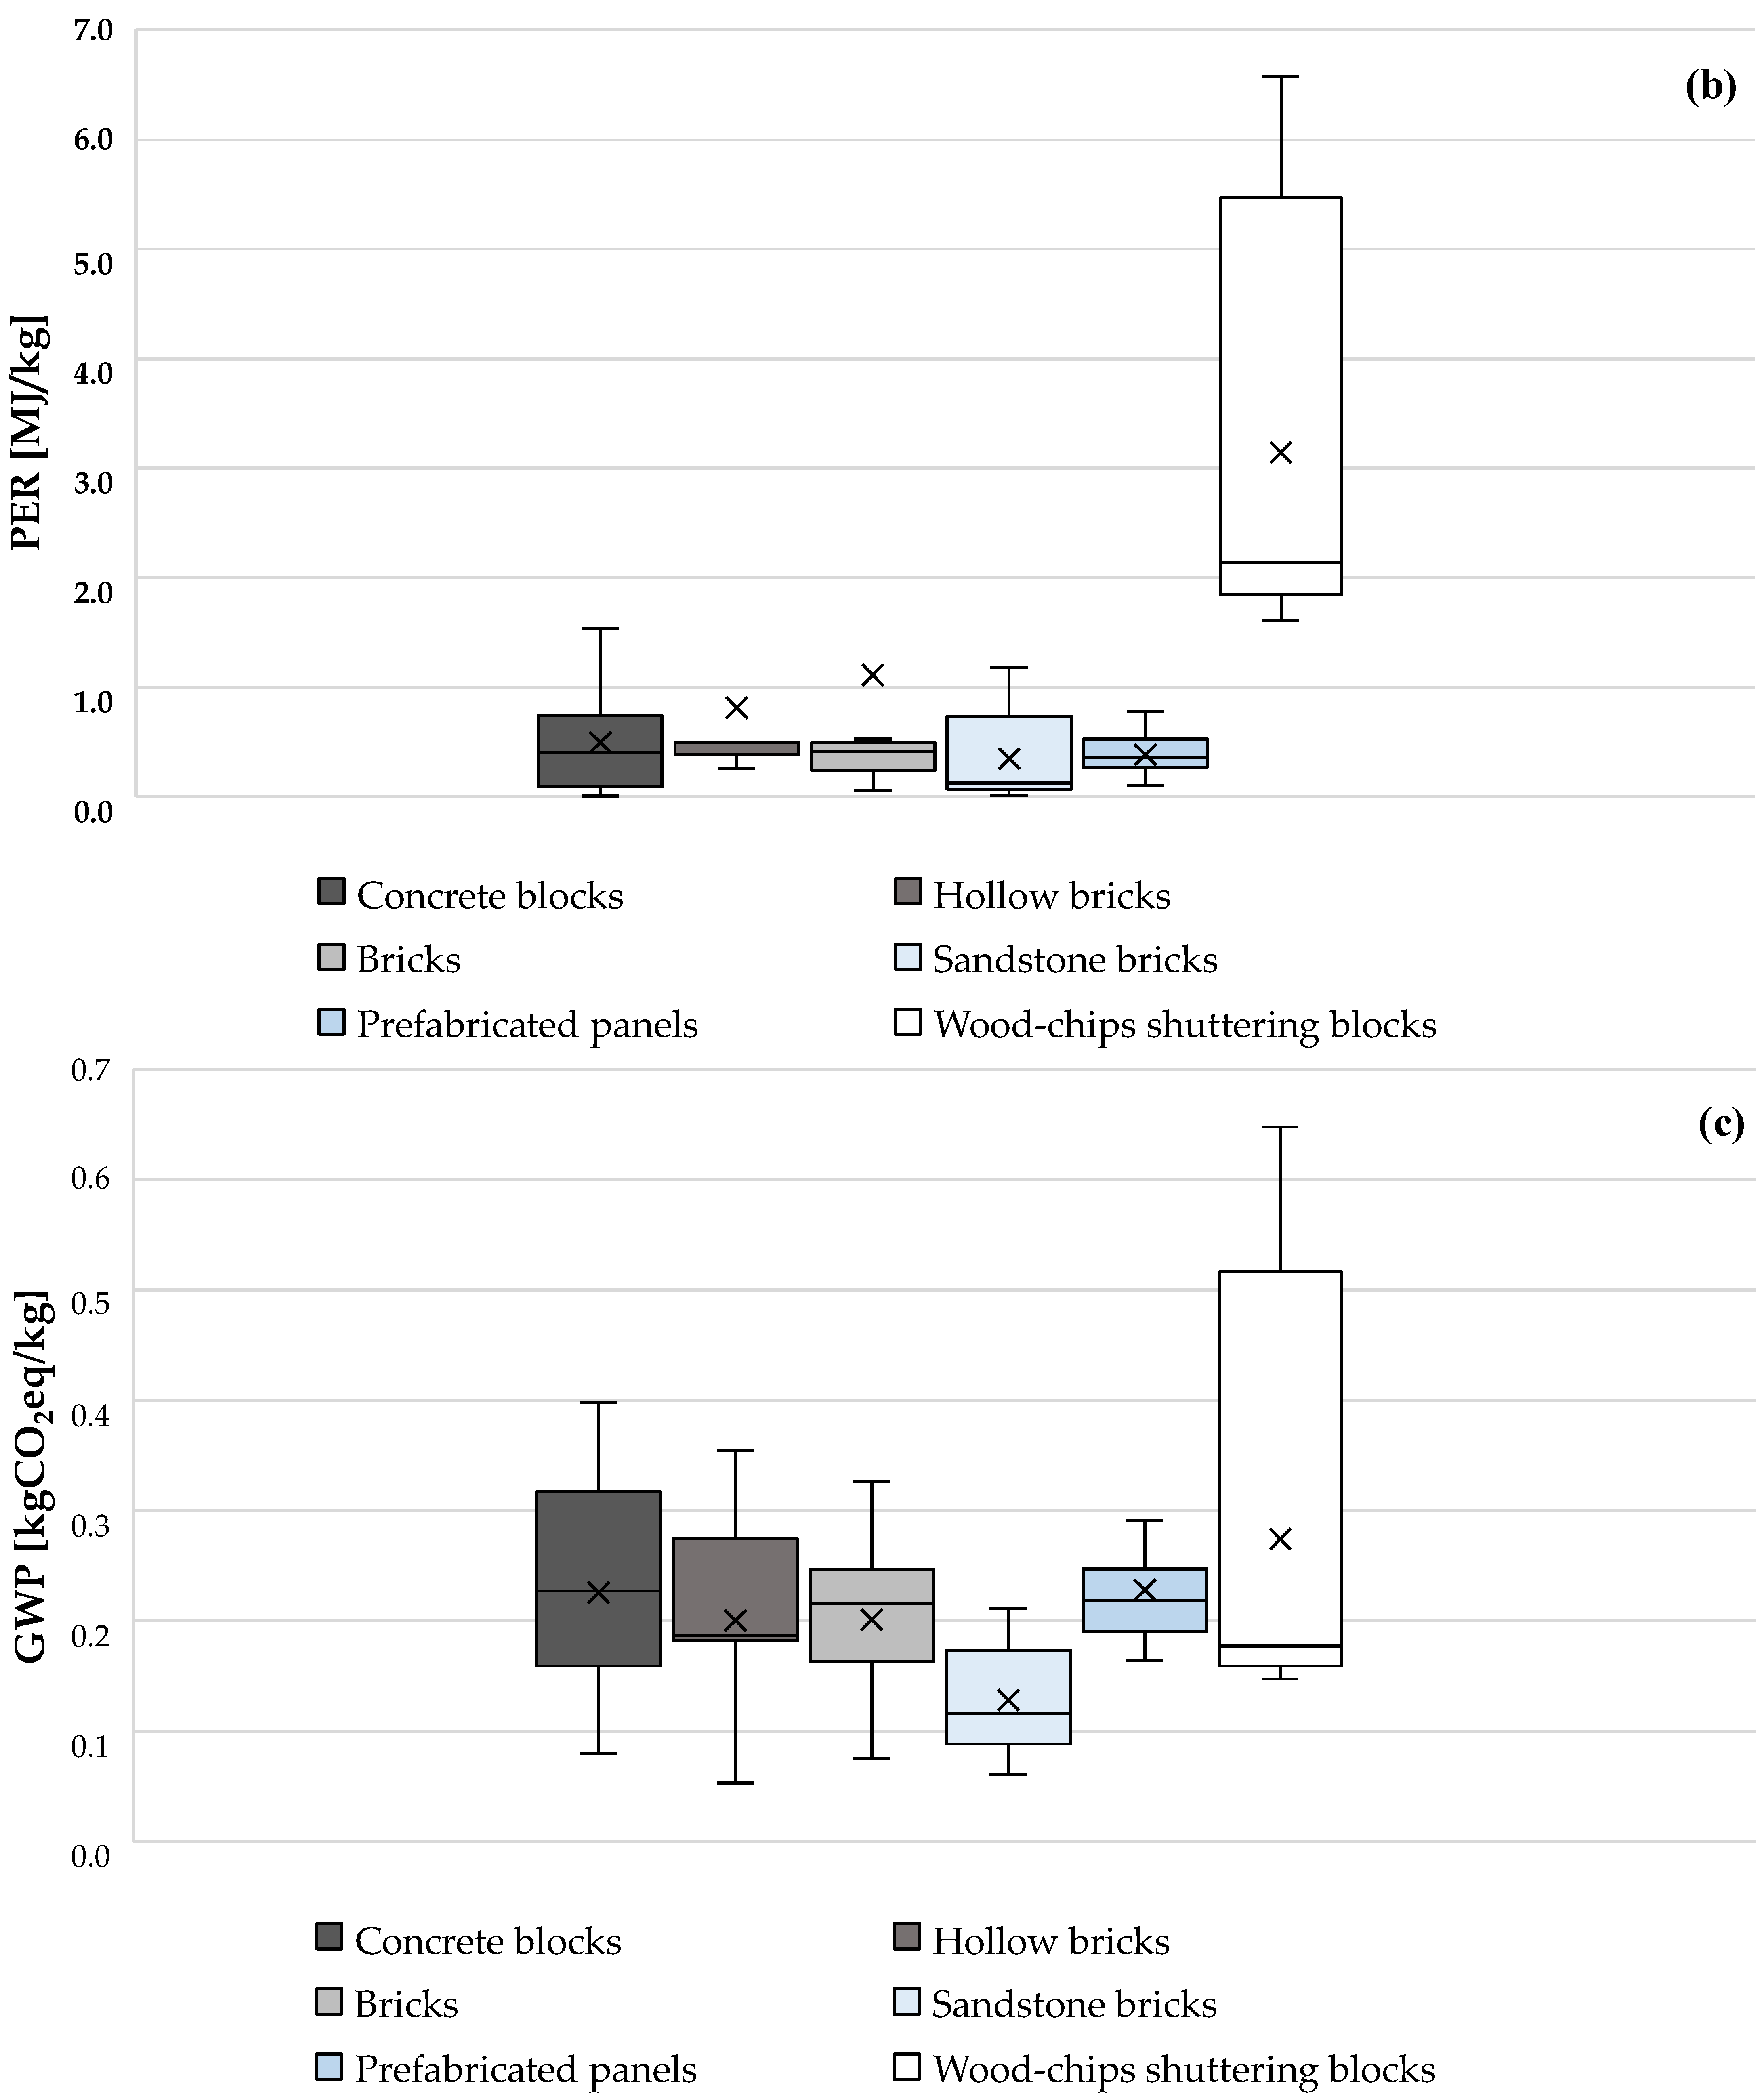
- Renewable Primary Energy (PER): it represents the renewable energy use (in MJ) characterizing every life cycle stage of the product input as energy or materials flow. As for PENR, it is determined using the cumulative energy demand method.
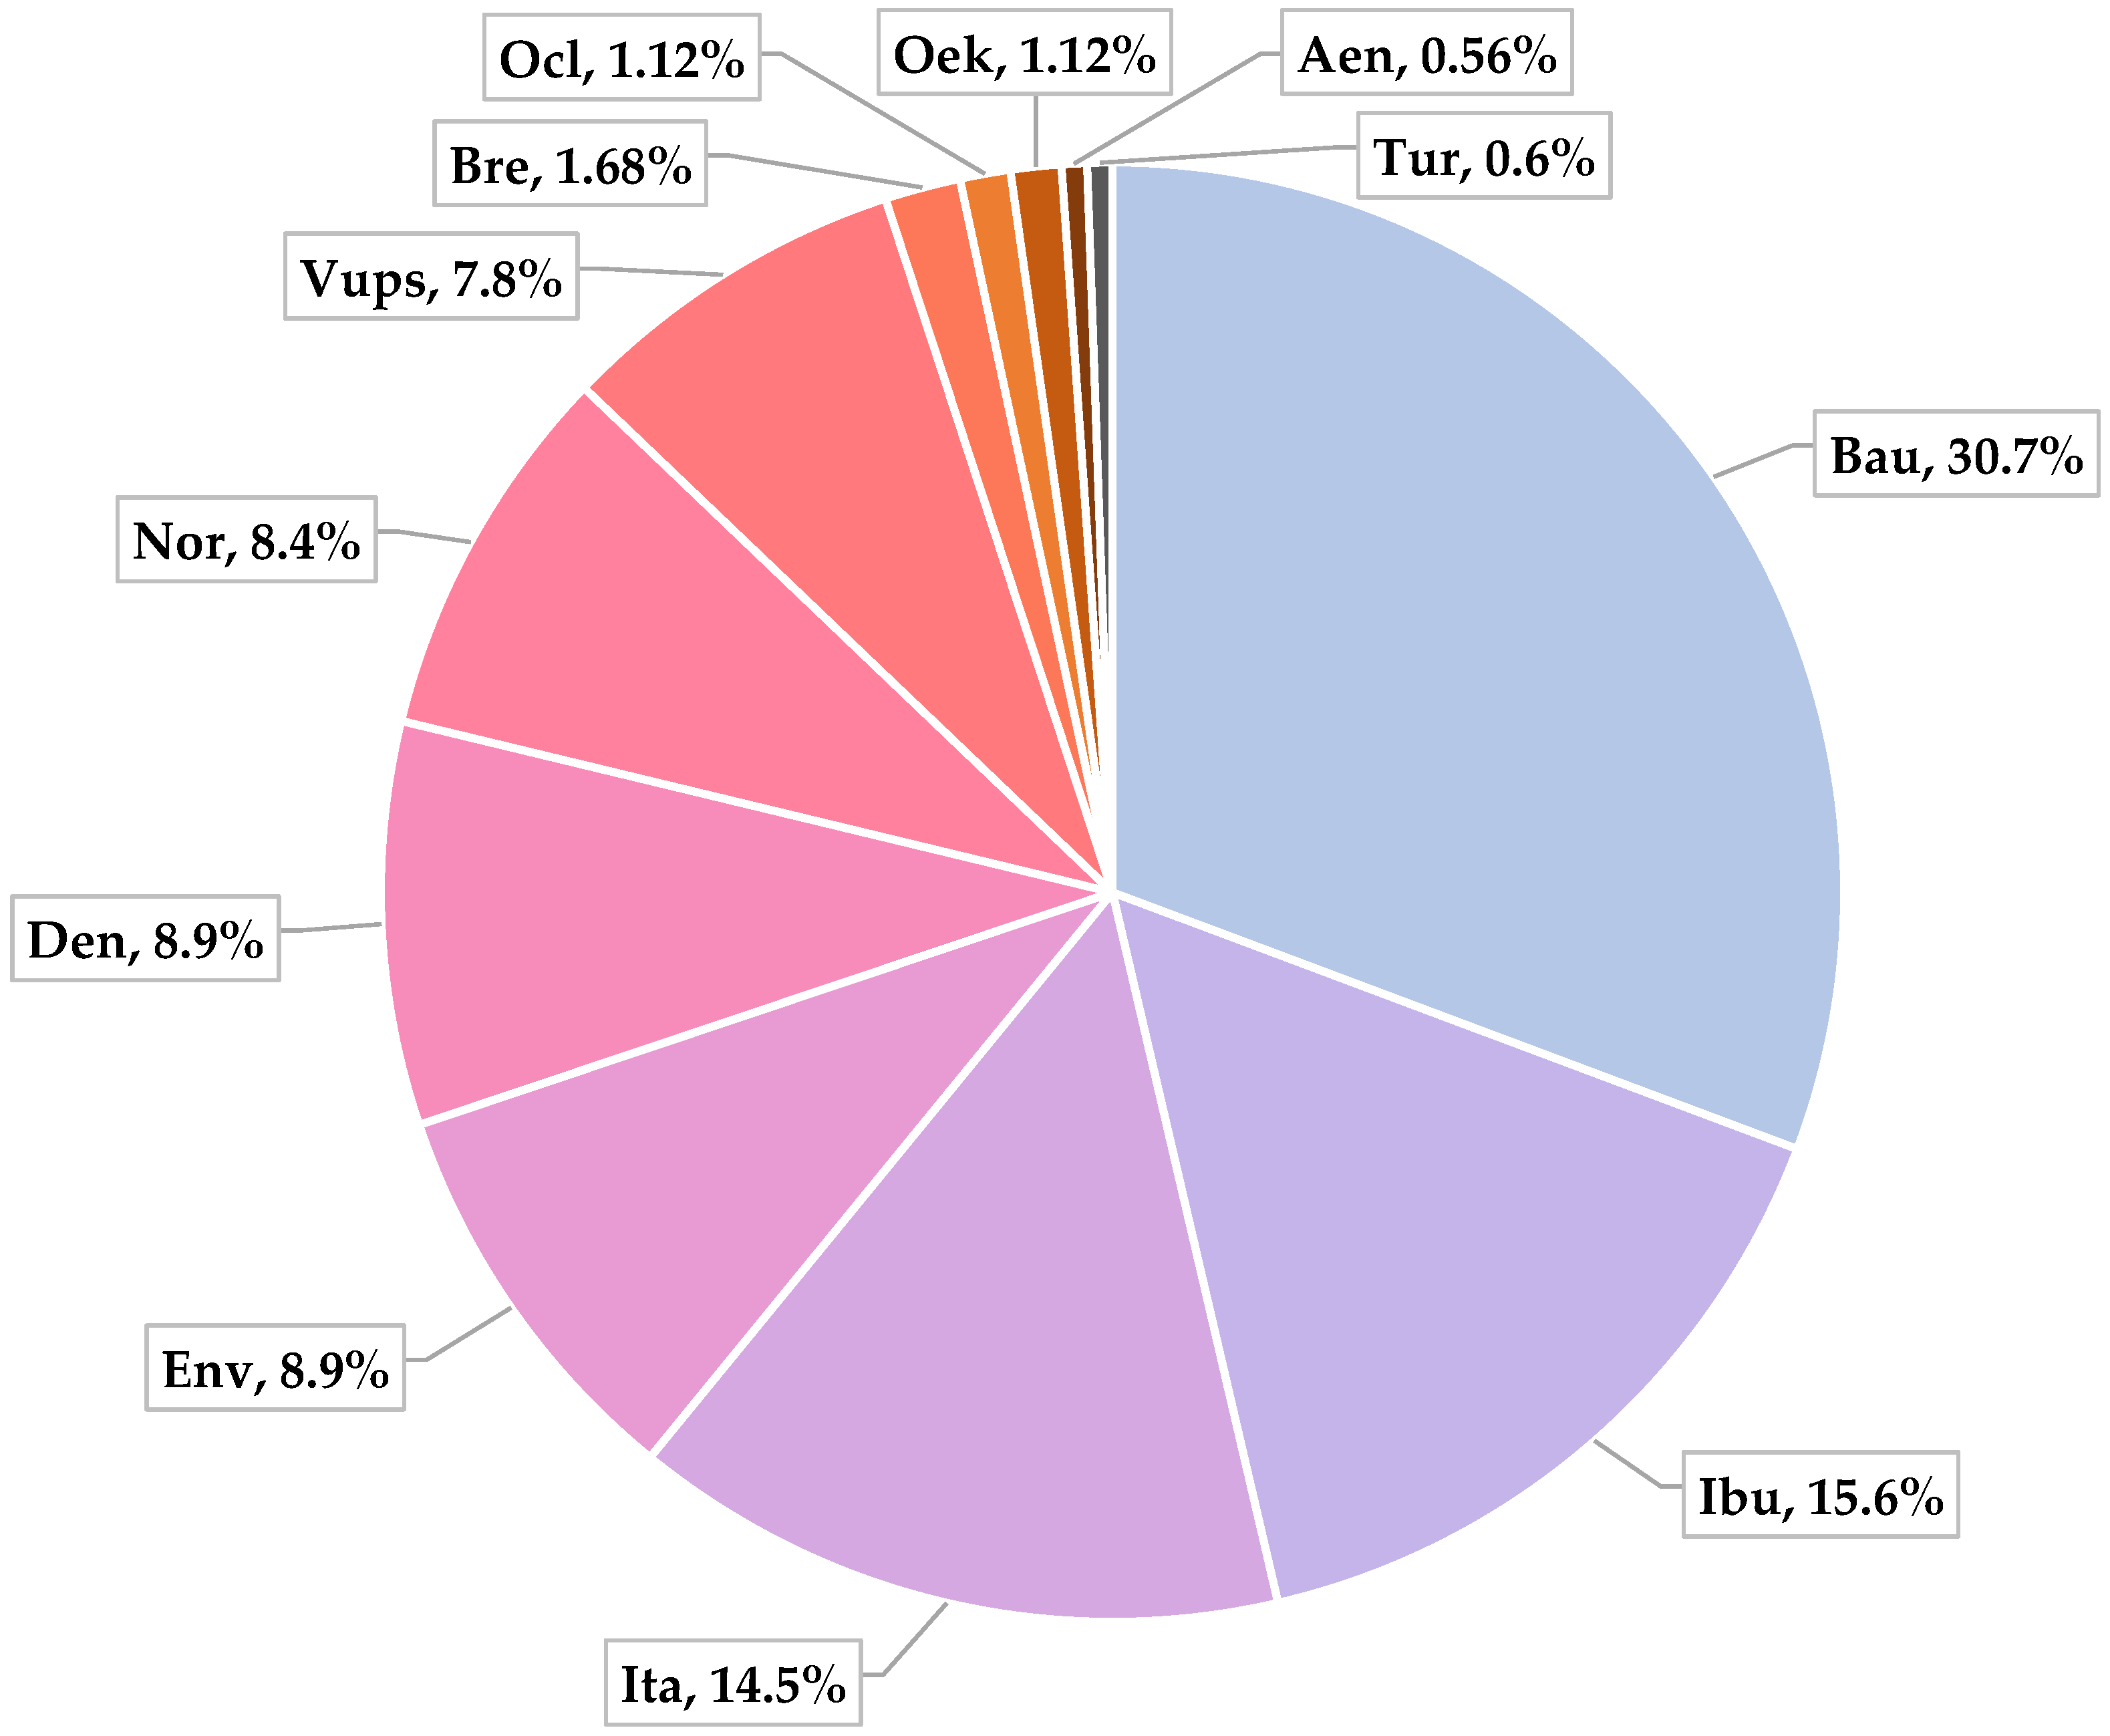
3.1. Origin of the Dataset
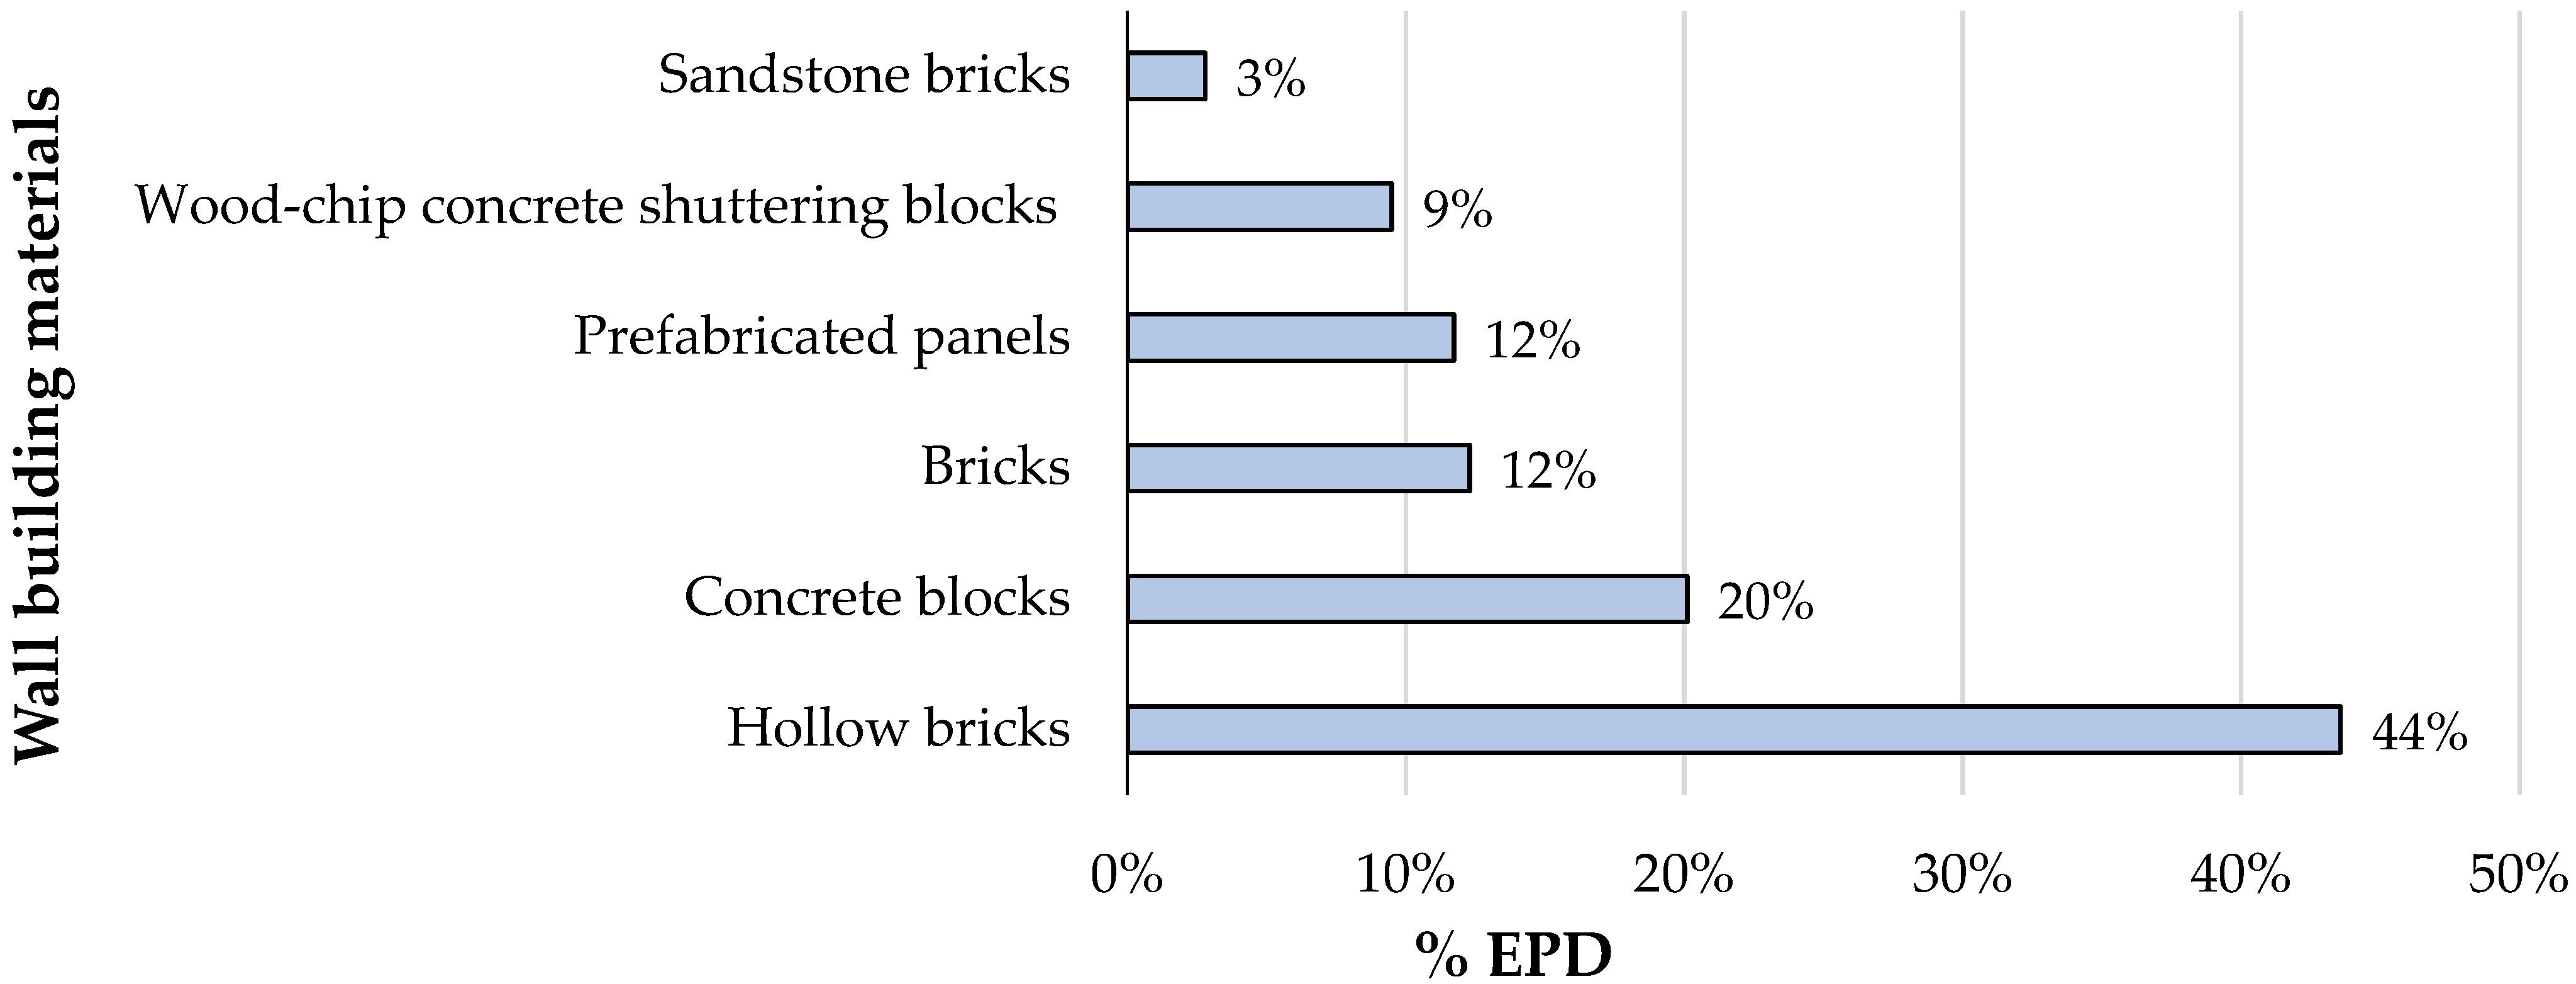
3.2. Description of the Dataset
4. Results and Discussion
5. Case Study: A Comparison of Different Wall Options
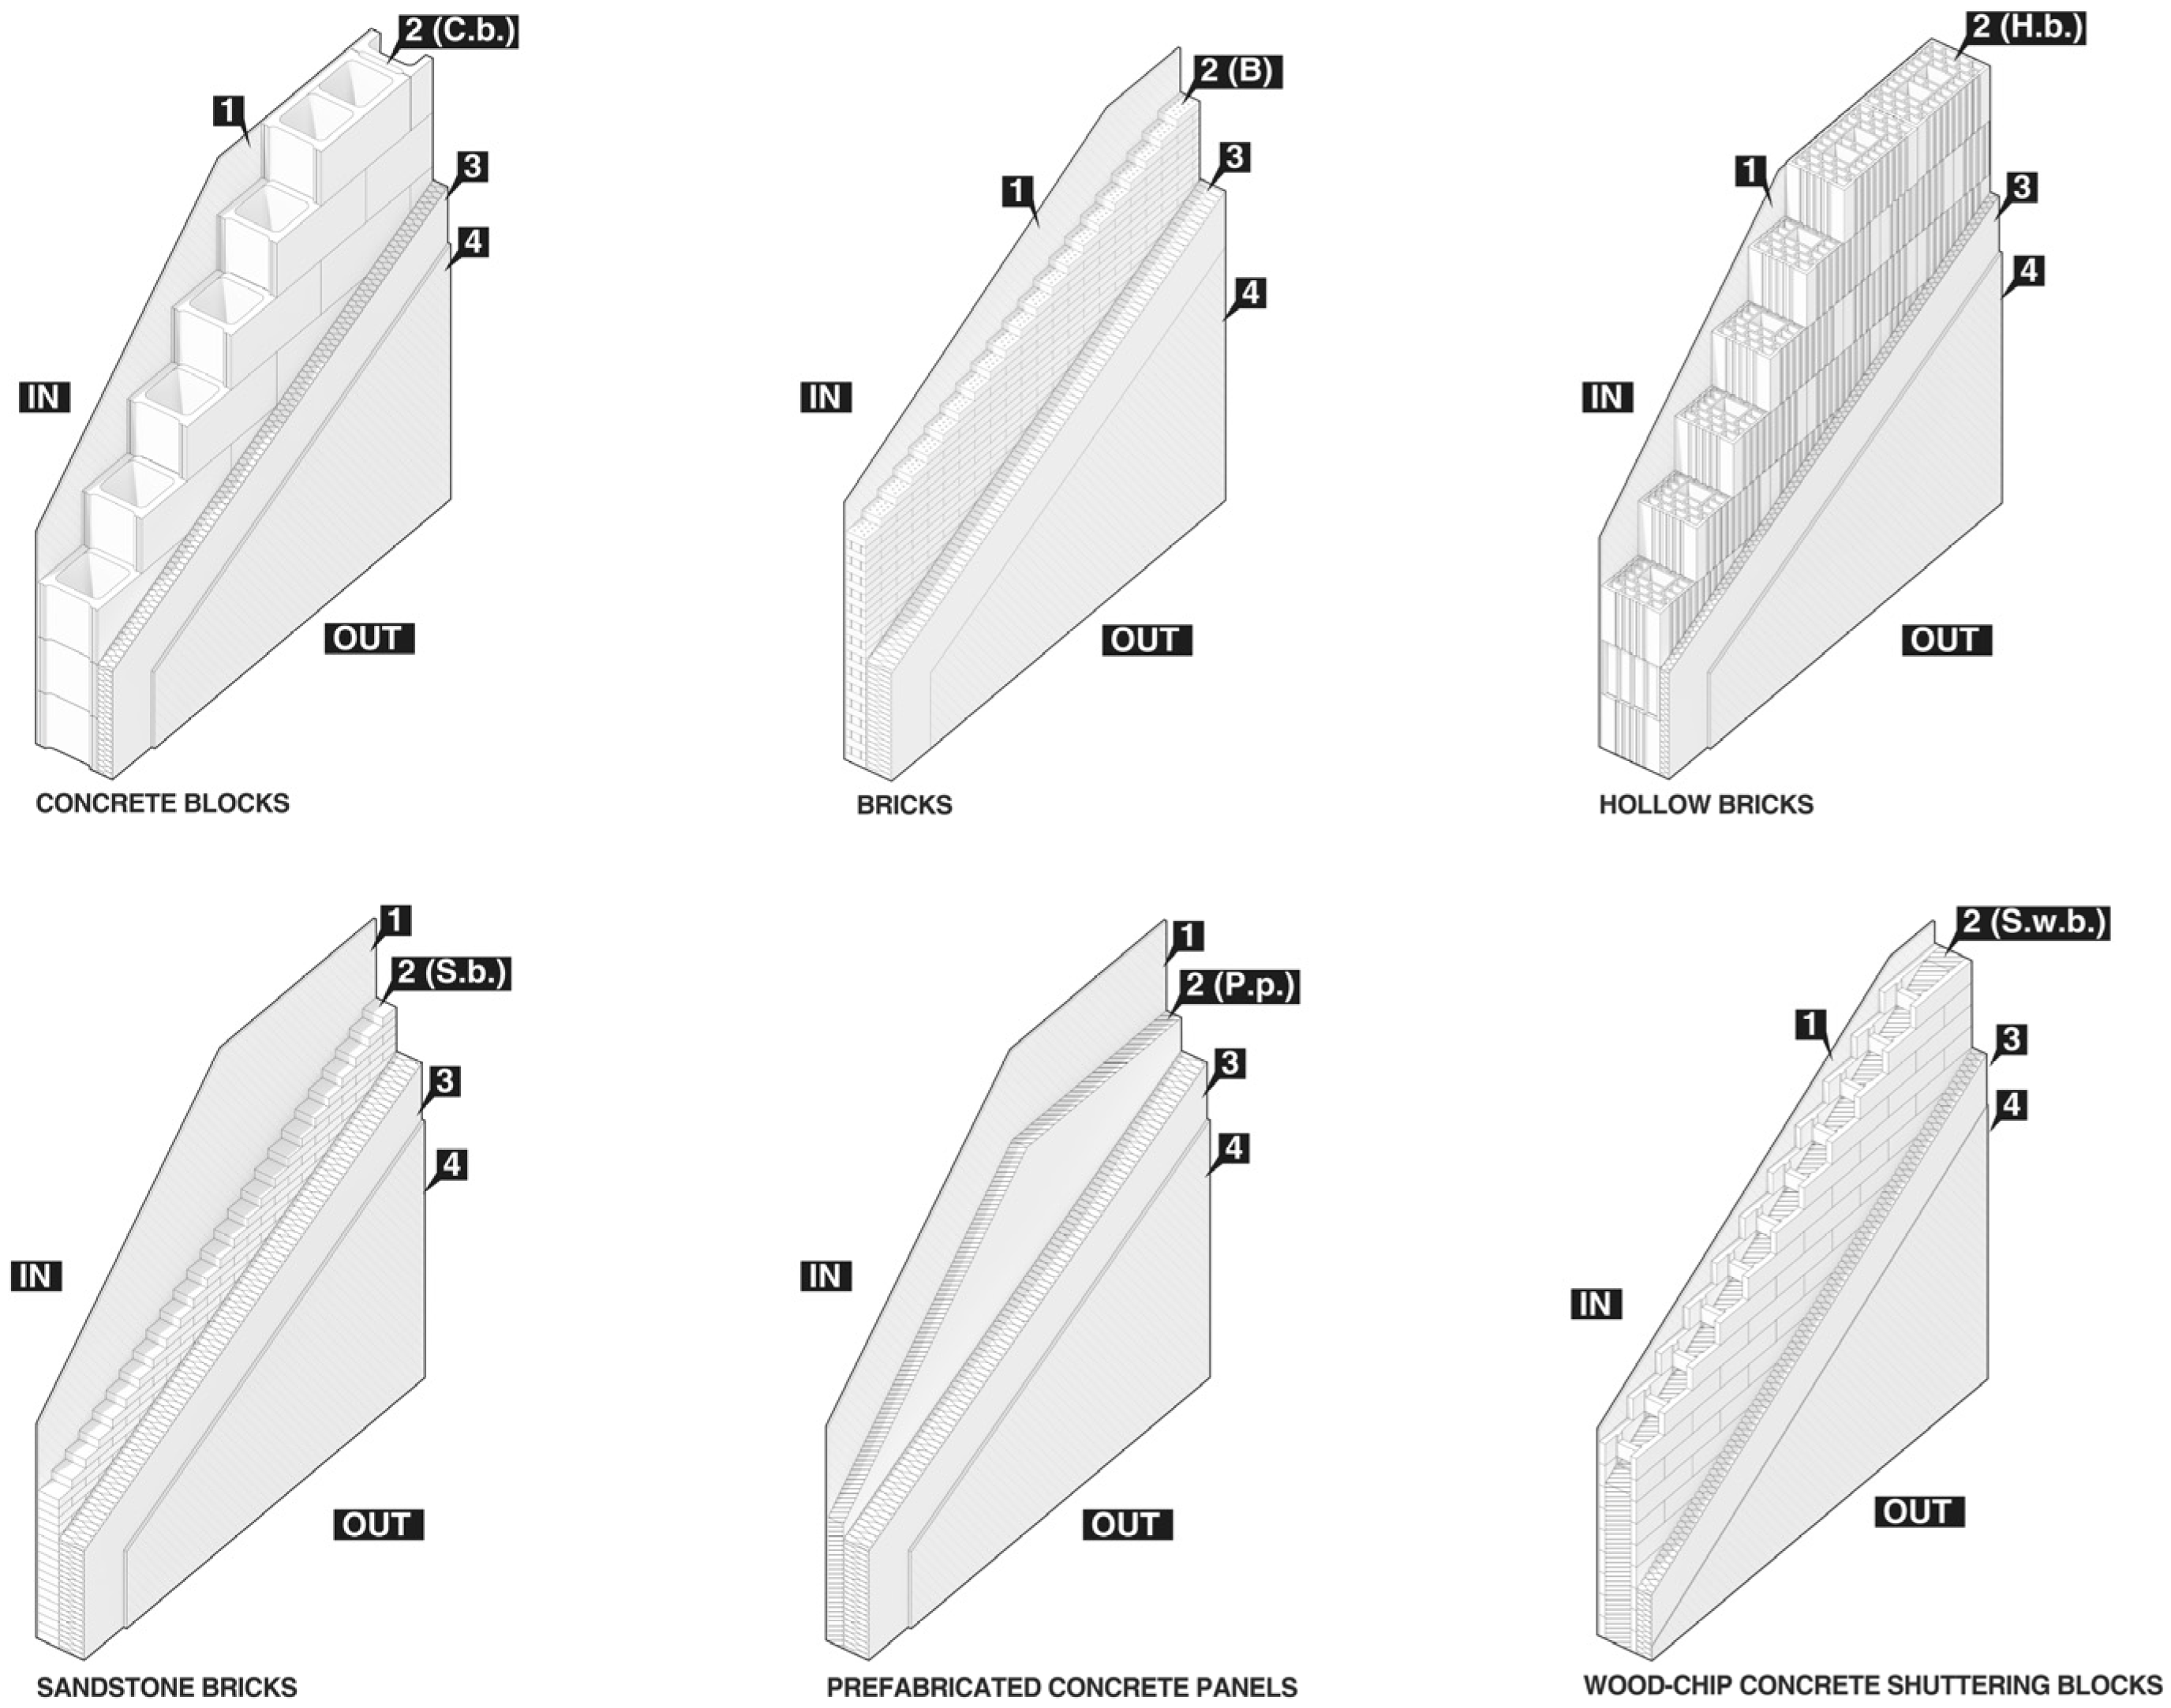
- Different wall typologies based on the building materials analyzed in this study were considered;
- Comparable performances were assessed, i.e., same thermal resistance of the wall and similar superficial masses;
- An environmental impact assessment of the different wall typologies was performed: PENR [MJ/m2], PER [MJ/m2], and GWP [kgCO2eq/m2] were calculated considering that the wall options have the same type of insulation on the outside but different thicknesses of insulation and of the wall elements. The FU considered in the case study is equal to 1 m2 of wall.
5.1. Case Study Assumptions
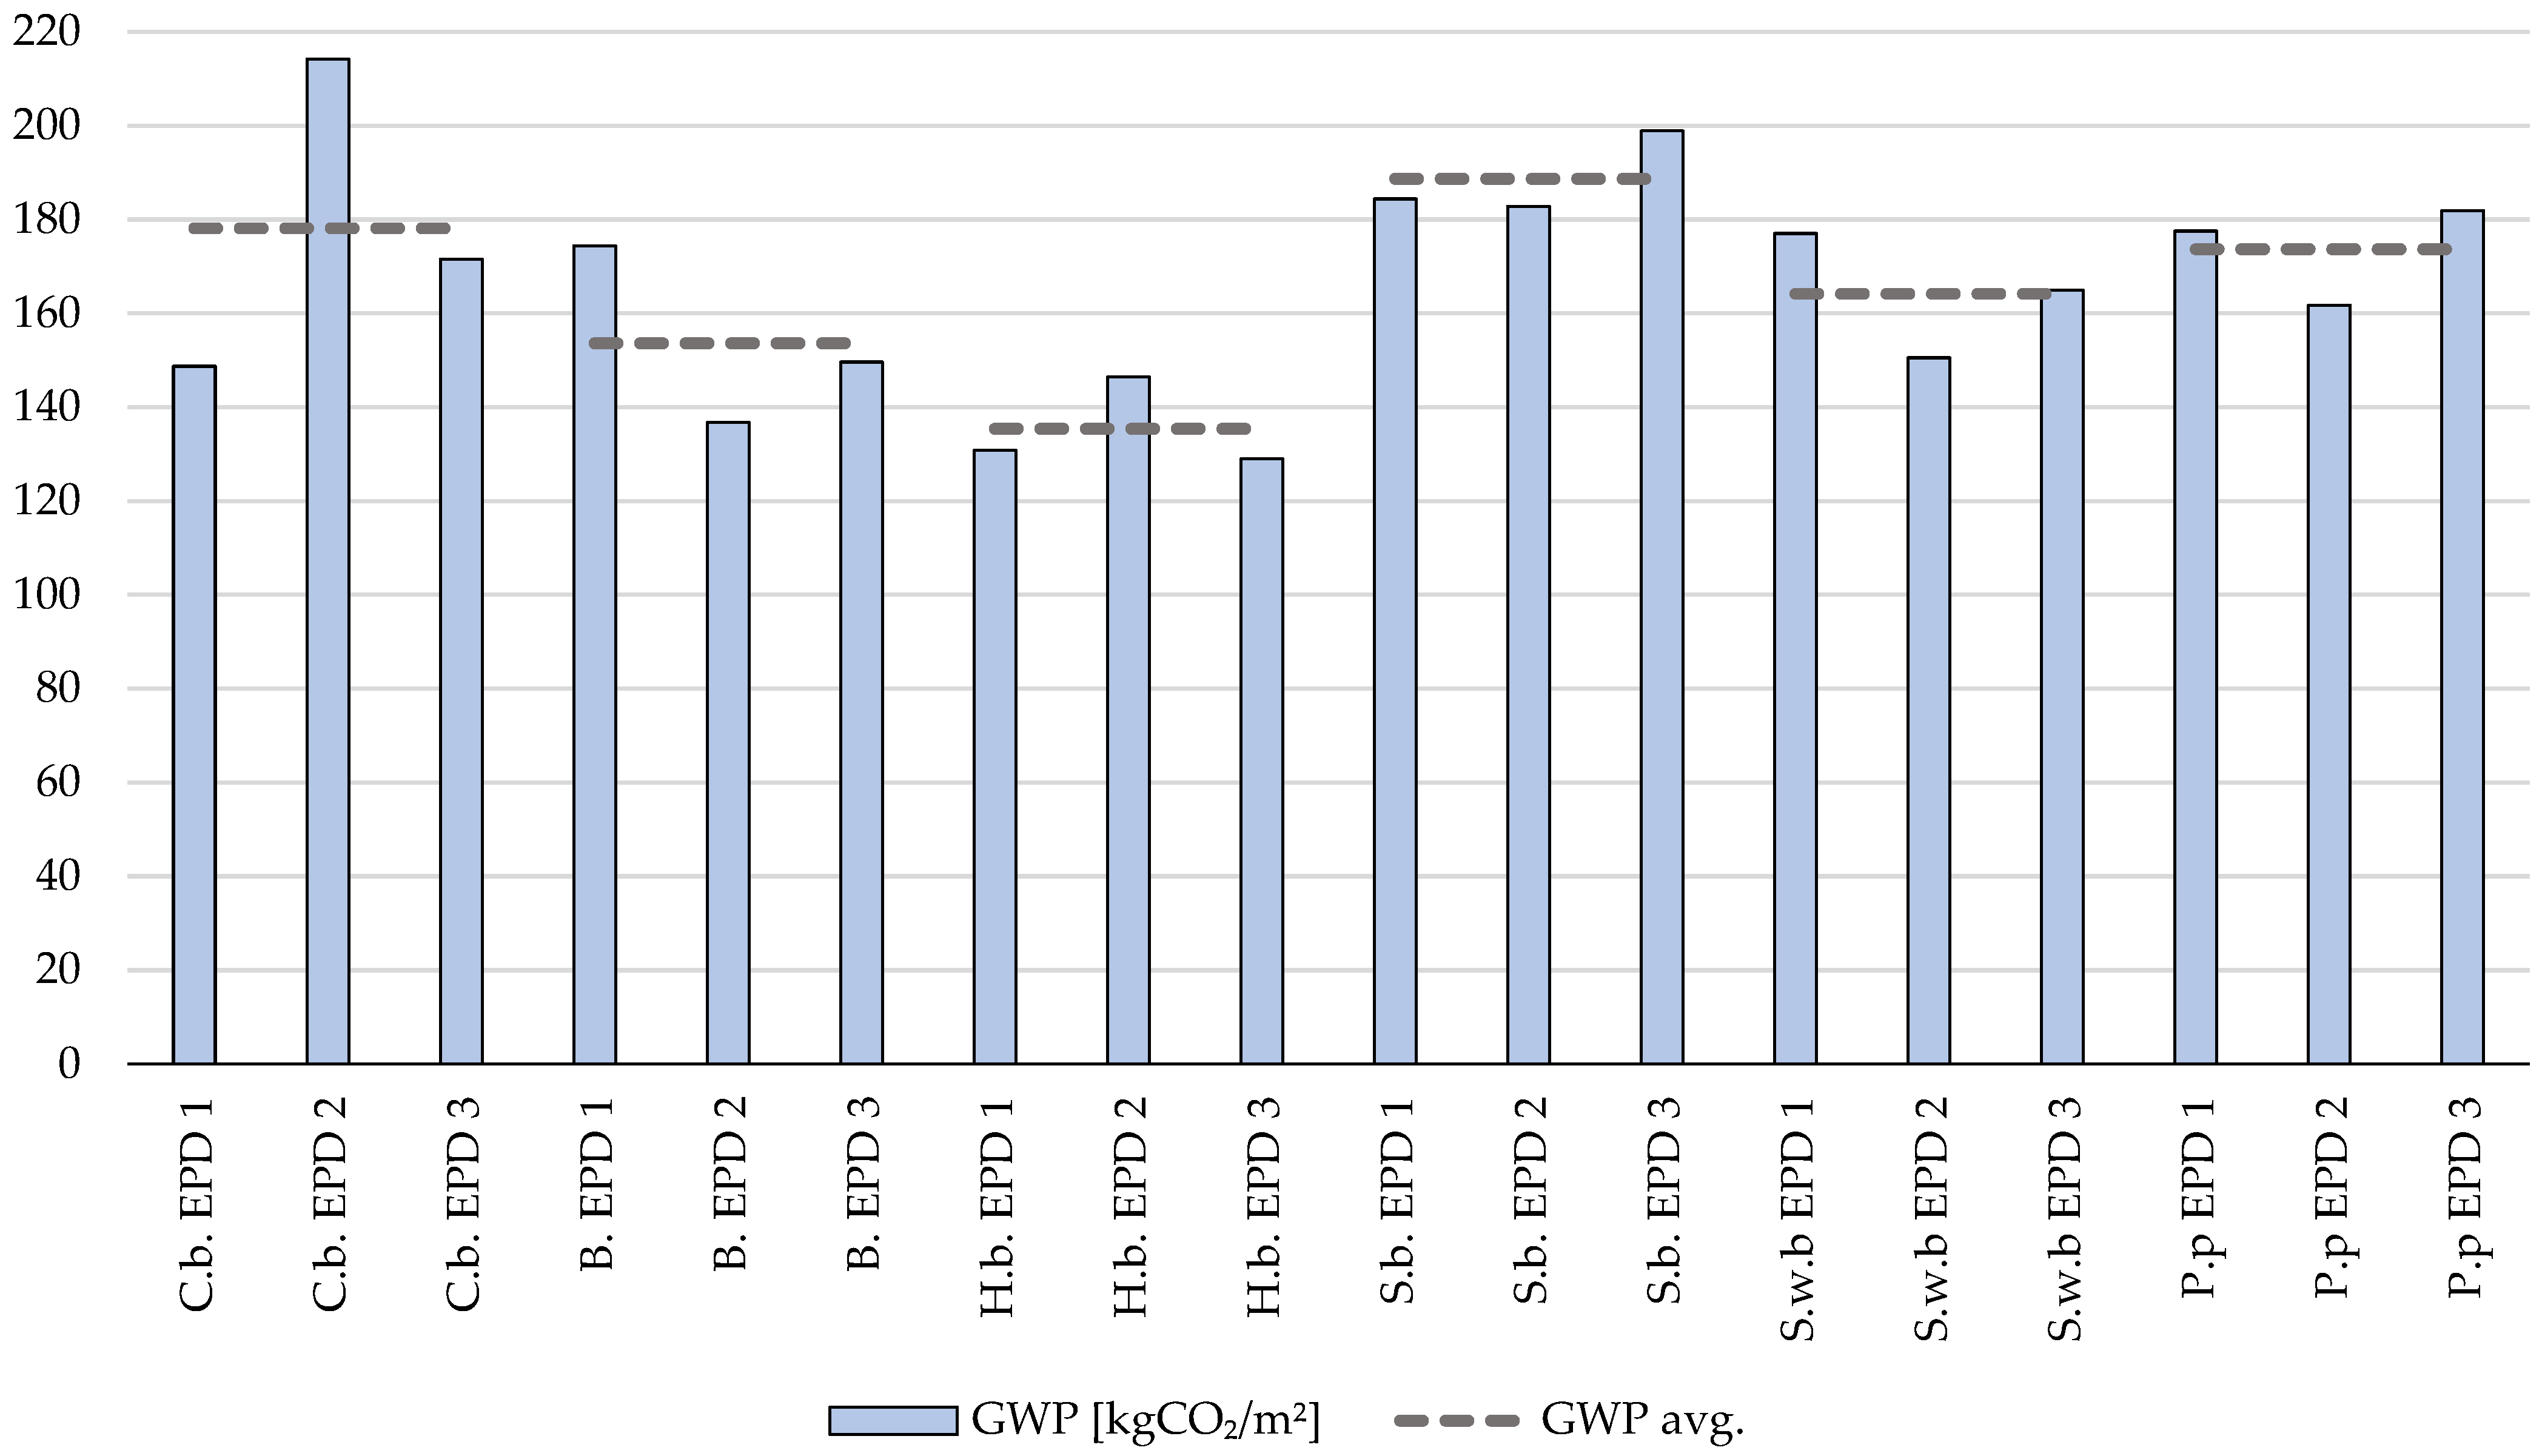
5.2. Environmental Impacts Assessment of the Wall Options
5.3. Results
- −
- When it comes to shuttering wood-chips concrete blocks with an integrated insulation layer which is placed inside the formwork, single service life is provided by the EPD for the entire product. However, the insulating layer may have a lower service life than the one declared for the whole system; thus, some correction factors should be used to model the decay in the insulating performances during its end-of-life.
- −
- The impacts connected to the A5 stage are not always provided by the EPDs even if they need to be included to compare those blocks to other wall elements ready to be installed.
- −
- The superficial masses of the wall models made of shuttering wood-chips concrete blocks are sensibly higher than the others.
- −
- Hollow bricks and bricks in the wall system have lower impacts compared with the product assessment (PENR).
- −
- Sandstone bricks become more impactful compared with the single-element assessment due to the hypothetical multiple substitutions required in the life cycle (PENR and GWP).
- −
- Concrete blocks and prefabricated panels in the wall system have a similar trend compared with the product assessment (GWP).
6. Conclusions
Supplementary Materials
Author Contributions
Funding
Data Availability Statement
Conflicts of Interest
Glossary
| Impact assessment | |
| EPDs | Environmental products declarations |
| FU | Functional unit |
| GHG | Greenhouse gas |
| GWP | Global warming potential (100 years) |
| LCA | Life cycle assessment |
| PCR | Product category rules |
| PER | Primary energy, renewable |
| PERA1–A3|LC | Life cycle primary renewable energy (stages A1–A3, 150 years) |
| PERA1–A3|50y | Primary renewable energy (stages A1–A3, 50 years) |
| PENR | Primary energy, non-renewable |
| PENRA1–A3|LC | Life cycle primary non-renewable energy (stages A1–A3, 150 years) |
| PENRA1–A3|50y | Primary non-renewable energy (stages A1–A3, 50 years) |
| Program operators | |
| Bau | Baubook |
| Den | EPD Danmark |
| Env | EPD international AB |
| Ita | EPD Italy |
| Nor | EPD Norge |
| IBU | Institut Bauen & Umwelt e.V. |
| Vups | Výzkumný ústav pozemních staveb-Certifikační společnost, s.r.o. |
| Bre | BRE GLOBAL |
| Ocl | One Click LCA |
| Oek | OEKOBAUDAT |
| Aen | AENOR |
| Tur | EPD TURKEY |
| Constructions blocks | |
| B. | Brick |
| C.b. | Concrete block |
| H.b. | Hollow brick |
| P.p. | Prefabricated panel |
| S.b. | Sandstone brick |
| S.w.b. | Shuttering wood-chips block |
References
- Karimpour, M.; Belusko, M.; Xing, K.; Bruno, F. Minimising the Life Cycle Energy of Buildings: Review and Analysis. Build. Environ. 2014, 73, 106–114. [Google Scholar] [CrossRef]
- Koezjakov, A.; Urge-Vorsatz, D.; Crijns-Graus, W.; van den Broek, M. The Relationship between Operational Energy Demand and Embodied Energy in Dutch Residential Buildings. Energy Build. 2018, 165, 233–245. [Google Scholar] [CrossRef]
- Röck, M.; Saade, M.R.M.; Balouktsi, M.; Rasmussen, F.N.; Birgisdottir, H.; Frischknecht, R.; Habert, G.; Lützkendorf, T.; Passer, A. Embodied GHG Emissions of Buildings—The Hidden Challenge for Effective Climate Change Mitigation. Appl. Energy 2020, 258, 114107. [Google Scholar] [CrossRef]
- IEA; EBC. Evaluation of Embodied Energy and CO₂eq for Building Construction (Annex 57); IEA: Cambridge, UK, 2016. [Google Scholar]
- Birgisdottir, H.; Moncaster, A.; Wiberg, A.H.; Chae, C.; Yokoyama, K.; Balouktsi, M.; Seo, S.; Oka, T.; Lützkendorf, T.; Malmqvist, T. IEA EBC Annex 57 ‘Evaluation of Embodied Energy and CO₂eq for Building Construction. Energy Build. 2017, 154, 72–80. [Google Scholar] [CrossRef]
- Ramesh, T.; Prakash, R.; Shukla, K.K. Life Cycle Energy Analysis of Buildings: An Overview. Energy Build. 2010, 42, 1592–1600. [Google Scholar] [CrossRef]
- Shadram, F.; Johansson, T.D.; Lu, W.; Schade, J.; Olofsson, T. An Integrated BIM-Based Framework for Minimizing Embodied Energy during Building Design. Energy Build. 2016, 128, 592–604. [Google Scholar] [CrossRef]
- Ferreira, A.; Pinheiro, M.D.; de Brito, J.; Mateus, R. Embodied vs. Operational Energy and Carbon in Retail Building Shells: A Case Study in Portugal. Energies 2022, 16, 378. [Google Scholar] [CrossRef]
- Monteiro, H.; Freire, F.; Fernández, J.E. Life-Cycle Assessment of Alternative Envelope Construction for a New House in South-Western Europe: Embodied and Operational Magnitude. Energies 2020, 13, 4145. [Google Scholar] [CrossRef]
- Koroneos, C.; Dompros, A. Environmental Assessment of Brick Production in Greece. Build. Environ. 2007, 42, 2114–2123. [Google Scholar] [CrossRef]
- Kumbhar, S.; Kulkarni, N.; Rao, A.B.; Rao, B. Environmental Life Cycle Assessment of Traditional Bricks in Western Maharashtra, India. Energy Procedia 2014, 54, 260–269. [Google Scholar] [CrossRef] [Green Version]
- European Commission. A European Green Deal. Available online: https://ec.europa.eu/info/strategy/priorities-2019-2024/european-green-deal_en (accessed on 7 September 2022).
- Röck, M.; Baldereschi, E.; Verellen, E.; Passer, A.; Sala, S.; Allacker, K. Environmental Modelling of Building Stocks—An Integrated Review of Life Cycle-Based Assessment Models to Support EU Policy Making. Renew. Sustain. Energy Rev. 2021, 151, 111550. [Google Scholar] [CrossRef]
- European Commission COM/2020/98 Final—A New Circular Economy Action Plan for a Cleaner and More Competitive Europe. Available online: https://eur-lex.europa.eu/legal-content/EN/TXT/?uri=CELEX%3A52020DC0098 (accessed on 12 September 2022).
- Murmu, A.L.; Patel, A. Towards Sustainable Bricks Production: An Overview. Constr. Build. Mater. 2018, 165, 112–125. [Google Scholar] [CrossRef]
- Cabeza, L.F.; Boquera, L.; Chàfer, M.; Vérez, D. Embodied Energy and Embodied Carbon of Structural Building Materials: Worldwide Progress and Barriers through Literature Map Analysis. Energy Build 2021, 231, 110612. [Google Scholar] [CrossRef]
- Sáez-de-Guinoa, A.; Zambrana-Vasquez, D.; Fernández, V.; Bartolomé, C. Circular Economy in the European Construction Sector: A Review of Strategies for Implementation in Building Renovation. Energies 2022, 15, 4747. [Google Scholar] [CrossRef]
- European Commission Level(s). Available online: https://environment.ec.europa.eu/topics/circular-economy/levels_en (accessed on 31 October 2022).
- LETI Embodied Carbon Primer. Available online: https://www.leti.london/ecp (accessed on 12 June 2022).
- Dixit, M.K.; Fernández-Solís, J.L.; Lavy, S.; Culp, C.H. Identification of Parameters for Embodied Energy Measurement: A Literature Review. Energy Build. 2010, 42, 1238–1247. [Google Scholar] [CrossRef]
- Azari, R.; Abbasabadi, N. Embodied Energy of Buildings: A Review of Data, Methods, Challenges, and Research Trends. Energy Build. 2018, 168, 225–235. [Google Scholar] [CrossRef]
- Dixit, M.K. Life Cycle Embodied Energy Analysis of Residential Buildings: A Review of Literature to Investigate Embodied Energy Parameters. Renew. Sustain. Energy Rev. 2017, 79, 390–413. [Google Scholar] [CrossRef]
- Zhang, Y.; Yan, D.; Hu, S.; Guo, S. Modelling of Energy Consumption and Carbon Emission from the Building Construction Sector in China, a Process-Based LCA Approach. Energy Policy 2019, 134, 110949. [Google Scholar] [CrossRef]
- Saade, M.R.M.; Guest, G.; Amor, B. Comparative Whole Building LCAs: How Far Are Our Expectations from the Documented Evidence? Build. Environ. 2020, 167, 106449. [Google Scholar] [CrossRef]
- Akbarnezhad, A.; Xiao, J. Estimation and Minimization of Embodied Carbon of Buildings: A Review. Buildings 2017, 7, 5. [Google Scholar] [CrossRef]
- El Khouli, S.; John, V.; Zeumer, M. Sustainable Construction Techniques; Detail Green Books: Munich, Germany, 2015; ISBN 978-3955532383. [Google Scholar]
- Thiel, C.; Campion, N.; Landis, A.; Jones, A.; Schaefer, L.; Bilec, M. A Materials Life Cycle Assessment of a Net-Zero Energy Building. Energies 2013, 6, 1125–1141. [Google Scholar] [CrossRef]
- Pal, S.K.; Takano, A.; Alanne, K.; Siren, K. A Life Cycle Approach to Optimizing Carbon Footprint and Costs of a Residential Building. Build. Environ. 2017, 123, 146–162. [Google Scholar] [CrossRef]
- Reilly, A.; Kinnane, O.; O’Hegarty, R. Energy Embodied in, and Transmitted through, Walls of Different Types when Accounting for the Dynamic Effects of Thermal Mass. J. Green Build. 2020, 15, 43–66. [Google Scholar] [CrossRef]
- Ching, F.D.K. Building Construction Illustrated, 6th ed.; Wiley: Hoboken, NJ, USA, 2020; ISBN 978-1-119-58316-5. [Google Scholar]
- European Parliament and Council. Regulation (EU) No 305/2011 of the European Parliament and of the Council of 9 March 2011 laying down harmonised conditions for the marketing of construction products and repealing Council Directive 89/106/EEC. Off. J. Eur. Union 2011, 88, 5–43. [Google Scholar]
- ECO Platform EPD Facts & Figures. Available online: https://www.eco-platform.org/epd-facts-figures.html (accessed on 10 September 2022).
- Grazieschi, G.; Asdrubali, F.; Thomas, G. Embodied Energy and Carbon of Building Insulating Materials: A Critical Review. Clean. Environ. Syst. 2021, 2, 100032. [Google Scholar] [CrossRef]
- Hill, C.; Norton, A.; Dibdiakova, J. A Comparison of the Environmental Impacts of Different Categories of Insulation Materials. Energy Build. 2018, 162, 12–20. [Google Scholar] [CrossRef]
- Asdrubali, F.; Roncone, M.; Grazieschi, G. Embodied Energy and Embodied GWP of Windows: A Critical Review. Energies 2021, 14, 3788. [Google Scholar] [CrossRef]
- Rasmussen, F.; Andersen, C.; Wittchen, A.; Hansen, R.; Birgisdóttir, H. Environmental Product Declarations of Structural Wood: A Review of Impacts and Potential Pitfalls for Practice. Buildings 2021, 11, 362. [Google Scholar] [CrossRef]
- Carbonaro, C.; Tedesco, S.; Fantucci, S. Block_Plaster: High Energy/Environmental Performance Brick Building Envelope. Techne—J. Technol. Archit. Environ. 2018, 16, 177–186. [Google Scholar] [CrossRef]
- Kua, H.W.; Kamath, S. An Attributional and Consequential Life Cycle Assessment of Substituting Concrete with Bricks. J. Clean. Prod. 2014, 81, 190–200. [Google Scholar] [CrossRef]
- Zabalza Bribián, I.; Valero Capilla, A.; Aranda Usón, A. Life Cycle Assessment of Building Materials: Comparative Analysis of Energy and Environmental Impacts and Evaluation of the Eco-Efficiency Improvement Potential. Build. Environ. 2011, 46, 1133–1140. [Google Scholar] [CrossRef]
- Almeida, M.I.; Dias, A.C.; Demertzi, M.; Arroja, L. Contribution to the Development of Product Category Rules for Ceramic Bricks. J. Clean. Prod. 2015, 92, 206–215. [Google Scholar] [CrossRef]
- Wiklund, U. PCR 2014:02 Buildings (Version 2.0). Available online: https://www.environdec.com/PCR/Detail/?Pcr=5950 (accessed on 20 July 2022).
- Goedkoop, M.; Spriensma, R. The Eco-Indicator 95; PRé Consultants: Amersfoortthe, The Netherlands, 1995. [Google Scholar]
- European Commission Ceramic Manufacturing Industry–Best Available Techniques. Available online: https://eippcb.jrc.ec.europa.eu/reference/ceramic-manufacturing-industry (accessed on 12 September 2022).
- Christoforou, E.; Kylili, A.; Fokaides, P.A.; Ioannou, I. Cradle to Site Life Cycle Assessment (LCA) of Adobe Bricks. J. Clean. Prod. 2016, 112, 443–452. [Google Scholar] [CrossRef]
- Ramos Huarachi, D.A.; Gonçalves, G.; de Francisco, A.C.; Canteri, M.H.G.; Piekarski, C.M. Life Cycle Assessment of Traditional and Alternative Bricks: A Review. Environ. Impact Assess. Rev. 2020, 80, 106335. [Google Scholar] [CrossRef]
- Sutcu, M.; Akkurt, S. The Use of Recycled Paper Processing Residues in Making Porous Brick with Reduced Thermal Conductivity. Ceram. Int. 2009, 35, 2625–2631. [Google Scholar] [CrossRef]
- Muñoz, P.; Juárez, M.C.; Morales, M.P.; Mendívil, M.A. Improving the Thermal Transmittance of Single-Brick Walls Built of Clay Bricks Lightened with Paper Pulp. Energy Build. 2013, 59, 171–180. [Google Scholar] [CrossRef]
- Bories, C.; Borredon, M.-E.; Vedrenne, E.; Vilarem, G. Development of Eco-Friendly Porous Fired Clay Bricks Using Pore-Forming Agents: A Review. J. Environ. Manag. 2014, 143, 186–196. [Google Scholar] [CrossRef]
- Bories, C.; Vedrenne, E.; Paulhe-Massol, A.; Vilarem, G.; Sablayrolles, C. Development of Porous Fired Clay Bricks with Bio-Based Additives: Study of the Environmental Impacts by Life Cycle Assessment (LCA). Constr. Build. Mater. 2016, 125, 1142–1151. [Google Scholar] [CrossRef]
- Lozano-Miralles, J.; Hermoso-Orzáez, M.; Martínez-García, C.; Rojas-Sola, J. Comparative Study on the Environmental Impact of Traditional Clay Bricks Mixed with Organic Waste Using Life Cycle Analysis. Sustainability 2018, 10, 2917. [Google Scholar] [CrossRef]
- Beal, B.; Selby, A.; Atwater, C.; James, C.; Viens, C.; Almquist, C. A Comparison of Thermal and Mechanical Properties of Clay Bricks Prepared with Three Different Pore-Forming Additives: Vermiculite, Wood Ash, and Sawdust. Environ. Prog. Sustain. Energy 2019, 38, 13150. [Google Scholar] [CrossRef]
- Zhang, Y.; Luo, W.; Wang, J.; Wang, Y.; Xu, Y.; Xiao, J. A Review of Life Cycle Assessment of Recycled Aggregate Concrete. Constr. Build. Mater. 2019, 209, 115–125. [Google Scholar] [CrossRef]
- Colangelo, F.; de Luca, G.; Ferone, C.; Mauro, A. Experimental and Numerical Analysis of Thermal and Hygrometric Characteristics of Building Structures Employing Recycled Plastic Aggregates and Geopolymer Concrete. Energies 2013, 6, 6077–6101. [Google Scholar] [CrossRef]
- Anderson, J.; Moncaster, A. Embodied Carbon of Concrete in Buildings, Part 1: Analysis of Published EPD. Build. Cities 2020, 1, 198–217. [Google Scholar] [CrossRef]
- Mohamad, N.; Muthusamy, K.; Embong, R.; Kusbiantoro, A.; Hashim, M.H. Environmental Impact of Cement Production and Solutions: A Review. Mater. Today Proc. 2022, 48, 741–746. [Google Scholar] [CrossRef]
- Orsini, F.; Marrone, P. Approaches for a Low-Carbon Production of Building Materials: A Review. J. Clean. Prod. 2019, 241, 118380. [Google Scholar] [CrossRef]
- Manjunatha, M.; Seth, D.; Balaji, K.V.G.D.; Bharath, A. B. Engineering Properties and Environmental Impact Assessment of Green Concrete Prepared with PVC Waste Powder: A Step towards Sustainable Approach. Case Stud. Constr. Mater. 2022, 17, e01404. [Google Scholar] [CrossRef]
- CEN EN 15804–2012; Sustainability of Construction Works, Environmental Product Declarations, Core Rules for the Product Category of Construction Products. European Standards: Bruxelles, Belgium, 2012.
- CEN EN 15804:2012+A2:2019; Sustainability of Construction Works—Environmental Product Declarations–Core Rules for the Product Category of Construction Products. European Standards: Bruxelles, Belgium, 2019.
- Božiček, D.; Kunič, R.; Košir, M. Interpreting Environmental Impacts in Building Design: Application of a Comparative Assertion Method in the Context of the EPD Scheme for Building Products. J. Clean. Prod. 2021, 279, 123399. [Google Scholar] [CrossRef]
- Palumbo, E.; Soust-Verdaguer, B.; Llatas, C.; Traverso, M. How to Obtain Accurate Environmental Impacts at Early Design Stages in BIM When Using Environmental Product Declaration. A Method to Support Decision-Making. Sustainability 2020, 12, 6927. [Google Scholar] [CrossRef]
- Anderson, J.; Rønning, A.; Moncaster, A. The Reporting of End of Life and Module D Data and Scenarios in EPD for Building Level Life Cycle Assessment. IOP Conf. Ser. Earth Environ. Sci. 2019, 323, 012051. [Google Scholar] [CrossRef]
- Hischier, R.; Weidema, B.; Althaus, H.-J.; Bauer, C.; Doka, G.; Dones, R.; Frischknecht, R.; Hellweg, S.; Humbert, S.; Jungbluth, N.; et al. Implementation of Life Cycle Impact Assessment Methods Data v2.2; Ecoinvent Report No. 3 v2.2.; Swiss Centre for Life Cycle Inventori: Dübendorf, Switzerland, 2010. [Google Scholar]
- Asan, H.; Sancaktar, Y.S. Effects of Wall’s Thermophysical Properties on Time Lag and Decrement Factor. Energy Build. 1998, 28, 159–166. [Google Scholar] [CrossRef]
- Baubook GmbH Baubook Database. Available online: https://www.baubook.info/ (accessed on 15 July 2022).
- EPD Danmark EPD Danmark Database. Available online: https://epddanmark.dk/ (accessed on 15 July 2022).
- EPD International AB International EPD® System Database. Available online: http://environdec.com/ (accessed on 10 July 2022).
- EPDItaly EPD Database. Available online: https://www.epditaly.it/ (accessed on 15 July 2022).
- The Norwegian EPD Foundation Epd-Norge. Available online: https://www.epd-norge.no/ (accessed on 10 July 2022).
- Institut Bauen und Umwelt IBU. Data. Available online: https://ibu-epd.com/en/ibu-data-start/ (accessed on 10 July 2022).
- Building Research Institute–Certification Company Ltd. Verification of Environmental Product Declaration. Available online: https://www.vups.cz/en/ (accessed on 10 July 2022).
- Building Research Establishment Ltd. Environmental Product Declarations (EPD) EN 15804. Available online: https://www.greenbooklive.com/search/scheme.jsp?id=260 (accessed on 10 July 2022).
- Bionova, Ltd. One Click LCA Database. Available online: https://www.oneclicklca.com/ (accessed on 10 July 2022).
- German Federal Ministry of the Interior Building and Community ÖKOBAUDAT Database. Available online: https://www.oekobaudat.de/en/database/database-oekobaudat.html (accessed on 15 July 2022).
- AENOR Global EPD Declarations in Effect. Available online: https://www.en.aenor.com/certificacion/certificacion-de-producto/declaraciones-ambientales-de-producto/declaraciones-globalepd-en-vigor (accessed on 15 July 2022).
- The Turkish Centre for Sustainable Production Research and Design EPDs by Sector—Construction Materials. Available online: https://epdturkey.org/en/ (accessed on 16 July 2022).
- Wernet, G.; Bauer, C.; Steubing, B.; Reinhard, J.; Moreno-Ruiz, E.; Weidema, B. The Ecoinvent Database Version 3 (Part I): Overview and Methodology. Int. J. Life Cycle Assess. 2016, 21, 1218–1230. [Google Scholar] [CrossRef]
- Hammond, G.P.; Jones, C.I. Embodied Energy and Carbon in Construction Materials. Proc. Inst. Civ. Eng. Energy 2008, 161, 87–98. [Google Scholar] [CrossRef]
- Minunno, R.; O’Grady, T.; Morrison, G.M.; Gruner, R.L. Investigating the Embodied Energy and Carbon of Buildings: A Systematic Literature Review and Meta-Analysis of Life Cycle Assessments. Renew. Sustain. Energy Rev. 2021, 143, 110935. [Google Scholar] [CrossRef]
- Martínez-Rocamora, A.; Solís-Guzmán, J.; Marrero, M. LCA Databases Focused on Construction Materials: A Review. Renew. Sustain. Energy Rev. 2016, 58, 565–573. [Google Scholar] [CrossRef]
- Cabeza, L.F.; Barreneche, C.; Miró, L.; Morera, J.M.; Bartolí, E.; Inés Fernández, A. Low Carbon and Low Embodied Energy Materials in Buildings: A Review. Renew. Sustain. Energy Rev. 2013, 23, 536–542. [Google Scholar] [CrossRef]
- Venkatarama Reddy, B.V.; Jagadish, K.S. Embodied Energy of Common and Alternative Building Materials and Technologies. Energy Build. 2003, 35, 129–137. [Google Scholar] [CrossRef]
- López-García, A.B.; Cotes-Palomino, T.; Uceda-Rodríguez, M.; Moreno-Maroto, J.M.; Cobo-Ceacero, C.J.; Andreola, N.M.F.; Martínez-García, C. Application of Life Cycle Assessment in the Environmental Study of Sustainable Ceramic Bricks Made with ‘Alperujo’ (Olive Pomace). Appl. Sci. 2021, 11, 2278. [Google Scholar] [CrossRef]
- Florentin, Y.; Pearlmutter, D.; Givoni, B.; Gal, E. A Life-Cycle Energy and Carbon Analysis of Hemp-Lime Bio-Composite Building Materials. Energy Build. 2017, 156, 293–305. [Google Scholar] [CrossRef]
- Nwodo, M.N.; Anumba, C.J. A Review of Life Cycle Assessment of Buildings Using a Systematic Approach. Build. Environ. 2019, 162, 106290. [Google Scholar] [CrossRef]
- Grant, A.; Ries, R. Impact of Building Service Life Models on Life Cycle Assessment. Build. Res. Inf. 2013, 41, 168–186. [Google Scholar] [CrossRef]
- Cabeza, L.F.; Rincón, L.; Vilariño, V.; Pérez, G.; Castell, A. Life Cycle Assessment (LCA) and Life Cycle Energy Analysis (LCEA) of Buildings and the Building Sector: A Review. Renew. Sustain. Energy Rev. 2014, 29, 394–416. [Google Scholar] [CrossRef]
- Goulouti, K.; Padey, P.; Galimshina, A.; Habert, G.; Lasvaux, S. Uncertainty of Building Elements’ Service Lives in Building LCA & LCC: What Matters? Build. Environ. 2020, 183, 106904. [Google Scholar] [CrossRef]
- UNI 10351:2015; Materiali e Prodotti per Edilizia–Proprietà Termoigrometriche—Procedura per La Scelta Dei Valori Di Progetto. UNI—Ente Nazionale Italiano di Unificazione: Milan, Italy, 2015.


| LCA Phases | |||||||||||||||||||
|---|---|---|---|---|---|---|---|---|---|---|---|---|---|---|---|---|---|---|---|
| A1–A3 | A4–A5 | B1–B7 | C1–C4 | D | |||||||||||||||
| Product Stage | Construction Stage | Use | End of Life | Benefits and Loads Beyond the System Boundary | |||||||||||||||
| A1 | A2 | A3 | A4 | A5 | B1 | B2 | B3 | B4 | B5 | B6 | B7 | C1 | C2 | C3 | C4 | D | |||
| M | M | M | O | O | O | O | O | O | O | O | O | M | M | M | M | M | M | M | O |
| Raw Materials Supply | Transport | Manufacturing | Transport | Construction | Use/application | Maintenance | Repair | Replacement | Refurbishment | Operational Energy | Operational Water | De-Construction/Demolition | Transport | Waste Processing | Disposal | Reuse | Recovery | Recycling | Exported Energy |
| Additive/Reference | Density Range [kg/m3] | Additive [% of Weight] | Compression (c)/ Bending (b) Resistance [MPa] | Thermal Conductivity [W/mK] |
|---|---|---|---|---|
| Reference (no additives) [51] | 1660 | - | 22 (c) | 0.29 |
| Vermiculite [51] | 1030 | 25 | 4 (c) | 0.24 |
| Wood ash [51] | 1430 | 25 | 20 (c) | 0.32 |
| Sawdust [51] | 839 | 25 | 2 (c) | 0.16 |
| Reference (no additives) [49] | 1900 | - | 10.4 (b) | 0.57 |
| Wheat straw [49] | 1860 | 1 | 10.0 (b) | 0.53 |
| Olive stone flour [49] | 1790 | 2 | 6.5 (b) | 0.46 |
| Glycerol carbonate [49] | 1830 | 2 | 7.0 (b) | 0.53 |
| Dimethyl carbonate [49] | 1880 | 2 | 7.5 (b) | 0.47 |
| Database | Abbreviation | Description | N. EPDs |
|---|---|---|---|
| Baubook [65] | Bau | It is a European administrator of EPD and LCA data contained within the online tool Ecosoft that was supported by the Austrian government. | 55 |
| EPD Danmark [66] | Den | It is a database containing a lot of EPDs developed in accordance with EN 15804 and verified by independent third-party verifiers. | 16 |
| EPD international AB [67] | Env | It is a collection of EPDs managed by the European administrator named International EPD System, a Sweden-settled company; the database includes the environmental declarations of a wide range of products manufactured in different countries. | 16 |
| EPD Italy [68] | Ita | It is the Italian EPD database that has been developed since 2016; the declarations refer to a lot of construction products of Italian manufacturers. | 26 |
| EPD Norge [69] | Nor | It is an EPD database managed by the “The Norwegian EPD Foundation”, a non-profit organization founded in 2002. | 15 |
| IBU [70] | Ibu | It is a German association that appoints EPD verifiers and manages an online database that makes public the information contained in the declarations in XML format. | 28 |
| VUPS [71] | Vups | It is a Czech Accreditation Institute that verify EPDs. | 14 |
| BRE GLOBAL [72] | Bre | It is a center for building science settled in the United Kingdom that develops EPDs. | 3 |
| OCL [73] | Ocl | It is a website managed by a Finnish group that gathers many verified data from public and private sources. | 2 |
| OEKOBAUDAT [74] | Oek | It is the mandatory database for the Assessment System for Sustainable Building, handled by the German Federal Ministry of the Interior, Building and Community. | 2 |
| AENOR [75] | Aen | It is a founding member of ECO Platform, the European Association of Environmental Declarations Verification Programmes. | 1 |
| EPD TURKEY [76] | Tur | It is a fully aligned regional program of The International EPD System run by the Turkish Centre for Sustainable Production Research and Design–SÜRATAM. | 1 |
| Wall Building Materials | Values for each Impact Indicator and Corresponding Source | Total n. |
|---|---|---|
| Hollow bricks | 51 Bau; 14 Vups; 9 Ita; 4 Ibu | 78 |
| Bricks | 16 Den; 2 Ocl; 2 Bre; 1 Aen; 1 Ibu | 22 |
| Concrete Blocks | 15 Ibu; 11 Nor; 4 Bau; 1 Bre; 1 Oek; 3Env; 1Tur | 36 |
| Prefabricated panels | 13 Env; 4 Ibu; 4 Nor | 21 |
| Sandstone bricks | 4 Ibu; 1 Oek | 5 |
| Wood-chips concrete shuttering blocks | 17 Ita | 17 |
| All types of wall | All | 179 |
| Wall Building Material | Density Range [kg/m3] | Compression Resistance [MPa] | Service Life [Years] |
|---|---|---|---|
| Bricks | 600–2300 | 4.0–60 | 150 * |
| Hollow bricks | 400–1604 | 7.5–60 | 150 * |
| Concrete Blocks | 115–2245 | 0.9–48 | 100 * |
| Prefabricated panels | 550–2377 | 2.8–45 | 75 * |
| Sandstone bricks | 1450–2570 | 10–60 | 50 * |
| Wood-chips shuttering blocks | 550 | - | 100 * |
| Wall Building Material | PENR [MJ/kg] | PER [MJ/kg] | GWP [kgCO2eq/kg] | |||
|---|---|---|---|---|---|---|
| Min. | Max. | Min. | Max. | Min. | Max. | |
| Bricks | 0.30 | 4.03 | 0.06 | 5.99 | 0.01 | 0.33 |
| Hollow bricks | 0.07 | 3.51 | 0.06 | 6.96 | 0.04 | 0.35 |
| Concrete blocks | 0.37 | 2.82 | 0.01 | 1.72 | 0.08 | 0.40 |
| Prefabricated panels | 0.48 | 5.51 | 0.10 | 0.78 | 0.16 | 0.44 |
| Sandstone bricks | 0.77 | 1.43 | 0.02 | 1.18 | 0.06 | 0.21 |
| Wood-chips shuttering blocks | 1.14 * | 5.02 ** | 1.61 * | 6.58 ** | 0.15 * | 0.65 ** |
| Wall Building Material | PENR [MJ/kg y] | PER [MJ/kg y] | ||||
|---|---|---|---|---|---|---|
| Min. | Max. | Avg. | Min. | Max. | Avg. | |
| Bricks | 0.0020 | 0.0269 | 0.0171 | 0.0004 | 0.0399 | 0.0074 |
| Hollow bricks | 0.0005 | 0.0234 | 0.0159 | 0.0004 | 0.0464 | 0.0054 |
| Concrete blocks | 0.0037 | 0.0282 | 0.0170 | 0.0001 | 0.0172 | 0.0049 |
| Prefabricated panels | 0.0064 | 0.0735 | 0.0280 | 0.0014 | 0.0104 | 0.0051 |
| Sandstone bricks | 0.0154 | 0.0286 | 0.0194 | 0.0004 | 0.0236 | 0.0070 |
| Wood-chips shuttering blocks | 0.0114 * | 0.0502 ** | 0.0205 ** | 0.0161 * | 0.0658 ** | 0.0314 ** |
| Wall Building Material | GWP [kgCO2eq/kg y] | ||
|---|---|---|---|
| Min. | Max. | Avg. | |
| Bricks | 0.0001 | 0.0022 | 0.0013 |
| Hollow bricks | 0.0003 | 0.0023 | 0.0013 |
| Concrete Blocks | 0.0008 | 0.0040 | 0.0023 |
| Prefabricated panels | 0.0021 | 0.0059 | 0.0030 |
| Sandstone bricks | 0.0012 | 0.0042 | 0.0026 |
| Wood-chips shuttering blocks | 0.0015 * | 0.0065 ** | 0.0027 * |
| Ref. | Material | Embodied Energy [MJ/kg] | Embodied Carbon [kgCO2eq/kg] |
|---|---|---|---|
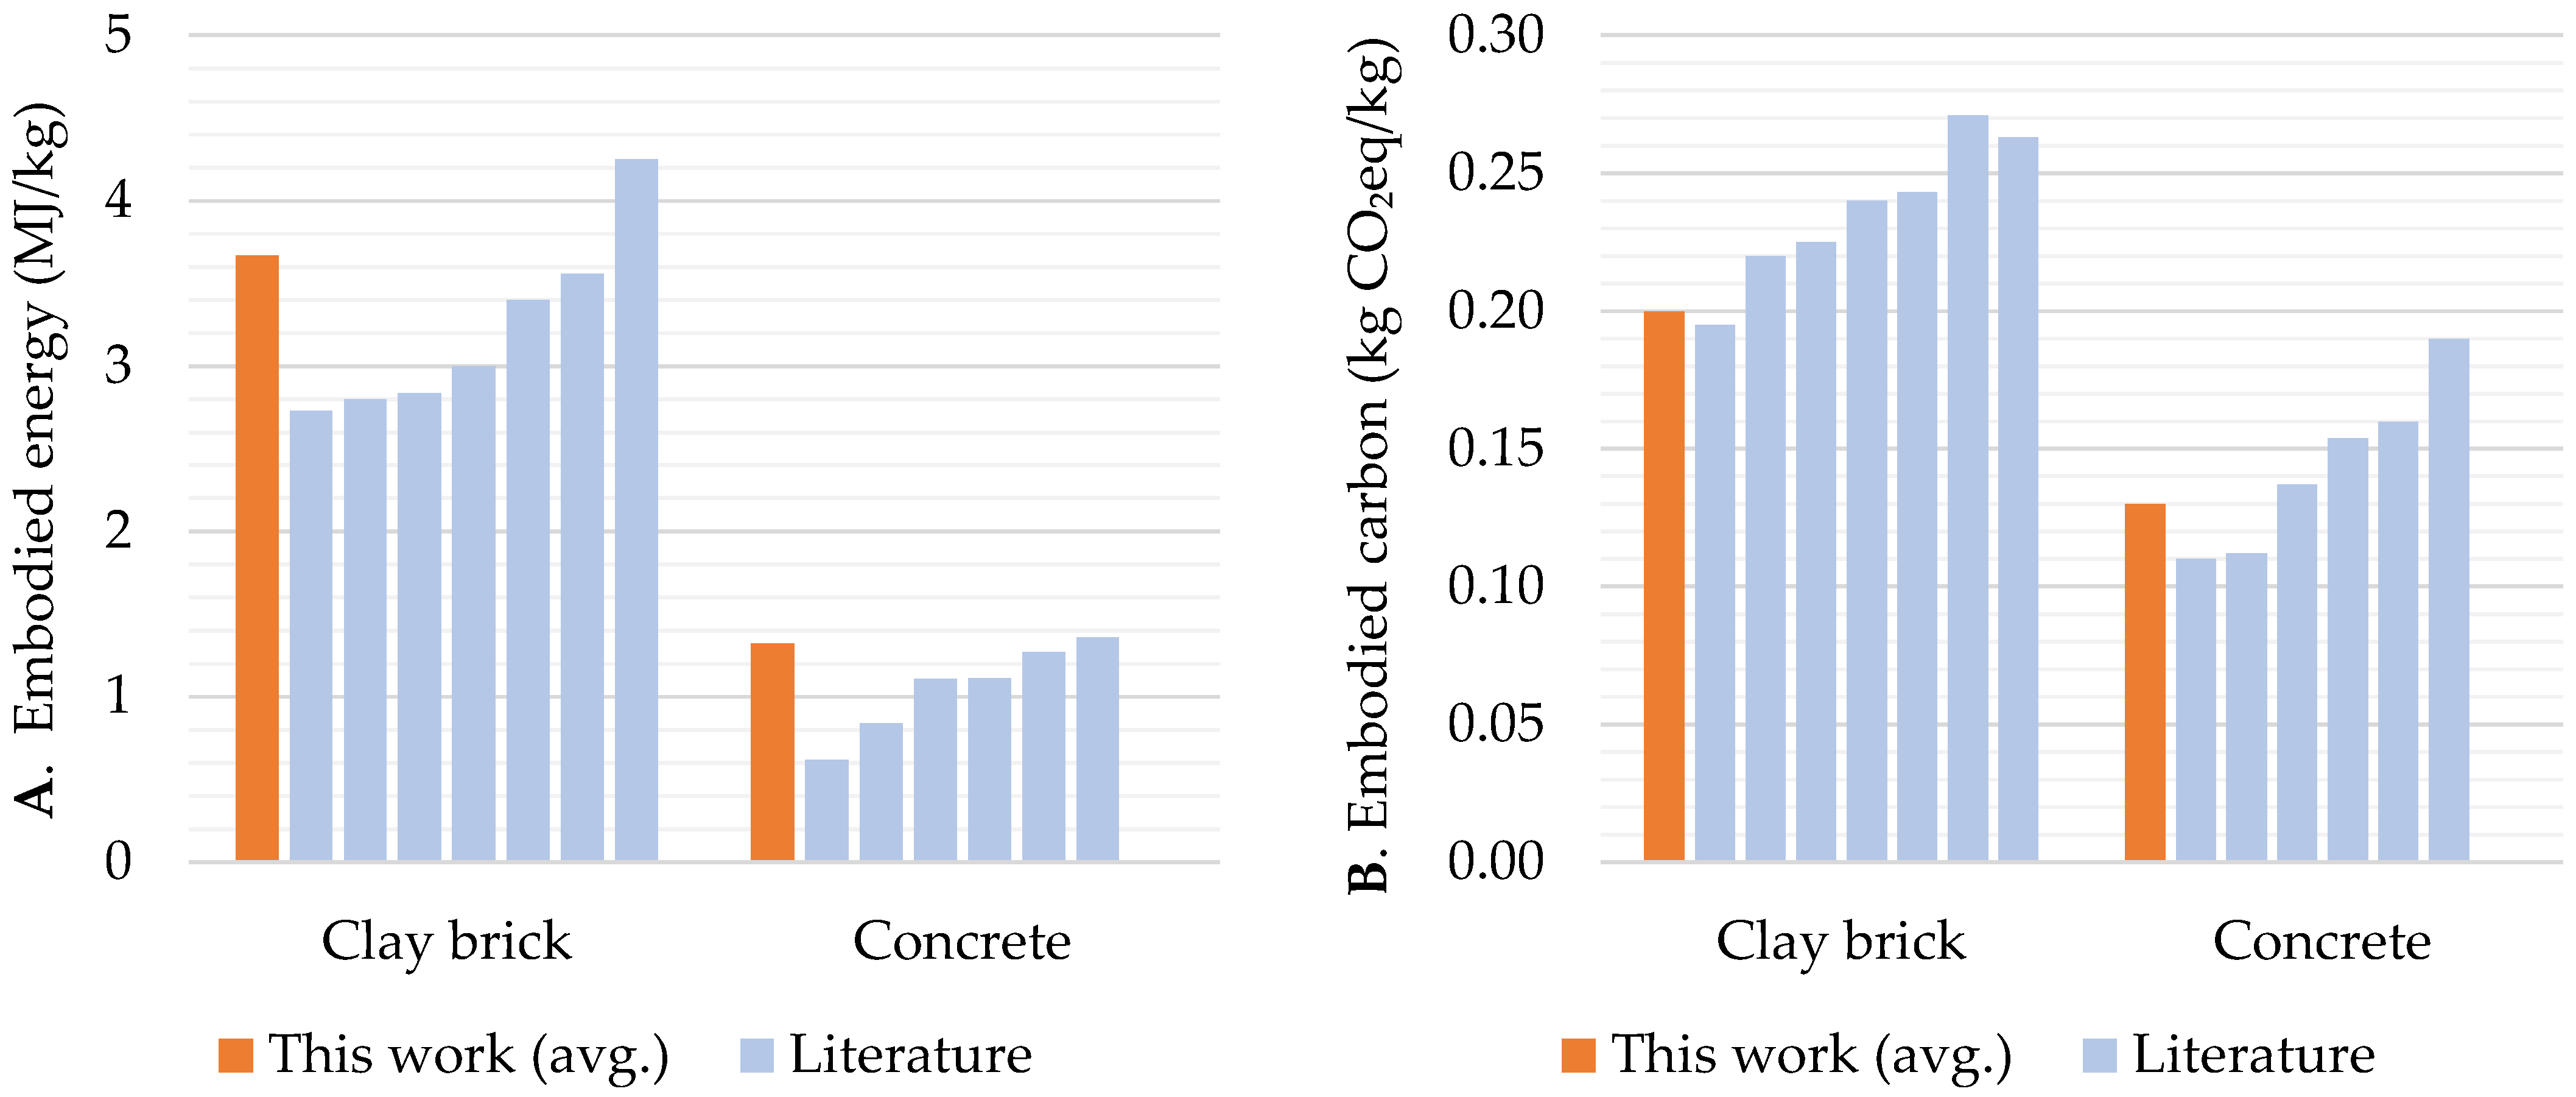
| This study | Ordinary bricks (avg.) | 3.67 | 0.20 |
| [77] | Clay brick | 2.73 | 0.243 |
| [39] | Ordinary bricks | 3.56 | 0.271 |
| [78] | Ordinary bricks | 3.00 | 0.225 |
| [79] | Bricks | 2.8 | 0.240 |
| [80] | Ceramic bricks | 2.84 | 0.220 |
| [81] | Bricks | 2.00–3.40 | - |
| [82] | Bricks | 4.25 | - |
| [83] | Ordinary bricks | - | 0.195–0.263 |
| Bricks with olive pomace | - | 0.310–0.424 | |
| [44] | Adobe bricks | 0.033–0.17 | 0.0017–0.0129 |
| This study | Concrete (avg.) | 1.32 | 0.130 |
| [77] | Concrete | 1.27 | 0.154 |
| [39] | Concrete | 1.105 | 0.137 |
| [78] | Concrete | 0.84–1.36 | 0.11–0.16 |
| [79] | Concrete | 1.11 | 0.190 |
| [80] | Concrete | 0.62 | 0.112 |
| This study | Concrete block (avg.) | 2.19 | 0.230 |
| [77] | Autoclaved concrete blocks | 2.33 | 0.355 |
| [84] | Autoclaved concrete blocks | 4.00 | 0.9 |
| Hollow concrete blocks | 1.10 | - | |
| [77] | Concrete block | 1.14 | 0.132 |
| Wall Building Materials | Wall Element | Density (kg/m3) | λ (W/mK) | Service Life (Years) | PENRA1–A3 (MJ/m2) | GWPA1–A3 (kgCO2/m2) |
|---|---|---|---|---|---|---|
| Concrete blocks | C.b. EPD 1 | 800 | 0.190 | 150 | 516 | 67 |
| C.b. EPD 2 | 500 | 0.130 | 50 | 300 | 43 | |
| C.b. EPD 3 | 750 | 0.180 | 100 | 414 | 60 | |
| Bricks | B. EPD 1 | 1825 | 0.650 | 150 | 784 | 75 |
| B. EPD 2 | 1550 | 0.500 | 150 | 697 | 39 | |
| B. EPD 3 | 1600 | 0.500 | 150 | 782 | 52 | |
| Hollow bricks | H.b. EPD 1 | 575 | 0.120 | 150 | 520 | 55 |
| H.b. EPD 2 | 575 | 0.120 | 150 | 712 | 71 | |
| H.b. EPD 3 | 807 | 0.179 | 150 | 293 | 40 | |
| Sandstone bricks | S.b. EPD 1 | 1800 | 1.030 | 50 | 192 | 28 |
| S.b. EPD 2 | 1890 | 1.000 | 50 | 173 | 27 | |
| S.b. EPD 3 | 1800 | 1.000 | 50 | 242 | 33 | |
| Wood-chips concrete shuttering blocks | S.w.b. EPD 1 | 1152 | 0.122 | 100 | 452 | 64 |
| S.w.b. EPD 2 | 801 | 0.079 | 100 | 419 | 47 | |
| S.w.b. EPD 3 | 1455 | 0.282 | 100 | 363 | 46 | |
| Prefabricated concrete panels | P.p EPD 1 | 2400 | 1.660 | 100 | 403 | 52 |
| P.p EPD 2 | 2400 | 1.660 | 100 | 242 | 41 | |
| P.p EPD 3 | 2400 | 1.660 | 100 | 464 | 55 |
| Wall Layers | Thickness (m) | Density (kg/m3) | λ (W/mK) | Service Life (Years) | PENRA1–A3 (MJ/m2) | GWPA1–A3 (kgCO2/m2) |
|---|---|---|---|---|---|---|
| Internal plaster | 0.015 | 920 | 0.410 | 40 | 27.5 | 2.1 |
| Insulation (EPS) | Variable | 30 | 0.035 | 50 | Variable | Variable |
| External finishing | 0.030 | 1800 | 0.900 | 40 | 83 | 11.2 |
| Wall Building Materials | Wall Case Study | Thickness Insulation Layer | Block Thickness | Superficial Mass of the Wall | Wall Thermal Resistance | PENR A1–A3 50 Years | GWP A1–A3 50 Years |
|---|---|---|---|---|---|---|---|
| (m) | (m) | (kg/m2) | (m2 K/W) | (MJ/m2) | (kgCO2/m2) | ||
| Concrete blocks | C.b. EPD 1 | 0.10 | 0.400 | 240 | 5.05 | 964 | 94 |
| C.b. EPD 2 | 0.11 | 0.240 | 240 | 5.08 | 784 | 71 | |
| C.b. EPD 3 | 0.10 | 0.400 | 240 | 5.17 | 862 | 87 | |
| Bricks | B. EPD 1 | 0.17 | 0.135 | 246 | 5.15 | 1363 | 108 |
| B. EPD 2 | 0.16 | 0.160 | 248 | 4.98 | 1261 | 72 | |
| B. EPD 3 | 0.16 | 0.150 | 240 | 4.96 | 1346 | 85 | |
| Hollow bricks | H.b. EPD 1 | 0.06 | 0.400 | 240 | 5.14 | 924 | 80 |
| H.b. EPD 2 | 0.06 | 0.400 | 240 | 5.15 | 1117 | 96 | |
| H.b. EPD 3 | 0.12 | 0.280 | 252 | 5.20 | 793 | 70 | |
| Sandstone bricks | S.b. EPD 1 | 0.17 | 0.135 | 243 | 5.08 | 771 | 62 |
| S.b. EPD 2 | 0.17 | 0.135 | 243 | 5.08 | 752 | 61 | |
| S.b. EPD 3 | 0.17 | 0.135 | 243 | 5.08 | 822 | 66 | |
| Shuttering wood chips blocks | S.w.b EPD 1 | 0.10 | 0.25 | 288 | 5.07 | 900 | 91 |
| S.w.b EPD 2 | 0.14 | 0.25 | 272 | 5.09 | 856 | 74 | |
| S.w.b EPD 3 | 0.15 | 0.20 | 290 | 5.16 | 911 | 78 | |
| Prefabricated concrete panels | P.p EPD 1 | 0.17 | 0.100 | 240 | 5.01 | 983 | 85 |
| P.p EPD 2 | 0.17 | 0.100 | 240 | 5.01 | 822 | 75 | |
| P.p EPD 3 | 0.17 | 0.105 | 238 | 5.01 | 1044 | 88 |
Disclaimer/Publisher’s Note: The statements, opinions and data contained in all publications are solely those of the individual author(s) and contributor(s) and not of MDPI and/or the editor(s). MDPI and/or the editor(s) disclaim responsibility for any injury to people or property resulting from any ideas, methods, instructions or products referred to in the content. |
© 2023 by the authors. Licensee MDPI, Basel, Switzerland. This article is an open access article distributed under the terms and conditions of the Creative Commons Attribution (CC BY) license (https://creativecommons.org/licenses/by/4.0/).
Share and Cite
Asdrubali, F.; Grazieschi, G.; Roncone, M.; Thiebat, F.; Carbonaro, C. Sustainability of Building Materials: Embodied Energy and Embodied Carbon of Masonry. Energies 2023, 16, 1846. https://doi.org/10.3390/en16041846
Asdrubali F, Grazieschi G, Roncone M, Thiebat F, Carbonaro C. Sustainability of Building Materials: Embodied Energy and Embodied Carbon of Masonry. Energies. 2023; 16(4):1846. https://doi.org/10.3390/en16041846
Chicago/Turabian StyleAsdrubali, Francesco, Gianluca Grazieschi, Marta Roncone, Francesca Thiebat, and Corrado Carbonaro. 2023. "Sustainability of Building Materials: Embodied Energy and Embodied Carbon of Masonry" Energies 16, no. 4: 1846. https://doi.org/10.3390/en16041846
APA StyleAsdrubali, F., Grazieschi, G., Roncone, M., Thiebat, F., & Carbonaro, C. (2023). Sustainability of Building Materials: Embodied Energy and Embodied Carbon of Masonry. Energies, 16(4), 1846. https://doi.org/10.3390/en16041846