Abstract
With the enhancement of people’s awareness of heritage protection, research communities focusing on the natural ventilation of the layouts of ancient buildings have paid more attention to the planning and protection of these buildings. Based on the relationship between the natural ventilation environment and the layout of the building, we can reduce the adverse effects of energy consumption and outdoor wind, improve the environment and quality around the building, and achieve harmony between humans and nature. In this study, Fluent software was used to simulate the wind environment of Xingguo Temple. The advantages of combining computer simulation software with ancient building protection planning are illustrated by comparing the wind environment before and after the temple reconstruction with Fluent software. Through the simulation of the building’s wind environment, some suggestions are put forward for the early layout of the outdoor environment in the ancient building reconstruction planning area.
1. Introduction
Having been a civilised country for thousands of years, China has accumulated an abundance of historical treasures in its long history. Among them, excellent Buddhist architecture is an essential part.
During the Eastern Han Dynasty, Buddhism was introduced to China from India. Buddhist architecture also formed the unique characteristics of Chinese Buddhist architecture in light of the features of Chinese architecture. Existing buildings with a relatively long history are mostly Buddhist architecture. The future preservation of these traditional buildings is not optimistic. Many excellent historic buildings have disappeared in the last hundred years, along with the continuous development of the social economy, historical building protection and commercial land development at the same time []. This contradiction is increasingly severe, so protecting these excellent historical buildings is necessary []. The protection and utilisation of these buildings are important aspects that need to be studied.
In the current literature on the protection and utilisation of Buddhist architecture, some scholars have studied Buddhist architecture from the aspect of religious culture [,], and many scholars have continued to study and utilise architectural remains from the perspective of architectural culture [,,,,]. Other studies have looked at digital technology, acoustics and so on [,,]. Not many works in the literature have analysed Buddhist buildings’ wind environments from the perspective of green buildings. Yuhang Li et al. used Computational Fluid Dynamics (CFD) simulations to predict the wind pressure on a complex high-rise wooden Buddhist tower []. Yu-Chou Wu et al. used Computational Fluid Dynamics (CFD) simulations to examine the interaction between the flow and the Jean-Marie Tjibaou Cultural Center, designed by Renzo Piano []. There is currently no literature focusing on the comparative analysis of the wind environment before and after renovation. This paper analyses the wind environment before and after a monastery’s construction and the water body’s influence on the wind environment.
Recently, most studies in the literature analysing the green environments of traditional buildings have mainly focused on studying conventional residential buildings. Some scholars have studied the thermal comfort of traditional residential buildings [,,]. Other scholars emphasised combining traditional culture with green building technology [,]. Some of the literature focuses on the study of historical settlement architecture [,].
Gaotang Liangcun Xingguo Temple is located in Gaotang County, 15 km north of Liangcun Town (Figure 1). The northeastern part of the base is the main hall of Xingguo Temple, which is a provincial cultural relic protection unit of Hebei Province. Xingguo Temple covers an area of 46,287 square metres, of which the building area accounts for 6300 square metres. The ancient pagoda covers an area of 33 square metres. It is a hollow brick tower, like a wooden pavilion. It is made of black, white and grey brick on the outside and black brick and yellow mud inside. The building is 38.86 m high, and its base circumference is 22.8 m. The tower base covers an area of 33 square metres (Figure 2) [].
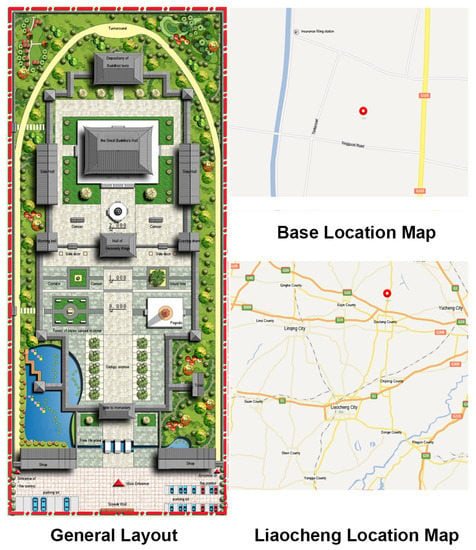
Figure 1.
Planning and transformation.
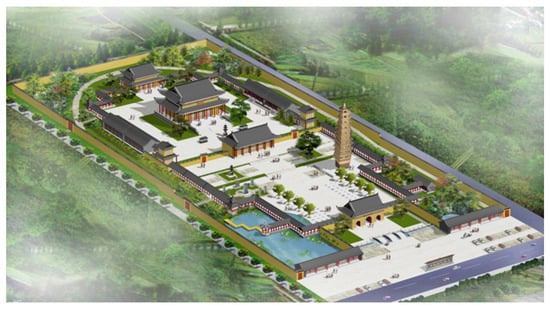
Figure 2.
Gao Tang. Aerial of Gaotang Xingguo Temple and view. Location map.
After the founding of the People’s Republic of China, the temple fell into disrepair, and most of its buildings were severely damaged. Only the ancient tower of ancient Huai and a small monument were left. After that, there were two maintenance projects. The first was only to strengthen the building, and the second was to overhaul the tower, called “the major surgery”. Around 2000, the government used some funds to restore the temple, and designers renovated and rebuilt it [].
With a long history of ancient temples, Gaotang County has typical Buddhist architectural features. In the planning and transformation of the Buddhist culture, a deeper understanding is first required. After Buddhism’s introduction to China, Buddhist architecture’s unique characteristics were formed. Buddhist buildings were built throughout the country in the Ming and Qing Dynasties. There are still many Buddhist buildings throughout the country, which gradually merged with local facilities in terms of form and other aspects. Buddhism buildings have similar characteristics to the local architecture, mainly in the following points: the overall layout was courtyard-styled, and the plane is in the middle of the two symmetrical axes, north–south and east–west []. In the north–south vertical orientation, there are generally multiple courtyard layouts. From south to north generally lies the gate, King Hall, main hall, etc. There are halls on both the east and west sides.
Xingguo Temple was chosen as the research object in this study, firstly because we had participated in the design and restoration of the building years ago. We could thus provide more detailed basic information for this research. Secondly, the layout of Xingguo Temple has the planning characteristics of typical traditional architecture, which is suitable for this research. This study used the CFD technique to analyse the wind environment before and after regional planning and transformation [].
2. Wind Environment Analysis Methods
2.1. Methods for Analysis of Wind Environments—Numerical Simulation
The wind tunnel model test method is one of the main methods to predict the surface wind pressure of buildings. However, with the rapid development of computer technology, numerical simulation has gradually become a new and effective method to predict the surface wind pressure, ambient wind speed and turbulence characteristics of buildings in wind tunnel tests. There are many mathematical models for the numerical simulation of the flow field around buildings. However, the k-ε two-equation turbulence model is the most commonly used in engineering. The equation is usually used to simulate the three-dimensional flow field around buildings using the k-ε turbulence model based on the Reynolds mean N-S equation. A multifunctional commercial programme (FLUENT5.4) was used to calculate the flow according to incompressible three-dimensional turbulence. The Gambit programme was used for grid generation. In complex models, Gambit automatically generates hexahedral grids, thus significantly reducing the computation time.
The numerical simulation method adopted aims at determining the wind field and wind pressure of buildings. The plan can not only simulate individual buildings and obtain the wind field and wind pressure of structures with different wind directions but also simulate buildings and obtain the distribution of the wind field in buildings. A series of problems, such as the vortex distribution, the pressure gradient, the negative pressure zone and the influence of spacing between buildings on the wind field, can be understood through diagrams.
The numerical simulation method can reasonably predict the flow line distribution around complex buildings and the average wind pressure on the surface. The simulation results agree well with the wind tunnel test results. The powerful analysis ability of computer numerical modelling technology foresees its broad development prospects in the engineering application field.
Currently, Phoenics, Fluent, Vent, AirPark and other software for the numerical simulation of wind environments are widely used. Fluent is characterised by efficient computation, intuitive expression, fast modelling, automatic mesh division and direct parameter setting. After much research and many practical engineering applications, the reliability of the calculation results was verified by comparing the results with wind tunnel test results.
As powerful and widely used numerical simulation software, Fluent has been used by many scholars to analyse the wind environment of buildings in recent years and has achieved good results. Qureshi et al. used Fluent software to analyse the evaluation of the horizontal wind environment of pedestrians in the plane form of cross-shaped high-rise buildings []. Wei, You et al. used Fluent software to study the relationship between the building layout and ventilation efficiency to improve the residential wind environment []. Y. Yu et al. used Fluent software to study the diffusion of air pollutants around high-rise buildings with different wind incidence angles []. Kaustav used Fluent to analyse the influence of changing the building size and location on natural ventilation and airflow in staggered residential projects in Singapore []. Lan Chen et al. studied street canyons’ wind and thermal environment values with Fluent software [].
In this study, Fluent software was used for CFD analysis. In the study of the wind environment, the aim is to establish a mathematical model and construct a model equation, discretise the fluid mass conservation equation and momentum equation based on the wind as the essential fluid, solve the discrete algebraic equations and obtain the approximate value of the required physical quantity. In recent years, as the performance of computer hardware has been dramatically improved, computer numerical simulation technology has been more widely used in the study of wind environments.
2.2. The selection of the Mathematical Model
Computational Fluid Dynamics (CFD) is a new branch of the numerical simulation and analysis of hydrodynamic problems using electronic computers and discrete numerical methods. With the development of the computer hardware industry, CFD has been widely applied in the past 20 years due to its low cost, ability to simulate relatively complex calculation processes and minor differences from the results of wind tunnel experiments.
The CFD software used in this simulation is by FLUENT Inc. The FLUENT software combines computing software in different fields to form a CFD computer software group. The numerical exchange can be carried out conveniently in the software, and unified pre- and post-processing tools are used to simulate complex flows, from incompressible to highly compressible. Due to the adoption of a variety of solution methods and multiple-grid accelerated convergence technology, FLUENT can achieve the best convergence speed and solution accuracy.
The process of numerical simulation is divided into geometric modelling, the selection of the physical turbulence model, the definition of boundary conditions, the generation of the mesh, the solution and post-processing.
The standard K-ε model proposed by Launder and Spalding is the primary tool for calculating the engineering flow field []. This model assumes that the flow is entirely turbulent and ignores the influence of molecular viscosity. Due to its low fluctuation, high accuracy and appropriate calculation amount in numerical calculations, it is widely used [,]. This study adopted the RNG K-ε turbulence model for simulations [,]. The governing equation of turbulence is shown in Equation (1). As shown in (4), (1) is the continuity equation, (2) is the momentum equation, (3) is the k equation, and (4) is the ε equation.
In the equation:
Among them, Ui (=1,2,3) represents the average velocity components along the X, Y and Z axes, respectively; k and are the turbulent kinetic energy and turbulent dissipation rate; P is the average pressure; is the air density; Sij is the mean strain tensor component; is the airflow motion viscosity; is the motion viscosity of the vortex mass; Cu = 0.085, C1 = 1.42 and C2 = 1.68; = 0.72; = 0.72; = 4.38; and = 0.015.
This paper mainly analyses the architectural complex; the wind environment inside the building needs to be discussed.
3. Simulation Analysis
3.1. External Environment
Xingguo Temple in Gaotang County is under the jurisdiction of Liaocheng City, Shandong Province, a city with a resident population of 50 million people and an area of 960 hectares. The county is flat because it is mainly in plain terrain. The terrain is high in the southwest and low in the southeast, with a slope of about 1/7000–1/9000. For the territory at the lower elevation, the highest point is only 32.1 m, and the lowest point is only 22.6 m. The climate of Gaotang County is a temperate semi-arid monsoon regional, continental climate. It has apparent seasonal wind changes, high wind speeds and less precipitation in the spring. In summer, it has high temperatures and humidity, and rainfall is mainly concentrated in July and August; precipitation in autumn is reduced, and the temperature drops sharply. In winter, the precipitation is less, but the temperature is low []. By accessing relevant information, we obtained the relevant meteorological data in the Gaotang area, as shown in Figure 3 and Figure 4.
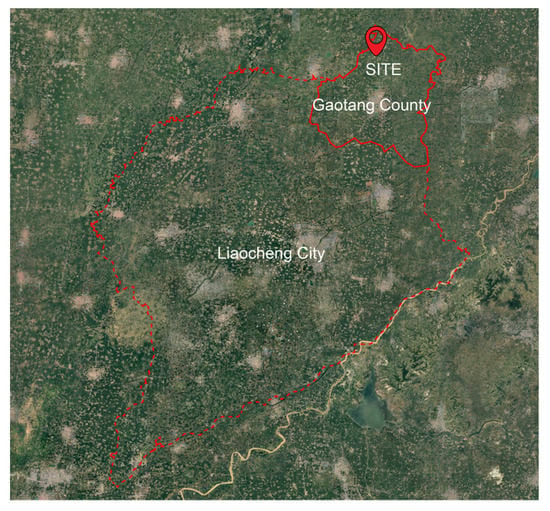
Figure 3.
Liaocheng City map.
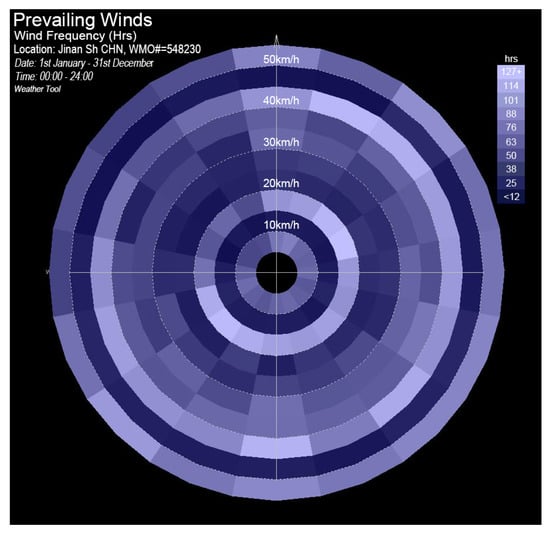
Figure 4.
Shandong annual wind frequency chart (latitude 36°52′, longitude 116°14′).
In Figure 5, the first line from top to bottom is the annual maximum temperature distribution curve. The second line is the minimum yearly temperature distribution curve, and the column shows the annual rainfall.
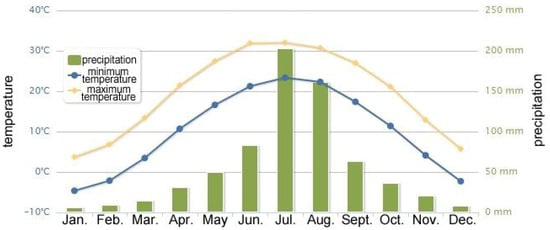
Figure 5.
Shandong annual temperature and humidity analysis curve.
As shown in Figure 4, the region’s maximum annual wind speed is about 21 m/s. The different colours in the figure represent the total length of wind speeds at all levels throughout the year. Through a meteorological data analysis, we can obtain the meteorological conditions of Liaocheng City. This experiment simulated the typical working conditions of summer southeast wind by using Fluent and the technical aspects of the rationality of the temple’s layout. Since the main analysis object of this case is the external wind environment of the architectural complex, steady-state analysis can be adopted in the selection of the analysis type. The reference pressure is set to one atmosphere. Since the building outflow field is forced flow, it is unnecessary to consider the influence of gravity.
3.2. Model Simplification
We use the Gambit modelling tool to establish the model for the temple group simulation. The plane simulation results at 1.5 m, 15 m and 20 m from the ground were selected to simultaneously analyse the central activity plane’s wind environment in the monastery. Figure 6 is a simplified model diagram before and after the planned transformation, of which (a) is a streamlined model before the planning and renovation, with only the ancient tower and a neglected pool. In the revised model, the old building is set as an octagonal cylinder with a radius r = 3.4 m, with a total height of 39 m (Figure 6a). The bottom elevation of the building is taken as the 0 elevation point. The level of the pool is −1 m. (b) Figure 6 is a simplified model for the CFD simulation of Xingguo Temple after renovation. In the modelling process, the main object of the analysis is the interior wind environment. The foundation is at 0 m, and the elevation of the water surface is −1 m. The ratio between the two models and the actual complex is 1:1.
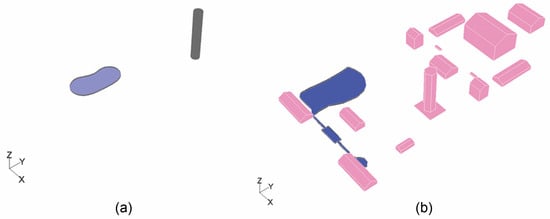
Figure 6.
Gambit built a simplified plan: before (a) and after (b) the transformation of the model.
3.3. Boundary Conditions and Meshing
After the mathematical model and the control equations are determined, reasonable boundary conditions must be selected so that the simulation experiment is close to the actual situation. According to Figure 3 and Figure 4, the wind speed and direction in summer at the location of Xingguo Temple were obtained to establish the input and output conditions of the simulation area. Although the actual wind speed and direction vary over time, a constant value must be set for convenience in the analysis. This condition defines the inlet as the velocity–inlet boundary condition in Fluent. From the geographical and climatic characteristics of Liaocheng, due to the high temperature and humidity in summer, the wind environment effect is more evident in the analysis than in other seasons, so the wind was set to be typical for summer (southeast wind, wind speed 3 m/s). In the calculation, we defined the outlet using free outflow boundary conditions, assuming that the flow on the outflow surface has been fully developed and the flow has reverted to the normal flow without obstructions from the buildings; that is, the relative pressure of the outlet is zero []. The reflux method is total pressure, and the reflux direction is perpendicular to the boundary. The boundary of the building surface is set as the wall, and the airflow velocity at the wall surface is zero.
In the simulation process, the grid quality often affects the calculation’s accuracy and precision. Yoshihide’s research group compared the numerical analysis, wind tunnel test and measured results of 7 cases and summarised some principles of mesh partitioning in CFD calculations []. In this work, with the help of Gambit and the pre-processing software FLUENT, the flow field calculation area was divided into unstructured grids. The Gambit software has robust meshes that can be divided into high-quality meshes with special CFD requirements, such as boundary layers. Using Gambit software will significantly reduce the time required to build geometric models and flow fields and divide meshes during CFD applications, especially for generating unstructured meshes. The unstructured grids have no stable topological structure, many mesh shapes, and high flexibility, which is convenient for simulating complex underlying surfaces. In the test, relatively dense grids were first arranged on the walls of the buildings to adapt to the changes in the flow field. In contrast, relatively sparse grids were placed on the periphery of the architectural complex, and then the whole flow field was divided regionally from the surface to the volume. The grid division of the building surface and ground is shown in Figure 7.
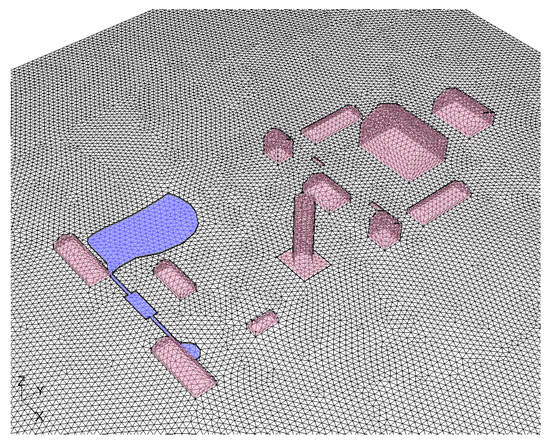
Figure 7.
Unstructured grid.
3.4. Before and after the Transformation of Planning at Different Levels of Wind Environment Performance
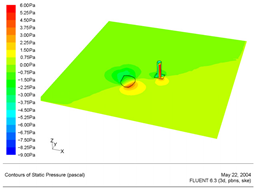
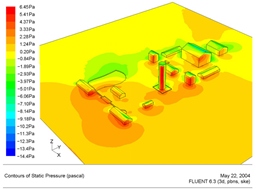
The two models were subjected to numerical simulation analysis, and after the iterative calculation was performed a sufficient number of times, the following cloud was obtained.
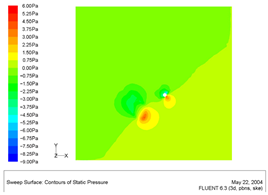
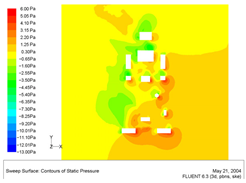
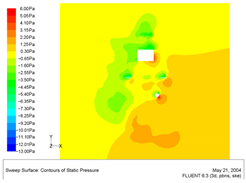
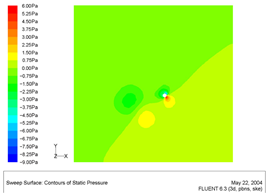
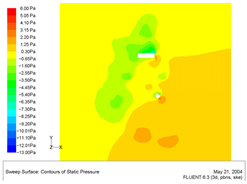
As shown in Table 1, we can see the wind pressure of the monastery and the monastery’s planned transformation after the planning of the Xingguo Temple at 1.5 m, 15 m and 20 m in height. In summer, the wind pressure and total pressure of the monastery within a 1.5 m height are maintained between 0 pa and 6 pa. The vast majority of buildings will form a positive-pressure area. Along the direction of the airflow, the static pressure and the absolute pressure in the ancient tower area are relatively high, about 5 pa; next to the waters, due to the impact of water evaporation, a wind pressure area also formed, about 0.75 pa. After the transformation of the monastery, the south and north of the monastery (morning bell, west hall, possession of the Court) form a longer static pressure zone, where the wind pressure is 0.3 pa or so. In these low-pressure areas, the wind speed is not conducive to the spread of pollutants, and it is not easy to blow away heat around the building in the summer [,].

Table 1.
Height of the wind pressure, wind speed and wind direction (1.5 m, 15 m, 20 m) before and after the planned transformation.
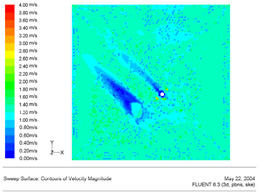
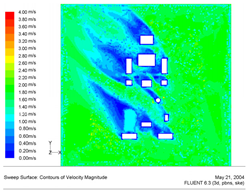
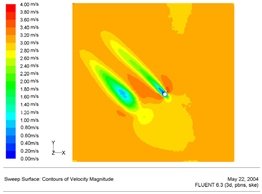
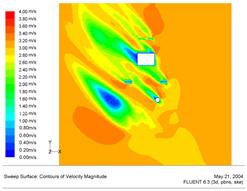
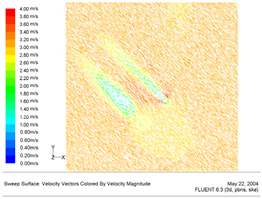
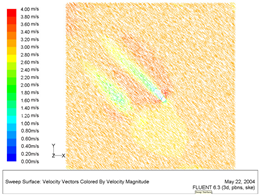
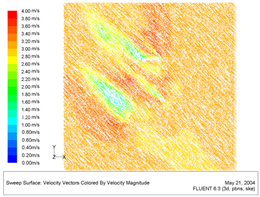
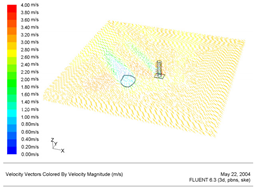
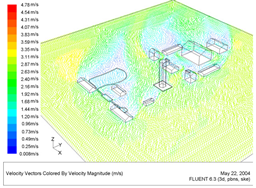
We can see the wind speed of the monastery before and after the planning of Xingguo Temple at 1.5 m, 15 m and 20 m heights in Table 1. Before the monastery’s transformation, the wind speed at a 1.5 m height around the ancient pagoda was maintained at 1–2–4 m/s at most. The maximum wind speed was between 2.4 and 3.4 m/s. In the old tower and the waters next to the emergence of two extended wind areas, as the height increases, the static wind area behind the ancient building remains []. After the transformation of the monastery, the wind speed around the monastery at the height of 1.5 m remained between 0.2 and 2.2 m/s because the new buildings and walls blocked it. Around the ancient tower, the wind speed was reduced to 0.4–1.6 m/s, and the temple appears to have a quieter wind area, the rate of which is 0.2 m/s or so. The wind speed of these areas is not conducive to the proliferation of pollutants []. With the height growth, the wind speed increased at 15 m, where most of the local wind speed remained at 1.6–3 m/s, but the ancient tower, main hall and waters still have a sizeable static wind area.
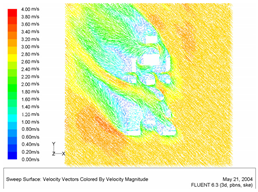
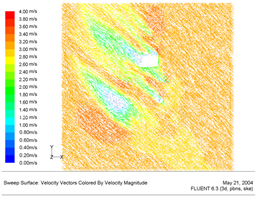
The wind vectors of the monastery and the monastery’s planned transformation of Xingguo Temple at 1.5 m, 15 m and 20 m heights are shown in Table 1. As can be seen in the figure, before the transformation of the monastery, there was a large whirlpool next to the ancient tower. After the monastery’s planned transformation, among the main hall, the King Hall, the Side hall, the Scripture library and the pagoda formed many smaller whirlpools. In these areas, wind treatment is essential; otherwise, it will cause discomfort to tourists [,].
3.5. Building Surface Wind Environment Analysis
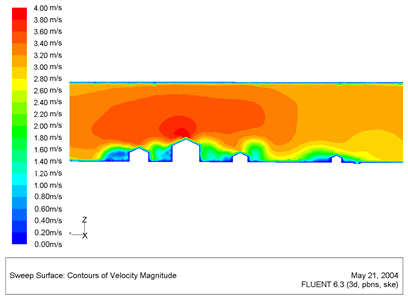
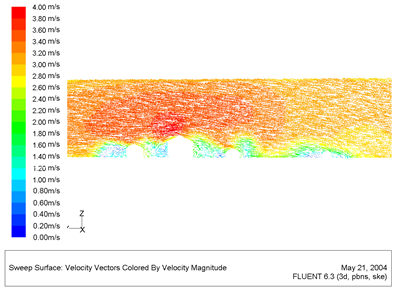
Table 2 shows the elevation wind map of the temple after the reconstruction, the wind pressure map and the wind vector. As seen in the Table 3, the wind area formed by high-rise buildings (ancient tower, main hall) is more significant than that of multi-storey buildings or low-rise buildings (Dazang Pavilion, side hall, early bell). The farther the distance between the multi-storey buildings, the less the shielding effect of the front wind environment. The wind speed at the bottom of tall buildings is minimal, the wind direction on the lee side is lower, and the wind speed on the lee side is lower. As the wind increases, the wind environment on the leeward side of the high-rise building and the building combination depend more on the height and plane of the building itself [,,,].

Table 2.
The elevation wind map of the temple after the reconstruction, the wind pressure map and the wind vector.

Table 3.
Three-dimensional wind pressure and direction maps (the picture above shows the situation before the transformation).
3.6. Wind Environment Analysis Based on Pedestrian Comfort
After the transformation, the region’s development for religion, tourism and culture as one of the Buddhist tourism scenic areas attracts many tourists. Compared with the building before reconstruction, the difference between the open environment and the reconstructed structure will inevitably affect the construction of the wind environment [,,].
According to the planning layout of Xingguo Temple, there was only one ancient pagoda and a small pool in the base before the transformation. The plan of the renovated building restores the old pagoda, expands the pool area and restores the axisymmetric courtyard layout of the ancient Xingguo Temple, according to ancient books. The restored buildings generally face south and have an incidence angle of about 30–50° from the summer wind. This planar orientation not only ensures the good ventilation of the building but also prevents discomfort caused by wind directly passing through the building or forming a large air duct. The water area after restoration is much larger than that before restoration. Because the water body can absorb heat and emit water vapour in the summer, increasing the water body area can play a specific role in cooling, providing visitors with a more comfortable sensory experience.
The following is a comparative analysis of the data on the pedestrian-height (1.5 m) wind environment before and after the planning [].
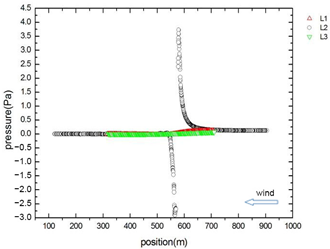
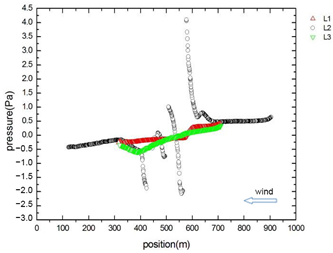
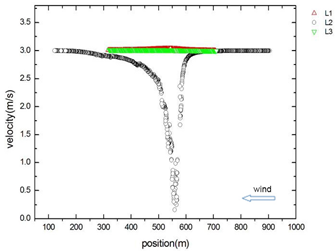
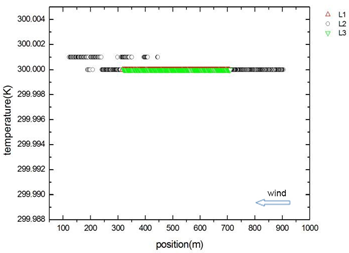
As shown in Figure 8a,b, a square having a side length of 400 m was selected as the observation area in the previously calculated location, and the entirety of the monastery may be included. Figure 8b shows the diagram after the transformation. In the same squares, we can select three straight lines parallel to the wind direction as the observation lines and observation points on the observation lines, denoted L1, L2 and L3; there are 410,943,410 observation points, and these points in the data are read for the analysis. In these two schematics, three lines, L1, L2 and L3, are in red, black and green, respectively. The L2 diagonal goes through the ancient tower. L1 and L3 observation lines are before and after the end of the square’s four sides. The wind pressure, speed and temperature values of the three wind observation points are read after the drawing analysis [], as shown in Table 1, the comparative analysis table.
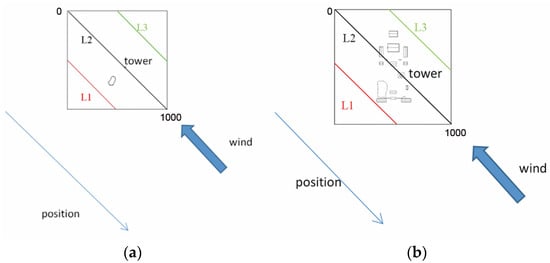
Figure 8.
Before and after the transformation: (a,b) observation line location diagrams.
In the analysis chart in Table 4, the horizontal axis coordinates are the point positions from northwest to southeast, and the vertical axis is wind pressure, speed and temperature. The different colored lines and shapes in the table correspond to L1, L2, and L3 in Figure 8. In the left and right comparison columns, the range of the vertical and horizontal coordinates of these graphs are the same, so the wind environment changes caused by the transformation can be intuitively seen by contrasting these left and right figures [].

Table 4.
Observation points’ pressure, wind speed and temperature comparison before and after the transformation.
In the comparative wind pressure analysis, we can see that the additional wind pressure values for the observation points on L1 and L3 are almost 0 on the left side of the reconstructed wind pressure plot. On L2, due to the ancient tower’s existence, the wind pressure value at 570 m (Table 4) appears to jump, which is consistent with expectations. The wind pressure values at these points are relatively scattered in the wind pressure analysis chart after the transformation. The variation laws of L3 and L1 are similar, and the wind pressure drops slowly from 0.5 Pa to −0.5 Pa along the wind direction. In reducing the slight bounce, the pressure on L2 is profound compared to the transition before the change, but the tower still has a noticeable jump in its position in the tower. Several smaller jumps in the rear are related to the new building behind [,,]. At points on L1 and L3, the wind pressure values are more disturbed than before, especially in the middle zone, and the overall wind pressure value should be lower.
In the comparative analysis of the wind speed, it can be seen that in the wind speed diagram before the transformation, the wind speed values of the observation points on L1 and L3 are the same at 3.0 m/s, which is also the initial wind speed set at the boundary entrance. In the absence of building blocks, the winds at points on L1 and L3 do not decrease, and the ventilation is good. On L2, due to the existence of the ancient tower, we can see that the wind speed on the abscissa at the 570 m position has a sharp reduction, with a minimum removal of 0 m/s. Then, the wind speed along the wind direction gradually increases on the abscissa at 200 m. The speed in this position has risen to 2.9 m/s. The sharp decrease in L2 is consistent with the presence of the windshield area of the ancient tower in the figure. In the wind speed analysis chart, on the right side of the transformation, the values of the three observation lines fluctuate. The wind speed on L1 is gradually reduced from 3.0 m/s at 700 m to 2.2 m/S; at the L3 observation point, the wind speed decreases from 3 m/s to 2.3 m/s and then again rises to 2.9 m/s, and at the L2 observation point, the wind speed fluctuates. Along the wind speed direction, the wind speed slows down from 3 m/s, and at the 700 m position, it has been reduced to 2.8 m/s. Then, from 600 m to 0 m/s, the wind speed at the L2 observation point fluctuates between 600 m and 400 m. After 400 m, the wind speed gradually increases and rises to 3.0 m/s at 100 m. Comparing the left and right figures, we can see that due to the addition of new buildings in the core area of 400–600 m, the wind speed has significant fluctuations compared with before the transformation and is less than 3.0 m/s. Still, it also shows no canyon effect, and the local wind speed is not enhanced. However, due to the new buildings’ blockage, the wind area’s core area has significantly increased in many places without wind. The ventilation in these areas is not very good [,,].
The temperature comparison analysis shows that the temperature values of observation points on L1 and L3 coincide with 300 K in the temperature map before the transformation on the left side, which is also the initial boundary value. The temperature value at the observation point is 100.00~450 m, and the temperature value of this part is 300.001 K, but it is not the same as 300 K. The small effect on the temperature change can be considered before the transformation, although there is a smaller pond. In the after-transformation temperature diagram, the temperature value points on L2 and L3 are 300 K compared with before the change, and the temperature value on L1 is altered. Along the direction of the wind speed, the temperature point on L1 is also the initial temperature of 300 K in the range of 700 m to 500 m. Still, from the 500 m position, the temperature of these points is reduced, and it is not a continuous reduction. The temperatures at these points are more dispersed, with the lowest reduced to 299.989 K, and the 300 m position has rebounded, rising to 299.95 K. In comparison, the small pond before the transformation has little effect on the temperature of the whole area because of its small size [,,]. After the transformation, the water area increased significantly, in a particular range that can improve the regional temperature environment and help improve the comfort of pedestrians.
In the comparison of the wind pressure, wind speed and temperature before and after the transformation, the data on these observation points were statistically analysed, and the average values of wind pressure, wind speed and temperature before and after the transformation were obtained on L1, L2 and L3 [,]. Changes in the mean and the data obtained from the statistics are shown in Table 5.

Table 5.
Comparison of observation points before and after planning and transformation.
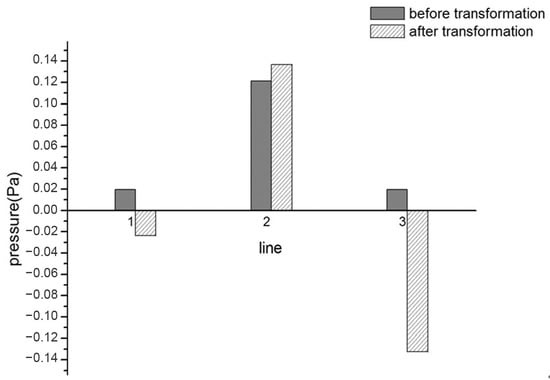
Figure 9.
The average pressure changes on the three observation lines before and after the planned transformation.
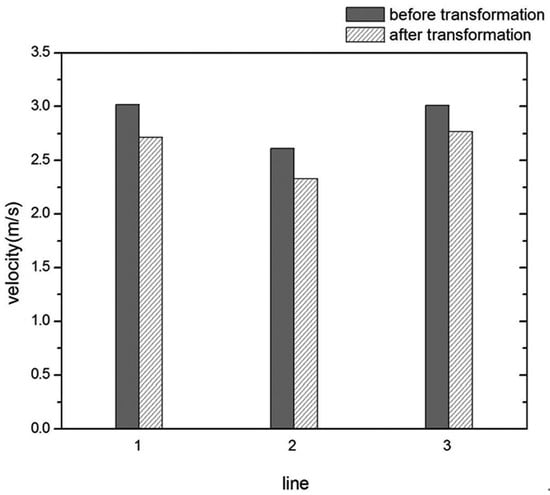
Figure 10.
The average wind speed change on the three observation lines before and after the planned transformation.
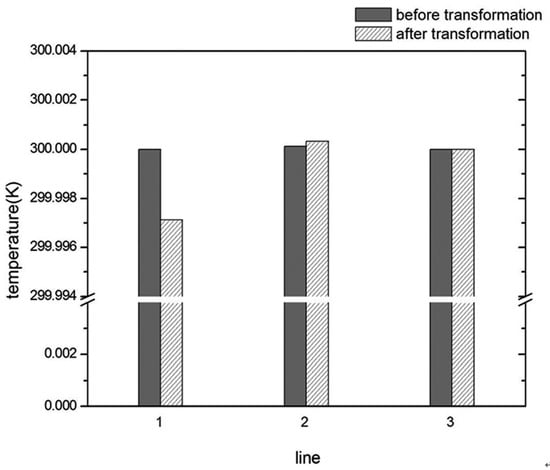
Figure 11.
The average temperature changes on the three observation lines before and after the planned transformation.
Figure 9 shows the average pressure change histogram on the three observation lines before and after the transformation. It can be seen that the moderate wind pressure at points on L1 and L3 has changed from positive to negative values, and significantly, L3 decreases the most. This is related to the impact of L3 on buildings, so corresponding measures should be taken in the area where L3 is located.
Figure 10 shows the average wind speed variation histogram on the three observation lines before and after the transformation. As is seen in this figure, the average wind speed on L1, L2 and L3 is reduced, and the reduction is about 0.3 m/s. The change is more uniform, so the average wind speed from the point of view of the regional wind speed has a specific reduction after the transformation, but the reduction is more balanced. There is no place where it is reduced by too much, and the ventilation is better [].
Figure 11 shows the average temperature change histogram on the three observation lines before and after the transformation. It can be seen that the moderate temperature changes on the three observation lines are not very large. Still, the average temperature drop at the L1 point reaches 0.003 K, and there is a specific improvement. The average temperature on L2 and L3 is almost constant. These results also explain the role of water in regulating the ambient temperature [].
4. Discussion
The research objects of this paper are traditional Chinese courtyard buildings. Using modern analytical techniques to analyse the green environment of the classical architectural complex provides a new angle and method for the design and research related to the restoration and protection of ancient buildings. Through the above analysis, the results show that the combination of the building’s height and plane has a significant influence on the building’s wind environment. In addition, it can be concluded that increasing the water area can improve the regional temperature environment [].
In addition to the above key points, the following shortcomings should also be studied in the future.
- High wind speed is conducive to diffusing air pollutants and improving air quality. However, it is essential to note that high airflow speeds at pedestrian height may negatively affect human comfort [,,]. Therefore, future research can combine air quality indexes and human comfort indexes under different ventilation conditions.
- The CFD simulation was carried out in the summer. Due to the different heating demands in different seasons, a future comparative temperature analysis before and after renovation should be carried out in winter [,,]. Thus, the pool’s size influence on environmental temperature regulation can be further studied.
- Based on the importance of the spatial form in protecting ancient architectural heritage, the renovation and reconstruction of old buildings have significant limitations on the building’s height and plane [,,]. This also puts forward higher requirements for improving a green building’s environment. Future research should focus on improving the architectural wind environment and human comfort as much as possible while ensuring ancient buildings’ spatial structure and shape.
- Gaotang Xingguo Temple is located 15 kilometres north of the city of Liangcun Town, which is part of the suburbs. For the preservation and restoration of ancient buildings, most of the remains in urban areas are better preserved than those in suburban areas due to their geographical advantages. Therefore, architectural protection focuses on repairing and utilising historical buildings. The remains of ancient buildings in the suburbs are usually seriously damaged due to disrepair. In addition to improving critical cultural relics, the reconstruction and restoration of original buildings also occupy a significant proportion of work. Therefore, preserving and utilising historical buildings in suburban areas are more feasible in terms of a green environment than in urban areas. Future research can start from the protection of a city’s historic buildings to the exploration of the potential of green energy conservation in protecting and repairing landmark buildings [,].
5. Conclusions
In recent years, with the continuous development of the economy, people’s sense of the conservation of heritage has continued to strengthen, so many marginal building heritages have been protected. However, many measures used to protect ancient buildings are still not very appropriate and do not receive enough attention. In the new situation, on the one hand, we have to strengthen people’s awareness of the protection of ancient buildings. On the other hand, we should perform more analyses of these old buildings to provide a basis for further protection. This study took Gao Tang Liangcun Xingguo Temple as the engineering background based on the Fluent Computational Fluid Mechanics software. The wind environment of the monastery before and after the construction was compared, and the influence of the water body on the wind environment was calculated and analysed.
- Regarding the wind pressure, after the monastery’s planned transformation, the south and north (morning bell, west hall, possession of the Court) of the monastery formed a longer static pressure belt, where the wind pressure is about 0.3 pa. The wind speed in these low-pressure areas is not conducive to spreading contaminants and heat around the summer building.
- Regarding the wind speed, after the monastery’s planned transformation, at the 1.5 m height, the wind speed in the monastery between the ancient tower and the main hall remained around 0.2–2.2 m/s. The waters have a large static wind area at a speed of 0.2 m/s. Low wind speed is not conducive to the diffusion of pollutants. Many vortices formed among the Main hall, the King hall, the Side hall, the Scripture library and the pagoda. These places should be prepared for wind. Otherwise, it will cause discomfort to visitors.
- In general, the programme’s transformation improved the building’s ventilation performance, although to a certain extent, it reduced the wind speed, and the regional reduction is more balanced. There are individual areas of static wind, and this needs special attention. The new plan to increase the pool size of the original small pond area will reduce the ambient temperature effect.
- Local climate conditions should be considered in the early layout design of the outdoor environment in the ancient building reconstruction planning area. Based on the restoration and maintenance of old buildings, the size of courtyards, water area and building height can be adjusted to create comfortable and pleasant architectural wind and thermal environments. For building restoration work, since the building scope is mainly to restore the original form and ensure regulation, the analysis of the building’s wind environment can intuitively visualise the static pressure zone, static wind area, whirlpool and so on during the planning, which provides the design basis and starting point for improvements in the early design stage. Thus, green water bodies optimise and improve the overall environment by optimising local building combinations and introducing windproof measures.
Author Contributions
Y.L.: Conceptualization, methodology, formal analysis, investigation, resources, writing—original draft preparation, visualization. L.C.: Methodology, software, validation, investigation, resources, data curation, visualization. L.Y.: Methodology, Writing—Review and editing, supervision. All authors have read and agreed to the published version of the manuscript.
Funding
This research received no external funding.
Institutional Review Board Statement
We choose to exclude this statement.
Informed Consent Statement
We choose to exclude this statement.
Data Availability Statement
Not applicable.
Conflicts of Interest
The authors declare no conflict of interest.
References
- Pu, X.; Yao, J.; Zheng, R. Forecast of Energy Consumption and Carbon Emissions in China’s Building Sector to 2060. Energies 2022, 15, 4950. [Google Scholar] [CrossRef]
- Su, M.D.; Huang, S.Y. Computational Fluid Mechanics Foundation; Tsinghua University Press: Beijing, China, 1997. [Google Scholar]
- Pinraj, K. Buddhist Architecture: Meaning and Conservation in the Context of Thailand. Ph.D. Thesis, University of York, York, UK, 1996. [Google Scholar]
- Kim, Y.-J. Reconstructing Pure Land Buddhist Architecture in Ancient East Asia. Religions 2021, 12, 764. [Google Scholar] [CrossRef]
- Liu, J.; Jiang, Y.; Cao, C. The Remaining Buddhist Architecture in Fu’an, the Core Hinterland of the Changxi River Basin. Religions 2021, 12, 1054. [Google Scholar] [CrossRef]
- Zhang, Y.; Zhang, H.; Sun, Z. Effects of Urban Growth on Architectural Heritage: The Case of Buddhist Monasteries in the Qinghai-Tibet Plateau. Sustainability 2018, 10, 1593. [Google Scholar] [CrossRef]
- Zhang, Y.; Wei, T. Typology of religious spaces in the urban historical area of Lhasa, Tibet. Front. Archit. Res. 2017, 6, 384–400. [Google Scholar] [CrossRef]
- Sokolova, A. Building and Rebuilding Buddhist Monasteries in Tang China: The Reconstruction of the Kaiyuan Monastery in Sizhou. Religions 2021, 12, 253. [Google Scholar] [CrossRef]
- Hershock, P. Built Space as Bodhimandala: The Architectural Meaning of a Practised Buddhism—Part 2. Archit. Theory Rev. 2000, 5, 69–82. [Google Scholar] [CrossRef]
- Zhang, X.; Zhi, Y.; Xu, J.; Han, L. Digital Protection and Utilization of Architectural Heritage Using Knowledge Visualization. Buildings 2022, 12, 1604. [Google Scholar] [CrossRef]
- Li, Z.; Hou, M.; Dong, Y.; Wang, J.; Ji, Y.; Huo, P. Research on the Digital Retention Mechanism of Tibetan Buddhism Architecture Based on Uav and Tls: A Case Study of Baoguang Hall. ISPRS Ann. Photogramm. Remote Sens. Spat. Inf. Sci. 2021, 8, 95–100. [Google Scholar] [CrossRef]
- Zhang, D.; Liu, D.; Cui, Z.; Xiao, M. Analysis of the Present Situation of Research on Soundscape and Han-Chinese Buddhist Temples. Appl. Mech. Mater. 2013, 357–360, 388–391. [Google Scholar]
- Li, Y.; Deng, Y.; Li, A.; Xu, T. Comparative Studies of Computational Fluid Dynamic Geometric Models at Multiple Levels of Details in Evaluating Wind Action on Asian Ancient Wooden Tower. Int. J. Archit. Herit. 2021, 15, 1–18. [Google Scholar] [CrossRef]
- Wu, Y.C.; Yang, A.S.; Tseng, L.Y.; Liu, C.L. Myth of ecological architecture designs: Comparison between design concept and computational analysis results of natural-ventilation for Tjibaou Cultural Center in New Caledonia. Energy Build. 2011, 43, 2788–2797. [Google Scholar] [CrossRef]
- Qian, Y.; Leng, J.; Chun, Q.; Wang, H.; Zhou, K. A year-long field investigation on the spatio-temporal variations of occupant’s thermal comfort in Chinese traditional courtyard dwellings. Build. Environ. 2023, 228, 109836. [Google Scholar] [CrossRef]
- Xu, C.; Li, S.; Zhang, X.; Shao, S. Thermal comfort and thermal adaptive behaviours in traditional dwellings: A case study in Nanjing, China. Build. Environ. 2018, 142, 153–170. [Google Scholar] [CrossRef]
- Martínez-Molina, A.; Tort-Ausina, I.; Cho, S.; Vivancos, J.L. Energy efficiency and thermal comfort in historic buildings: A review. Renew. Sustain. Energy Rev. 2016, 61, 70–85. [Google Scholar] [CrossRef]
- Wei, X.; Si, Z. Fully exploring traditional Chinese culture and promoting organic development of green city. Procedia Eng. 2017, 180, 1531–1540. [Google Scholar] [CrossRef]
- Wu, S.R.; Fan, P.; Chen, J. Incorporating culture into sustainable development: A cultural sustainability index framework for green buildings. Sustain. Dev. 2016, 24, 64–76. [Google Scholar] [CrossRef]
- Fu, J.; Zhou, J.; Deng, Y. Heritage values of ancient vernacular residences in traditional villages in Western Hunan, China: Spatial patterns and influencing factors. Build. Environ. 2021, 188, 107473. [Google Scholar] [CrossRef]
- Zheng, S.; Han, B.; Wang, D.; Ouyang, Z. Ecological wisdom and inspiration underlying the planning and construction of ancient human settlements: Case study of hongcun UNESCO world heritage site in China. Sustainability 2018, 10, 1345. [Google Scholar] [CrossRef]
- Liu, S.P.; Xiang, H.F. The Role of Wind on the Structure; Tongji University Press: Shanghai, China, 1992. [Google Scholar]
- Liu, C.Q. Multigrid Method and Its Application in Computational Fluid Dynamics; Tsinghua University Press: Beijing, China, 1995. [Google Scholar]
- Wang, W.G.; Xu, M.; Jiang, M.W. Simulation of Airflow Characteristics and Turbulent Diffusion in Buildings. Acta Aerodyn. J. 1999, 1, 87–92. [Google Scholar]
- Cao, S.H.; Ming, P.P.; Zhao, X. Fuzzy comprehensive evaluation of human thermal comfort in simulating natural wind environment. Build. Environ. 2021, 188, 107447. [Google Scholar] [CrossRef]
- Iqbal, Q.M.Z.; Chan, A.L.S. Pedestrian level wind environment assessment around group of high-rise cross-shaped buildings: Effect of building shape, separation and orientation. Build. Environ. 2016, 101, 45–63. [Google Scholar] [CrossRef] [PubMed]
- You, W.; Shen, J.; Ding, W. Improving wind environment of residential neighborhoods by understanding the relationship between building layouts and ventilation efficiency. Energy Procedia 2017, 105, 4531–4536. [Google Scholar] [CrossRef]
- Yu, Y.; Kwok KC, S.; Liu, X.P.; Zhang, Y. Air pollutant dispersion around high-rise buildings under different angles of wind incidence. J. Wind Eng. Ind. Aerodyn. 2017, 167, 51–61. [Google Scholar] [CrossRef]
- Bose, K.K. Analysing the Impact of Changing Building Size and Placement to Natural Ventilation and Wind Flow Using ANSYS Fluent CFD on the Interlace Residential Project in Singapore; Department of Building National University of Singapore: Singapore, 2019. [Google Scholar]
- Chen, L.; Hang, J.; Chen, G.; Liu, S.; Lin, Y.; Mattsson, M.; Sandberg, M.; Ling, H. Numerical investigations of wind and thermal environment in 2D scaled street canyons with various aspect ratios and solar wall heating. Build. Environ. 2021, 190, 107525. [Google Scholar] [CrossRef]
- Gosman, A.D. Developments in C.F.D. for industrial and environmental applications in wind engineering. J. Wind Eng. Ind. Aerodyn. 1999, 5, 21–39. [Google Scholar] [CrossRef]
- Hu, X.F.; Zhou, X.Q.; Bu, Z.W.; Mao, H.W. Architectural planning and design based on C.F.D. simulation of outdoor wind environment. Archit. Struct. Des. 2007, 4, 14–18. [Google Scholar]
- Ma, J.; Shu, X.; Yang, Y.D. Simulation study on wind environment of group buildings. Comput. Simul. 2008, 6, 296–298. [Google Scholar]
- Shi, Y.L. Numerical Study on Indoor and Outdoor Wind Environment of Buildings. Unpublished. Master’s Thesis, Hunan University, Changsha, China, 2008. [Google Scholar]
- Wang, F.J. Computational Fluid Dynamics Analysis—Fluid Dynamics Analysis with C.F.D. Software; Tsinghua University Press: Beijing, China, 2004; pp. 124–125. [Google Scholar]
- Qian, F.; Shi, Z.; Yang, L. Research on Thermal Environment of Sports Architecture-A Review. Build Sci. 2019, 35, 164–169. [Google Scholar]
- Ma, J.; Cheng, G.B.; Mao, Y.L. Research on Group Building Wind Environment Based on C.F.D. Technology. J. Zhejiang Univ. Technol. 2007, 35, 351–355. [Google Scholar]
- Smith, L.M.; Woodruff, S.L. Renormalization—Group analysis of turbulence. Annu. Rev. Fluid Mech. 1998, 30, 275–310. [Google Scholar] [CrossRef]
- Wang, Y.J. Study on the Applicable Conditions of C.F.D. Simulation for Beijing Urban Human Arbitrary Wind Environment. Unpublished. Master’s Thesis, Tsinghua University, Beijing, China, 2012. [Google Scholar]
- Guo, P.; Ding, C.; Guo, Z.; Liu, T.; Lyu, T. Coupling C.F.D. Simulation and Field Experiments in Summer to Prove Feng Shui Optimizes Courtyard Wind Environments: A Case Study of Prince Kung’s Mansion in Beijing. Buildings 2022, 12, 629. [Google Scholar] [CrossRef]
- Tang, Y.Z. Development and Application of WASPS Water Quality Model in Water Environment Simulation of Plain River Network Area. Unpublished. Master’s Thesis, Hohai University, Nanjing, China, 2004. [Google Scholar]
- Holmes, M.J.; Hacker, J.N. Climate change, thermal comfort and energy: Meeting the design challenges of the 21st century. Energy Build. 2014, 39, 802–814. [Google Scholar] [CrossRef]
- Yuan, C.; Norford, L.; Ng, E. A semi-empirical model for the effect of trees on the urban wind environment. Landsc. Urban Plan. 2017, 168, 84–93. [Google Scholar] [CrossRef]
- Du, S.; Zhang, X.; Jin, X.; Zhou, X.; Shi, X. A review of multi-scale modelling, assessment, and improvement methods of the urban thermal and wind environment. Build. Environ. 2022, 213, 108860. [Google Scholar] [CrossRef]
- Cuce, E.; Sher, F.; Sadiq, H.; Cuce, P.M.; Guclu, T.; Besir, A.B. Sustainable ventilation strategies in buildings: C.F.D. research. Sustain. Energy Technol. Assess. 2019, 36, 100540. [Google Scholar]
- Zheng, J.; Tao, Q.; Li, L. Wind pressure coefficient on a multi-storey building with external shading louvers. Appl. Sci. 2020, 10, 1128. [Google Scholar] [CrossRef]
- Zhang, L.L.; Hou, J.W.; Yu, Y.; Du, J.F.; Meng, X.; He, Q. Numerical simulation of outdoor wind environment of typical traditional village in the northeastern Sichuan Basin. Procedia Eng. 2017, 205, 923–929. [Google Scholar] [CrossRef]
- Kolokotroni, M.; Perera, M.D.A.E.S.; Azzi, D.; Virk, G.S. An investigation of passive ventilation cooling and control strategies for an educational building. Appl. Therm. Eng. 2001, 21, 183–199. [Google Scholar] [CrossRef]
- Leng, S.; Li, S.W.; Hu, Z.Z.; Wu, H.Y.; Li, B.B. Development of a micro-in-meso-scale framework for simulating pollutant dispersion and wind environment in building groups. J. Clean. Prod. 2022, 364, 132661. [Google Scholar] [CrossRef]
- Li, J.Y.; Zheng, B.H.; Bedra, K.B. Evaluating the improvements of thermal comfort by different natural elements within courtyards in Singapore. Urban Clim. 2022, 45, 101253. [Google Scholar] [CrossRef]
- Li, M.L.; Jin, Y.Y.; Guo, J.L. Dynamic characteristics and adaptive design methods of enclosed courtyard: A case study of a single-story courtyard dwelling in China. Build. Environ. 2022, 223, 109445. [Google Scholar] [CrossRef]
- Kwok, H.K. Comparison of Three Widely-Used Aerodynamic Modifications That Minimise the Impact of Wind Loads on Tall Buildings. Unpublished. Master’s Thesis, Massachusetts Institute of Technology, Cambridge, MA, USA, 2007. [Google Scholar]
- Huang, M.; Wang, J.; Jin, H.; Li, A. Analysis on Wind Environment in Winter of Different Rural Courtyard Layout in the Northeast. Procedia Eng. 2016, 146, 343–349. [Google Scholar]
- Leng, J.W.; Wang, Q.; Liu, K. Sustainable design of courtyard environment: From the perspectives of airborne diseases control and human health. Sustain. Cities Soc. 2020, 62, 102405. [Google Scholar] [CrossRef]
- Yang, L.; Chen, L. Study on the influence of voids on high-rise building on the wind environment. Build. Simul. 2020, 13, 419–438. [Google Scholar]
- Cheng, H. Evaluating the Performance of Natural Ventilation in Buildings through Simulation and On-Site Monitoring. Unpublished. Master’s Thesis, Massachusetts Institute of Technology, Cambridge, MA, USA, 2013. [Google Scholar]
- Zhou, Q.; Zhu, L.D. Numerical and experimental study on wind environment at near tower region of a bridge deck. Heliyon 2020, 6, e03902. [Google Scholar] [CrossRef]
- Wannaphahoon, T. The Study of Pedestrian Level Wind at Macgregor Dormitory Building. Unpublished. Master’s Thesis, Massachusetts Institute of Technology, Cambridge, MA, USA, 2011. [Google Scholar]
- Meguro, W. Beyond Blue and Red Arrows: Optimising Natural Ventilation in Large Buildings. Unpublished. Master’s Thesis, Massachusetts Institute of Technology, Cambridge, MA, USA, 2005. [Google Scholar]
- Yang, L.; Chen, L. A study on database of modular façade retrofitting building envelope. Energy Build. 2020, 214, 109826. [Google Scholar]
- Lee, J. The Role of the Aerodynamic Modifications of the Shapes of Tall Buildings. Unpublished. Master’s Thesis, Massachusetts Institute of Technology, Cambridge, MA, USA, 2011. [Google Scholar]
- Luo, K.; Yu, H.J.; Dai, Z.X.; Fang, M.M.; Fan, J.R. CFD simulations of flow and dust dispersion in a realistic urban area. Eng. Appl. Comput. Fluid Mech. 2016, 10, 228–242. [Google Scholar] [CrossRef]
- Maryam, F.; Mehrdad, K.; Farshid, A.; Ebrahim, S.; Amir, M.; Narjes, N.; Kwok-Wing, C. Computational modeling of land surface temperature using remote sensing data to investigate the spatial arrangement of buildings and energy consumption relationship. Eng. Appl. Comput. Fluid Mech. 2020, 14, 254–270. [Google Scholar]
- Kiehbadroudinezhad, M.; Merabet, A.; Rajabipour, A.; Cada, M.; Kiehbadroudinezhad, S.; Khanali, M.; Hosseinzadeh-Bandbafha, H. Optimisation of wind/solar energy microgrid by division algorithm considering human health and environmental impacts for power-water cogeneration. Energy Convers. Manag. 2022, 252, 115064. [Google Scholar] [CrossRef]
- Hult, E.L. Experimental Simulation of Wind Driven Cross-Ventilation in a Naturally Ventilated Building. Unpublished. Master’s Thesis, Massachusetts Institute of Technology, Cambridge, MA, USA, 2004. [Google Scholar]
- Gauthier, S.; Shipworth, D. Variability of thermal stratification in naturally ventilated residential buildings. Energy Convers. Manag. 2014, 51, 1–7. [Google Scholar]
- Griffith, B.T. Incorporating Nodal and Zonal Room Air Models into Building Energy Calculation Procedures. Unpublished. Master’s Thesis, Massachusetts Institute of Technology, Cambridge, MA, USA, 2002. [Google Scholar]
- Sun, D.; Xu, J.; Zhao, J.; Zhang, D.; Chen, K. Study on a new model for urban residential quarter of 21st century. Univ. Shanghai Sci. Technol. 2000, 22, 347–351. [Google Scholar]
- Yang, L.; Liu, X.; Qian, F.; Niu, S. Research on the wind environment and air quality of parallel courtyards in a university campus. Sustain. Cities Soc. 2020, 56, 102019. [Google Scholar] [CrossRef]
- Tan, G. Study of Natural Ventilation Design by Integrating the Multi-Zone Model with C.F.D. Simulation. Unpublished. Master’s Thesis, Massachusetts Institute of Technology, Cambridge, MA, USA, 2005. [Google Scholar]
- Ricci, A.; Guasco, M.; Caboni, F.; Orlanno, M.; Giachetta, A.; Repetto, M.P. Impact of surrounding environments and vegetation on wind comfort assessment of a new tower with vertical green park. Build. Environ. 2022, 207, 108409. [Google Scholar] [CrossRef]
- Unzeta, B.B. Study and Prediction of the Energy Interactions between Buildings and the Urban Climate. Unpublished. Master’s Thesis, Massachusetts Institute of Technology, Cambridge, MA, USA, 2012. [Google Scholar]
- Yang, L.; Liu, X.; Qian, F.; Du, S.B. Ventilation effect on Different Position of Classrooms in “Line” type Teaching Building. J. Clean. Prod. 2019, 209, 886–902. [Google Scholar] [CrossRef]
- Walker, C.E. Methodology for the Evaluation of Natural Ventilation in Buildings Using a Reduced-Scale Air Model. Unpublished. Master’s Thesis, University of Illinois at Chicago, Chicago, IL, USA, 2001. [Google Scholar]
- Zhu, G. China’s architectural heritage conservation movement. Front. Archit. Res. 2012, 1, 10–22. [Google Scholar] [CrossRef]
- Chen, S.; Yang, H.; Wang, S.; Hu, Q. Surveying and Digital Restoration of Towering Architectural Heritage in Harsh Environments: A Case Study of the Millennium Ancient Watchtower in Tibet. Sustainability 2018, 10, 3138. [Google Scholar] [CrossRef]
- Chen, Y. Renovation of Traditional Water Villages in Jiangnan: A Casa study of Renovation Planning of Wenchang Village. J. Landsc. Res. 2017, 9, 15. [Google Scholar]
- Chandan, S.; Kumar, A. Review of urban conservation practices in historic cities. Int. J. Emerg. Technol 2019, 10, 74–84. [Google Scholar]
- Poomchalit, W.; Suzuki, K.; Suzuki, A. Review on the Relationship between the Spatial Developments and the Change of Wooden Houses in Original Settlements in the Suburban Expansion of Bangkok. Int. Rev. Spat. Plan. Sustain. Dev. 2018, 6, 12–29. [Google Scholar] [CrossRef]
Disclaimer/Publisher’s Note: The statements, opinions and data contained in all publications are solely those of the individual author(s) and contributor(s) and not of MDPI and/or the editor(s). MDPI and/or the editor(s) disclaim responsibility for any injury to people or property resulting from any ideas, methods, instructions or products referred to in the content. |
© 2023 by the authors. Licensee MDPI, Basel, Switzerland. This article is an open access article distributed under the terms and conditions of the Creative Commons Attribution (CC BY) license (https://creativecommons.org/licenses/by/4.0/).
