Article

An Improved Integrated Numerical Simulation Method to Study Main Controlling Factors of EUR and Optimization of Development Strategy

1
State Key Laboratory of Oil and Gas Reservoir Geology and Exploitation, Southwest Petroleum University, Chengdu 610500, China
2
PetroChina Research Institute of Petroleum Exploration & Development, Beijing 100083, China
3
Shale Gas Research Institute, PetroChina Southwest Oil & Gas Field Company, Chengdu 610051, China
*
Authors to whom correspondence should be addressed.
Energies 2023, 16(4), 2011; https://doi.org/10.3390/en16042011
Submission received: 7 January 2023 / Revised: 9 February 2023 / Accepted: 13 February 2023 / Published: 17 February 2023
(This article belongs to the Special Issue Optimization and Simulation of Intelligent Oil and Gas Wells)

Abstract

:
Gas reservoir numerical simulation is an important method to optimize the development strategy of shale gas reservoirs which has been influenced by the multi-stage fracture. The regular fracture network model was used to build a conventional numerical simulation, in which it was difficult to show the true situation of fracture propagation. However, the physical parameters not only affect the production, but also influence the stimulation effect; moreover, the quality of the fracturing effect also affects the production which causes the input and out parameters to be inaccurate. To solve this problem, the process simulation must be completed from geology to engineering to gas reservoir. The main controlling factors of production are identified with geological and engineering factors such as horizontal stage length, the volume of fracturing fluid, well spacing, production allocation, and proppant mass. Therefore, on the basis of the integrated simulation method of a hydraulic fracturing network simulation and an unstructured grid high-precision numerical simulation, this paper builds an integrated numerical simulation of a shale gas reservoir coupled with geology and engineering to optimize the development strategy with production as the target. Taking four wells of a platform as an example, the EUR (estimated ultimate recovery) has increased by 25% after the optimization of the development strategy.

1. Introduction

Over the past few decades, the conventional numerical simulation of gas reservoirs was mainly discussed as the key solution to development strategy optimization in shale gas reservoirs with the popularization and development of multi-stage hydraulic fracturing technology [1,2,3,4]. It is one of the most important methods for improving production. The numerical simulation of shale gas reservoirs needs to show more actual changes for a production and development strategy including more fracture parameters, geological parameters and engineering parameters as soon as possible. Furthermore, the degree of effects produced between fracturing, geological and engineering parameters, and production is unclear, which leads to an inaccurate production and development strategy [5,6,7]. The main controlling factors of production are the most significant for a development strategy which can improve EUR directly.
However, it is hard to simulate the actual fracture propagation and this can lead to huge differences between the model results and the actual situation on site [8,9,10]. An integrated numerical method was supplied to simulate the hydraulic fracturing and production processes to predict the production of shale gas reservoirs without geological and engineering parameters [11]. The embedded discrete fracture model (EDFM) was built to simulate the hydraulic fracture networks which avoids the complication of regenerating the reservoir mesh [12]. A hydraulic fracturing model which considers the in-situ stress response to the turbulent flow process was built to optimize the design of a hydraulic fracturing model [13]. Liang [14] and Andreev [15] pay more attention to the fracture parameters with fracture stage lengths and made some simulations to show the relationship between the length and shale gas well production.
The high resolution simulation in Barrosa Norte Field set well spacing as the single important factor affecting production [16]. The main controlling factor of a shale gas reservoir is the pressure coefficient as well as fracture conductivity and bottom hole pressure [17]. However, some studies [18,19,20] focused on single factors like geological parameters including total organic carbon (TOC), or engineering parameters including brittleness and so on. Otherwise, soaking is an important development factor when the development strategy is formed. A systematic approach was built which found that soaking would improve shale gas well production [21]. The soaking process effect was investigated with different shale formations on the gas well production [22].
However, there are many factors that interfered and affected the development strategy including geological, engineering, and developmental factors, respectively [23,24,25]. Porlles [26] showed the location of sedimentary basins and stratigraphic columns of the main basins in Peruvian fields with technical and economic strategy to optimize the development strategy. The numerical simulation as a key method was supplied to optimize the development strategy after hydraulic fracture with fracturing models [27,28].

Motivation

At present, it is difficult to connect problems with production directly to the change in fracture parameters, geological parameters, and engineering parameters in a conventional numerical simulation. It is ambiguous to define and consider the main controlling factors which affect the results of shale gas production.
As a result, the aim of this paper is to employ an integrated numerical simulation of a shale gas reservoir coupled with geology and engineering conditions to optimize the development strategy. The matching of historical effects is improved when the change in saturation and pressure during fracturing and soaking is considered. In this study, the relationship between geological and engineering factors and production is described and the main controlling factors in geological and engineering areas will be defined including fracturing length, soaking, well trajectory direction, well spacing, and volume of fracturing fluid which can affect the increase or decrease in production. Then, the improved development strategy would be explicit with the results of the numerical simulation and the main controlling increase factors. Finally, we use four wells on a platform to conduct the synthetic case study. Compared with traditional numerical simulation, the integrated numerical simulation, which contains geological, engineering, and developmental factors, can be more comprehensive, actual, and accurate.

2. Model Development

The general workflow of an integrated numerical simulation of a shale gas reservoir coupled with geology and engineering is divided into three parts with about ten steps as follows. The hydraulic fracturing network simulation was built by Kinetix and the Intersect model was used to build the unstructured grids.

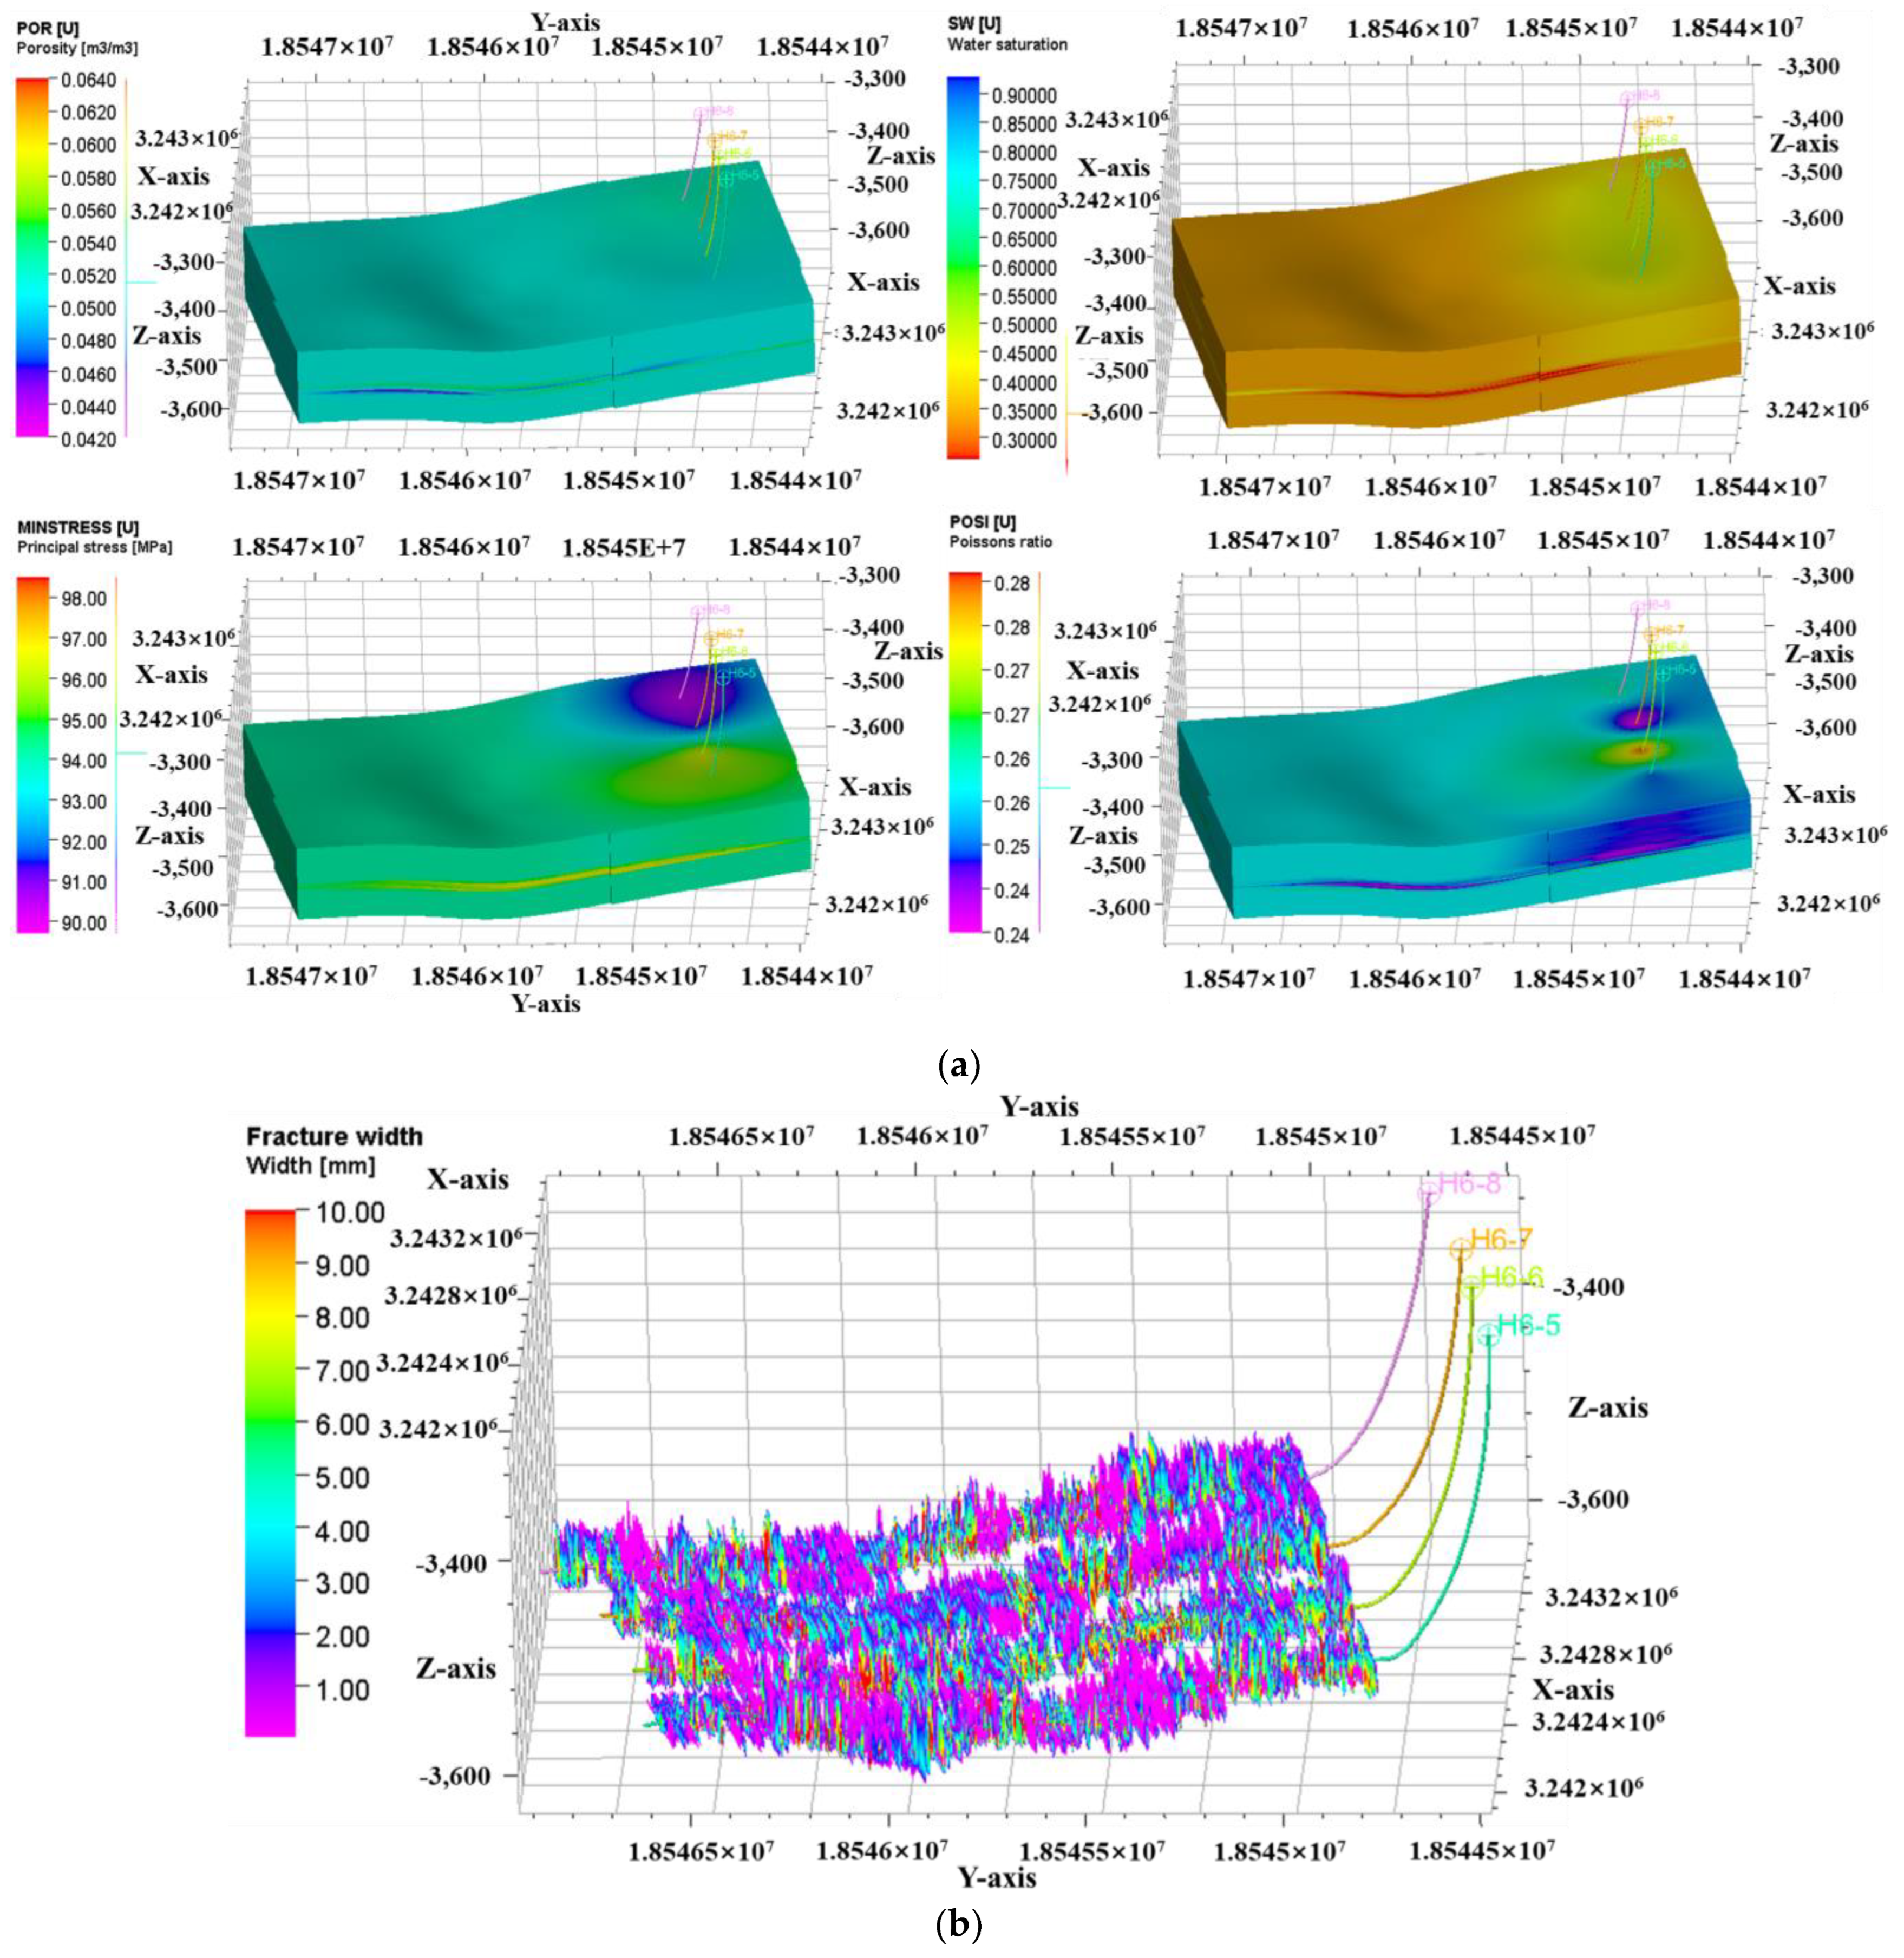
2.1. Geologic Modeling

  • One-dimensional well seismic analysis: the scope of the target area is determined, wellhead coordinates and well trajectory are input in the model; then, the interpretation of basic data is carried out such as strata division, structural interpretation, and geomechanical parameters interpretation with the logging data or 3D seismic data;
  • Two-dimensional structure model: the regional structure model is built on the basis of the layer system and tectonic situation;
  • Three-dimensional geological attribute and mechanical model: the geological model is built with the phase controlling attribute modeling method, and the geostress model is built with the finite element method for the fine modeling of the 3D geostress field.

2.2. Fracture Propagation Simulation

  • Segmental perforation parameter input: based on the fracturing construction summary reports, the perforation location, depth, segmentation and clustering number, and other information are input in the model;
  • Fracturing pumping program design: fracturing fluid and proppant properties are input, and the construction curve is divided with the fracturing seconds data;
  • Simulation of hydraulic fracture propagation: based on the geological model and actual engineering parameters, the finite element method is used to simulate the hydraulic fracture propagation in consideration of the stress interference between segments, and the simulation results are verified with micro seismic monitoring data and pumping construction curves.

2.3. Numerical Simulation

  • Unstructured grid generation: equivalent treatment of the fracture’s size and seepage capacity shall be carried out according to the actual fracture shape, and the fracture reconstruction area and unmodified area shall be zoned;
  • Establishes the numerical simulation of the gas well, platform, and reservoir;
  • Reserves and history matching: respectively, match the reserves of adsorbed gas and free gas, and then carry out production history matching;
  • Optimization of developmental technology strategy: different developmental technology indicators can be optimized directly from the engineering parameters with the production/EUR as the targets.

3. Model Implementation

3.1. The Basic Parameter Setting of Integrated Model

The structural model, attribute model, and geostress model were built with the logging and seismic data on the platform in the petrel (Figure 1a). Then, the fracturing propagation simulation was conducted by the actual pumping program of single well with the influence of natural fractures. The distribution of hydraulic fractures was supplied (Figure 1b). The specific geological and engineering parameters are shown in the Table 1.

3.2. An Improved Integrated Numerical Simulation Method

In addition to considering the integration of geology and engineering, the simulation method in this paper also has the following three differences:
(1)
Since the formation attributes are not calculated after fracture propagation simulation with conventional software, a water injection operation is added to consider the saturation and pressure changes during fracturing. Then a shut-in operation is added to simulate the soaking process in the shale gas reservoir.
(2)
Add a certain thickness of non-reservoir grid below the target layer to consider the gravity differentiation effect of water in high permeability fractures.
(3)
The fracture and matrix is divided into different zones to consider the different stress sensitive parameters and relative permeability laws in the cracks and matrix (Figure 2).
The wellbore flow model is built to simulate the change in pressure from the head to the bottom of the well and to achieve the historical fitting of wellhead pressure, water production, and gas production. To ensure the effect of fitting, the model is fitted with daily gas production dynamic data. Through the above three improvements, the history fitting effect has been significantly improved as shown in Figure 3. It can be seen that if this method is not adopted it is difficult to fit the early stage water production.

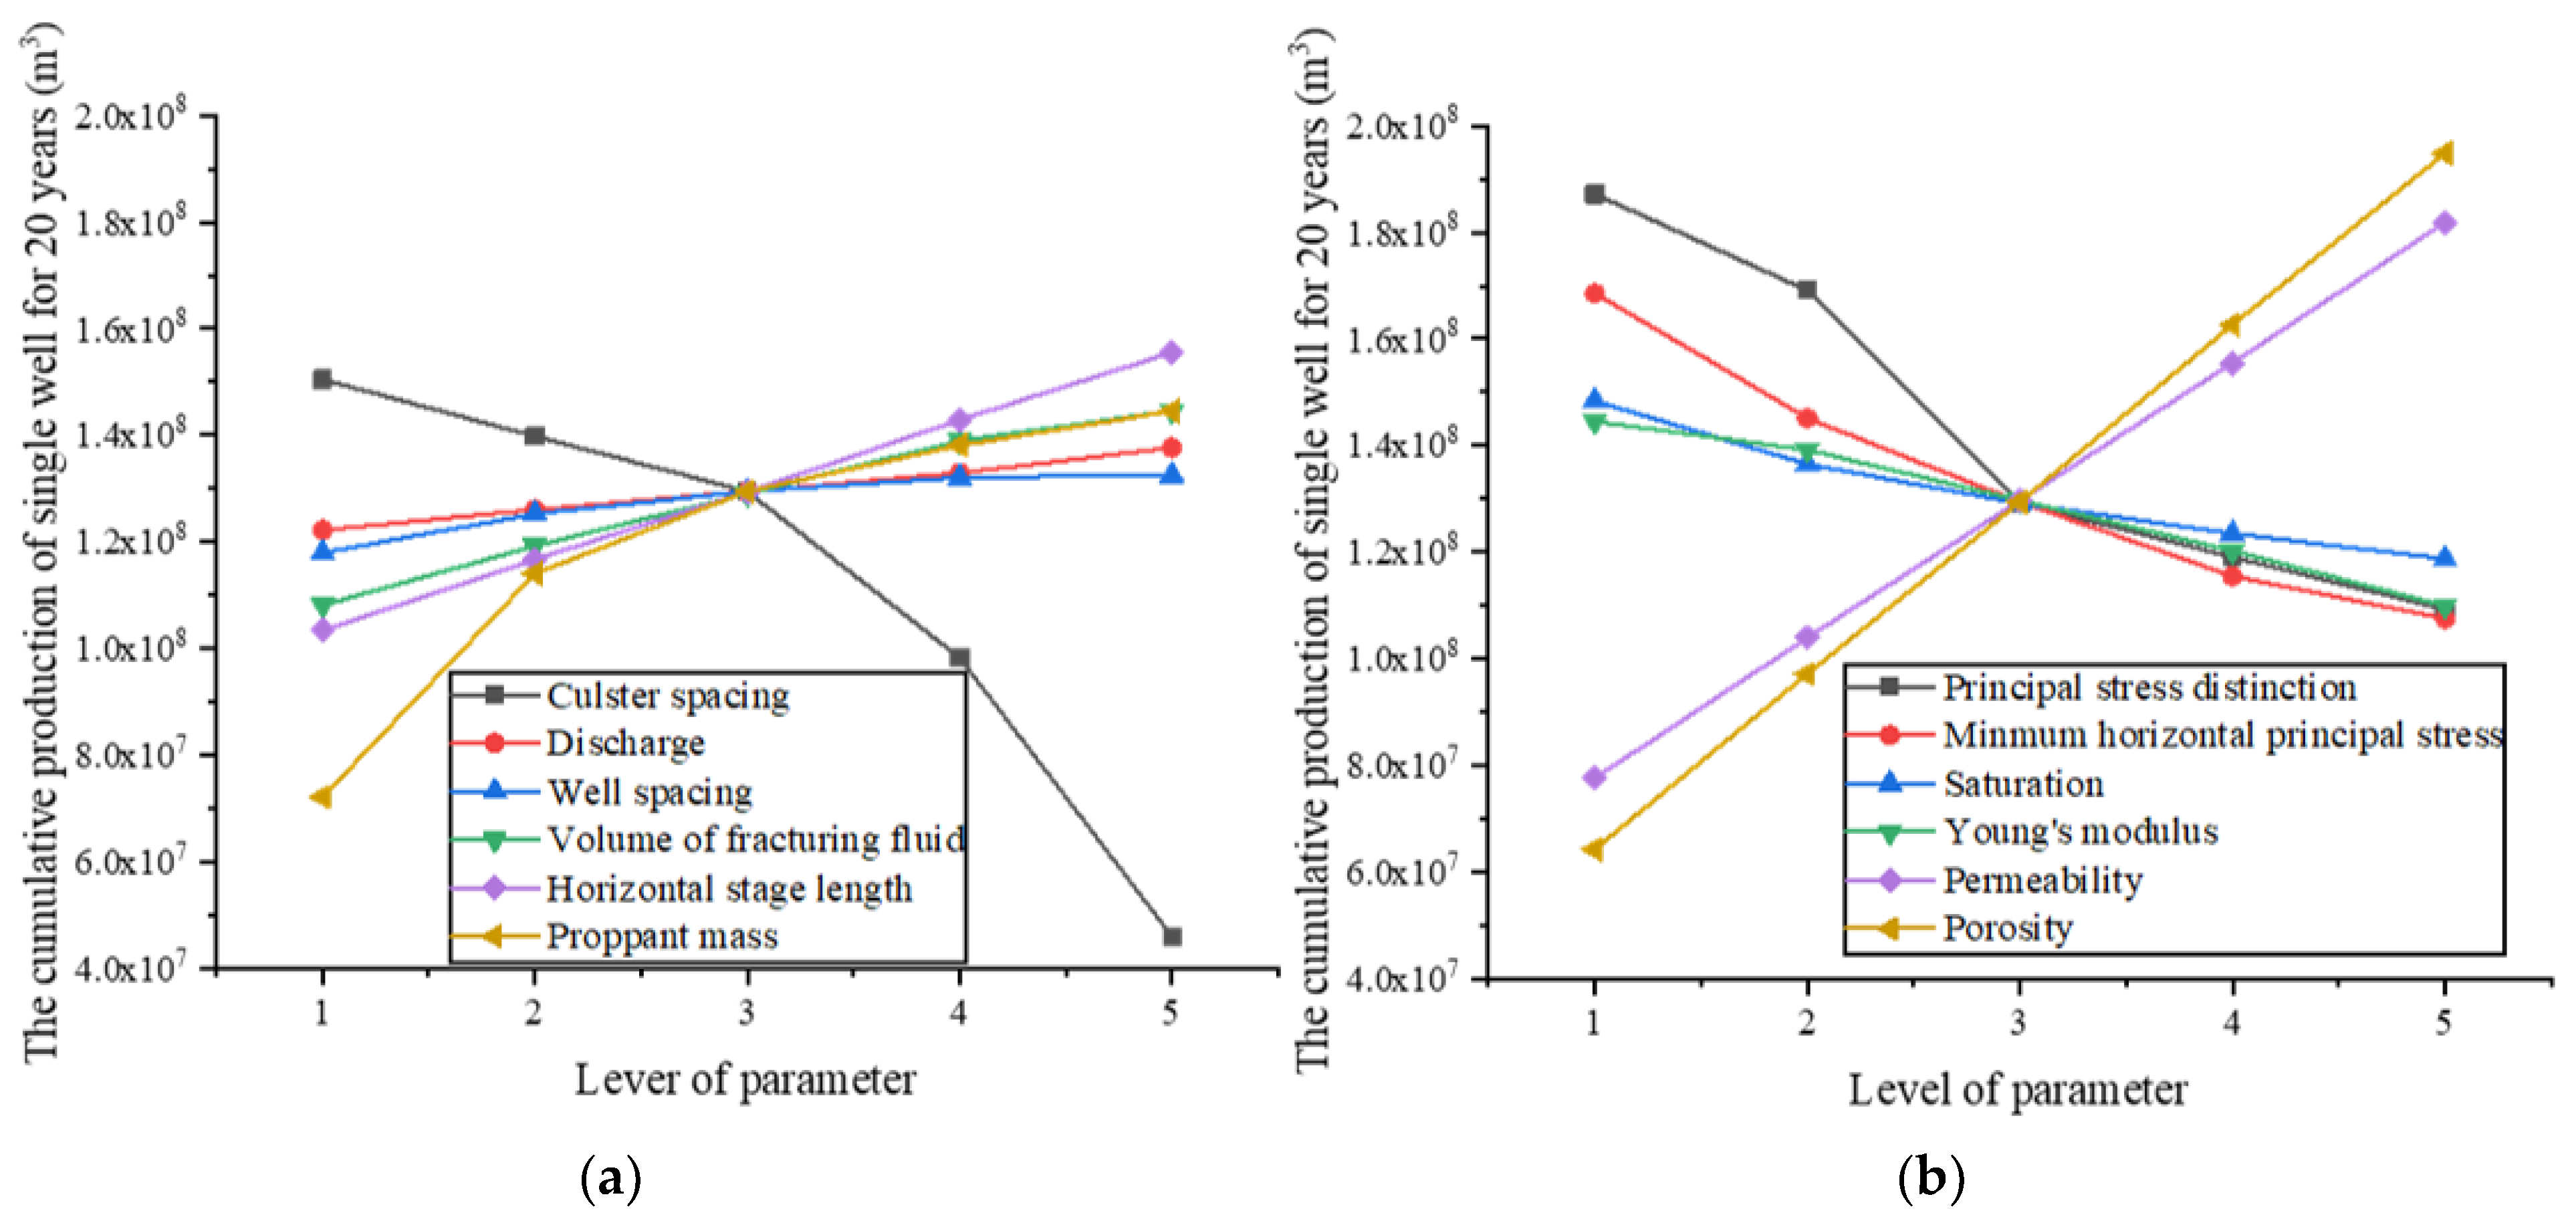
3.3. Analysis of Main Controlling Factors Affecting Production Capacity

There are six engineering factors and six geological factors that influence production. The engineering factors are: volume of fracturing fluid, proppant mass, flow rate, cluster spacing, horizontal stage length, and well spacing. The geological factors are: porosity, water saturation, matrix permeability, Young’s modulus, minimum horizontal principal stress, and principal stress difference. The mechanism model is built with engineering factors and geological factors to take numerical experiments with the range method to ensure the main factors of production.
As shown in Table 2 and Table 3, the gas well EUR under the influence of different geological factors and engineering factors are counted by 60 mechanism simulation model groups. In addition, the level value of each factor stands for the influence of factors.
The range factor R index formula is
R = E U R max ( i ) E U R min ( i ) i E U R ( i )
where i stands for influence factors and the value of range factor R index stands for the degree of the importance on EUR. When the R index is bigger, the factor is more important.
As shown in Figure 4, the EUR is simulated, respectively, under the effect of different geological and engineering factors with the 60 groups of mechanism simulation models. In Figure 4a, the porosity and permeability increase the EUR linearly for geological factors; on the contrary, other factors like saturation, Young’s modulus, principal stress distinction, and minimum horizontal principal stress would decrease the EUR slowly. In Figure 4b, most of the engineering factors can increase the EUR like discharge, well spacing, volume of fracturing fluid, proppant mass, and horizontal stage length, while the cluster spacing decreases the EUR sharply.
According to the range factor of influence factors on EUR, the rank of main factors is: engineering factors: cluster spacing > proppant mass > horizontal stage length > volume of fracturing fluid > flow rate > well spacing; geological factors: porosity > matrix permeability > principal stress difference > minimum horizontal principal stress > Young’s modulus > water saturation.

4. Results

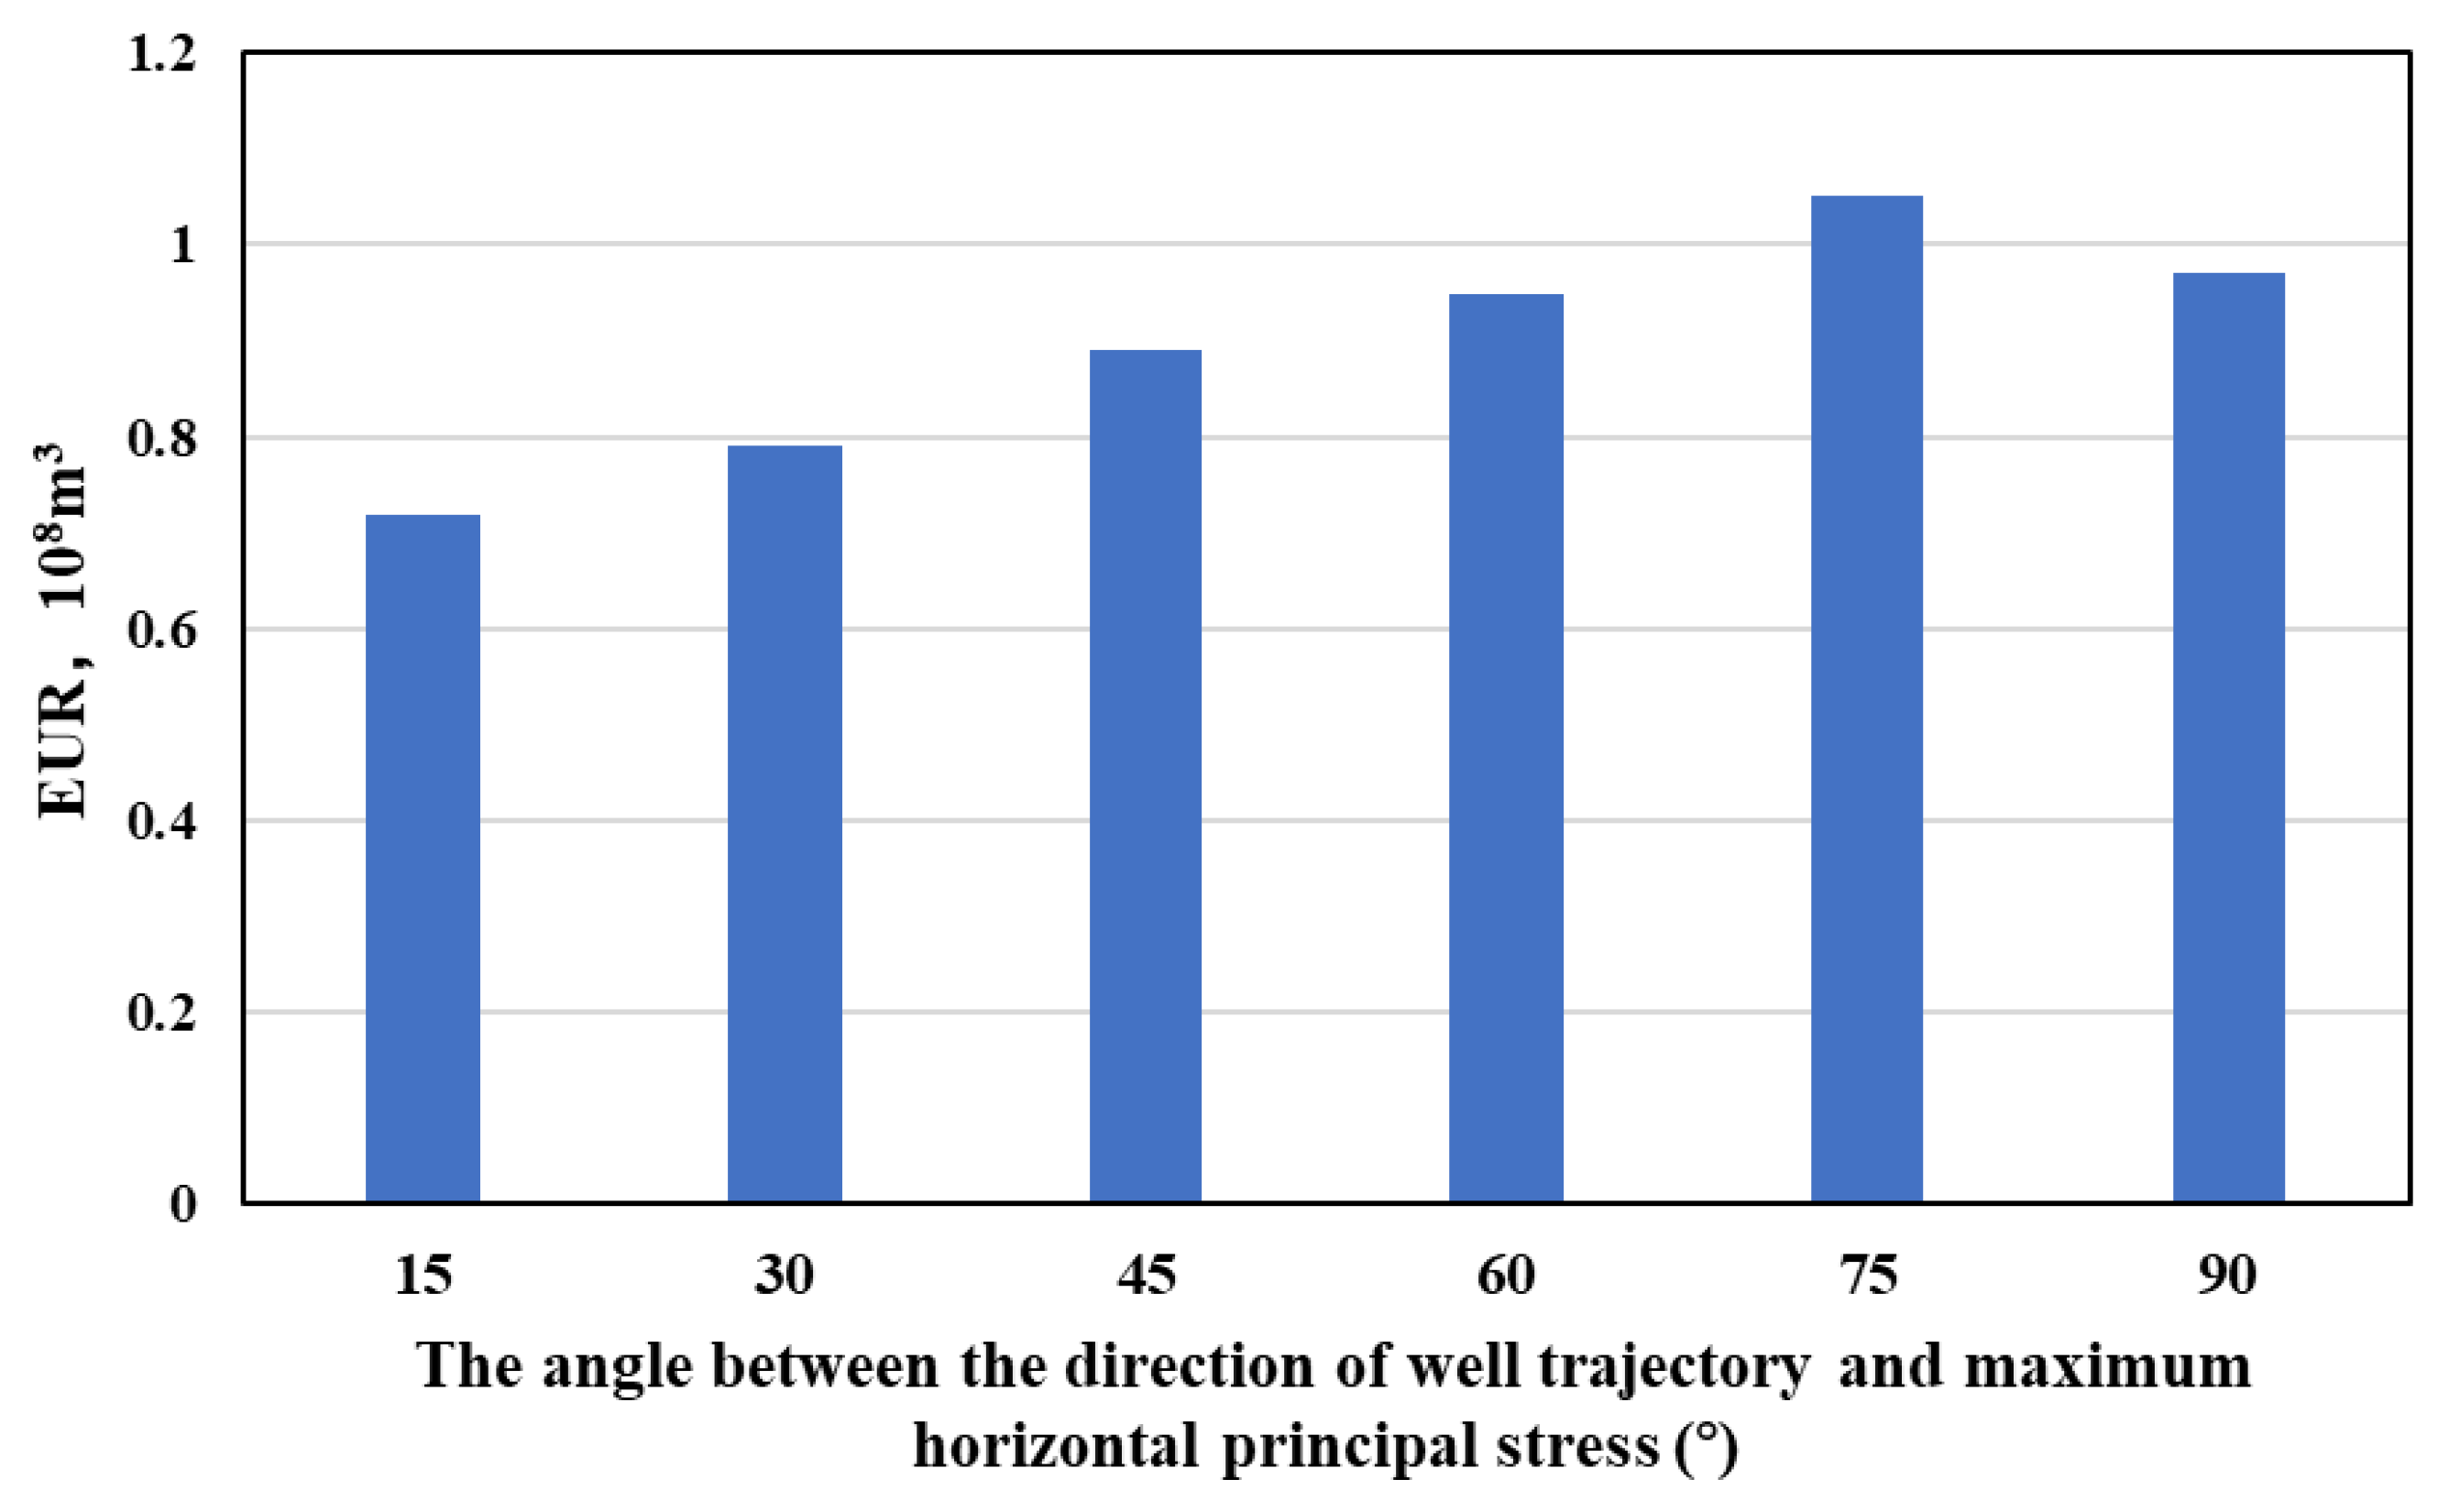
4.1. Optimization of Well Trajectory Direction

There is an optimal angle to maximize EUR when the well trajectory angle becomes larger, and the expansion area would be smaller. As a result, the different trajectory directions are designed to simulate the relationship between EUR and trajectory directions of natural fractures when the angle of natural fractures is 40°, 70°, and 90° (Figure 5). As shown in Figure 6, when the angle between the direction of well trajectory and maximum horizontal principal stress is 75°, EUR is the highest.

4.2. Optimization of Volume of Fracturing Fluid

The numerical simulation and the fracture propagation of the single well are built by the geological model of H6-7 and simulate the fracture modification when the volume of the fracturing fluid is increased from 20 m3/m to 45 m3/m (Figure 7). The result shows that the volume of reservoir reconstruction increases significantly when the volume of fracturing fluid increases.
However, when the volume of fracturing fluid is increased from 30 m3/m to 45 m3/m, the volume of reservoir reconstruction increases slowly (Figure 8). At present, the average volume of fracturing fluid on the platform is 21.3 m3/m which has greater volume of fracturing fluid because of the low capability of production. On the other hand, the Young’s modulus of this platform is larger and the fracture length would be longer as a result. The optimal volume of the fracturing fluid is 25~30 m3/m for keeping safe wellbore pressure.

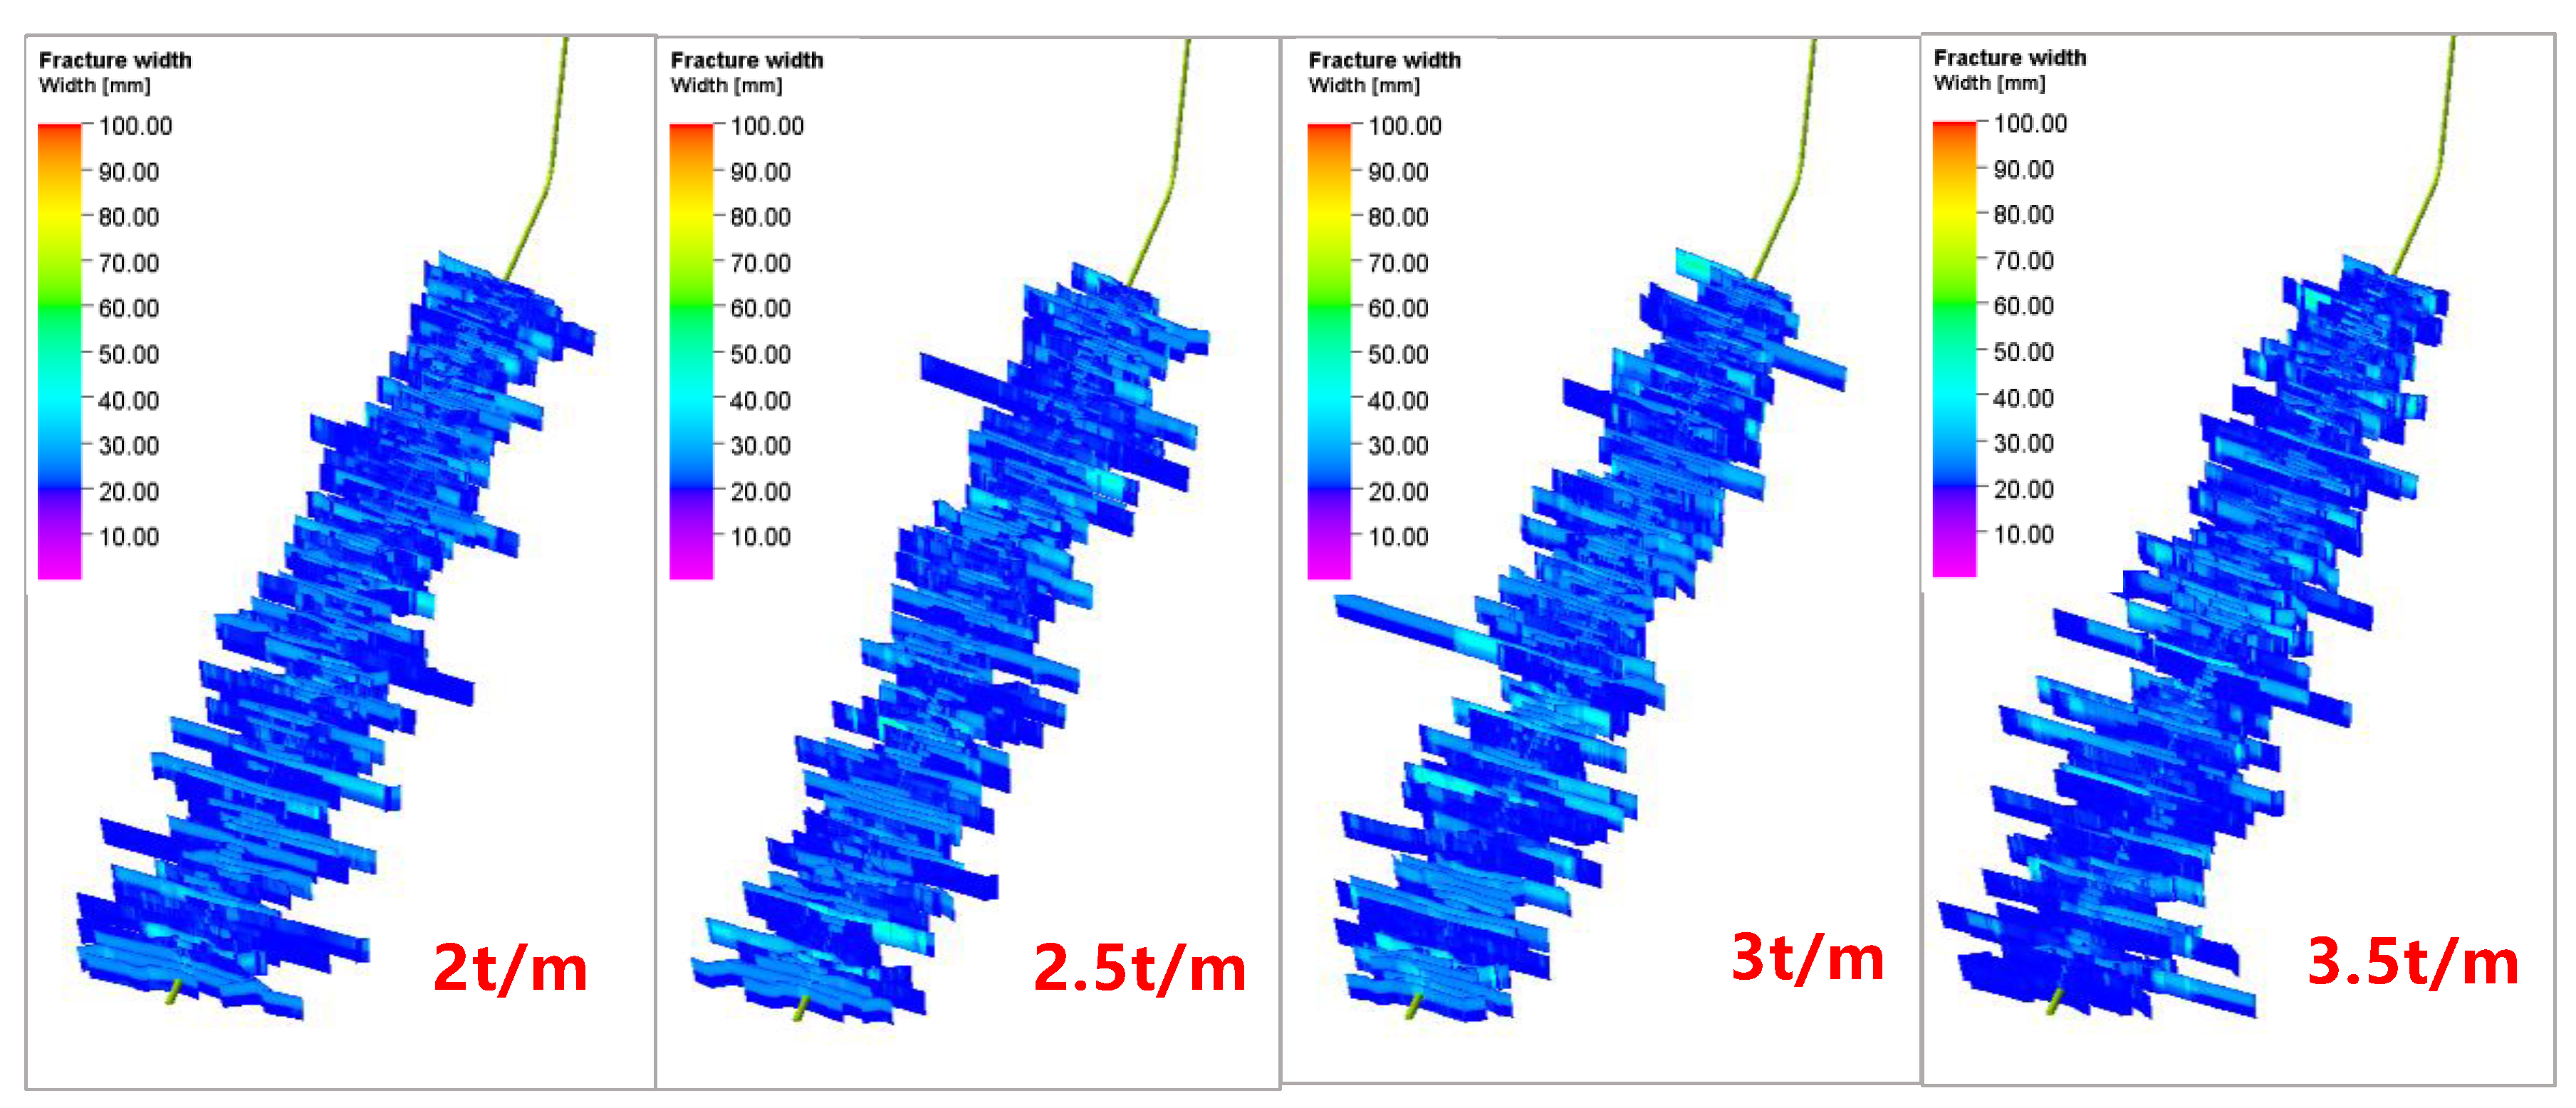
4.3. Optimization of Proppant Mass

The integrated geological and engineering model simulates the proppant mass of fracture propagation from 2 t/m to 3.5 t/m based on the well’s H6-7 geological conditions (Figure 9). With the increase in the sand volume, the average length of the fracture is the same, but the volume of the supporting fracture increases. When the proppant mass is more than 2.5 t/m, the increase in the supporting fracture’s volume is slow (Figure 10).

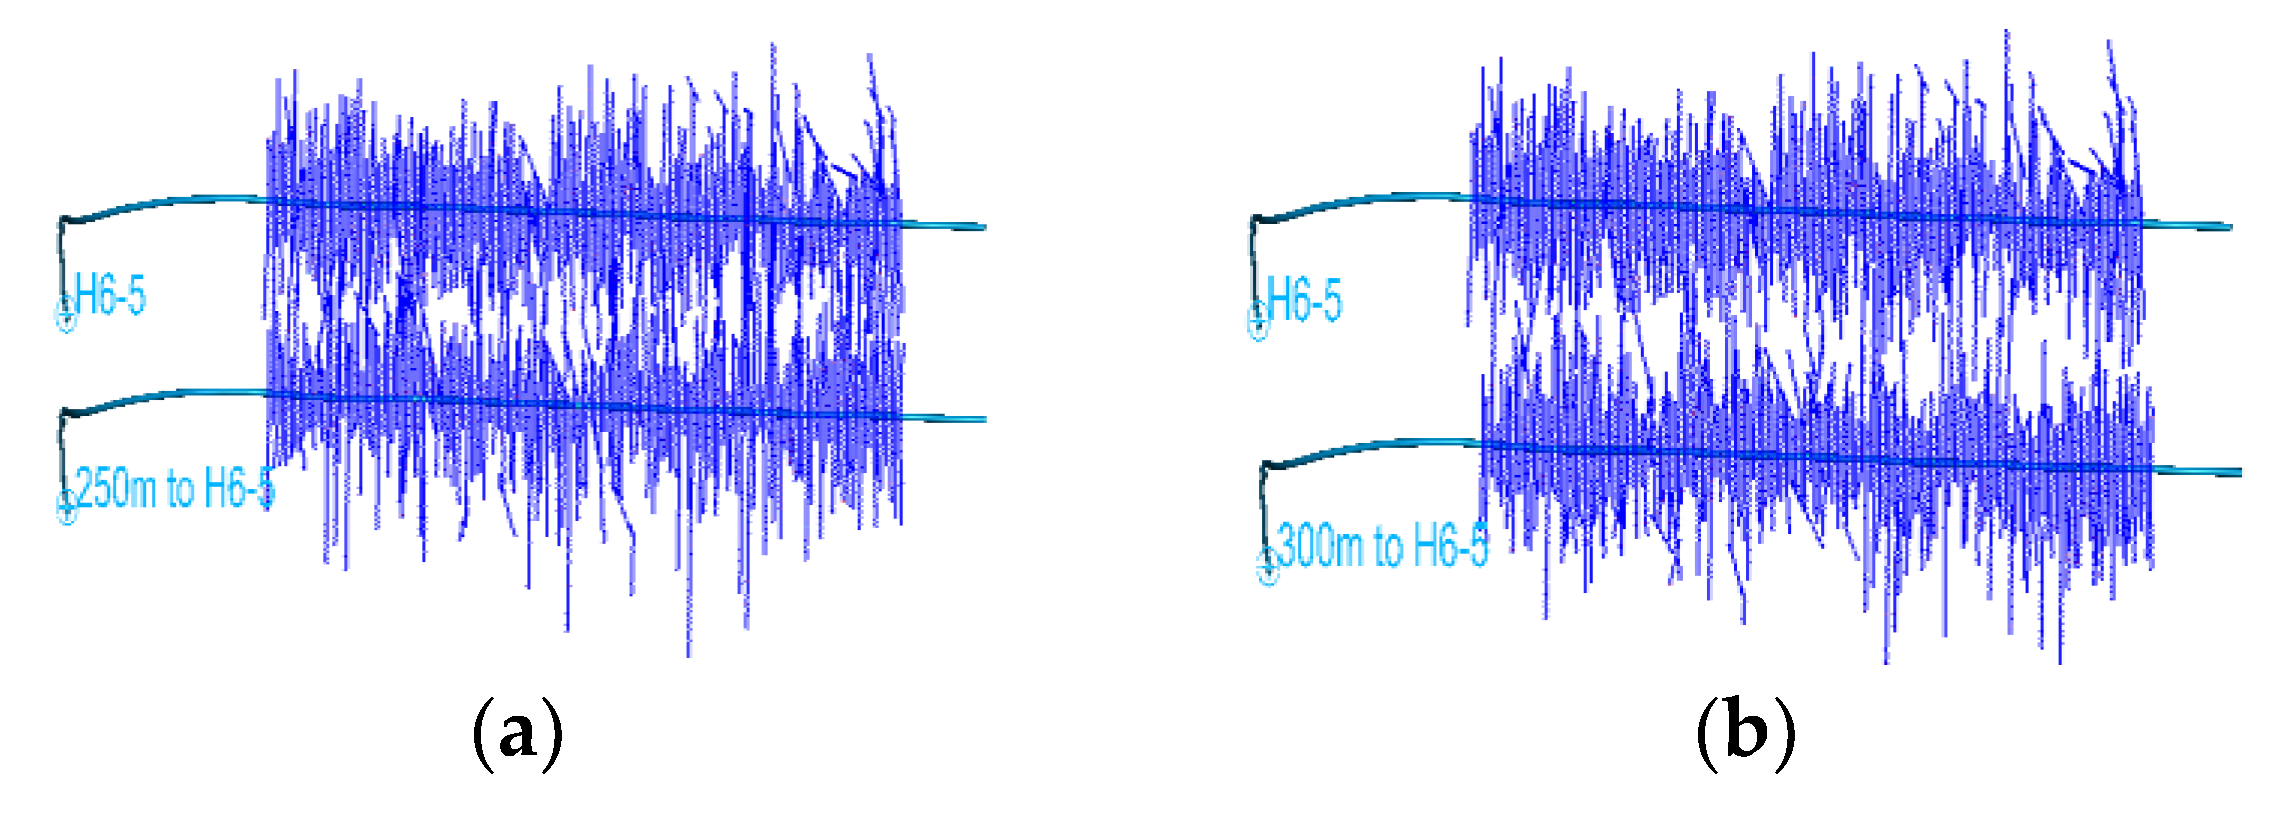
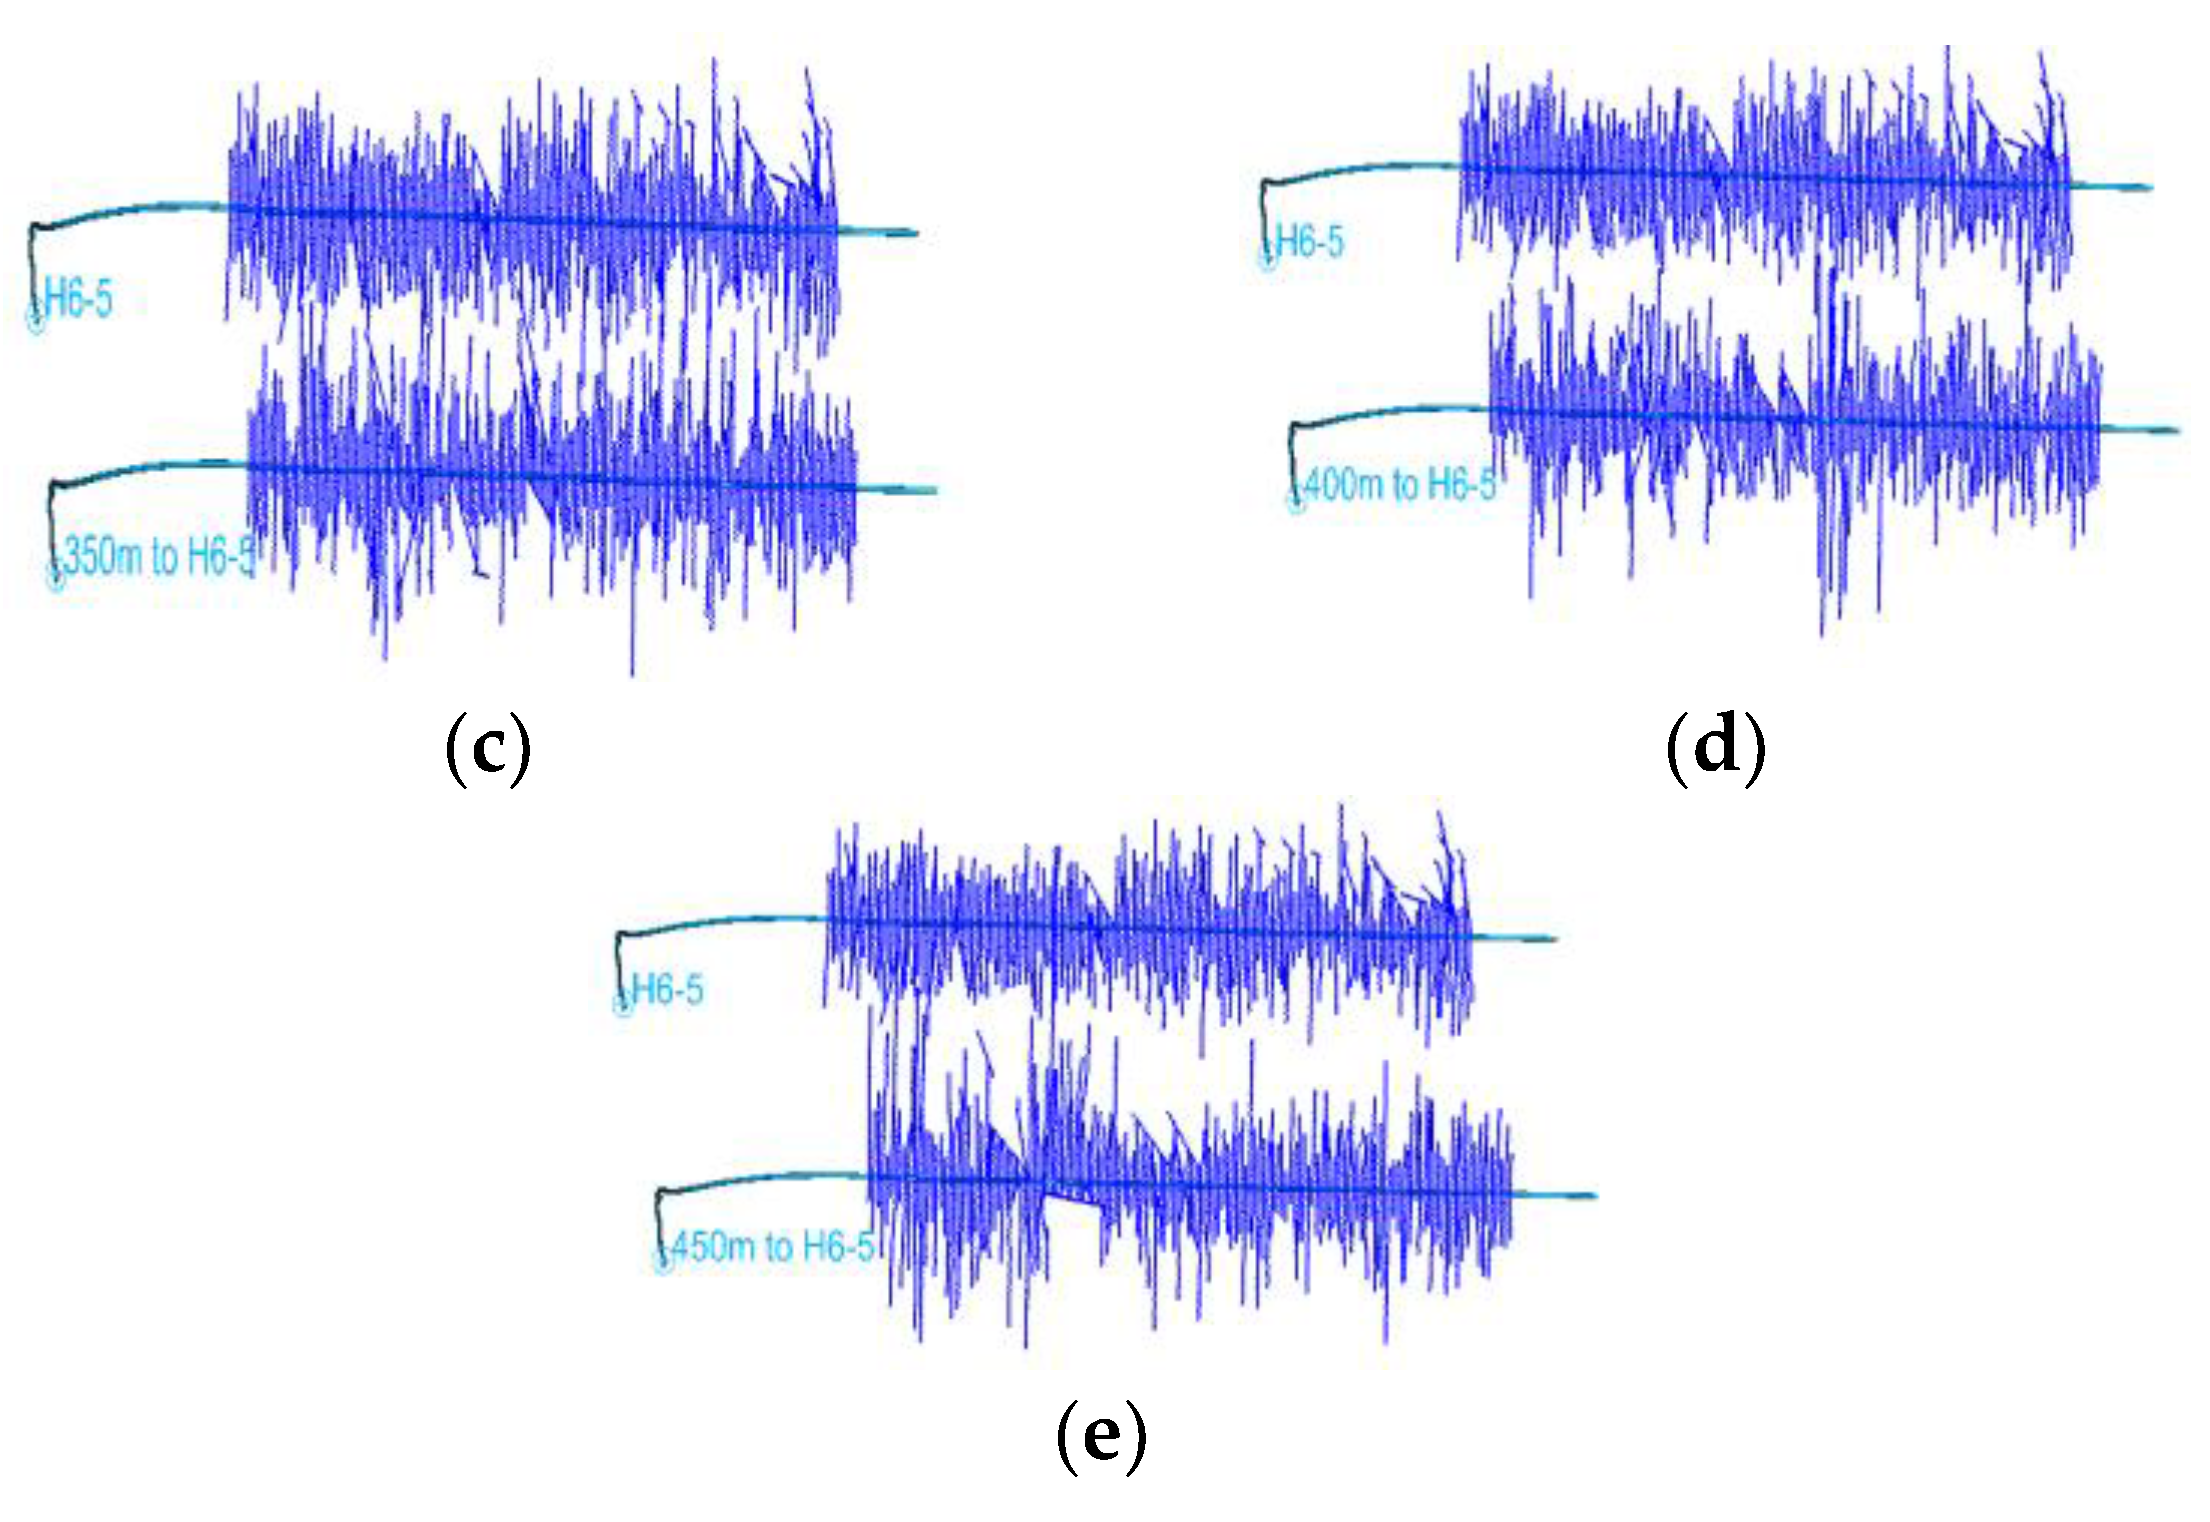
4.4. Optimization of Well Spacing

The EUR is affected by the different distance of well spacing; as a result, the integrated geological and engineering model simulates the EUR for 20 years under the well spacing from 250 m~550 m (Figure 11). As shown in Figure 12, with the increase in well spacing, the average single well EUR gets bigger and it would be stable when the well spacing is more than 400 m. Consequently, the optimal well spacing is 350 m~400 m.

4.5. Optimization of Horizontal Stage Length

The integrated geological and engineering model simulates single-well cumulative production under different horizontal stage lengths with stationary fracture parameters (Figure 13a). With the increase in the horizontal stage length, the cumulative production increases linearly (Figure 13b). The choice of horizontal stage length could be considered with economic performance and the difficulty of construction.

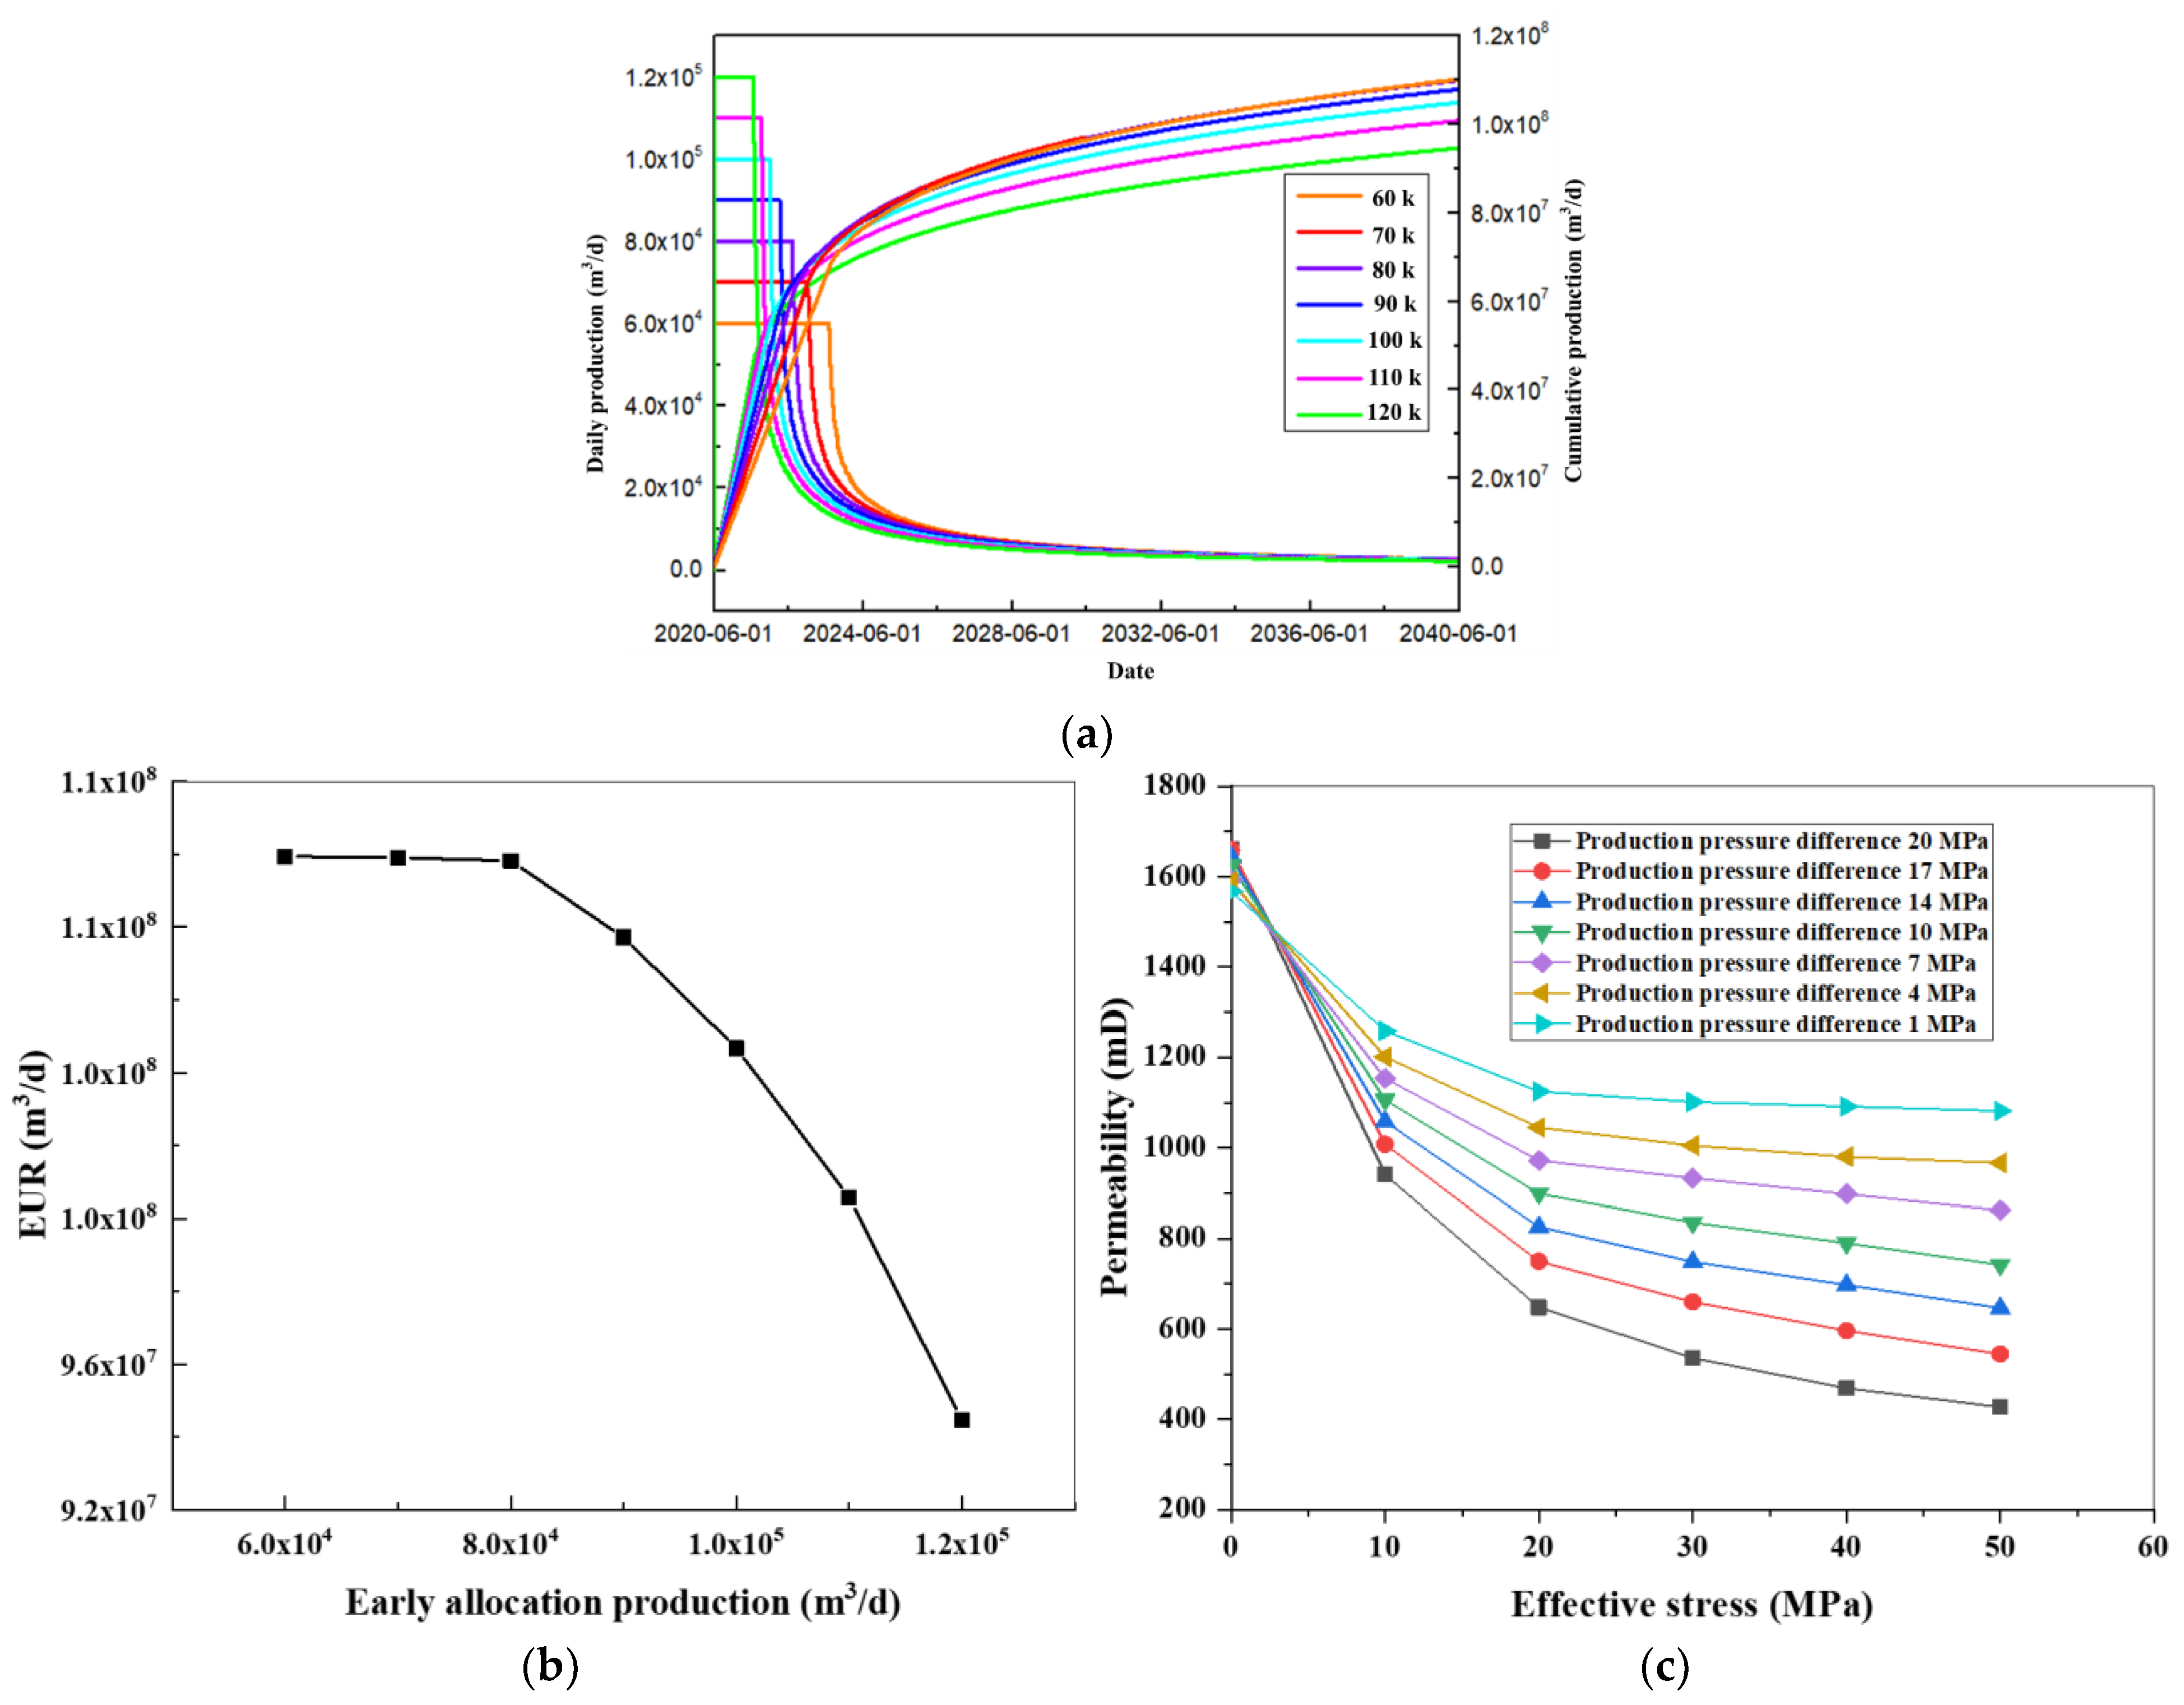
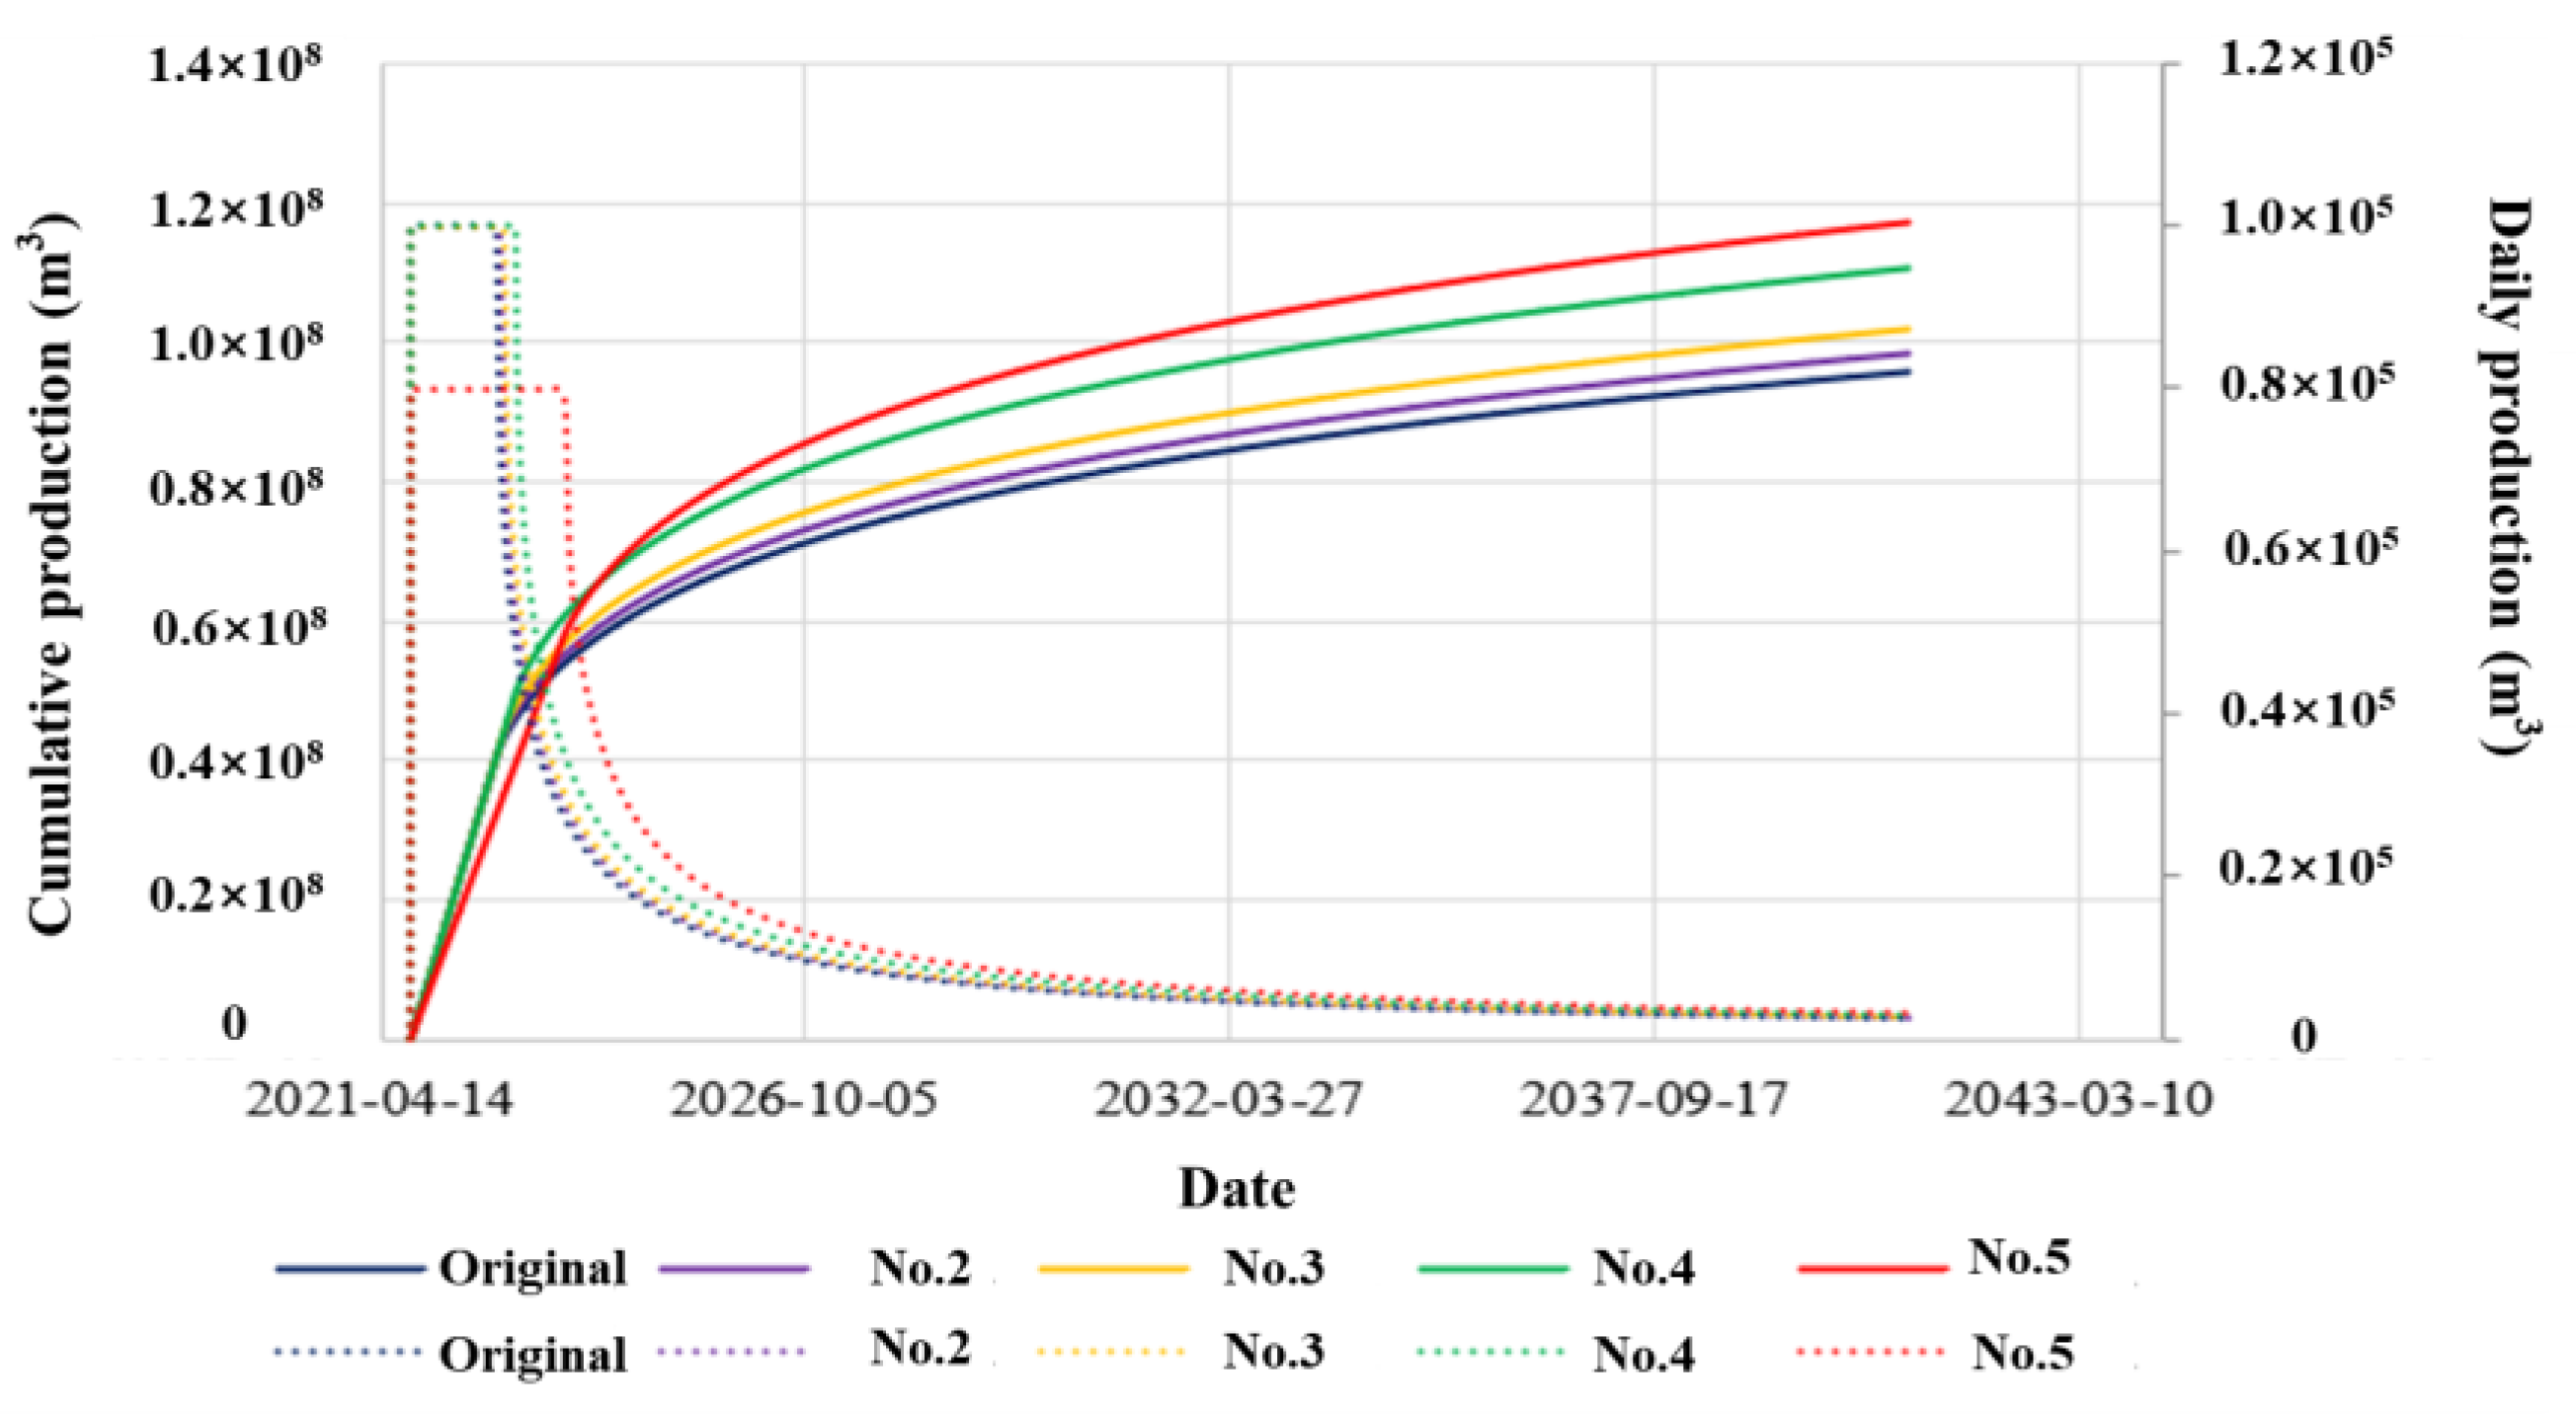
4.6. The Production Allocation and the Optimization of Development Strategy

Based on the fracture strategy of the H6-7 well, the model simulates the EUR corresponding to different cumulative production in the early period under the fracture stress sensitivity.
As a result, the cumulative production of high production allocation (12 × 104 m3/d) is 14.1% lower than that of low production allocation (6 × 10⁴ m3/d) during the depletion development in the Figure 14. It is conducive to improving the EUR which reduces the fracture stress sensitivity under pressure control production. The larger the production allocation is, the shorter the stable period is. When the production allocation is less than 8 × 10⁴ m3/d, the decline rate of the EUR becomes slow. Consequently, it is better to choose 8 × 10⁴ m3/d as the single-well production allocation which lasts 25 months.
Based on all of these optimizations, there are five exploitation strategies as follows, which are designed to simulate the change in the EUR under different parameters such as well spacing and the volume of the fracturing fluid with the integrated geological and engineering model (Figure 15 and Table 4).
Strategy no. 1: the well spacing is 300 m, the production allocation is 10 × 104 m3/d, the volume of the fracturing fluid is 20 m3/m, and the angle between the well trajectory and the maximum horizontal principal stress is 90°.
Strategy no. 2: the angle between the well trajectory and the maximum horizontal principal stress is 75°, and the other parameters are the same as strategy no. 1.
Strategy no. 3: the well spacing is 350 m, and the angle between the well trajectory and the maximum horizontal principal stress is 75°; the other parameters are the same as strategy no. 1.
Strategy no. 4: the volume of the fracturing fluid is 25 m3/m, the well spacing is 350 m, and the angle between the well trajectory and the maximum horizontal principal stress is 75°; the other parameters are the same as strategy no. 1.
Strategy no. 5: the well spacing is 350 m, the production allocation is 8 × 10⁴ m3/d, the volume of the fracturing fluid is 25 m3/m, and the angle between the well trajectory and the maximum horizontal principal stress is 75°.
As shown in the picture and table, the volume of the fracturing fluid, which directly affects the fracturing width, causes the relative increase in strategy no. 4, which is the highest one. On the other hand, the increase in EUR in the no. 5 strategy, which contains four optimal factors, is the highest. Although the allocation production of the no. 5 strategy is the lowest of the five strategies, the stable production period of the no. 5 strategy is the longest. As production time grows, the production of the no. 5 strategy decreases more slowly than any other strategy, which leads to the EUR of no. 5 being the highest. From the value of relative increase, the rank of controlling factors is the volume of the fracturing fluid, the maximum horizontal principal stress, and well spacing, which is consistent with the previous results of the main controlling factors.

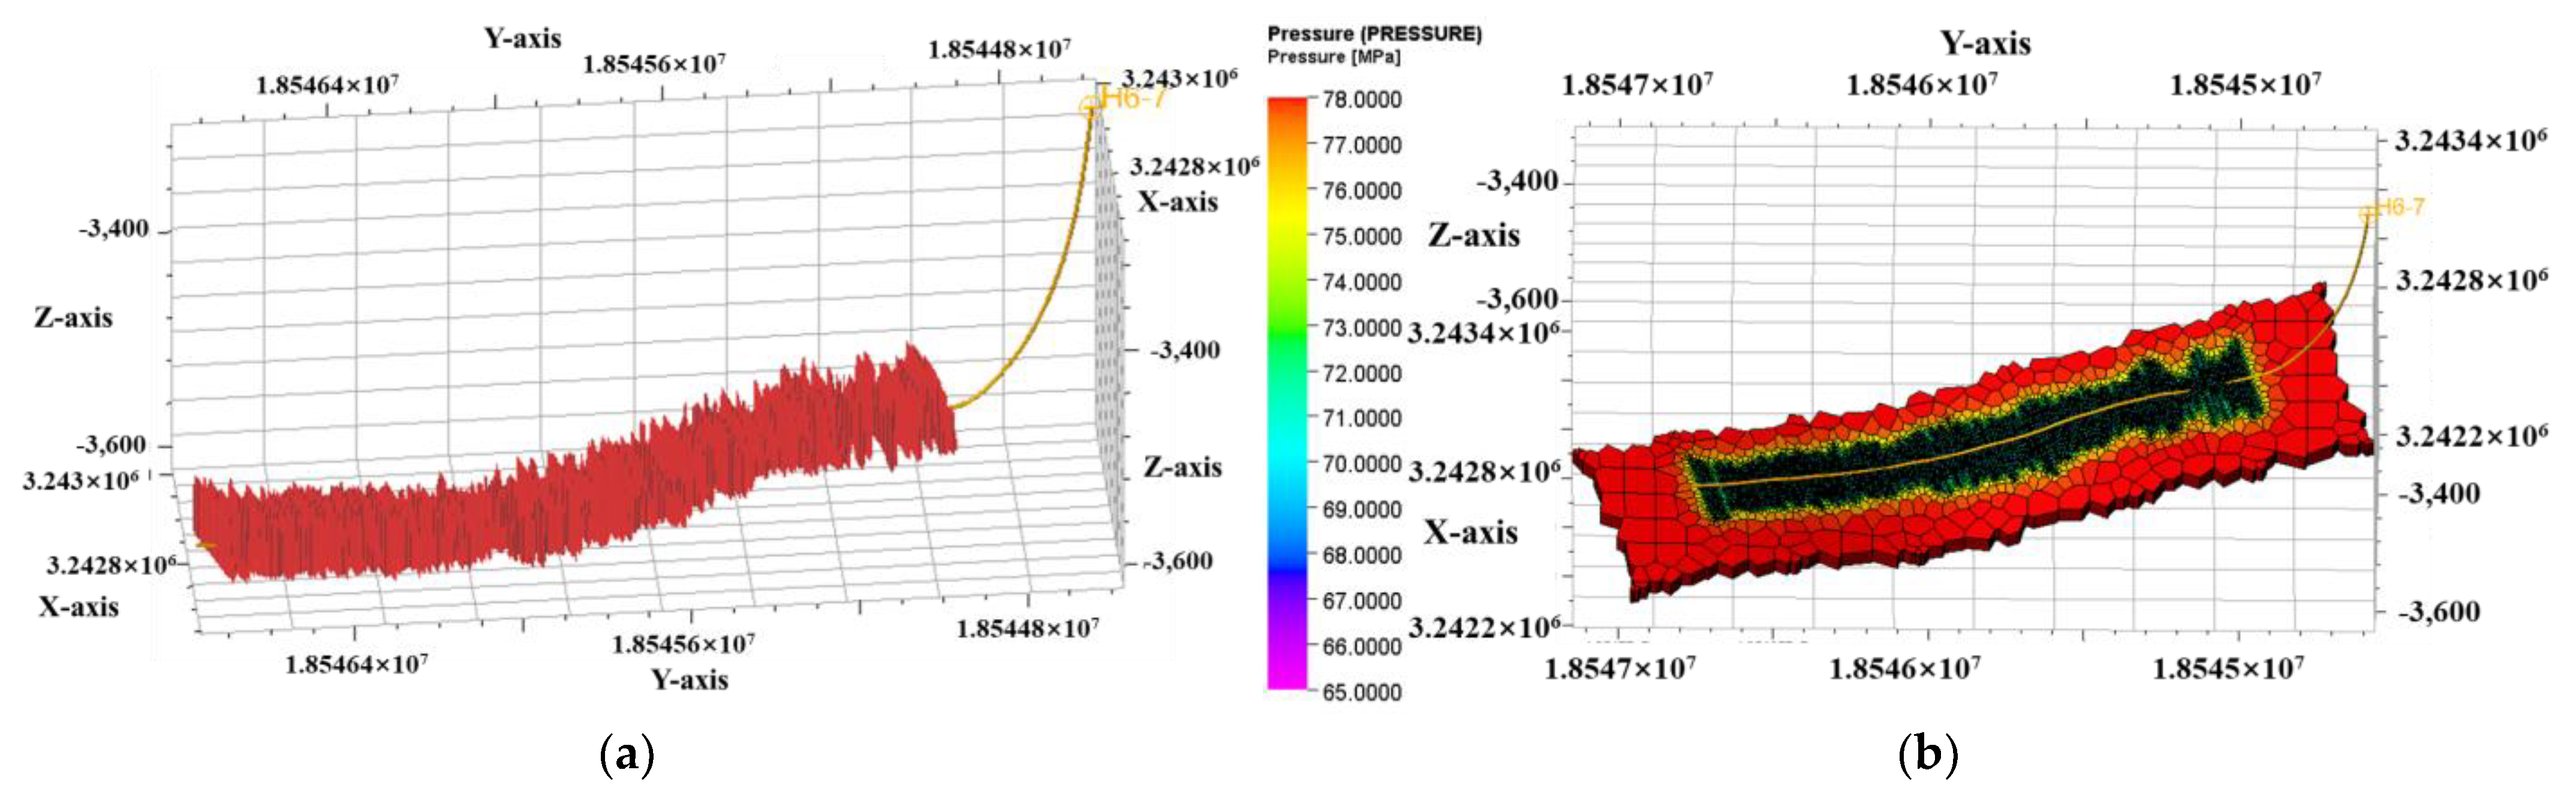
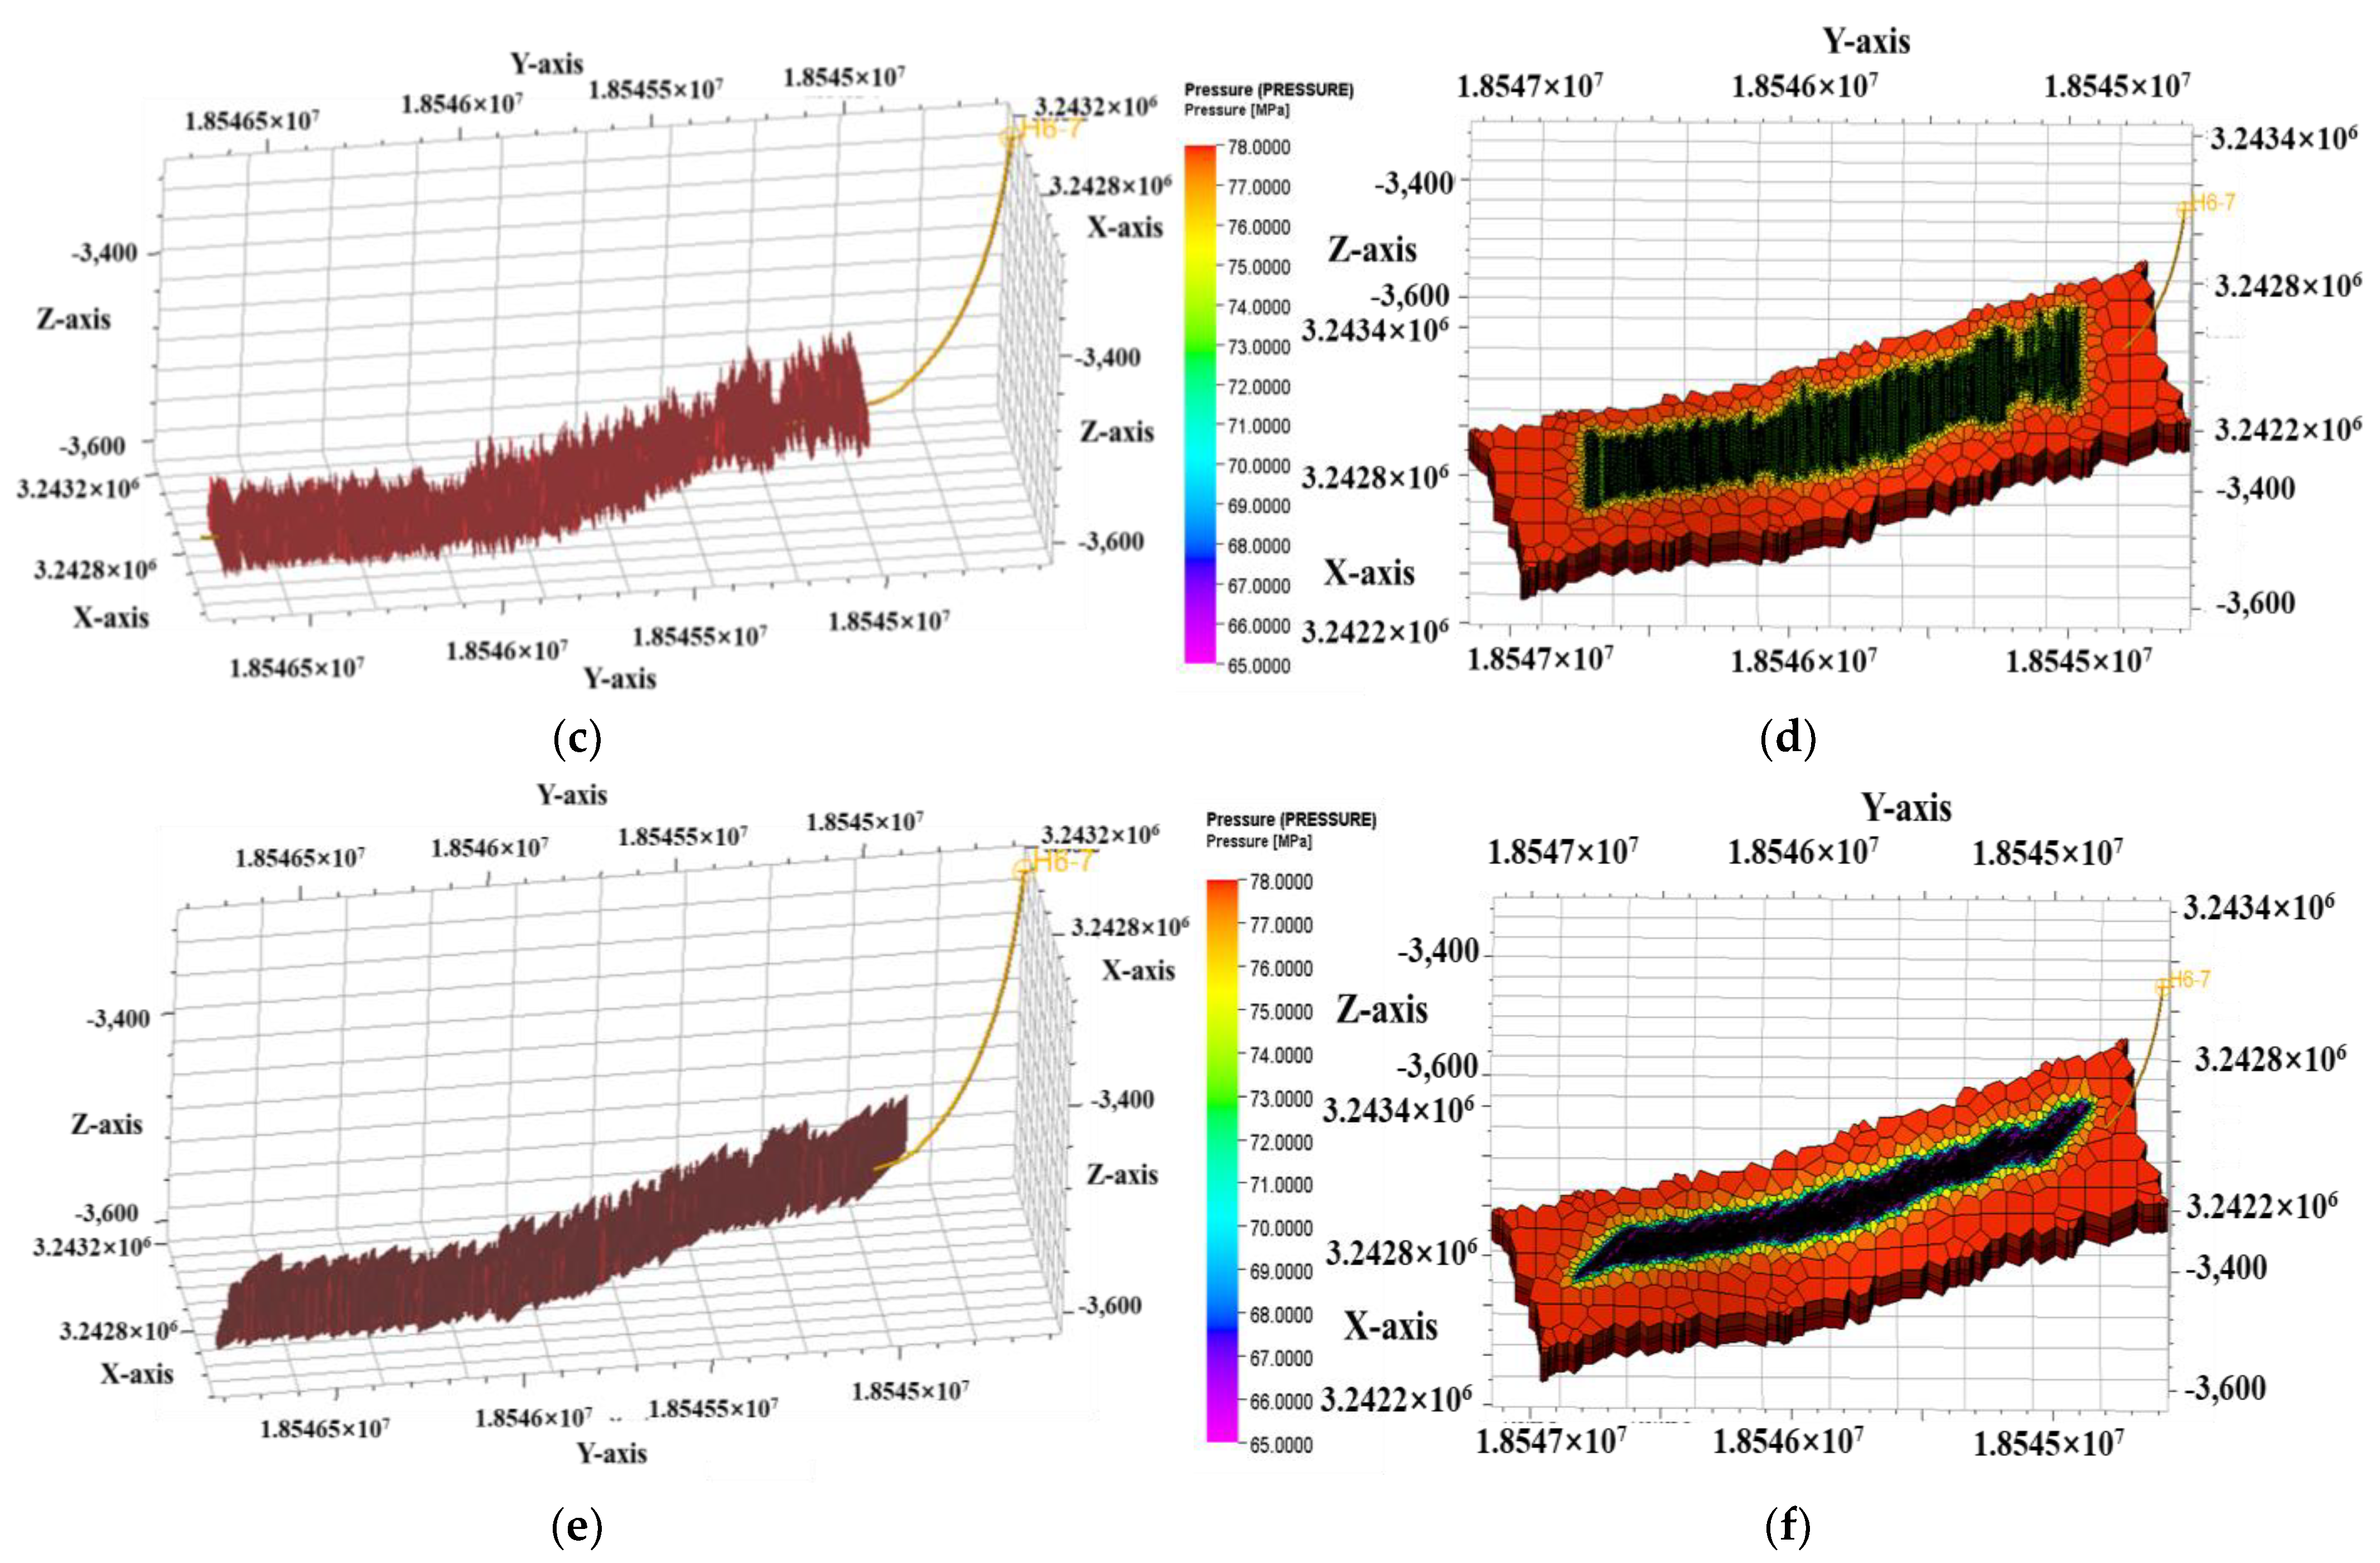
4.7. The Study of Soak Rules

According to water injecting, the water and gas distribution after fracturing is simulated by the integrated geological and engineering model to study the difference and its impact on the EUR. For example, the change in water saturation at different periods is simulated and calculated for one month of soaking. As shown in Figure 16a, during the soaking time, water accumulates at the bottom of the fracture under gravity and displaces the surrounding gas which seeps into the matrix. Furthermore, the water saturation is simulated by the model for the original soaking period and the soaking periods of 2 weeks, 4 weeks, 6 weeks, and 8 weeks (Figure 16b).
As a result, the gas saturation in the top of the fracture would increase, and yet the water saturation at the bottom of the fracture increases in the production process and the water production will increase slightly in the late period. Meanwhile, the soaking time is longer and the EUR would be higher, but over 1 month, the range of increase will decrease.

5. Discussion

This paper researches and builds the integrated geological and engineering model of a hydraulic fracture network and a numerical simulation. A series of numerical simulations on well trajectory direction, the production allocation, horizontal stage length, well spacing, proppant mass, and volume of fracturing fluid are conducted. The main conclusions are as follows:
  • The integrated geological and engineering model of the shale gas platform has been formed, mainly including hydraulic fracture propagation simulation, numerical simulation, and optimization.
  • The actual integrated simulation of a platform is carried out and the fitting effect is pretty good through the production historical fitting.
  • The influence degree of the main controlling geological and engineering factors in shale gas production is defined; the cluster spacing and proppant mass are the two most important factors, and well spacing is an unimportant engineering factor. The porosity and matrix permeability are the two most important factors in the geological factors.
  • Engineering factors: cluster spacing > proppant mass > horizontal stage length > volume of fracturing fluid > flow rate > well spacing;
  • Geological factors: porosity > matrix permeability > principal stress difference > minimum horizontal principal stress > Young’s modulus > water saturation.
  • According to the simulations, the recommended liquid strength of the platform is 25–30 m3/m, the recommended proppant mass is 2.5 t/m, the optimal well spacing is 350–400 m, the recommended the angle between well trajectory and maximum principal stress is 75°, the optimum production allocation is 8 × 10⁴ m3/d, and its stable period is 25 years.

Author Contributions

Conceptualization, Y.D. and M.W.; methodology, M.W.; software, S.S.; validation, H.L., Y.D. and Y.S.; formal analysis, S.S. and M.W.; investigation, H.L.; resources, Y.S.; data curation, M.W.; writing—original draft preparation, Y.D.; writing—review and editing, M.W.; visualization, Y.S.; supervision, Y.D.; project administration, H.L.; funding acquisition, H.L. All authors have read and agreed to the published version of the manuscript.

Funding

This research was funded by [Science and Technology Cooperation Project of the CNPC-SWPU Innovation Alliance] grant number [2020CX030202] And the APC was funded by [Science and Technology Cooperation Project of the CNPC-SWPU Innovation Alliance] grant number [2020CX030202].

Data Availability Statement

The data is unavailable due to privacy.

Acknowledgments

All the individuals have consented to the acknowledgement.

Conflicts of Interest

The authors declare no conflict of interest.

References

  1. Shabro, V.; Torres-Verdin, C.; Javadpour, F. Numerical Simulation of Shale-Gas Production: From Pore-Scale Modeling of Slip-Flow, Knudsen Diffusion, and Langmuir Desorption to Reservoir Modeling of Compressible Fluid. In Proceedings of the North American Unconventional Gas Conference and Exhibition, The Woodlands, TX, USA, 14–16 June 2011. [Google Scholar] [CrossRef] [Green Version]
  2. Ye, D.; Yin, C.; Li, Y.; Wang, S.; Qin, G.; Chen, H. Numerical Simulation of Shale Gas Development Based on Complex Fracture Network Growth. In Proceedings of the SPE Energy Resources Conference, Port of Spain, Trinidad and Tobago, 9–11 June 2014. [Google Scholar] [CrossRef]
  3. Velikanov, I.; Isaev, V.; Bannikov, D.; Tikhonov, A.; Semin, L.; Belyakova, L.; Kuznetsov, D. New Fracture Hydrodynamics and In-Situ Kinetics Model Supports Comprehensive Hydraulic Fracture Simulation. In Proceedings of the SPE Europec featured at 80th EAGE Conference and Exhibition, Copenhagen, Denmark, 11–14 June 2018. [Google Scholar] [CrossRef]
  4. Peng, Y.; Zhao, J.; Sepehrnoori, K.; Li, Y.; Yu, W.; Zeng, J. Study of the Heat Transfer in Wellbore during Acid/Hydraulic Fracturing Based on Semi-analytical Transient Model. SPE J. 2019, 24, 877–890. [Google Scholar] [CrossRef]
  5. Li, M.; Hu, X.; Zhou, F.; Wang, B.; Han, S.; Huang, G. Three-dimensional Numerical Simulation of Interaction of Hydraulic Fracture and Natural Fracture Using the Cohesive Zone Finite Element Method. In Proceedings of the SPE/AAPG/SEG Latin America Unconventional Resources Technology Conference, Virtual, 16–18 November 2020. [Google Scholar] [CrossRef]
  6. Perfetto, R.; Tealdi, L. Hydraulic Fracturing as a Development Strategy-Successful Case Histories from the Congo Basin: A Matter of Technology and Risk Attitude. In Proceedings of the SPE Nigeria Annual International Conference and Exhibition, Lagos, Nigeria, 30 July–1 August 2013. [Google Scholar] [CrossRef]
  7. Jinzhou, Z.; Yu, P.E.N.G.; Yongming, L.I.; Zhisheng, T.I.A.N. Applicable conditions and analytical corrections of plane strain assumption in the simulation of hydraulic fracturing. Pet. Explor. Dev. 2017, 44, 454–461. [Google Scholar]
  8. Al Shehhi, H.A.A.; Bernadi, B.; Al Shamsi, A.B.Z.B.; Al Hammadi, S.J.; Alawadhi, F.O.; Mohamed, I.N.; Al Bairaq, A.M.; Al Hosani, M.A.; Abdullayev, A.; Roopal, A. Advanced Well Completion Strategies to Improve Gas Production Deliverability in Marginal Tight Gas Reservoirs from an Onshore Abu Dhabi Gas Field. In Proceedings of the Abu Dhabi International Petroleum Exhibition & Conference, Abu Dhabi, United Arab Emirates, 15–18 November 2021. [Google Scholar] [CrossRef]
  9. Yong, R.; Wu, J.; Shi, X.; Zhuang, X.; Wen, H.; Luo, Y. Development Strategy Optimization of Ning201 Block Longmaxi Shale Gas. In Proceedings of the SPE International Hydraulic Fracturing Technology Conference and Exhibition, Muscat, Oman, 16–18 October 2018. [Google Scholar] [CrossRef]
  10. Belhaj, H.A.; Dhabi, A.; Mnejja, M. Hydraulic Fracture Simulation of Two-Phase Flow: Discrete Fracture Modelling/Mixed Finite Element Approach. In Proceedings of the SPE Reservoir Characterisation and Simulation Conference and Exhibition, Abu Dhabi, United Arab Emirates, 9–11 October 2011. [Google Scholar] [CrossRef]
  11. Wei, S.; Jin, Y.; Liu, X.; Xia, Y. The Optimization of Infill Well Fracturing Using an Integrated Numerical Simulation Method of Fracturing and Production Processes. In Proceedings of the Abu Dhabi International Petroleum Exhibition & Conference, Abu Dhabi, United Arab Emirates, 15–18 November 2021. [Google Scholar] [CrossRef]
  12. Fang, S.; Xiong, H.; Wang, B.; Ma, L.; Rao, X.; Wu, Y. The Influence of Infill Well-Caused Fracture Interference on Shale Gas Production and Recovery: A Comprehensive Numerical Simulation Study. In Proceedings of the SPE/AAPG/SEG Asia Pacific Unconventional Resources Technology Conference, Virtual, 16–18 November 2021. [Google Scholar] [CrossRef]
  13. Li, Y.; Wei, C.; Qin, G.; Lu, Y.; Luo, K. Optimizing Hydraulic Fracturing Design for Shale Gas Production through Numerical Simulations. In Proceedings of the SPE International Production and Operations Conference & Exhibition, Doha, Qatar, 14–16 May 2012. [Google Scholar] [CrossRef]
  14. Liang, H.; Tang, H.; Qin, J.; Li, Y.; Zhou, X.; Zhang, L. Multi-Scale Investigations on the Geometries of Hydraulic Fractures in Conglomerate Reservoirs. In Proceedings of the International Petroleum Technology Conference, Riyadh, Saudi Arabia, 12 February 2022. [Google Scholar] [CrossRef]
  15. Andreev, A.; Astafyev, V.; Samoilov, M. Integrated Approach to Multistage Fracturing Design. In Proceedings of the SPE Symposium: Hydraulic Fracturing in Russia. Experience and Prospects, Virtual, 22–24 September 2020. [Google Scholar] [CrossRef]
  16. Francos, J.P.; Wagner, F.; Coppo, R.; Santiago, E. Optimizing Well Spacing of Multi Fractured Tight Gas Wells in Argentina’s Lajas Formation through High Resolution Simulation: Barrosa Norte Field Case Study. In Proceedings of the SPE Latin America and Caribbean Petroleum Engineering Conference, Buenos Aires, Argentina, 17–19 May 2017. [Google Scholar] [CrossRef]
  17. Bian, X.; Li, S.; Jiang, T.; Zuo, L.; Zhong, G. A Workflow to Simulate Flow Back Progress of Fractured Shale Gas Wells. In Proceedings of the 55th U.S. Rock Mechanics/Geomechanics Symposium, Virtual, 18–25 June 2021. [Google Scholar]
  18. Xu, K.; Sun, Z.; Wang, S.; Wang, Y. Integrate “sweet spot” seismic prediction with microseismic monitoring to apply to lacustrine shale in Sichuan Basin of China. In Proceedings of the SEG/AAPG International Meeting for Applied Geoscience & Energy, Houston, TX, USA, 28 August–1 September 2022. [Google Scholar] [CrossRef]
  19. Wang, L.; Yao, Y.; Wang, K.; Adenutsi, C.D.; Zhao, G. Combined Application of Unsupervised and Deep Learning in Absolute Open Flow Potential Prediction: A Case Study of the Weiyuan Shale Gas Reservoir. In Proceedings of the SPE/AAPG/SEG Asia Pacific Unconventional Resources Technology Conference, Virtual, 16–18 November 2021. [Google Scholar] [CrossRef]
  20. Zeng, L.; Zheng, Y.; Zou, L. Fracturing Technology of Real Time Control Guarantees Highly Efficient Exploitation of Shale in Weiyuan Gas-Field, SW China. In Proceedings of the SPE Russian Petroleum Technology Conference, Virtual, 26–29 October 2020. [Google Scholar] [CrossRef]
  21. Akita, E.; Moghanloo, R.G.; Davudov, D.; Tinni, A. A Systematic Approach for Upscaling of the EOR Results from Lab-Scale to Well-Scale in Liquid-Rich Shale Plays. In Proceedings of the SPE Improved Oil Recovery Conference, Tulsa, OK, USA, 14–18 April 2018. [Google Scholar] [CrossRef]
  22. Ibrahim, A.F.; Ibrahim, M.; Chester, P. Developing New Soaking Correlation for Shale Gas Wells. In Proceedings of the SPE/AAPG/SEG Unconventional Resources Technology Conference, Denver, CO, USA, 22–24 July 2019. [Google Scholar] [CrossRef]
  23. Alqahtani, M.H.; Ertekin, T. Shale Gas Reservoir Development Strategies using Complex Specified Bottom-hole Pressure Well Architectures. In Proceedings of the SPE Kingdom of Saudi Arabia Annual Technical Symposium and Exhibition, Dammam, Saudi Arabia, 24–27 April 2017. [Google Scholar] [CrossRef]
  24. Saleem, W.A.; Baber, S.; Jafri, M.O. Shale Gas Field: Exploration, Exploitation and Development Strategies Globally. In Proceedings of the SPE Saudi Arabia Section Technical Symposium and Exhibition, Al-Khobar, Saudi Arabia, 21–24 April 2014. [Google Scholar] [CrossRef]
  25. Mitschanek, M.; Prohaska, M.; Thonhauser, G. Integrated Planning to Optimize Field Development Strategies and Real Time Decision Making During Project Execution for Large Scale Shale Resource Projects. In Proceedings of the SPE Intelligent Energy International Conference and Exhibition, Aberdeen, Scotland, UK, 6–8 September 2016. [Google Scholar] [CrossRef]
  26. Porlles, J. Strategy for the Development of Shale Gas in Peruvian Fields. In Proceedings of the SPE Latin America and Caribbean Petroleum Engineering Conference, Maracaibo, Venezuela, 21–23 May 2014. [Google Scholar] [CrossRef]
  27. Younus, H.M.B.; Kazmi, F.; Ali, W.; Khan, M.N.; Khalid, A. Development Strategy Planning for a Shale Reservoir. In Proceedings of the PAPG/SPE Pakistan section Annual Technical Conference, Islamabad, Pakistan, 26–27 November 2014. [Google Scholar] [CrossRef]
  28. Alsadoun, R. Integrated Resource Estimation and Field Development Workflow for Unconventional Reservoirs Using Reservoir Simulation and Economic Analysis Tools: A Case Study from a Shale Well in Saudi Arabia. In Proceedings of the SPE Annual Technical Conference and Exhibition, Dallas, TX, USA, 24–26 September 2018. [Google Scholar] [CrossRef]
Figure 1. The results of platform: (a) 3D attribute model; (b) fracturing propagation result.
Energies 16 02011 g001
Figure 2. The result of grid division on the platform: (a) Hydraulic fracture distribution on the platform; (b) Matrix attribute model; (c) Unstructured network model of coupled hydraulic fractures.
Energies 16 02011 g002aEnergies 16 02011 g002b
Figure 3. The results of historical production matching: (a) original; (b) reconstructed.
Energies 16 02011 g003
Figure 4. The change in cumulative production with the level of parameter in different factors: (a) engineering factors; (b) geological factors.
Energies 16 02011 g004
Figure 5. The different well trajectory angles of the fracture propagation: (a,b) is the numerical simulation of fracture propagation in 90°; (c,d) is the numerical simulation of fracture propagation in 70°; (e,f) is the numerical simulation of fracture propagation in 40°.
Energies 16 02011 g005aEnergies 16 02011 g005b
Figure 6. The EUR of different angle.
Energies 16 02011 g006
Figure 7. Fracture modification under the different well volume of fracturing fluids.
Energies 16 02011 g007
Figure 8. The fracture reconstruction volume under different volume of fracturing fluids.
Energies 16 02011 g008
Figure 9. The change in fracture width under the different proppant mass.
Energies 16 02011 g009
Figure 10. The change in supporting fracture length and volume under the different proppant mass.
Energies 16 02011 g010
Figure 11. The fracture conditions under different well spacing: (a) 250 m; (b) 300 m; (c) 350 m; (d) 400 m; (e) 450 m.
Energies 16 02011 g011aEnergies 16 02011 g011b
Figure 12. The cumulative recovery and average single well EUR under different well spacings: (a) the cumulative recovery; (b) the average single well EUR.
Energies 16 02011 g012
Figure 13. The change in cumulative production under different conditions: (a) different horizontal stage lengths under different dates; (b) different horizontal stage lengths.
Energies 16 02011 g013
Figure 14. The change in cumulative production, EUR, and effective stress under different allocation production and permeability: (a) the 20 years of cumulative production; (b) the change of EUR; (c) the change in effective stress with the permeability of different production.
Energies 16 02011 g014
Figure 15. The cumulative production curves under different strategies.
Energies 16 02011 g015
Figure 16. The change in water saturation and EUR in different production periods and soaking times: (a) the change in water saturation with a different production period; (b) the change in water saturation with a different soaking time; (c) the change of EUR with a different soaking time.
Energies 16 02011 g016
Table 1. The basic parameters for numerical simulation.
Engineering ParameterGeological Parameter
Average proppant mass per unit length
(t/m)
2.43Young’s modulus
(GPa)
42.6Matrix permeability
(nD)
50–200
Discharge
(m3/min)
9–18Poisson’s ratio0.25porosity0.05
Cluster6Average minimum horizontal principal stress
(MPa)
90.7Average gas content
(m3/t)
8.375
cluster spacing
(m)
9.71Average maximum horizontal principal stress
(MPa)
102.4Average Langmuir pressure
(MPa)
4
Volume of fracturing fluid pumped per unit length
(m3/m)
27.16Average Langmuir volume
(mg/g)
3.2
Table 2. Influence of engineering parameters on EUR.
FactorsEach Factor Corresponds to EUR, 108 m3
Volume of Fracturing FluidProppant MassCluster SpacingFlow RateWell SpacingHorizontal Stage Length
Level value 10.99 0.73 1.51 1.111.19 1.04
Level value 21.20 1.15 1.40 1.231.26 1.17
Level value 31.30 1.30 1.30 1.301.30 1.30
Level value 41.38 1.39 0.99 1.331.33 1.43
Level value 51.41 1.45 0.47 1.351.34 1.56
EUR range factor0.42 0.72 1.05 0.250.15 0.52
Table 3. Influence of geological parameters on EUR.
FactorsEach Factor Corresponds to EUR, 108 m3
PorosityMatrix
Permeability
Water
Saturation
Young’s ModulusMinimum Horizontal Principal StressPrincipal Stress Difference
Level value 10.65 0.78 1.48 1.45 1.88 1.69
Level value 20.98 1.04 1.37 1.40 1.69 1.45
Level value 31.30 1.30 1.30 1.30 1.30 1.30
Level value 41.63 1.56 1.24 1.20 1.19 1.17
Level value 51.95 1.82 1.20 1.10 1.10 1.08
EUR range factor1.30 1.04 0.29 0.35 0.78 0.61
Table 4. The increase in EUR under different strategies.
StrategyCumulative
Production (m3)
The Increase of EUR Relative IncreaseNote
No. 19.36 × 107100.00% Original
No. 29.75 × 107104.17%4.17%Angle
No. 31.02 × 108108.97%4.81%Well spacing
No. 41.12 × 108119.66%10.68%Volume of fracturing fluid
No. 51.17 × 108125.00%5.34%Production allocation
Disclaimer/Publisher’s Note: The statements, opinions and data contained in all publications are solely those of the individual author(s) and contributor(s) and not of MDPI and/or the editor(s). MDPI and/or the editor(s) disclaim responsibility for any injury to people or property resulting from any ideas, methods, instructions or products referred to in the content.

