Article

Inter-Turn Breakdown Fault Analysis and Winding Structure Optimisation of Winding of Dry-Type Transformers in Wind Farms

1
College of Electrical Engineering & New Energy, China Three Gorges University, Yichang 443002, China
2
Hainan Jinpan Electric Research Institute Co., Ltd., Wuhan 430074, China
*
Author to whom correspondence should be addressed.
Energies 2023, 16(4), 2012; https://doi.org/10.3390/en16042012
Submission received: 21 December 2022 / Revised: 10 January 2023 / Accepted: 10 February 2023 / Published: 17 February 2023

Abstract

:
To address the problem of winding turn-to-turn breakdown faults in 35 kV dry-type transformers in wind farms under overvoltage conditions, this paper establishes a simulation model based on the structural dimensions and material parameters of the transformer windings. The winding distribution parameters were calculated using the finite element method. The transient processes inside the high-voltage coil were calculated by constructing a multi-conductor transmission line model (MTL) that took into account the influence of the secondary winding. The voltage distribution of the winding was analysed for both lightning shock and extra-fast transient overvoltage conditions. The simulation results show that the maximum overvoltage between turns of the transformer winding under lightning shock is 5.282 kV; the maximum overvoltage between turns of the winding under very fast transient overvoltage is 11.6 kV, which occurs between the first 2–3 layers of the section, close to the insulation breakdown margin. On this basis, the transformer winding structure was optimised and the maximum inter-turn overvoltage after optimisation was 9.104 kV, reducing the likelihood of insulation breakdown by 24.1%. Finally, the accuracy of the winding structure optimisation simulation study was verified by testing the transformer’s impulse voltage before and after optimisation, providing a reference for the stable operation of 35 kV dry-type transformers in wind farm practical applications.

1. Introduction

In recent years, with the large number of wind farms in operation, 35 kV dry-type transformers have been used in large numbers in the field. Due to the differences between the electrical network structure of wind farms and the general distribution system, some of the conventional 35 kV dry-type transformers generated for commissioning in recent years have experienced winding turn-to-turn breakdown faults during operation due to the extra-fast transient overvoltages generated by the frequent operation of vacuum circuit breakers [1,2,3,4]. Although 35 kV dry-type transformers are less expensive and have a smaller failure rate, the high cost of shutdown and transport to replace them after a breakdown fault seriously affects the benefits. Therefore, it is important to improve and optimise the transformer winding structure to minimise the probability of this type of fault, in combination with the calculation and analysis of the fault location and winding inter-turn voltage of dry-type transformers, for the safe and stable operation of wind farms and to reduce maintenance costs.
Considering that inter-turn voltage measurement is more difficult, most of the existing studies on the distribution of winding inter-turn transient overvoltage in lightning overvoltage and extra-fast transient overvoltage cases are based on simulation calculations. In [5], a lightning surge simulation was carried out by establishing an equivalent circuit parameter model for the proportional model of the excitation winding of an autotransformer, but the inter-turn voltage percentage was not calculated and could not provide a reference for transformer engineering estimation. In [6], an equivalent circuit model was developed for every two turns along the radial direction, and the interlayer voltage distribution under lightning surge overvoltage was solved, but the safety margin of the interlayer insulation was not analysed and could not be used as a reference for engineering applications. The literature [7] proposes a hybrid circuit model for the need of extra-fast transient overvoltage simulation of EHV power transformers, using an MTL circuit to simulate the head of the winding and a collective parametric RLC circuit to simulate the rest of the winding. This approach can increase the size of the coils that can be modelled, but the difference in the number of equivalent circuits between the winding head and the rest of the winding is large and may result in coefficient matrix singularities. A centralised parametric model of a transformer winding consisting of a new Π-type equivalent circuit per turn was developed in the literature [8], which nearly doubles the applicable frequency for inter-turn voltage calculations of transformer windings of different voltage levels under extra-fast transient overvoltages, but ignores the coupling between adjacent coils. Most of these studies are based on wave process calculations with a single winding equivalent circuit model. As the accuracy of the parameters is related to the actual coil coupling of the coils, further studies are needed to analyse the transformer coil transient voltage distribution based on an accurate transformer coil high-frequency model.
In this paper, for the same type of 35 kV dry-type transformer with several faults during operation in different wind farms, an MTL model is first established considering the interaction of the primary and secondary windings. A two-dimensional axisymmetric model is also established based on the actual transformer winding dimensions. The finite element method is applied to calculate the distribution parameters of the transformer windings at high frequencies. The transformer winding is then subjected to overvoltage calculations based on the MTL model taking into account the influence of the secondary winding. A standard lightning surge overvoltage is loaded and an exceptionally fast transient overvoltage waveform generated by the opening of a vacuum circuit breaker in a wind farm is considered. The inter-pie and inter-turn voltage distributions in the transformer winding are analysed and calculated for the two cases. The waveforms of the winding voltage as a function of time, the maximum overvoltage value between pies and the maximum overvoltage value between turns are obtained. The winding structure is optimised in combination with the simulation analysis to reduce the maximum turn-to-turn voltage. Finally, the accuracy of the winding structure optimisation simulation study is verified by testing the transformer surge voltage before and after optimisation.

2. Simulation Modelling of a Transformer Considering the Primary and Secondary Windings

2.1. MTL Model Considering Primary and Secondary Windings

The MTL model can consider the distribution parameters of all windings and simulate the winding voltage distribution under transient overvoltage more accurately. Therefore, the MTL model is considered in this paper to analyse the influence of the secondary winding on the voltage distribution of the primary winding under transient voltages in wind farms. For the special structure of the transformer coil, the winding is split along the axial plane, ignoring the effect of bending of the turns, and the turns are spread into straight lines, with each turn becoming a “transmission line” [9]. These multiple “transmission lines” are connected end to end according to the coil winding relationship; the entire transformer winding constitutes a multi-conductor transmission line model, as shown in Figure 1. The boundary conditions for the wire turns are that the voltage and current at the end of the i-th wire are equal to the voltage and current at the beginning of the i-th + 1st wire (I = 1, 2, ..., n−1); the first wire is connected to a voltage source at the beginning and the n-th wire is grounded at the end, then the corresponding multi-conductor transmission line model can be regarded as a 2n-port network with a total of 2n boundary conditions. The telegraph equation for the MTL in its time domain can be expressed as
U x , t z = R I x , t + L I x , t t
I x , t z = G I x , t + C U x , t t
where U(z, t), I(z, t) are the column vectors of voltage and current, respectively, and [R], [L], [G], [C] are the matrices of resistance, inductance, conductance and capacitance parameters of the multi-conductor system, respectively.
When considering the effect of the secondary winding, the secondary winding is grounded at both ends and the boundary conditions change accordingly; the specific derivation process can be found in [10].

2.2. Distribution Parameter Model for Transformers

The total number of turns in the high-voltage winding of a 35 kV dry-type transformer is 959, and the winding is divided into 14 pies; the medium voltage winding is 96 turns and the winding is divided into 5 pies. The resulting 2D axisymmetric simulation model of the transformer is shown in Figure 2.
In the internal structure of the 35 kV dry-type transformer, the core is made of silicon steel. The low-voltage and medium-voltage coils are foil-type and the high-voltage coils are epoxy-cylinder-type. The transformer model material parameters are shown in Table 1.

2.3. Calculation of Distribution Parameters

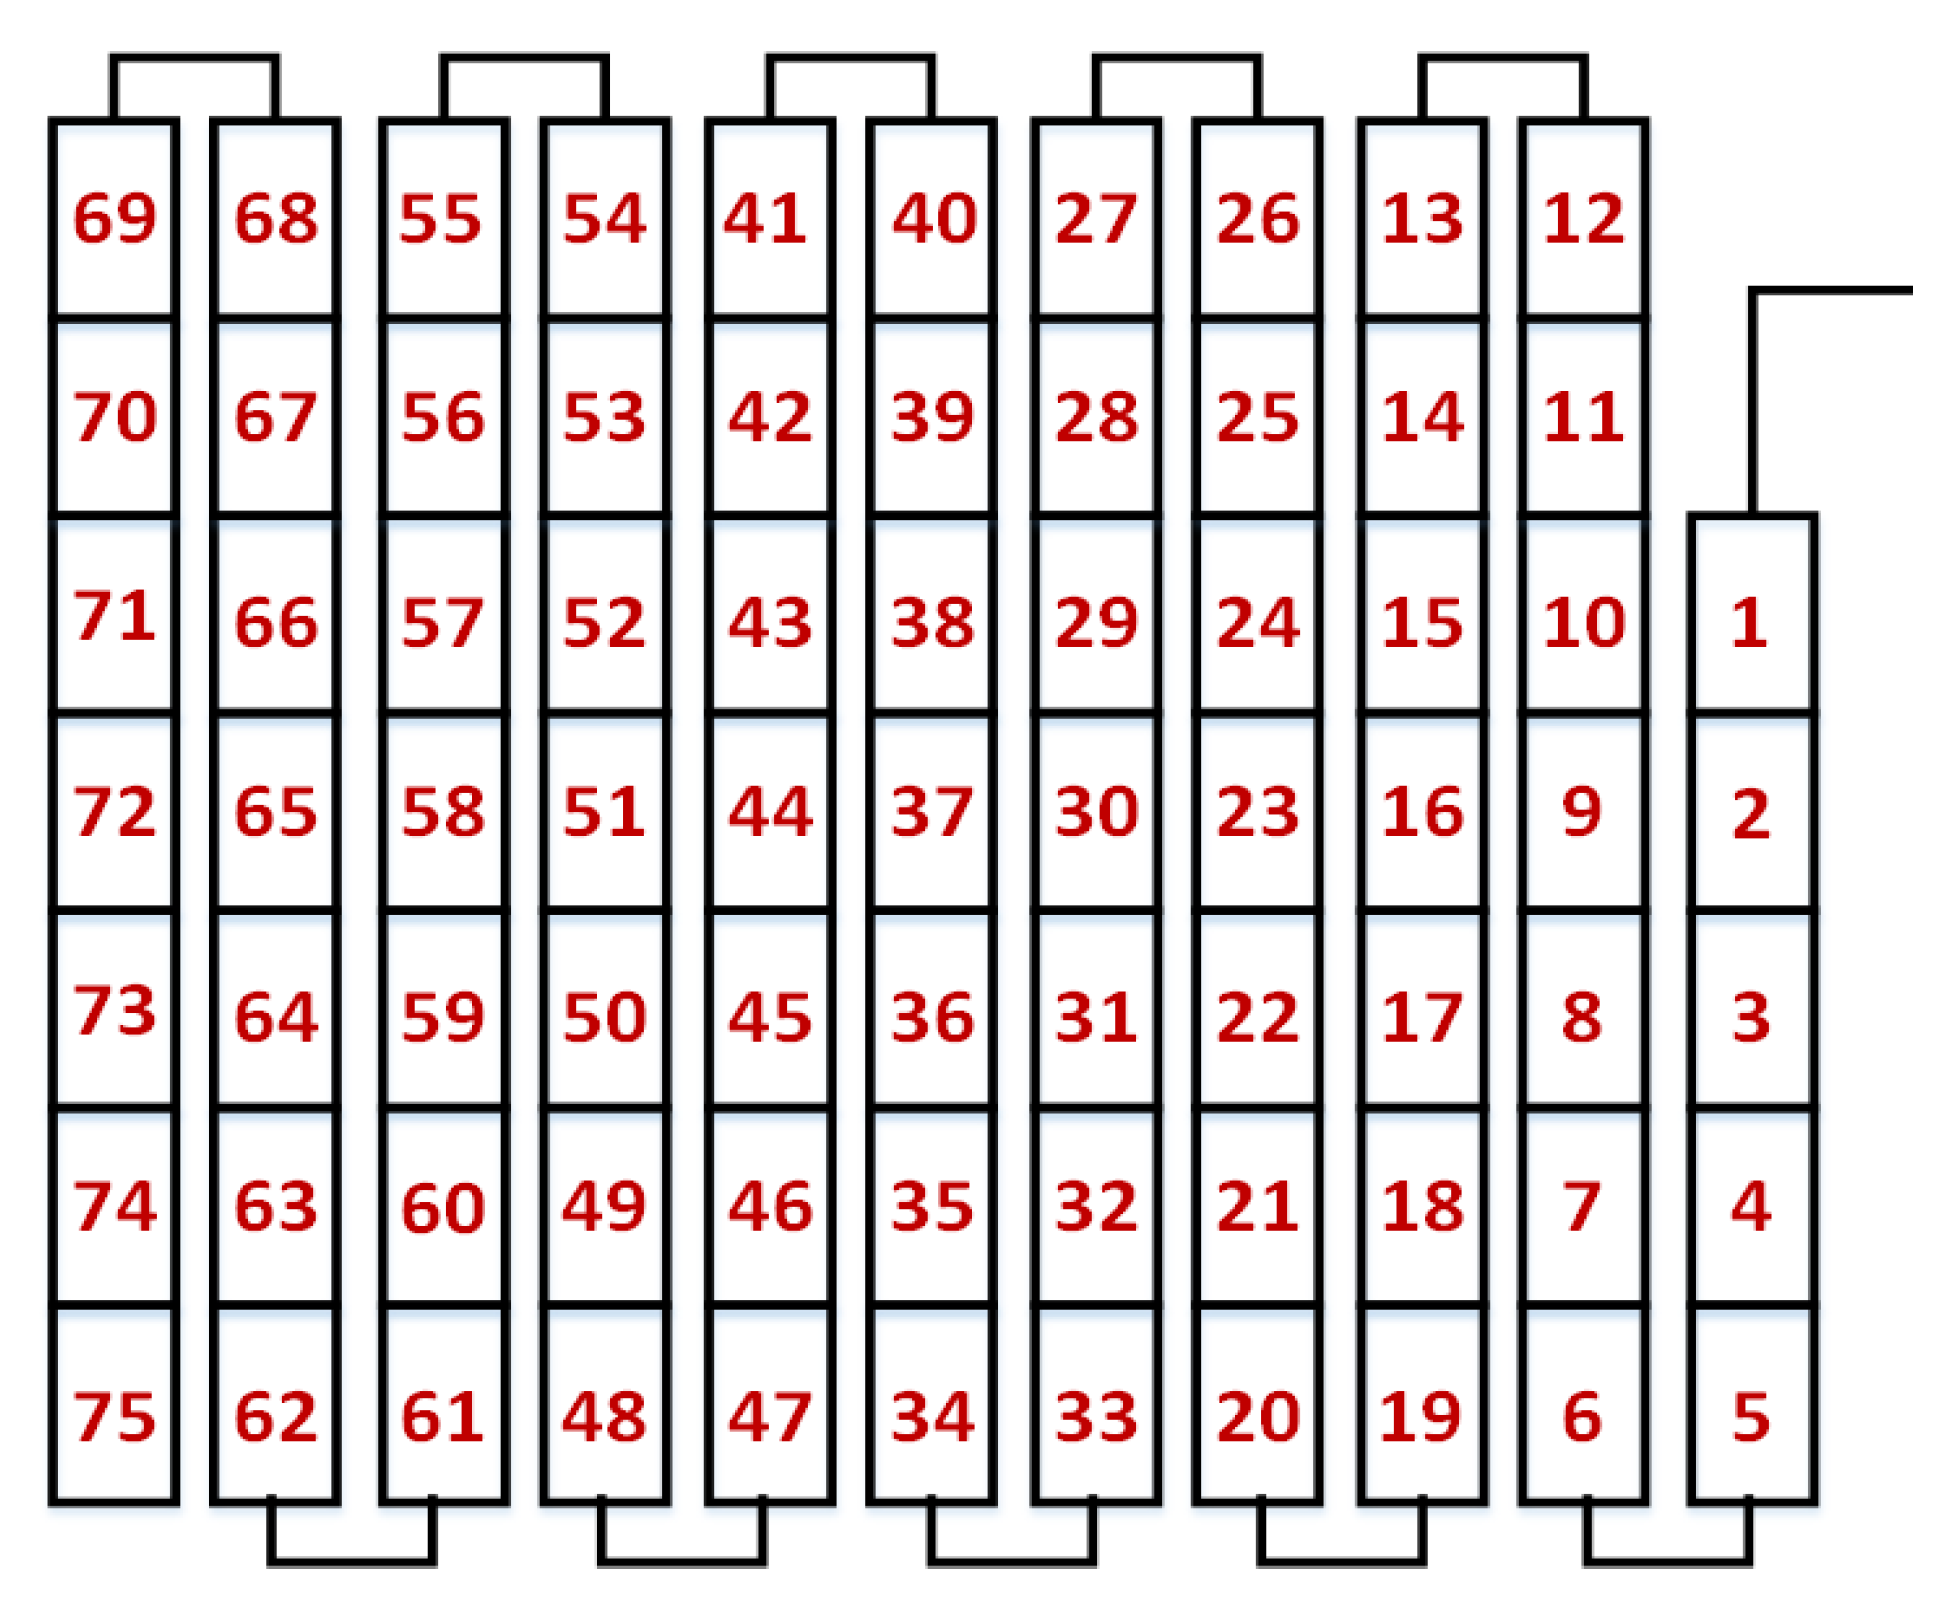
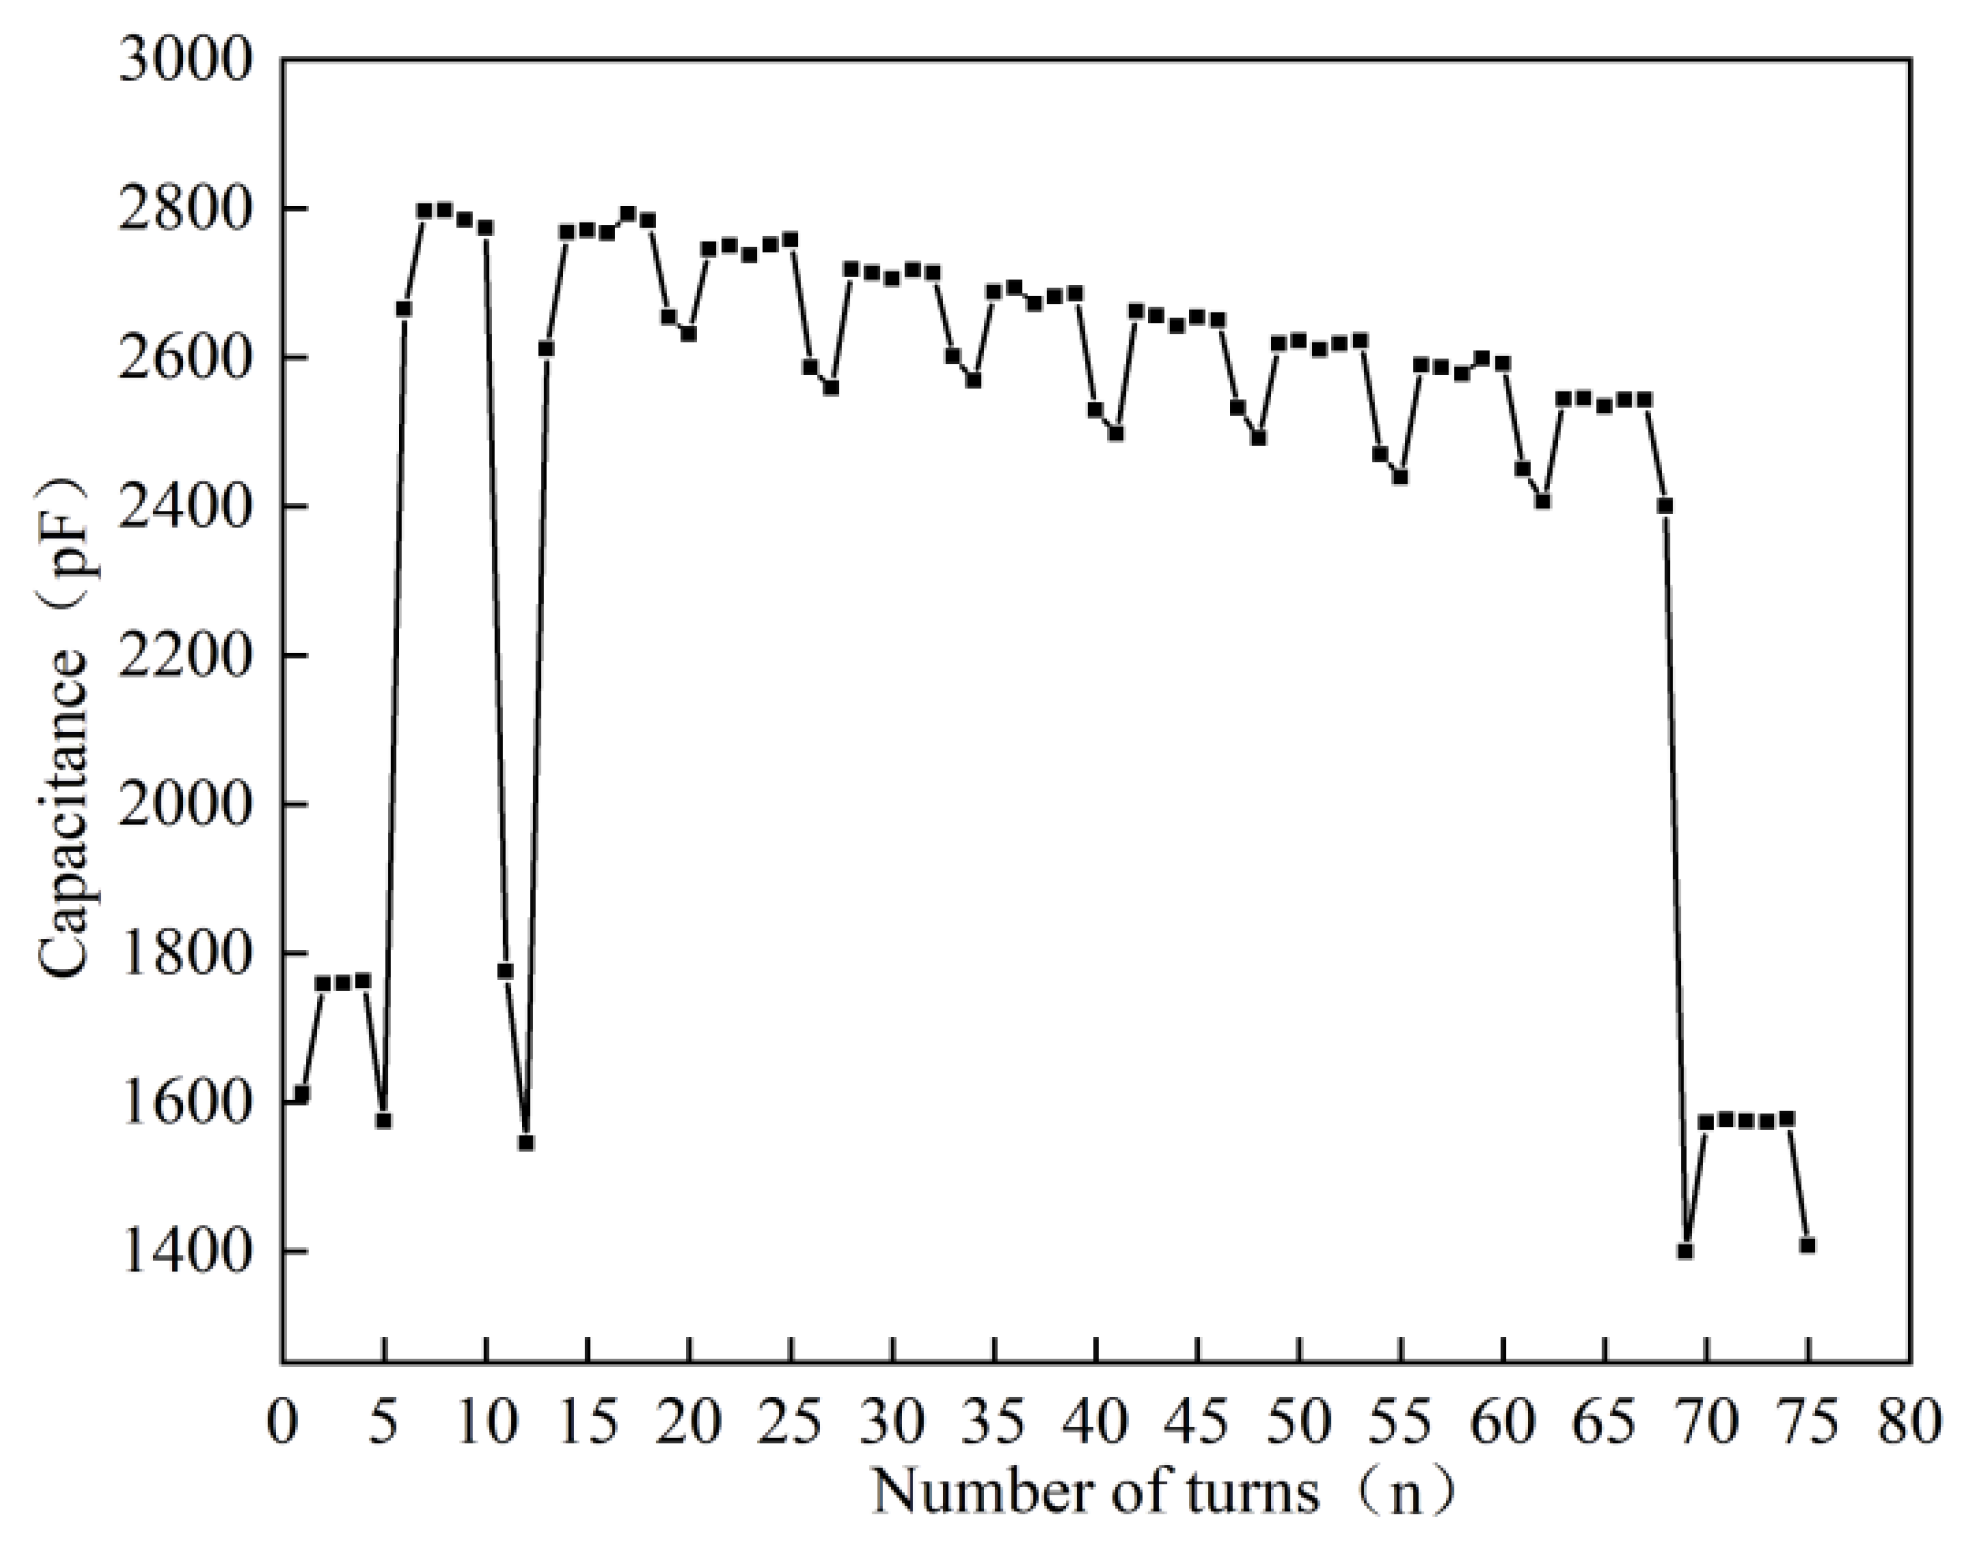
2.3.1. Calculation of Capacitance Parameters

The formulae for calculating the capacitance parameters refer to the literature [11]. Taking the 1st pie coil as an example, the results of the calculation of its capacitance parameters are analysed as follows. The sequence structure of the 1st pie coil is shown in Figure 3, and the resulting self-capacitance of each turn is shown in Figure 4. The self-capacitance of each turn is highly dependent on the position of the turns. The outermost and innermost coils are further away from ground on the outside and have a smaller self-capacitance. The last two turns of the 2nd layer coil (wire turns 11 and 12) are the same as the 1st layer, with the outer side further away from ground and with a smaller self-capacitance. The middle part of the coil is surrounded by other coils and has a higher self-capacitance. The mutual capacitance parameters of coil 1 and the other coils are shown in Figure 5. As can be seen from Figure 5, the mutual capacitance of the coils adjacent to coil 1 is higher. Coil 1 and coils 2 and 10 are adjacent to each other, where the area directly opposite the coils in the vertical direction is smaller than the area directly opposite the coils in the horizontal direction, thus the inter-turn capacitance of coils 1 and 2 is much smaller than the inter-turn capacitance of coils 1 and 10. The inter-turn capacitance of coils not adjacent to coil 1 is approximately zero.

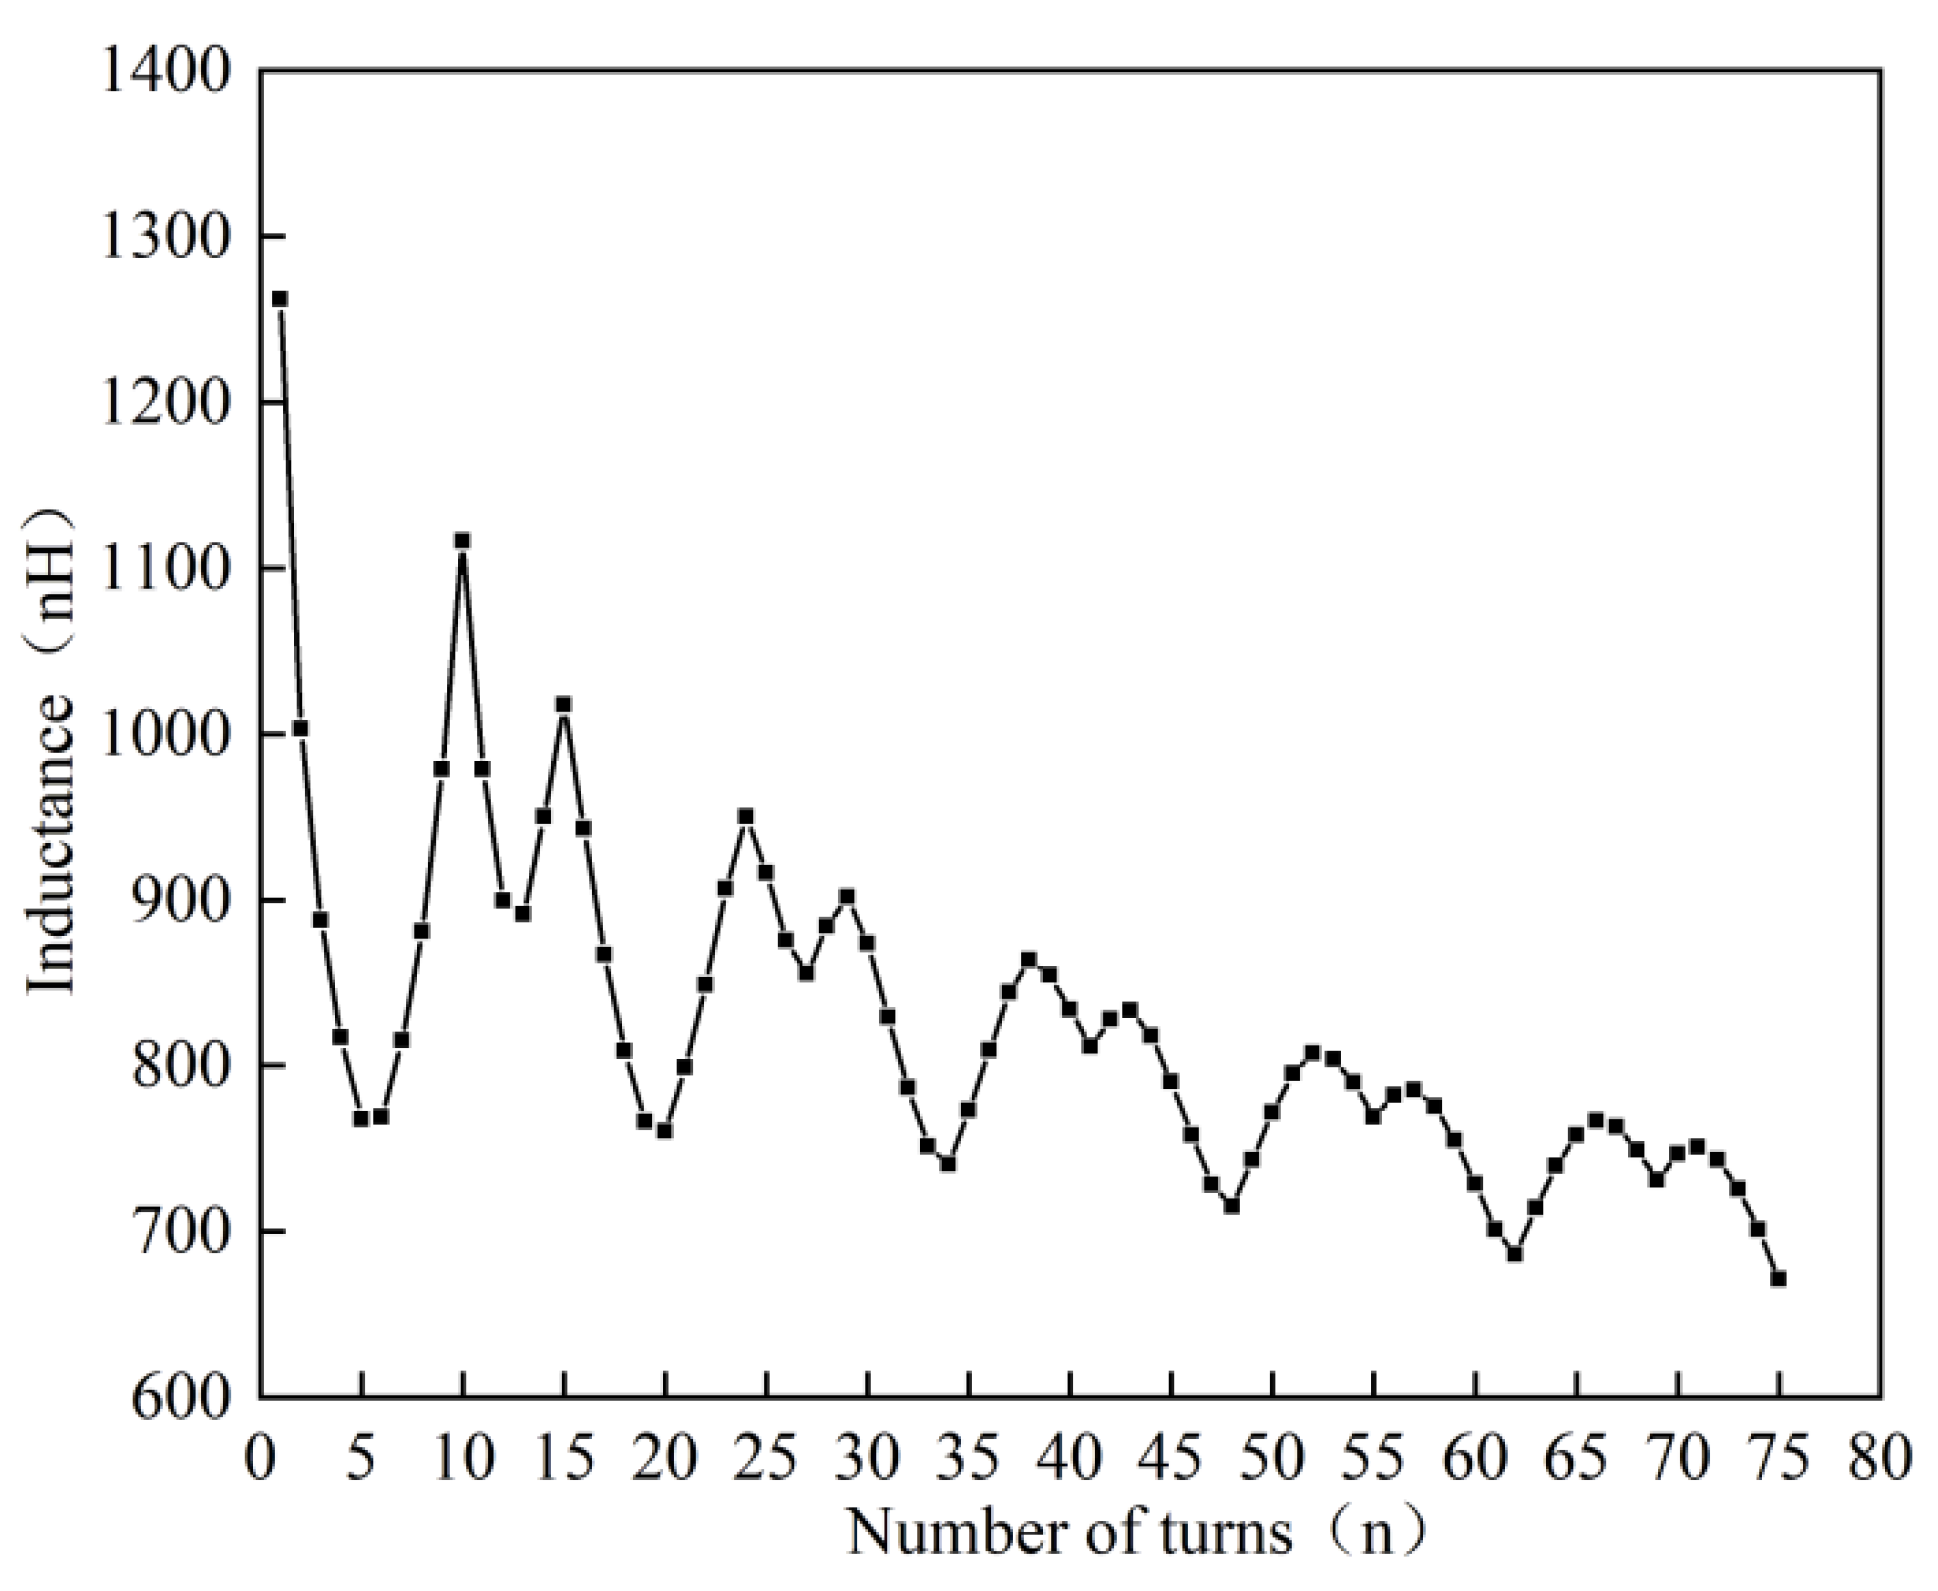
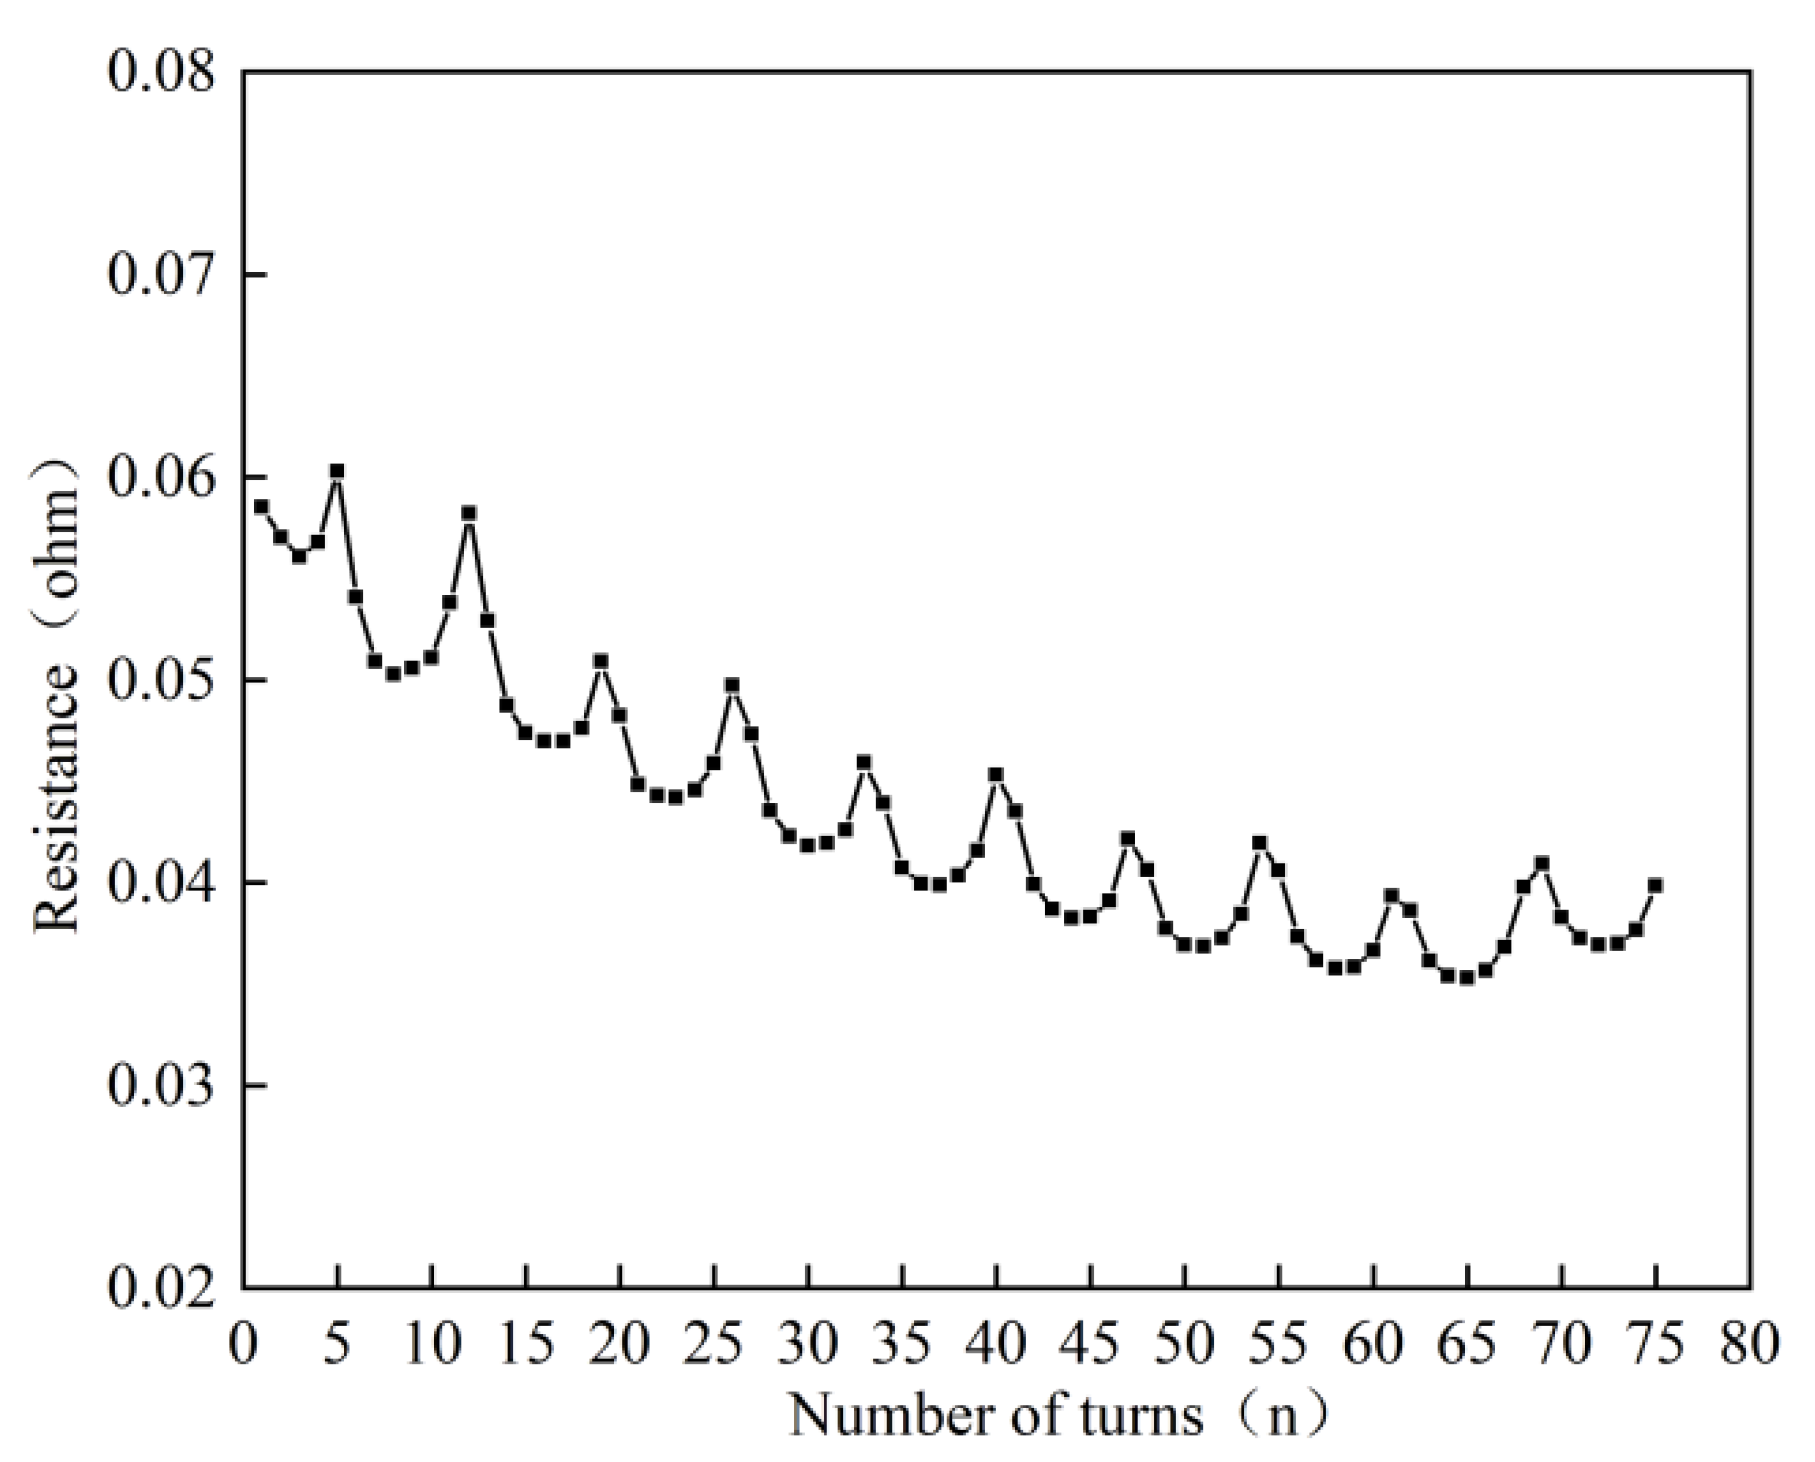
2.3.2. Calculation of Inductance and Resistance Parameters

The inductance and resistance parameters of the winding are related to the frequency value. With surge voltages, the frequency components are very high and can reach MHz and above. In this case, a strong skin effect is generated in the core, making it difficult for the magnetic flux to pass through, and the corresponding inductance values are reduced. Therefore, an analysis of the time-harmonic magnetic field is required. In this paper, frequencies of MHz and above are taken and the inductance–resistance matrix is calculated and analysed using an infinitely long core model with no iron yoke and constant permeability.
The self-inductance of the 1st cake coil, for example, is shown in Figure 6. As can be seen from Figure 6, the self-inductance varies from turn to turn in each layer due to the skinning effect at high frequencies. In this case, the self-inductance of the coils in the same layer decreases gradually from the end to the middle. The mutual inductance parameters of coil 1 and the other coils are shown in Figure 7. It can be seen that the difference between the mutual inductance parameters of the adjacent coils and their self-inductance parameters is very small. The mutual inductance tends to decrease with the coils further apart, but still by the same order of magnitude.
The resistance parameters of the first cake winding are shown in Figure 8. As can be seen from Figure 8, the resistance per turn varies due to skinning effects and differences in the radii of the different winding layers, but the values are small and have little effect on the distribution of the inrush voltage.

3. Transient Voltage Distribution of the Transformer Considering the Effect of the Secondary Side

3.1. Windings Voltage Distribution under Lightning Overvoltage

In order to study the winding inter-turn voltage distribution under lightning shock, a standard lightning shock voltage with a transient overvoltage amplitude of 111 kV and a wavefront time/wave tail time of 1.2/50 μs was loaded at the transformer inlet. The resulting winding inter-turn voltage distribution is shown in Figure 9. As can be seen from Figure 9, the maximum voltage difference between adjacent line cakes is between line cake 1 and line cake 2, with an amplitude of approximately 20.43 kV; the minimum voltage difference is between line cake 9 and line cake 10, with an amplitude of approximately 6.129 kV.
Inter-turn voltage difference in the vertical direction was small; considering the effect of capacitance to ground, the maximum inter-turn voltage difference was at the farthest interval between adjacent layers (e.g., D2 and E3), the node number marker diagram is shown in Figure 10. The voltage difference between the layers is shown in Figure 11 and Figure 12. The voltage peak between turns D10-E11 in the horizontal direction of line cake 1 is the largest between the layers, reaching 5.282 kV; the voltage peak between turns D2-E3 is the smallest between the layers of the cake, approximately 4.431 kV. Peak voltage between turns D13-E14 in the horizontal direction of line cake 2 is the maximum between the layers of this cake and amounts to 4.339 kV; peak voltage between turns D14-E15 is the minimum between the layers of this cake and amounts to approximately 4.281 kV.
Considering the effects of electrothermal ageing in the long-term operation of dry-type transformers, the breakdown field strength of the epoxy resin drops to about 20 kV/mm [12]. The insulation thickness between turns is 0.64 mm in both horizontal and vertical directions, and the required voltage for turn-to-turn breakdown is approximately 12.8 kV. The maximum overvoltage between layers 1 and 2 of the line cake is 5.282 kV when a lightning surge overvoltage occurs, which is much less than 12.8 kV, making it more difficult for insulation breakdown to occur between turns of the transformer under a lightning surge.

3.2. Windings Voltage Distribution under Extra-Fast Transient Overvoltage

In this paper, the overvoltage simulation results of the wind farm circuit breaker breakdown model at the transformer line ends from the literature [13] were used and the section of the waveform with the greatest wavefront steepness was selected as the excitation for the transformer windings. This waveform has a voltage amplitude of 145 kV, a rising edge of 0.2 μs and a wavefront steepness of 700 kV/μs, with frequencies mainly concentrated in the range 1–20 MHz.
The transient voltage distribution at the first end of each bobbin is shown in Figure 13. The maximum values of the first four cakes were 114 kV, 89 kV, 68.3 kV and 51.5 kV. The voltage differences between the winding cakes are shown in Figure 14. The maximum voltage difference between adjacent cakes was between cake 1 and cake 2, with an amplitude of approximately 32.06 kV; the minimum voltage difference was between cake 11 and cake 12, with an amplitude of approximately 2.463 kV. As can be seen from Figure 13 and Figure 14, the potential distribution between the wire cakes in the area of the high-voltage winding near the first end was extremely uneven, with the maximum value occurring between wire cake 1 and wire cake 2. Therefore, the interlayer potential difference between the 1st and 2nd cakes of the high-voltage winding was analysed to determine whether the maximum interlayer overvoltage would cause damage or failure of the insulation material, thus providing further theoretical support for optimising the coil insulation design.
The analysis of the voltage difference waveforms between the layers is shown in Figure 15 and Figure 16. The voltage peak between turns D2-E3 in the horizontal direction of line cake 1 was the largest between layers, reaching 11.6 kV; the voltage peak between turns D10-E11 was the smallest between layers of the cake, about 3.983 kV. The voltage peak between turns D13-E14 in the horizontal direction of line cake 2 was the largest between layers of the cake, reaching 7.512 kV; the voltage peak between turns D19-E20 was the smallest between layers of the cake, about 3.432 kV. The maximum inter-turn voltage difference is shown in Figure 17 (example of the first 2 pies). It can be seen that the maximum voltage difference was between C5 and C6, with an amplitude of approximately 6.653 kV.
Taking into account the effects of electrothermal ageing under long-term operation of dry-type transformers, the voltage required for turn-to-turn insulation breakdown of the winding is approximately 12.8 kV. Since the generation of operational transient overvoltages of very high amplitude and frequency is limited, the maximum overvoltage between layers 1 and 2 of the line cake when wind farm extra-fast transient overvoltages occur is 11.6 kV, which is close to 12.8 kV. Thus, in this case, turn-to-turn insulation breakdown may occur, but the number of occurrences is limited. By optimising the winding structure of the transformer, the insulation margins can be made larger, thus reducing the likelihood of breakdown.

4. Transformer Winding Structure Optimisation Analysis

4.1. Windings Voltage Distribution after Structural Optimisation

The above analysis shows that the maximum interlayer voltage of 11.6 kV is close to the horizontal interturn breakdown voltage of 12.8 kV for a transformer winding with 75 turns in the first pie, and therefore measures need to be taken to reduce the winding overvoltage. To address the shortcomings of various overvoltage protection methods [14,15] and transformer insulation designs [16,17] and consider the fact that in actual transformer production, either the installation of capacitor rings and capacitor turns or the insertion of shielding wires [18,19] increases the size and production costs of the transformer, this paper uses a change in the number of turns of the first cake for winding optimisation. Due to the uneven voltage distribution between the line cakes in the area of the high-voltage winding near the first end, the maximum interlayer voltage difference is influenced by the capacitance to ground. Consider reducing the number of turns in each layer of the transformer winding in the first end area to improve the voltage distribution pattern.
In this section, the first and second pancake coils are changed to 43 and 65 turns, respectively, and the voltage distribution between adjacent pancakes and between layers is analysed for the optimised winding under extra-fast transient overvoltage. The transformer high-voltage winding is divided into 14 pancakes and the voltage waveforms at the first end of each pancake are shown in Figure 18. The maximum values of the first four cakes were 111.4 kV, 98.48 kV, 88.67 kV and 70.42 kV, respectively. The voltage difference between the winding pancakes is shown in Figure 19. The maximum voltage difference between adjacent cakes was between cake 1 and cake 2, with an amplitude of approximately 28.3 kV; the minimum voltage difference was between cake 10 and cake 11, with an amplitude of approximately 2.293 kV.
The node number marker diagram is shown in Figure 20. The analysis of the voltage difference waveform between each layer is shown in Figure 21 and Figure 22. As the number of turns per winding layer decreases, the ground capacitance also decreases and the winding voltage distribution is relatively more uniform. The voltage peak between turns D2-E3 in the horizontal direction of wire cake 1 is the largest between layers, reaching 9.104 kV; the voltage peak between turns D8-E9 is the smallest between layers of the cake, at approximately 1.352 kV. The voltage peak between turns D20-E21 in the horizontal direction of wire cake 2 is the largest between layers of the cake, reaching 5.379 kV; the voltage peak between turns D18-E19 is the smallest between layers of the cake, at approximately 1.043 kV. The maximum inter-turn voltage difference is shown in Figure 23 (for the first 3 cakes). It can be seen that the maximum voltage difference is between C3 and C4, with an amplitude of approximately 3.389 kV.
A comparison of the maximum voltage difference and position before and after winding structure optimisation is shown in Table 2. When the winding structure was changed to 43 turns in the first pie, the maximum overvoltage between the first and second pie was reduced by 11.73%; the maximum voltage difference between turns was reduced by 49.1%; the maximum interlayer overvoltage was changed from 12 kV to 9.104 kV, the overvoltage amplitude was reduced by 24.1% and the insulation breakdown was also reduced.

4.2. Test Verification

Since the access of the measurement leads changes the winding structure and distribution parameters, affecting the original transformer structure, this makes the measurement results between each cake and turn not match the real situation. Therefore, this paper experimentally investigates the actual effect of the surge voltage on the transformer before and after optimisation and compares the test results with the simulation conclusions for verification. The test transformer parameter table is shown in Table 3. The actual layout diagram of the transformer withstand voltage test is shown in Figure 24. The schematic diagram of the actual winding of the transformer coil is shown in Figure 25. Using a surge voltage generator to simulate a very fast transient overvoltage with a voltage amplitude of 145 kV, a wavefront time of 0.2 μs and a wavefront steepness of 700 kV/μs, three withstand voltage tests were conducted on each of the three transformers before optimisation of the winding structure. The three transformers passed the first two tests, but under the action of the third shock, two of the transformers suffered breakdown near the first end. The breakdown diagram is shown in Figure 26. The three transformer models with optimised high-voltage winding structure remained intact under the same overvoltage five times each. The test results verify the accuracy of the winding structure optimisation simulation study and provide a practical basis for the safe and stable operation of the optimised transformers.

5. Conclusions

The analysis of the inter-turn voltage distribution and winding structure optimisation of transformer windings in wind farms under the action of overvoltage leads to the conclusion that:
(1)
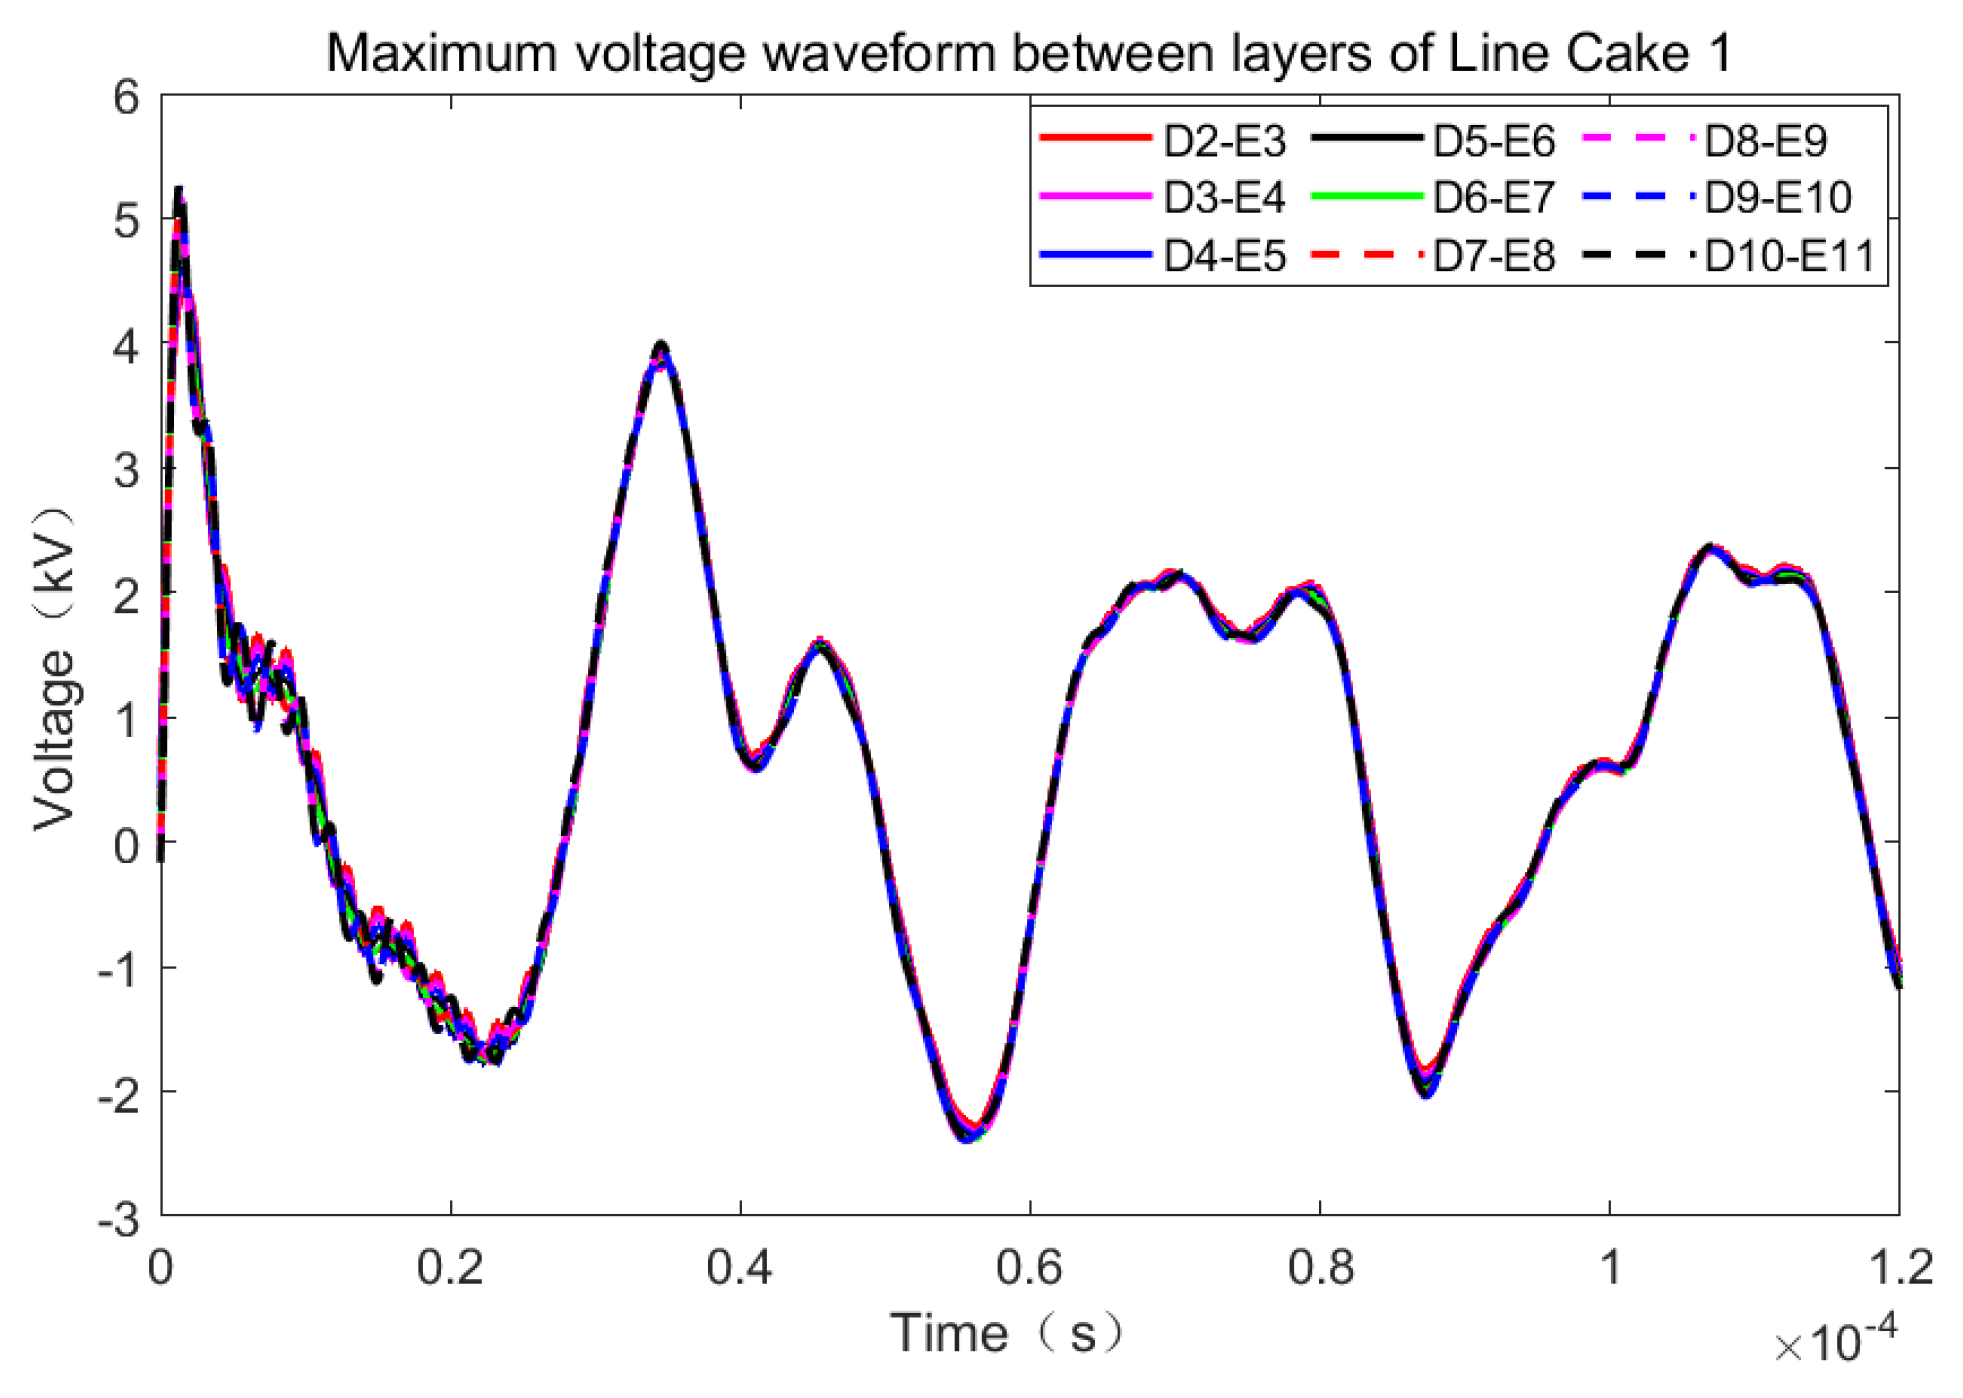
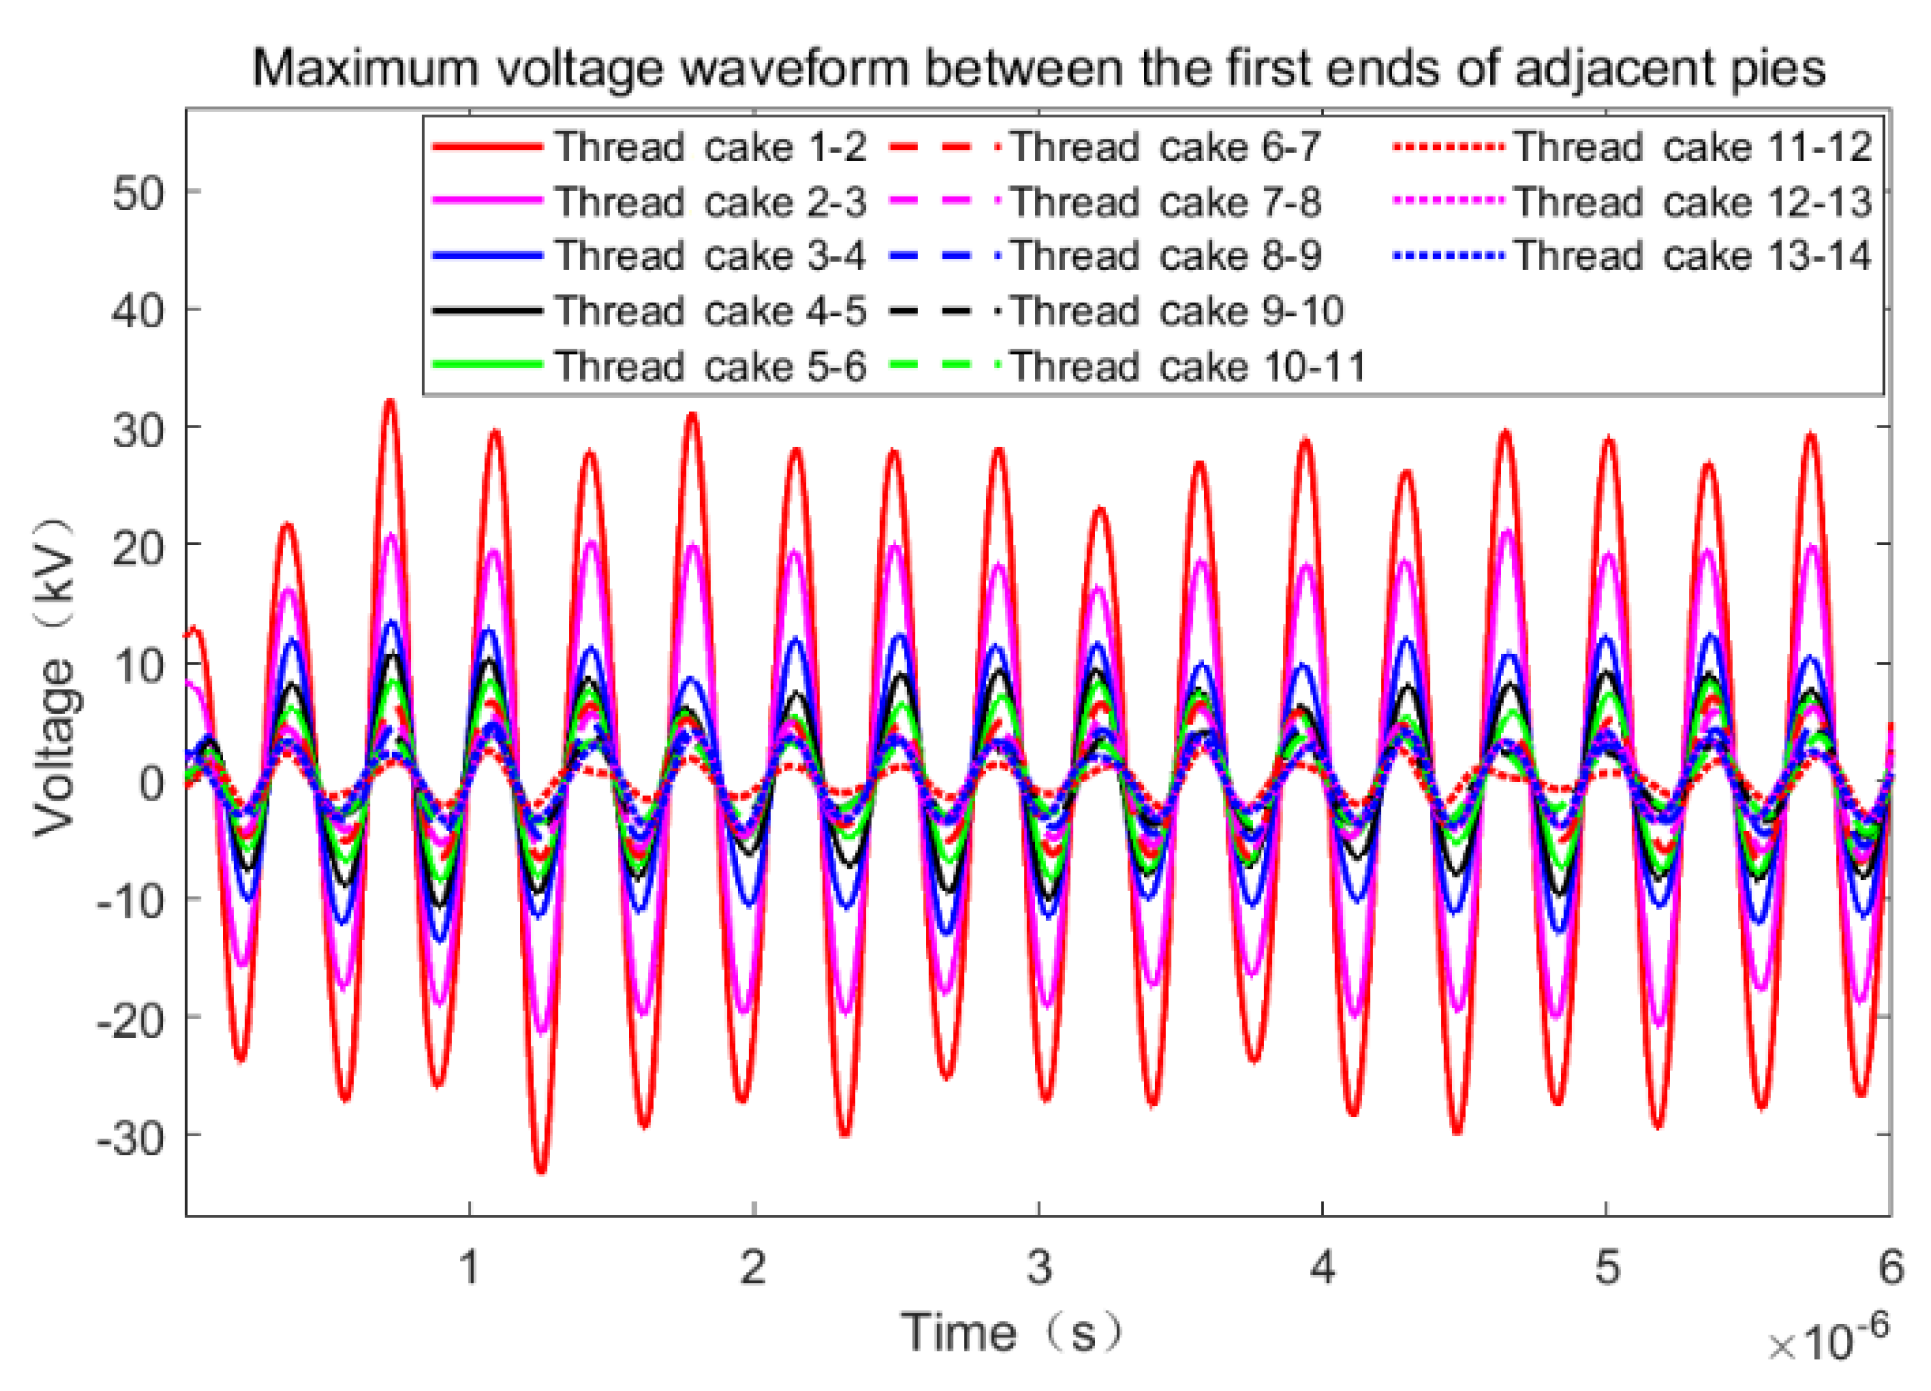
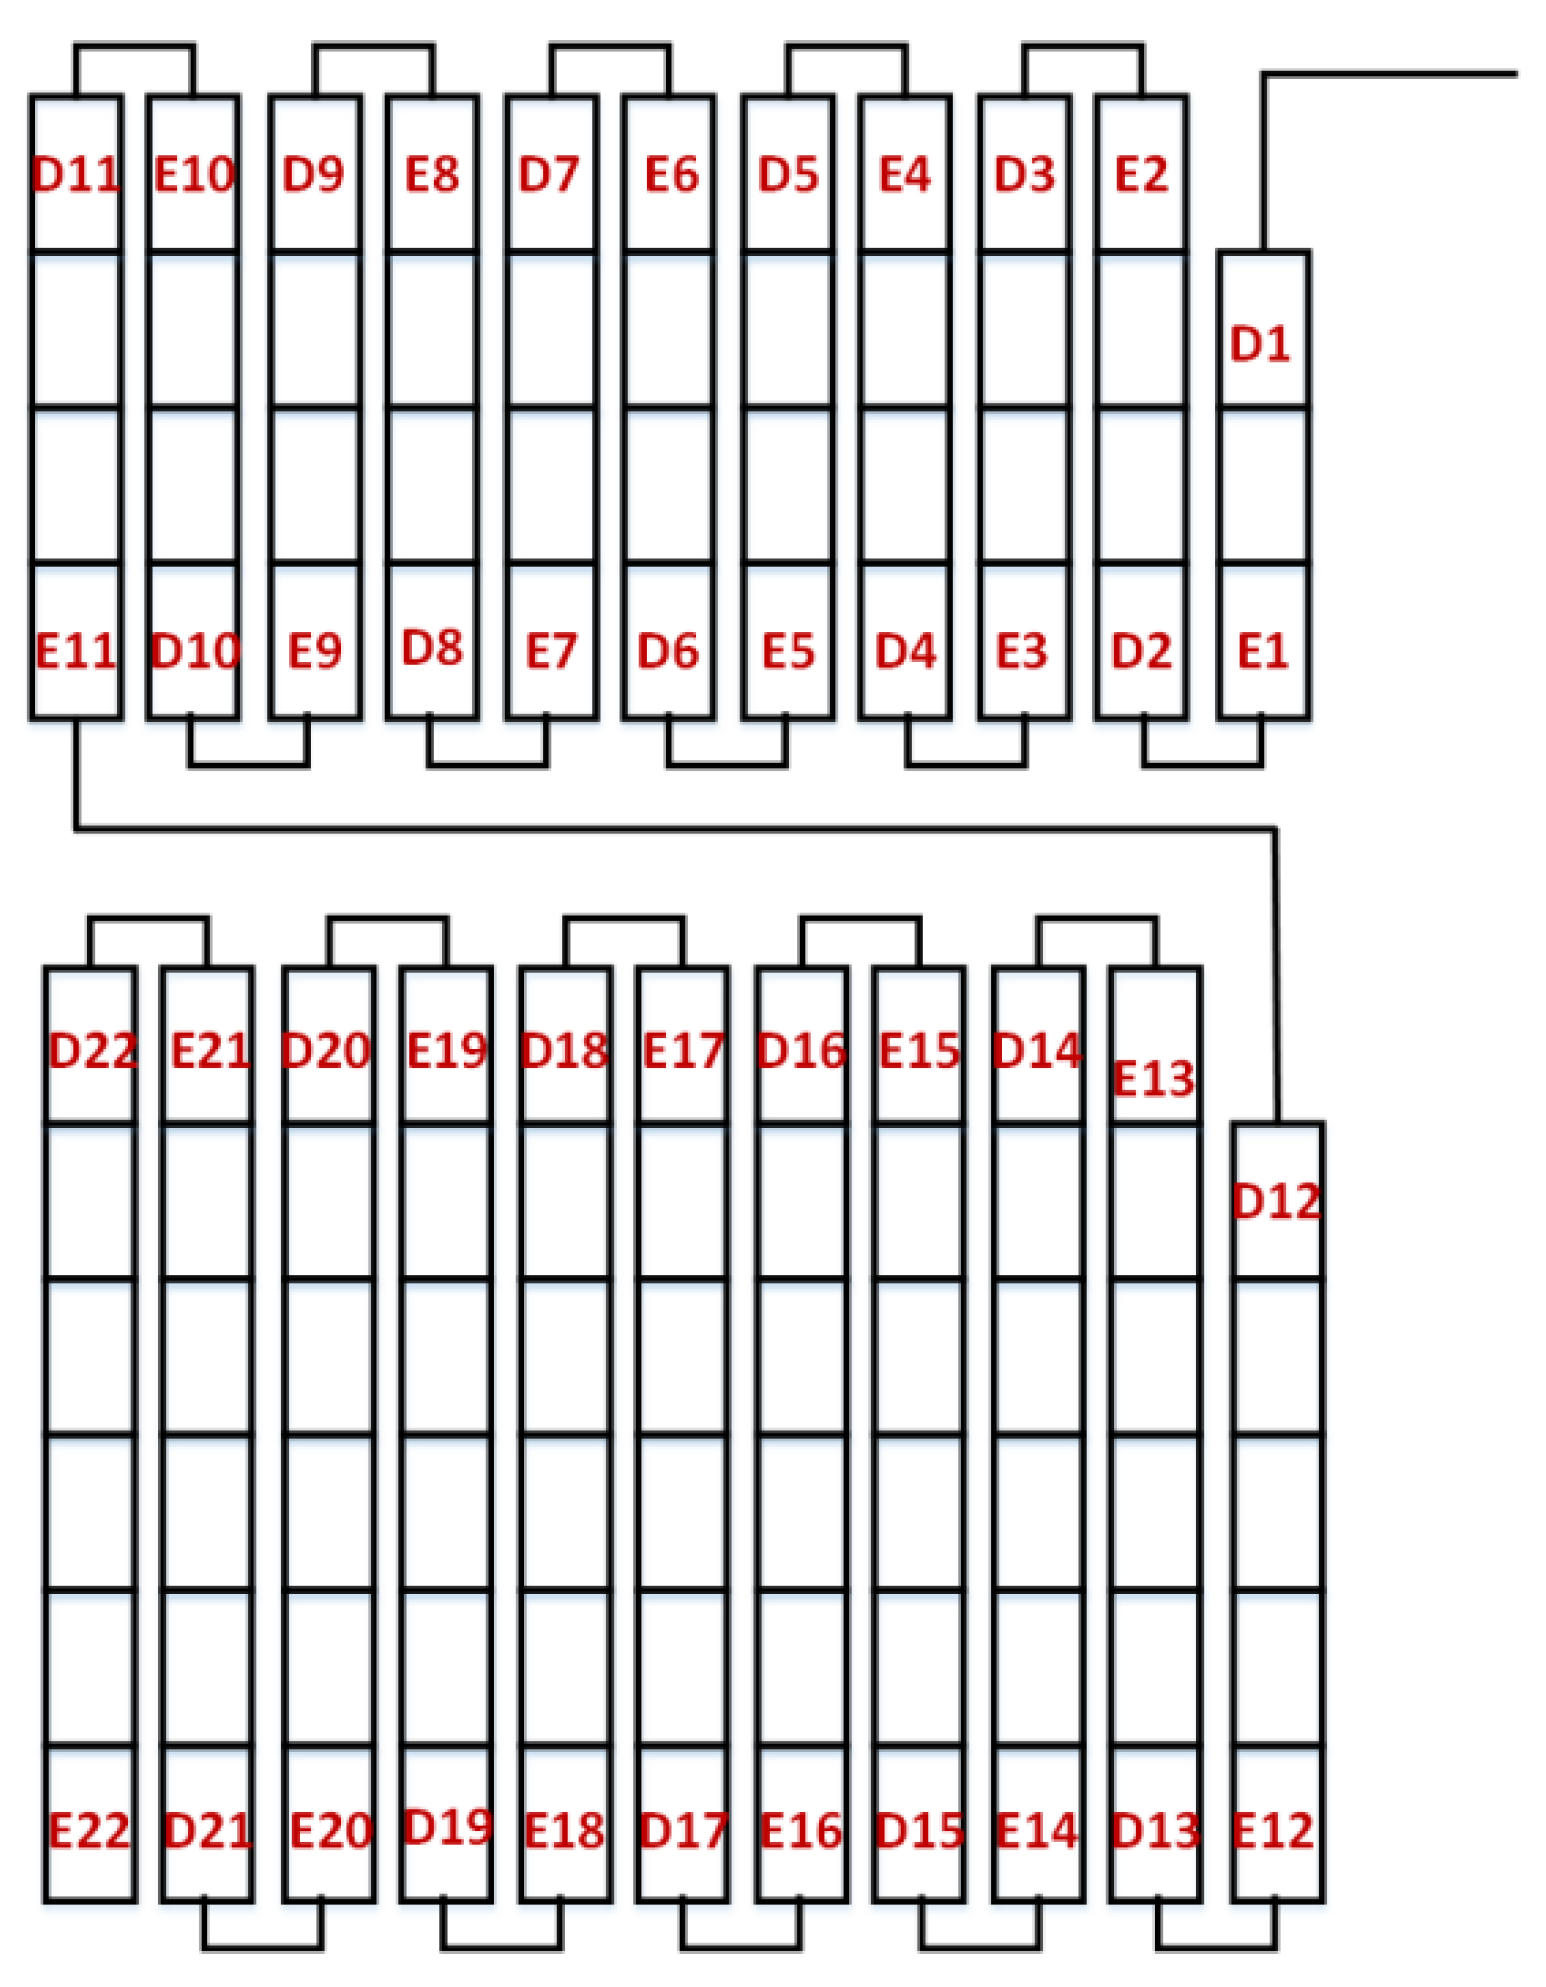
The maximum intercake voltage under lightning strikes is located between line cakes 1 and 2 with an amplitude of 20.43 kV; the maximum interlayer voltage is located at D10-E11 of line cake 1 with an amplitude of 5.282 kV, and the insulation margin in this case reaches 12.8 kV and is not prone to breakdown.
(2)
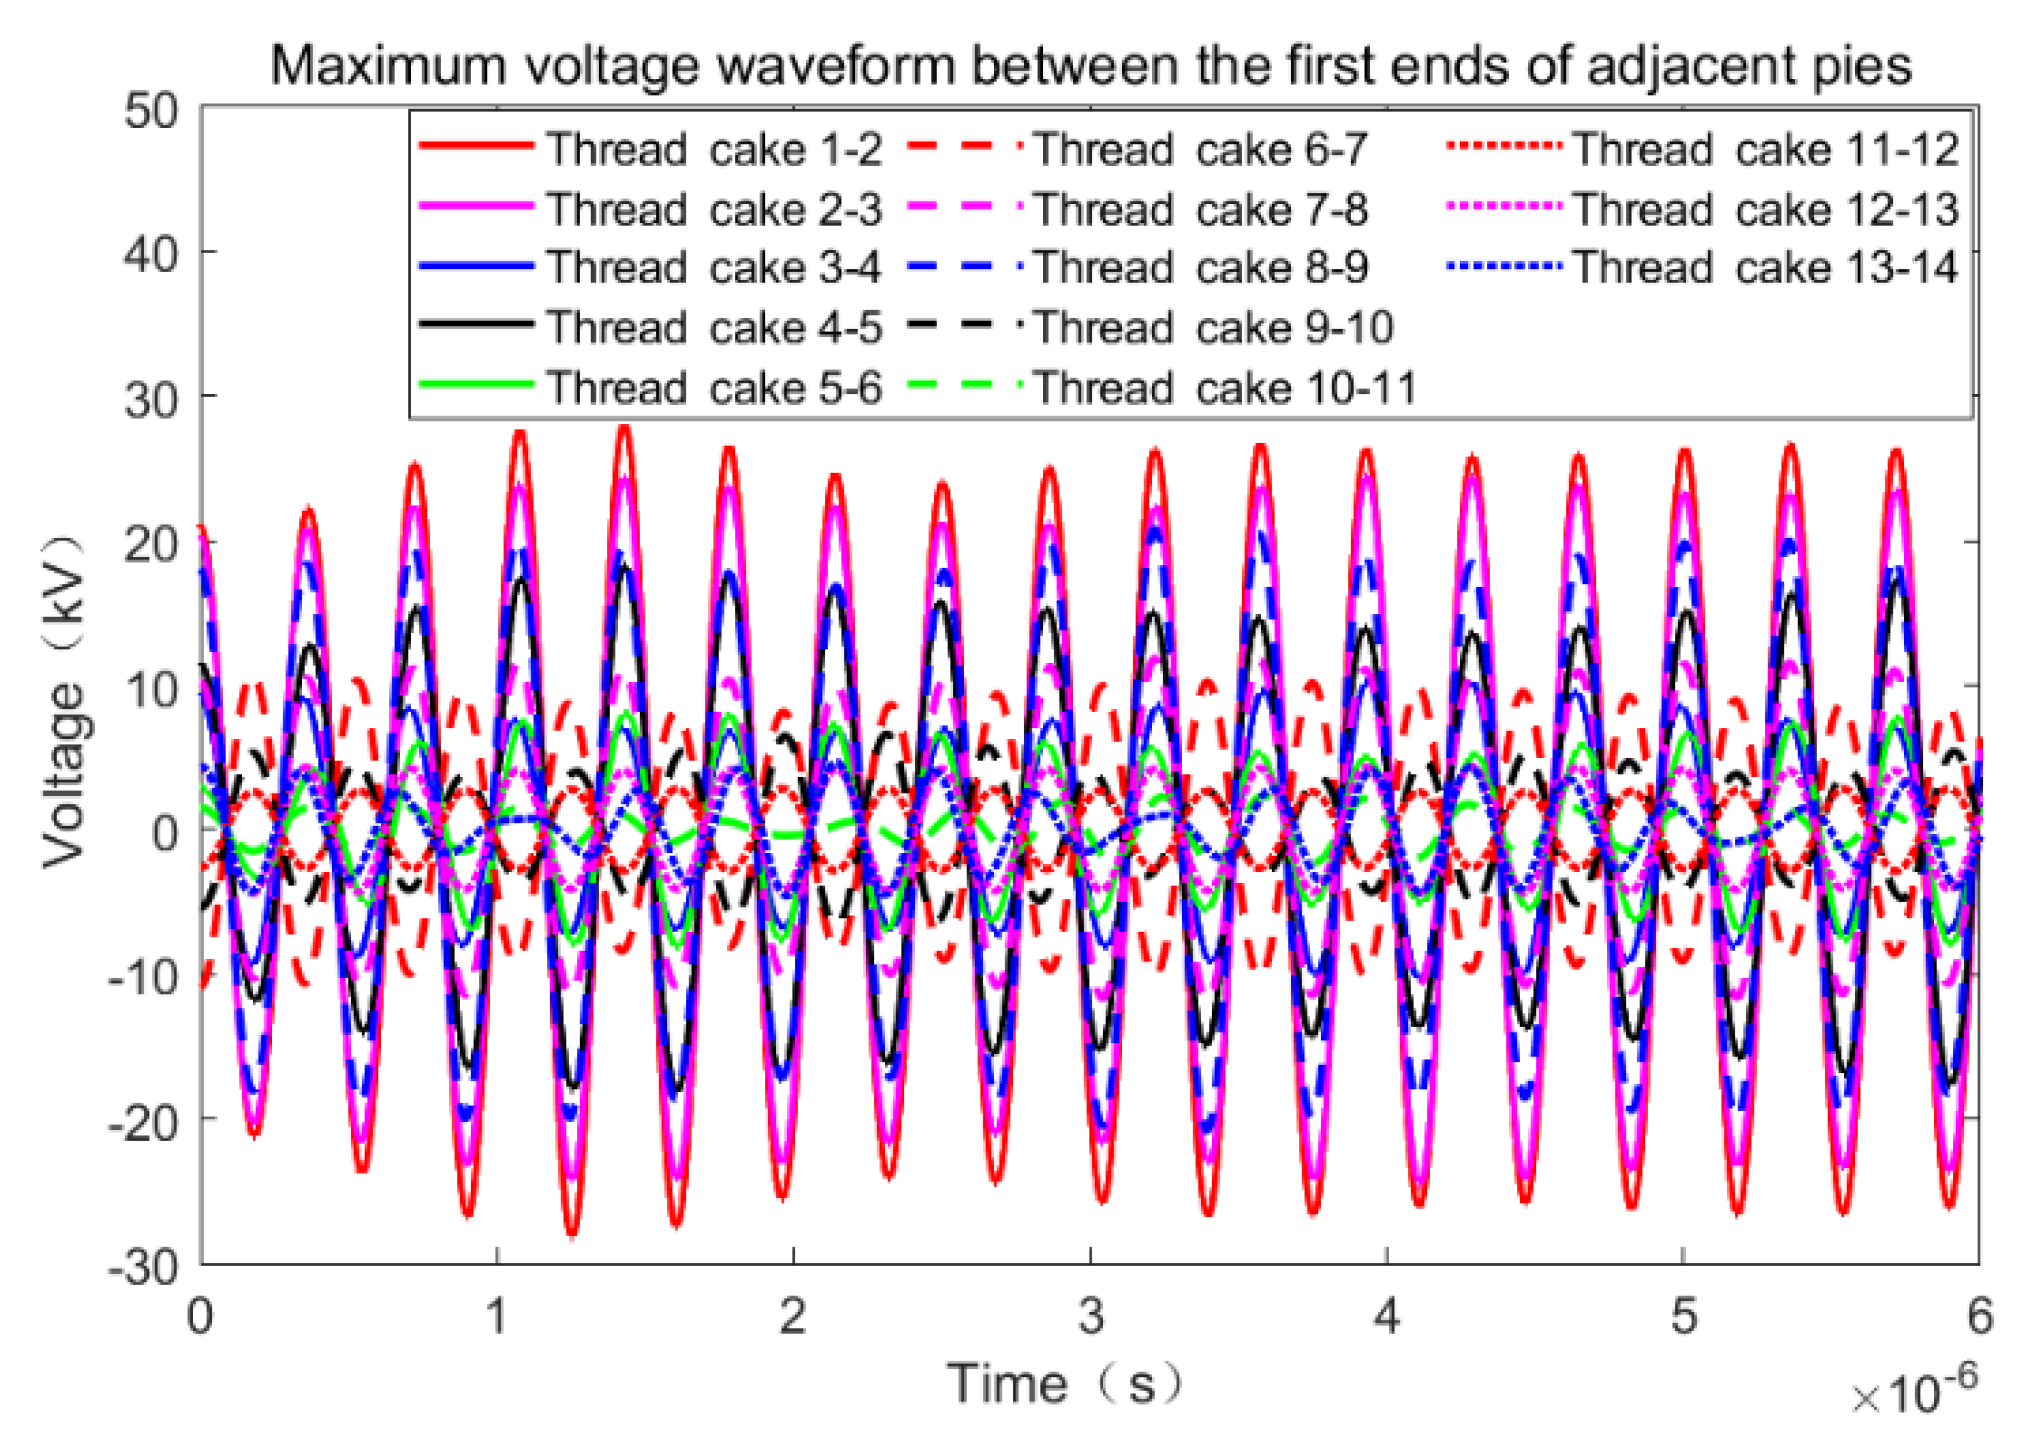
The maximum inter-pancake voltage under extra-fast transient overvoltage is located between pancake 1 and 2 with an amplitude of 32.06 kV; the maximum inter-layer voltage is located at D2-E3 of pancake 1 with an amplitude of 11.6 kV, which meets the insulation design requirements. However, as the insulation margin of the transformer decreases under long-term operation, the maximum interlayer voltage is close to the insulation breakdown voltage. The winding structure therefore needs to be optimised to make the insulation margin larger.
(3)
By optimising the winding structure, the maximum interlayer overvoltage was changed from 11.6 kV to 9.104 kV and its insulation breakdown was reduced by 24.1%.
(4)
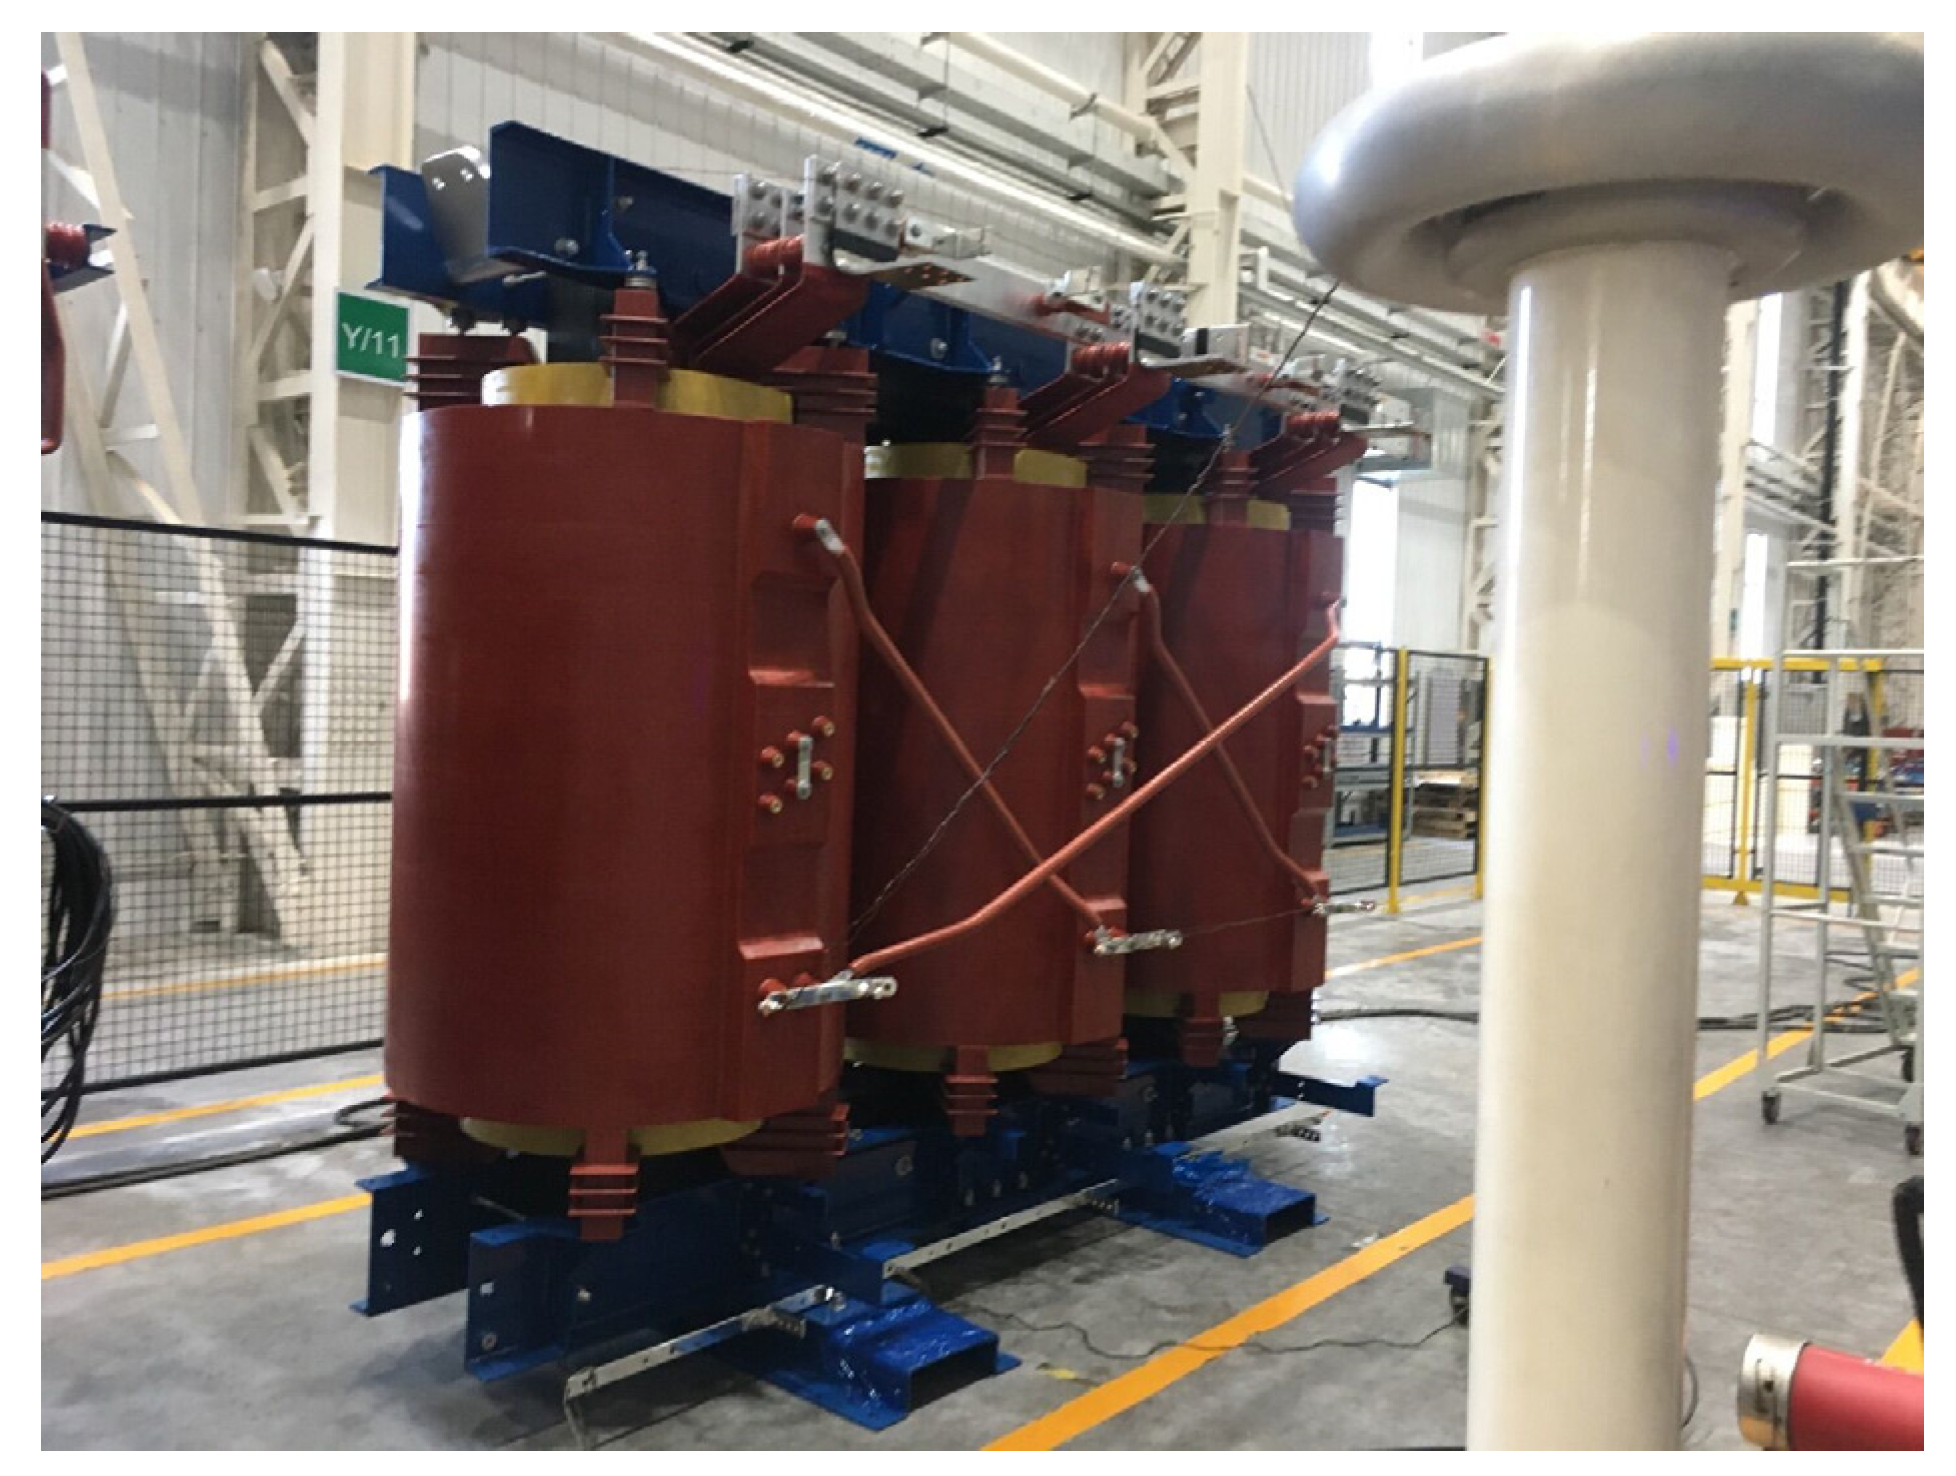
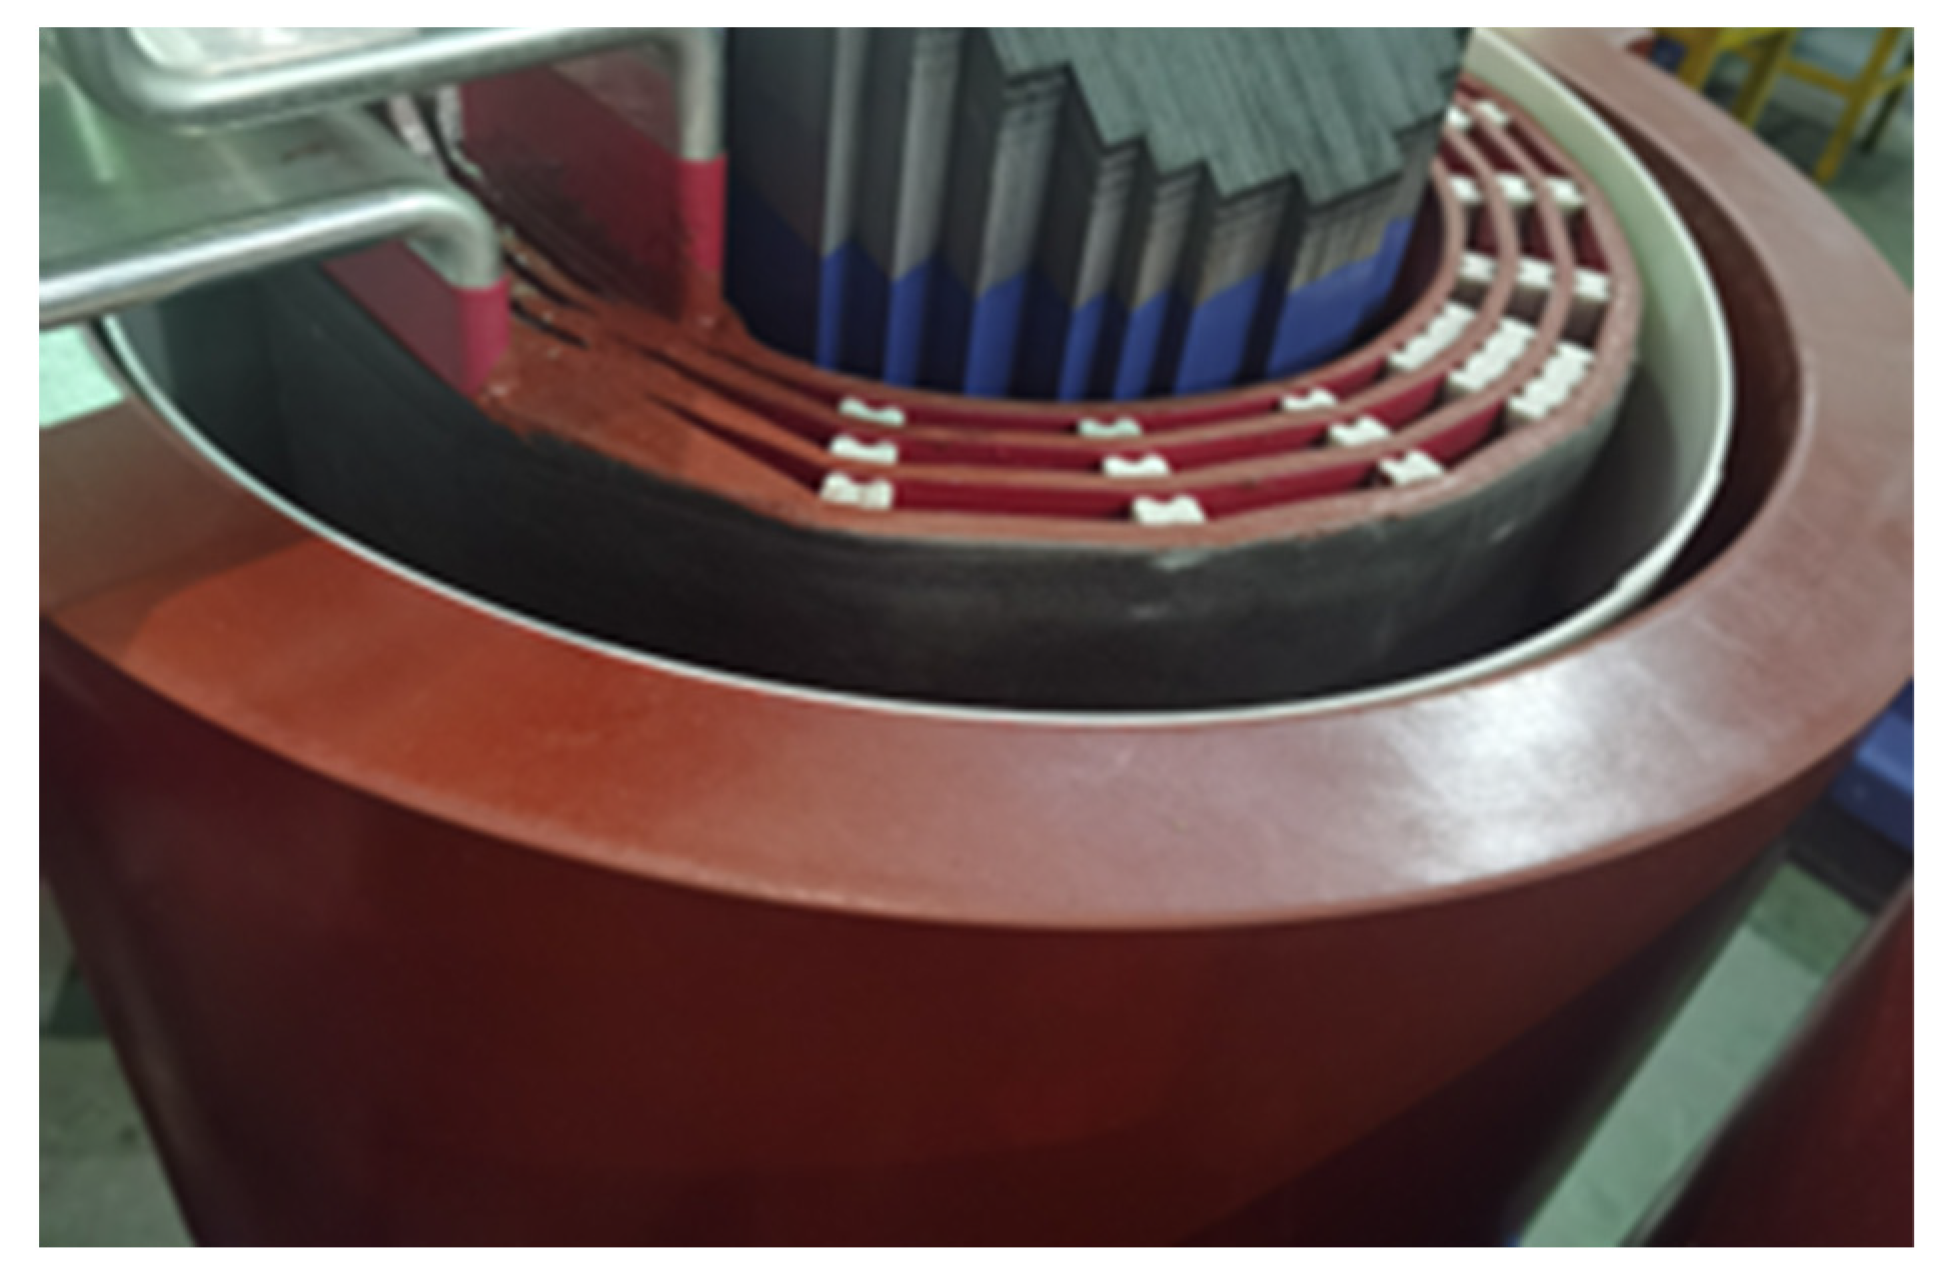
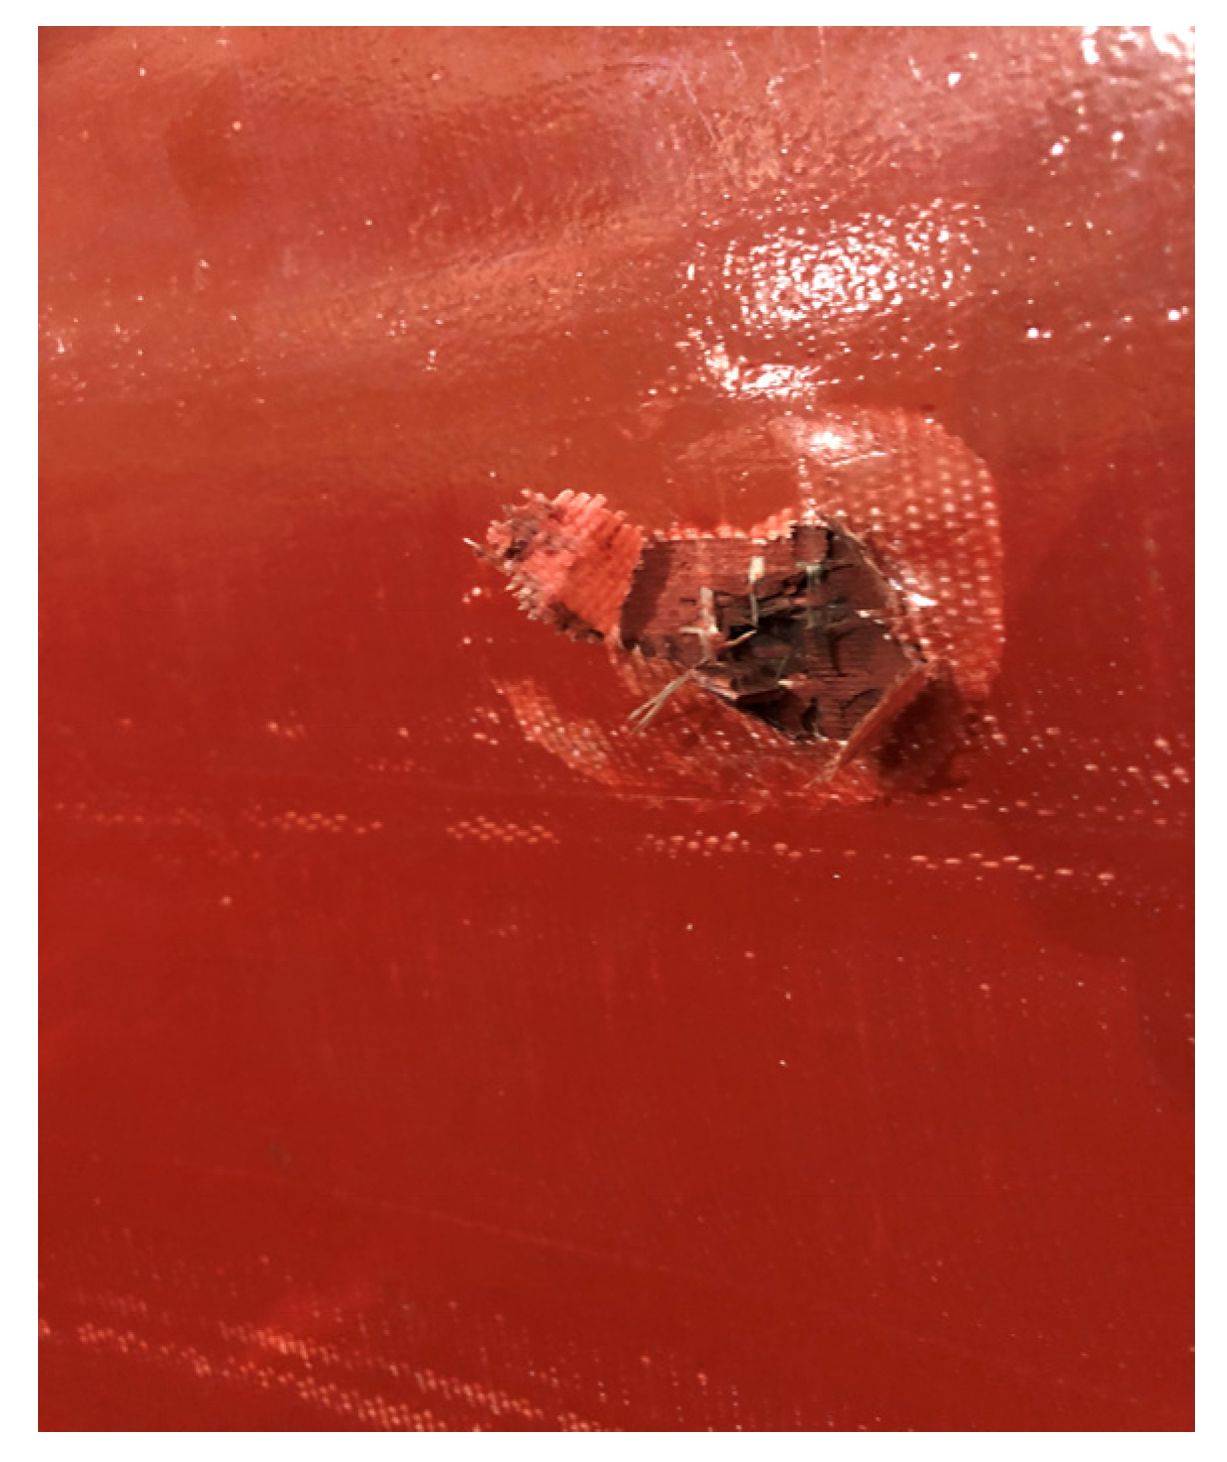
The transformer was subjected to a shock voltage test, which resulted in insulation breakdown at the first end of the high-voltage winding before structural optimisation, while the high-voltage winding after structural optimisation was left intact. This experiment demonstrates the accuracy of the simulation results.

Author Contributions

This article is the result of the collaboration of all co-authors. Writing—review and editing, Z.P.; writing—original draft preparation, X.Y.; resources, Y.W.; software, H.L.; validation, Z.F. All authors have read and agreed to the published version of the manuscript.

Funding

This research received no external funding.

Institutional Review Board Statement

Not applicable.

Informed Consent Statement

Not applicable.

Data Availability Statement

Not applicable.

Conflicts of Interest

The authors declare no conflict of interest.

References

  1. Theocharis, A.; Popov, M.; Seibold, R.; Voss, S.; Eiselt, M. Analysis of Switching Effects of Vacuum Circuit Breaker on Dry-Type Foil-Winding Transformers Validated by Experiments. IEEE Trans. Power Deliv. 2014, 30, 351–359. [Google Scholar] [CrossRef]
  2. Zhou, Q.; Cheng, Y.; Bian, X.; Liu, F.; Zhao, Y. Analysis of Restrike Overvoltage of Circuit Breakers in Offshore Wind Farms. IEEE Trans. Appl. Supercond. 2016, 26, 1–5. [Google Scholar] [CrossRef]
  3. Sarajčev, P.; Goić, R. A Review of Current Issues in State-of-Art of Wind Farm Overvoltage Protection. Energies 2011, 4, 644–668. [Google Scholar] [CrossRef] [Green Version]
  4. Nie, H.; Liu, X.; Wang, Y.; Yao, Y.; Gu, Z.; Zhang, C. Breaking Overvoltage of Dry-Type Air-Core Shunt Reactors and its Cumulative Effect on the Interturn Insulation. IEEE Access 2019, 7, 55707–55720. [Google Scholar] [CrossRef]
  5. Zang, Y. Research on Wave Process and Winding Model of Extra-High Voltage Power Transformer. Master’s Thesis, Shandong University, Jinan, China, 2017. [Google Scholar]
  6. Chen, L. Hollow Reactor Wave Process Calculation and Result Analysis. Master’s Thesis, Harbin Institute of Technology, Harbin, China, 2020. [Google Scholar]
  7. Yang, Y.; Wang, Z. Frequency domain segmentation modeling of large power transformer coils for ultra-fast transient simulation. Chin. J. Electr. Eng. 2010, 30, 66–71. [Google Scholar]
  8. Chen, Z.; Zhang, K.; Ou, F. Modeling of transformer winding concentration parameters under the action of VFTO. Transformer 2013, 50, 10–15. [Google Scholar]
  9. Chen, M. Optimum Design of Multi-band Transformer with Multi-section for Two Arbitrary Complex Frequency-dependent Impedances. Chin. J. Electron. 2012, 21, 160–164. [Google Scholar]
  10. Xie, Q.; Li, J.; Wang, T. Study on the wave process of 800 kV converter transformer scaling model. Transformer 2016, 53, 12–16. [Google Scholar]
  11. Zupan, T.; Trkulja, B.; Obrist, R.; Franz, T.; Cranganu-Cretu, B.; Smajic, J. Transformer Windings’ RLC Parameters Calculation and Lightning Impulse Voltage Distribution Simulation. IEEE Trans. Magn. 2015, 52, 1–4. [Google Scholar] [CrossRef]
  12. Mi, Y.; Liu, L.; Deng, S.; Gui, L.; Ouyang, W. Electrothermal aging characteristics of epoxy resin under bipolar exponential decay pulse voltage and its insulation life evaluation based on Cole-Cole model. IEEE Trans. Dielectr. Electr. Insul. 2019, 26, 784–791. [Google Scholar] [CrossRef]
  13. Xin, Y.; Zhao, B.; Liang, Q.; Zhou, J.; Qian, T.; Yu, Z.; Tang, W. Development of Improved Suppression Measures Against Reignition Overvoltages Caused by Vacuum Circuit Breakers in Offshore Wind Farms. IEEE Trans. Power Deliv. 2021, 37, 517–527. [Google Scholar] [CrossRef]
  14. Awad, E.A.; Badran, E.A.; Youssef, F.M. Mitigation of temporary overvoltages in weak grids connected to DFIG-based wind farms. J. Electr. Syst. 2014, 10, 431–444. [Google Scholar]
  15. Smugala, D.; Piasecki, W.; Ostrogorska, M.; Florkowski, M.; Fulczyk, M.; Granhaug, O. Wind Turbine Transformers Protection Method Against High-Frequency Transients. IEEE Trans. Power Deliv. 2015, 30, 853–860. [Google Scholar] [CrossRef]
  16. Gabrić, P.; Mikulecky, A.; Ilić, D. A concept for experimental testing of oil-barrier insulation system. Teh. Vjesn.-Tech. Gaz. 2017, 24, 355–362. [Google Scholar] [CrossRef] [Green Version]
  17. Wang, W.; Liu, Y.; He, J.; Ma, D.; Hu, L.; Yu, S.; Li, S.; Liu, J. An Improved Design Procedure for a 10 kHz, 10 kW Medium-Frequency Transformer Considering Insulation Breakdown Strength and Structure Optimization. IEEE J. Emerg. Sel. Top. Power Electron. 2022, 10, 3525–3540. [Google Scholar] [CrossRef]
  18. Li, P. Study on the Distribution of Lightning Shock and VFTO on Transformer Windings. Master’s Thesis, Taiyuan University of Technology, Taiyuan, China, 2017. [Google Scholar]
  19. Wu, M. Power Transformer Winding Wave Process and Optimization of Winding Longitudinal Insulation Structure. Master’s Thesis, Southeast University, Nanjing, China, 2016. [Google Scholar]
Figure 1. MTL model of transformer.
Energies 16 02012 g001
Figure 2. Two-dimensional axisymmetric simulation diagram.
Energies 16 02012 g002
Figure 3. The sequential structure of the first cake.
Energies 16 02012 g003
Figure 4. The self-capacitance of each turn in cake 1.
Energies 16 02012 g004
Figure 5. The mutual capacitance between turn 1 and each turn in cake 1.
Energies 16 02012 g005
Figure 6. Self-inductance of each turn in cake 1.
Energies 16 02012 g006
Figure 7. The mutual inductance of coil 1 and other coils in cake 1.
Energies 16 02012 g007
Figure 8. Self-resistance of each turn in cake 1.
Energies 16 02012 g008
Figure 9. The voltage difference between winding cakes.
Energies 16 02012 g009
Figure 10. Label diagram of node numbers.
Energies 16 02012 g010
Figure 11. Maximum voltage difference between layers of cake 1.
Energies 16 02012 g011
Figure 12. Maximum voltage difference between layers of cake 2.
Energies 16 02012 g012
Figure 13. The voltage waveforms at the first end of each cake.
Energies 16 02012 g013
Figure 14. The voltage difference between winding cakes.
Energies 16 02012 g014
Figure 15. Maximum voltage difference between layers of cake 1.
Energies 16 02012 g015
Figure 16. Maximum voltage difference between layers of cake 2.
Energies 16 02012 g016
Figure 17. The maximum voltage difference between turns of the first two cakes.
Energies 16 02012 g017
Figure 18. The voltage waveforms at the head end of each cake.
Energies 16 02012 g018
Figure 19. The voltage difference between winding cakes.
Energies 16 02012 g019
Figure 20. Label diagram of node numbers.
Energies 16 02012 g020
Figure 21. Maximum voltage difference between layers of cake 1.
Energies 16 02012 g021
Figure 22. Maximum voltage difference between layers of cake 2.
Energies 16 02012 g022
Figure 23. The maximum voltage difference between turns of the first three cakes.
Energies 16 02012 g023
Figure 24. Actual arrangement of transformer voltage test.
Energies 16 02012 g024
Figure 25. Schematic diagram of actual winding of transformer coils.
Energies 16 02012 g025
Figure 26. Winding breakdown after voltage test of transformer with unoptimised winding structure.
Energies 16 02012 g026
Table 1. Material parameters.
Electrical Conductivity (20 °C) (S/m)Relative PermeabilityRelative Dielectric ConstantMaterials
Conductors3.45 × 10711Aluminium
Insulation013.6Epoxy resin
Iron cores2 × 1064 × 1031Silicon steel
Air011-
Table 2. Parameter table for test transformers.
ParameterData
Frequency (Hz)50
HV rated power (kVA) (AF)4778
HV rated voltage (V)33,000
HV rated current (A)83
HV BIL (KV)170
HV AC (KV) (1500 m)70
MV rated power (kVA) (AF)4157
MV rated voltage (V)6000
MV rated current (A)400
MV BIL (KV)60
MV AC (KV) (1500m)20
LV rated power (kVA) (AF)838
LV rated voltage (V)690
LV rated current (A)701
LV BIL (KV)-
LV AC (KV) (1500 m)3
HV-MV impedance (based on 4779 kVA) (%)8.5 ± 10
HV-LV impedance (based on 4779 kVA) (%)14.6 ± 10
MV-LV impedance (based on 4779 kVA ) (%)3~6
Sound power level<95 dBA
Efficiency (PEl)(%)≥99.354
Insulation class/temperature riseF/75K
Table 3. Comparison of maximum voltage difference and position before and after optimisation of winding structure.
Winding ConstructionWhen the First Pie Is 75 TurnsWhen the First Pie Is 43 Turns
Inter-segment (max. voltage)32.06 kV28.3 kV
PositionBetween the first and second pieBetween the first and second pie
Interlayer (max. voltage)11.6 kV9.104 kV
PositionBetween D2 and E3Between D2 and E3
Inter-turn (max. voltage)6.653 kV3.389 kV
PositionBetween turns 5 and 6Between turns 3 and 4
Disclaimer/Publisher’s Note: The statements, opinions and data contained in all publications are solely those of the individual author(s) and contributor(s) and not of MDPI and/or the editor(s). MDPI and/or the editor(s) disclaim responsibility for any injury to people or property resulting from any ideas, methods, instructions or products referred to in the content.

