Article

Anode Nitrogen Concentration Estimation Based on Voltage Variation Characteristics for Proton Exchange Membrane Fuel Cell Stacks

1
School of Mechanical Engineering, University of Science and Technology Beijing, Beijing 100083, China
2
State Key Laboratory of Automotive Safety and Energy, School of Vehicle and Mobility, Tsinghua University, Beijing 100084, China
*
Authors to whom correspondence should be addressed.
Energies 2023, 16(5), 2111; https://doi.org/10.3390/en16052111
Submission received: 15 January 2023 / Revised: 15 February 2023 / Accepted: 20 February 2023 / Published: 22 February 2023
(This article belongs to the Special Issue Design, Testing and Fault Diagnosis for Fuel Cells)

Abstract

:
Hydrogen energy has become an important way to solve energy crises owing to its non-pollution, high level of efficiency, and wide application. Proton exchange membrane fuel cells (PEMFCs) have received wide attention as an energy conversion device for hydrogen energy. The hydrogen concentration in the PEMFC anode directly determines the output voltage of the stack. The performance of the PEMFC gradually decreases due to the accumulation of nitrogen. However, the continuous circulation of anode gas and the nitrogen accumulation at the anode due to transmembrane diffusion lead to difficulties in estimating the anode gas concentration. The relationship between anode nitrogen concentration and voltage variation characteristics was studied by increasing the anode hydrogen concentration through the method of increasing nitrogen concentration and conducting experiments on a 16-cell stack. In this paper, an estimation method for nitrogen concentration in the anode is proposed to evaluate the nitrogen concentration in the anode on the basis of voltage variation characteristics, and the method was recalibrated and validated using experimental data. Due to the inhomogeneity of the gas distribution within the PEMFC stack, the mean cell voltage can provide a more accurate estimation of the anode nitrogen concentration compared to a single cell voltage. It is shown that the proposed approach can offer a new method to estimate anode nitrogen concentration. Compared with the conventional method, the new method is simpler as it does not require additional equipment or complex algorithms. In this paper, the anode nitrogen concentration was estimated by applying this method with a maximum error of only 0.35%.

1. Introduction

Traditional fossil energy resources are non-renewable, which ultimately results in a global energy crisis. To mitigate the pressure of climate change and reduce the carbon footprint, people are looking for new energy technologies that are more sustainable, environmentally friendly, and adaptable to future needs [1]. Hydrogen is a promising fuel of the future [2], does not emit any harmful gases [3], and is widely available [4]. Fuel cells are also receiving a lot of attention as a way to utilize hydrogen energy.
PEMFCs are electrochemical devices capable of generating electricity through chemical reactions between hydrogen and oxygen [5]. Due to their advantages of high power density, high efficiency, low working temperature [6], and low emissions [7], PEMFCs are considered a potential alternative power source in the development of new energy for automobiles [8] and have received extensive attention and research [9]. However, fuel cells still have the problems of low hydrogen utilization efficiency [10], high system cost [11], and poor durability [12]. In dead-end mode operation and recirculation mode, the outlet of the anode is closed by a normally closed valve, which enables better utilization of the fuel, improves hydrogen utilization, and reduces system cost [13,14].
Machine learning has important implications for the study of complex systems such as PEMFC [15]. Wang et al. [16] introduced machine-learning-assisted MNM as a proxy model, and this significantly reduced the cost of obtaining the optimal combination of parameters. The multivariate optimization of the proposed model resulted in a 49.5% reduction in the N2 gas crossover coefficient and a 20% increase in power density. Legala et al. [17] proposed a data-based PEMFC model using a machine-learning approach. Mao et al. [18] constructed a neural network agent model and proposed a genetic optimization algorithm. The fuel cell voltage improved by 1.45% over the power enhancement period without operational optimization.
The nitrogen permeability varies at different working conditions and fuel cell degradation varies at different working conditions [19]. Nitrogen crossover occurs through a diffusion mechanism [20], in which the nitrogen concentration on the cathode side is higher than the nitrogen concentration on the anode side. As a result, nitrogen dissolves in the membrane on the cathode side and permeates out of the anode side. Gas crossover decreases with increasing membrane thickness [21], but leads to lower proton conductivity, increasing the ohmic loss, and thus reducing performance [22]. Although gas permeation can be reduced by fabricating composite membranes by dip-coating, spin-coating, or layer-by-layer (LBL) coating [23], 18 to 50 μm membranes are now widely used in membrane surface fuel cells to improve efficiency and allow high current density operation [24], making nitrogen permeation problems unavoidable. Anode nitrogen concentration can have a significant impact on PEMFC stack performance and voltage consistency [25]. Nitrogen accumulates at the anode due to nitrogen crossover in the dead-end and recirculation modes, which leads to nonlinear, time-lagged, and parametric uncertainty in the variation of nitrogen concentration [26]. The accumulation of nitrogen will result in a decreasing hydrogen concentration, which affects the voltage at the output of the system [27]. Therefore, the real-time acquisition of anode nitrogen concentration is important. Traditional methods, such as measuring gas pressure using sensors, are not suitable for automotive fuel cell systems due to their disadvantages of being expensive and not being easy to install [28]. In addition, the analysis of gas concentration using a mass spectrometer is not available in real-time [29]. Due to the limitations of traditional methods, current research has focused on obtaining nitrogen concentration in the anode by estimation algorithms [30].
There are a variety of different approaches to the process of nitrogen permeation in fuel cells. Kyung et al. [31] obtained the practice of nitrogen concentration accumulation under different electric density operating conditions from experimental data, used the integration of electric density to estimate the nitrogen concentration, and then decided the opening of the nitrogen discharge valve. Ziogou et al. [32] modeled nitrogen diffusion by considering permeation and convection in the nitrogen mass transfer process and using the temporal and spatial boundary conditions to find the numerical solution. However, this method is complicated and computationally intensive, and the model parameters are too many and difficult to identify.
In recent years, scholars have worked on model-based nitrogen concentration observers for fuel cell systems. Liu et al. [33] proposed an online anode nitrogen observer and verified the validity of the observer, which can improve hydrogen utilization to 99.2%. However, the proposed scheme does not consider the presence of anode water vapor. Piffard et al. [34] used a model observer for estimating gas permeation and validated the simulation using vehicle test cycle conditions. The sliding mode observer shows good convergence and allows adjusting the nitrogen concentration to less than a certain level (5%). Wu et al. [35] estimated the nitrogen concentration in the anode based on the neural network method. Results indicate that this estimation method has high accuracy, and the average absolute error is less than 0.8%.
The purpose of this study is to propose a method for estimating nitrogen concentration in fuel cell anodes based on voltage variation characteristics. Firstly, the experimental data are screened and processed by experimentally measuring the stack voltage at different current densities and nitrogen concentrations. Then the nitrogen molar fraction is deduced as a function of the operating current density and nitrogen concentration. Finally, this function is used to calculate the nitrogen concentration in the anode. This article proposes an easy way to achieve estimation of nitrogen concentration in anodes by experimental and data-processing methods without adding additional equipment or using complex algorithms and provides a basis for a purging strategy for fuel cell anodes. This method is applied in this paper to estimate the anode nitrogen concentration by using the voltage variation characteristics with a maximum error of only 0.35%.

2. Experimental and Method

2.1. Fuel Cell Stack and Fuel Cell Test System

Nitrogen accumulation in the anode is unavoidable because nitrogen cannot be exhausted. The purpose of this research was to examine an approach to evaluating the nitrogen concentration in the PEMFC anode according to the decrease in fuel cell performance when the hydrogen concentration decreases. The effect of different nitrogen concentrations on fuel cell performance was researched by doping the anode to gradually reduce the hydrogen concentration. In this experiment, a 16-cell fuel cell stack with a power of 5 kW was used. The experimental setup includes a fuel cell stack, a gas management system, a temperature management system, an electronic load, and a data monitoring system, as shown in Figure 1. The supply of anode gas for this test bench uses hydrogen and nitrogen cylinders for the gas supply. Before the hydrogen and nitrogen enter the stack, the hydrogen and nitrogen flow rates are precisely controlled by flow controllers, which can control the flow rate from 1.25 to 250 SLPM. A humidifier is connected to the outlet of the flow controller to control the anode humidity, and an anode outlet backpressure valve controls the anode outlet pressure. Temperature and pressure sensors are connected between the humidifier and the anode inlet, as well as between the anode outlet and the anode outlet backpressure valve, to monitor inlet and outlet temperature and pressure. For cathode, the flow rate was controlled by a mass flow controller ranging from 3.75–750 SLPM. After that, the air passes through the humidifier, the cathode inlet temperature and pressure sensor, the cathode, the cathode outlet temperature and pressure sensors, and the cathode outlet backpressure valve. The temperature management system consists of a coolant pump and radiator to control the stack temperature. The signals from the mass flow controller, pressure sensor, temperature sensor, and stack current and voltage are collected by the data monitoring system and processed in the Labview software. The operating parameters and stack parameters of the experiment are listed in Table 1.

2.2. Experimental Procedure

The experimental procedure is shown in Figure 2a. First, the basic parameters of the experiment are determined. During the operation, the cathode and anode excess ratios, inlet pressure, humidifier temperature, and coolant inlet temperature are constants. Then, the nitrogen concentration was gradually increased from 0% to 20% by gradually increasing the nitrogen concentration. Meanwhile, the voltage of each cell was measured. Lastly, the current density of the stack is modified, and the above steps are repeated to measure the voltage drop with nitrogen concentration for different current densities.
The data processing process is shown in Figure 2b. First, the data were selected to obtain the stack voltage values at different anode nitrogen concentrations. Then, a suitable method is used to fit the data to obtain the relationship between voltage and nitrogen concentration. Finally, the anode nitrogen concentration is estimated based on the relationship between the stack voltage and the anode nitrogen concentration.

2.3. Data Fitting Method and Error Analysis

The currently used methods for nitrogen concentration estimation require the use of additional devices, which require the use of complex computational methods. In this paper, we compare different fitting methods and select the most suitable one from them by comparing the fitting errors of the different methods. By using a quadratic polynomial fit, it is found that it has a good fitting effect, so this method is chosen to fit the relationship between voltage variation characteristics and nitrogen concentration. The method’s fitting effectiveness was assessed by comparing the error between the fitted and actual values at nitrogen concentration using various methods.

3. Results and Discussion

3.1. Effect of Nitrogen Concentration on the Mean Voltage of the Stack

Figure 3a–d give the variation of voltage with hydrogen concentration for fuel cells at different current densities. It is clear that when the fuel and nitrogen are mixed, the hydrogen concentration decreases and the voltage of the stack decreases. The voltage drops are not the same for fuel cells at different current densities. With a current density of 0.2 A·cm−2 and a 20% reduction in hydrogen concentration, the voltage drops by only 0.8%. With a current density of 1.4 A·cm−2 and a 20% reduction in hydrogen concentration, the voltage decay rate is only 3.4%. It can be seen that the influence of increasing nitrogen concentration on fuel cell voltage varies at different current densities. Thus, the characteristics of fuel cell voltage variation at different current densities need to be considered.
The curves are plotted for 0.2, 0.6, 1.0, and 1.4 A·cm−2 current densities with the mean cell voltage as the horizontal coordinate and the nitrogen concentration of doping as the vertical coordinate, and then the curves are fitted using the fourth-order polynomial fitting method. Figure 4a–d give the results of the polynomial fit for the fuel cell at different current densities. In these four cases, the lowest correlation coefficient R2 is 0.9645, which means that the fitting results meet the basic requirements and the fitted values fit the experimental data well. The concentration of anode nitrogen can be estimated by fitting the equation using the current density and voltage.
The absolute residual is the absolute value of the error between the predicted and observed values, which is one of the important indicators to evaluate the fitting effect. It can be calculated using Equation (1)
ΔUi =│UEUF│, i = 0, 4%, 8%, 12%, 16%, 20%
where ΔU is the absolute residual, UE is the average voltage measurement at different nitrogen concentrations, and UF is the average voltage fitting value at different nitrogen concentrations.
The absolute residuals of the fuel cell at different current densities are given in Figure 5a–d. It shows that when the current density is 0.4, 0.6, or 1.0 A·cm−2, the absolute residuals of the voltages are maintained at the same level. And when the current density is 0.2 A·cm−2, the absolute residuals of the voltage are significantly larger. This may be due to the small voltage drop of 7 mV at a current density of 0.2 A·cm−2, which causes unsatisfactory fitting results. In the other three cases, the voltage drop exceeds 15 mV, and thus no situation of excessive absolute residuals occurs.

3.2. Effect of Nitrogen Concentration on the Voltage of a Specific Single Cell

The performance of fuel cell stack deteriorates with decreasing hydrogen concentration. However, the voltage of each cell does not degrade in parallel, owing mainly to the non-uniformity of the gas distribution. The sensitivity of different fuel cells to the decrease in hydrogen concentration varies. The cell 11 with the lowest average voltage and the cell 4 with the highest average voltage were selected for analysis to determine if they could be used in a similar way to evaluate nitrogen concentration.
The variation of the voltage of cell 11 with hydrogen concentration at different current density levels is given in Figure 6a–d. The voltage drop of fuel cells is clearly affected differently on different single cells. When the current densities are 1.0 and 1.4 A·cm−2, the voltage drop of Cell 11 is 6.8% and 9.8%, respectively. It can be seen that the effect of rising nitrogen concentration on the fuel cell performance is different at different single cells. Thus, the characteristics of the voltage variation for different single cells need to be considered.
The curves for 0.2, 0.6, 1.0, and 1.4 A·cm−2 current densities were plotted with the voltage of cell 11 as the horizontal coordinate and the doped nitrogen concentration as the vertical coordinate, and then the curves were fitted with a fourth-order polynomial fit method. Figure 7a–d give the results of the polynomial fit for the fuel cell at different current densities. In several cases, there is a rise in nitrogen concentration and a rise in voltage, which may be due to an uneven distribution of the gas, causing the nitrogen concentration in the area not to drop obviously. In these four cases, the lowest correlation coefficient R2 is 0.9331, which means that the fitting results meet the basic requirements and there is a good agreement between the fitting results and the experimental data. It can also be seen that the fit is least satisfactory at 0.2 A·cm−2 because the voltage drop is too small.
Figure 8a–d give the absolute residuals of the cell 11 voltage for fuel cells at different current densities. This can be used as a basis for evaluating the fitting effect. When the current density was 0.6 and 1.4 A·cm−2, the absolute residuals were greater than 2.5 mV in both cases, while the absolute residuals were less than 1 mV in the other two cases. This may be the effect of uneven gas distribution. Combined with Figure 7b,d, the fuel cell shows the anomaly of increasing nitrogen concentration while the single cell voltage increases or remains unchanged. This may result from the unequal distribution of anode gas, causing the nitrogen concentration in this part of the stack not to rise with the overall nitrogen concentration.
The variation of the voltage of cell 4 with hydrogen concentrations at different current density levels is given in Figure 9a–d. The voltage drop in cell 11 is 0.2% and 0.3% at current densities of 1.0 and 1.4 A·cm−2, respectively. It demonstrated that increasing nitrogen concentration had little effect on cell 11’s voltage. Once again, it is clear that rising nitrogen concentrations affect different single cells differently.
The curves for 0.2, 0.6, 1.0, and 1.4 A·cm−2 current densities were plotted with the voltage of cell 4 as the horizontal coordinate and the doped nitrogen concentration as the vertical coordinate, and then the curves were fitted with a fourth-order polynomial fit method. Figure 10a–d give the polynomial fitting results for the fuel cell at different current densities. The lowest correlation coefficient R2 is 0.9680 in these four cases, which means that the fitting results meet the basic requirements. Since the voltage drop is only 0.2% with a current density of 1.0 A·cm−2, the worst fitting effect is achieved in this case.
Figure 11a–d give the absolute residuals of the cell 4 voltage for fuel cells at different current densities. This can be used as a basis for evaluating the fitting effect. When the current density is 0.6 A·cm−2, the absolute residuals are significantly larger than in the other three cases. Combined with Figure 10b, the fuel cell shows an anomaly of increasing nitrogen concentration while the single cell voltage increases or remains unchanged. This may lead to a poor fit for the method. Combined with the anomalies in the voltages of cells 11 and 4 at certain current densities and the poor fit, it was determined that the fit of a single cell was not as good as the mean cell voltage.
The fitting results of the fuel cell are compared from different perspectives. As shown in Equations (2)–(5)
ΔUmax = max{Ui}…, i = 0, 4%, 8%, 12%, 16%, 20%
ΔUmin = min{Ui}…, i = 0, 4%, 8%, 12%, 16%, 20%
ΔUa = ∑{Ui}/Ni…, i = 0, 4%, 8%, 12%, 16%, 20%
δr = ∑{Ui/UE}/Ni…, i = 0, 4%, 8%, 12%, 16%, 20%
where ΔUmax is the maximum value of the absolute residual value, ΔUmin is the minimum value of the absolute residual value, ΔUa is the average value of the absolute residual value, and δr is the relative average value of the absolute residual value.
Fitting indices for varying cases were shown in Table 2. It is shown that the maximum residual from fitting results in various cases is only 4.699 mV, the maximum value of the average residual is only 1.386 mV, and the maximum relative average of the absolute residual is only 1.980%. And this situation occurs when cell 11 is operating, which may be due to the fact that the variation in nitrogen concentration has a greater impact on the voltage of cell 11. And in most cases, the best fitting results are obtained for the mean cell voltage. It may be due to the uneven gas distribution in a single cell, resulting in different nitrogen concentrations in different cells than in the fuel cell as a whole. As an example, the fitting result of the average cell voltage has a maximum absolute percentage error of 0.350%. This shows that the method has a high level of prediction accuracy. The proposed method was compared with other existing methods, which are presented in Table 3.

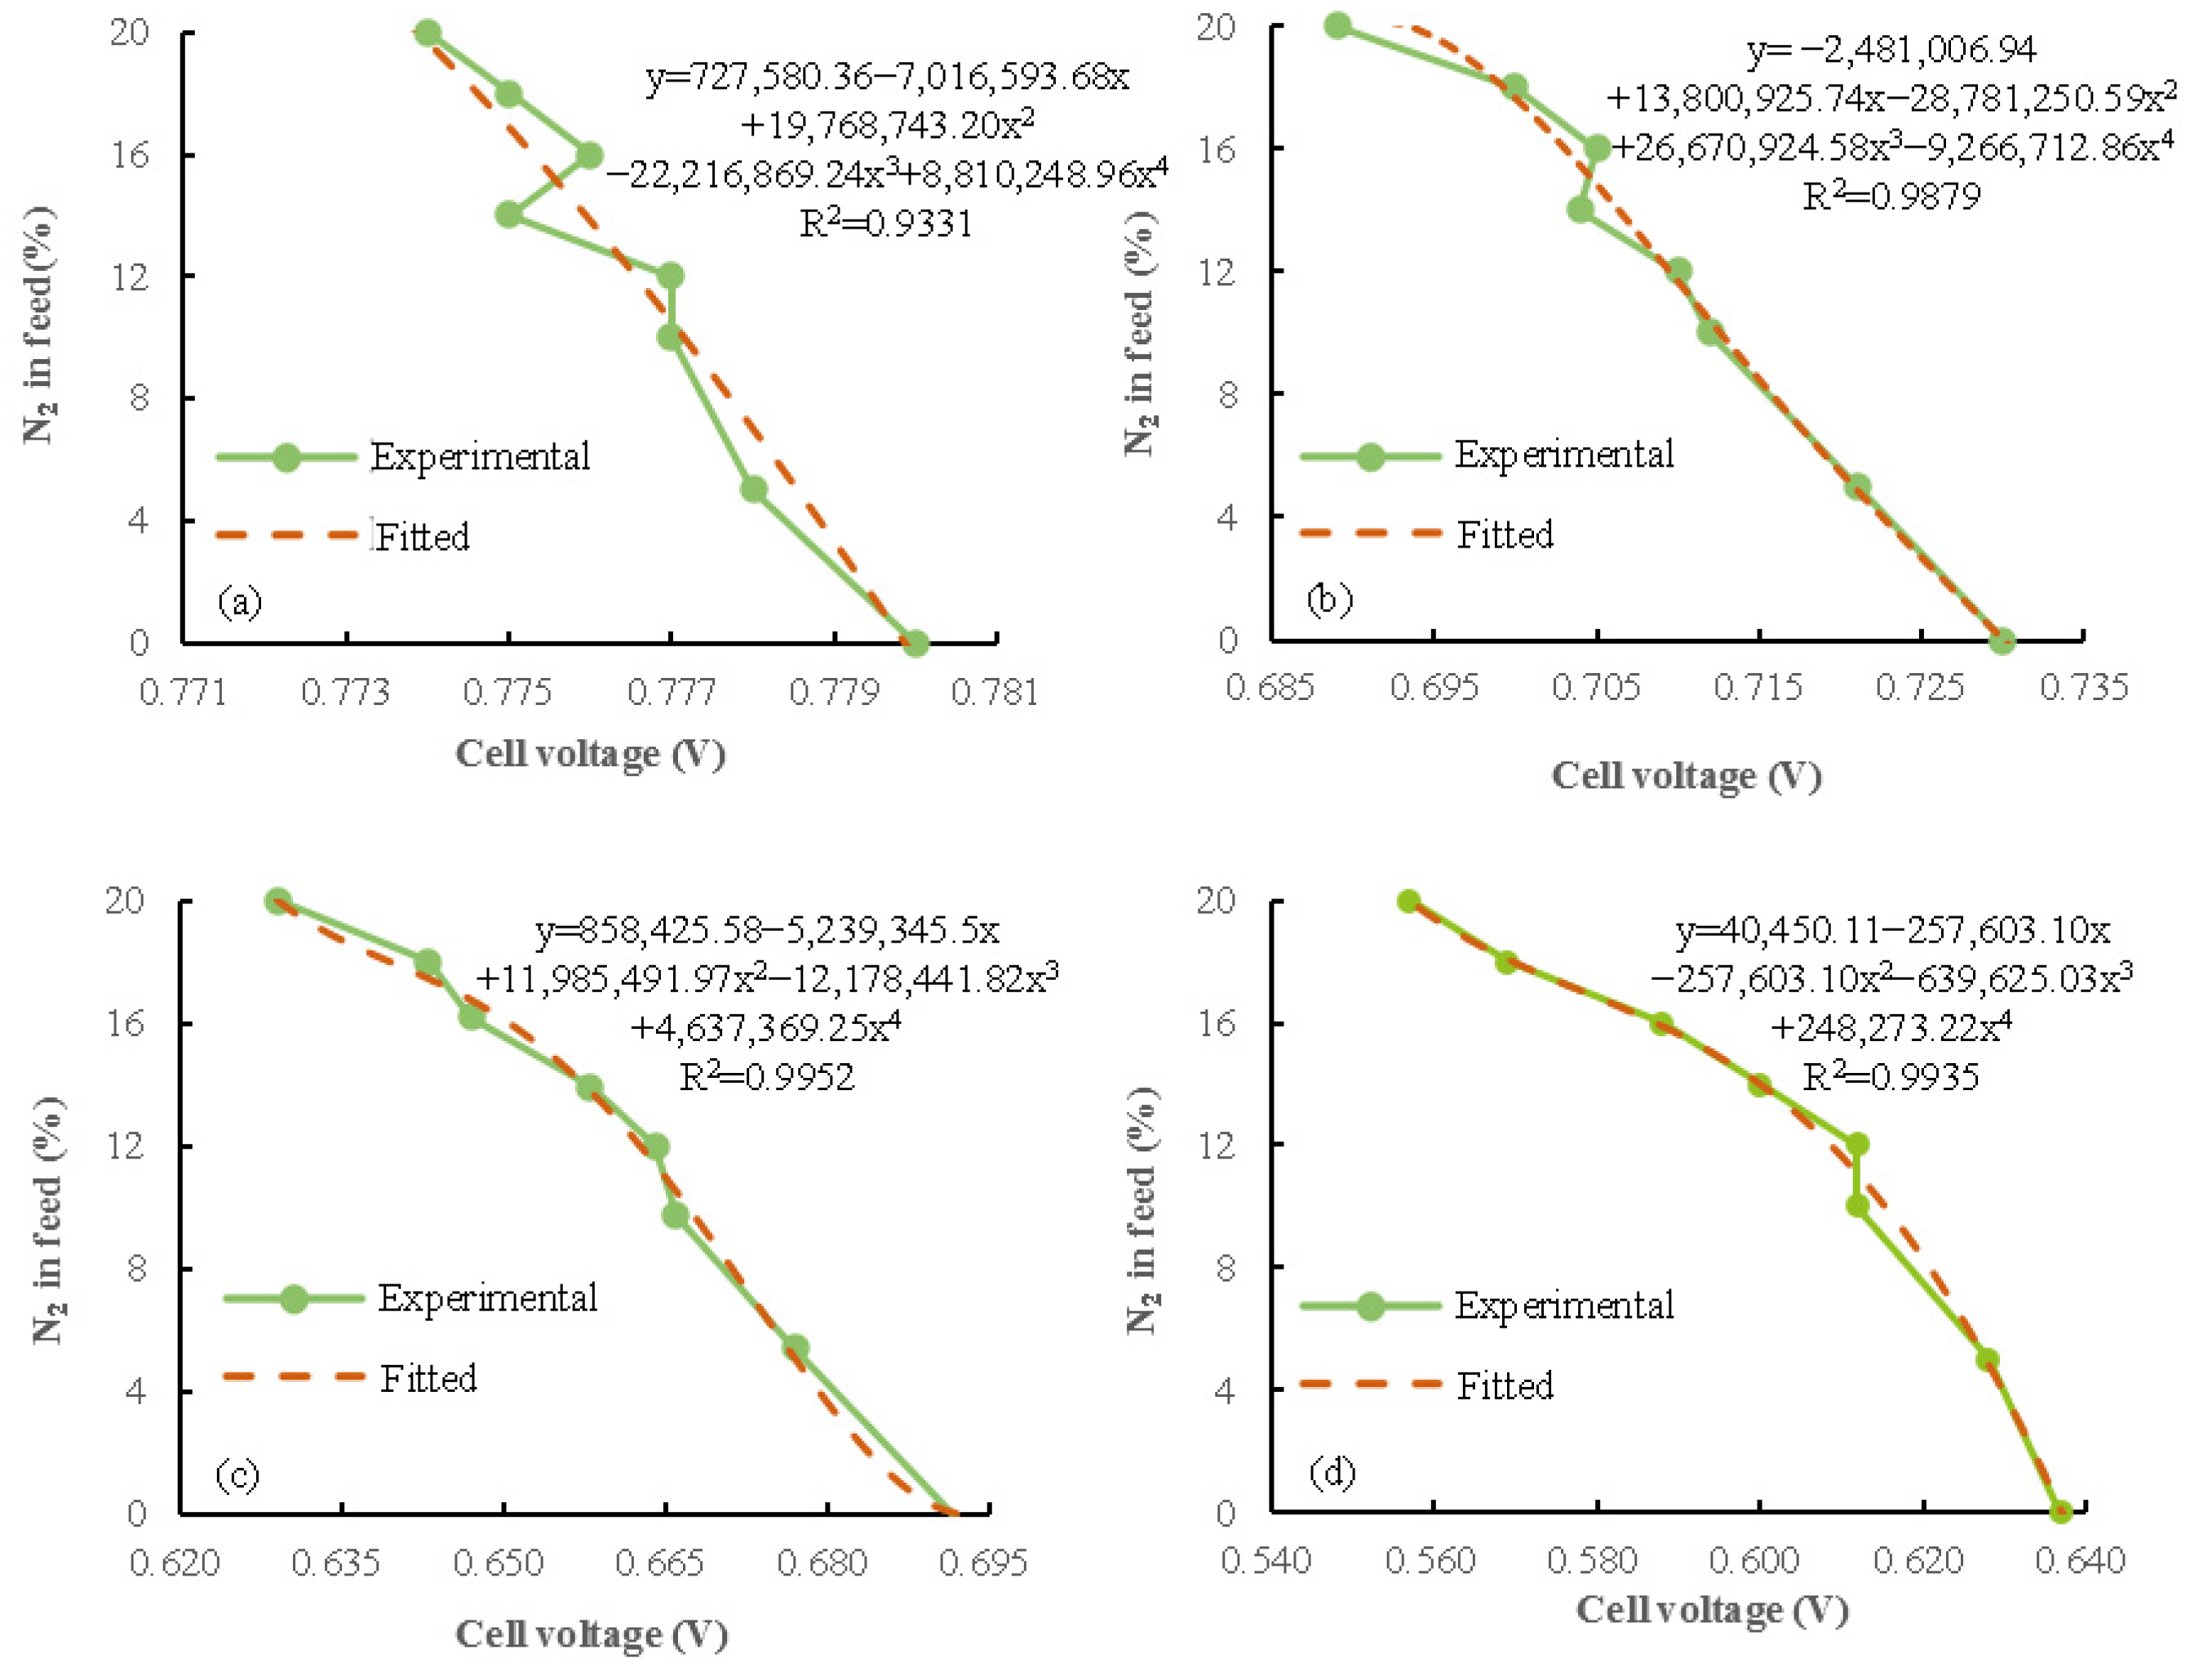
3.3. Nitrogen Concentration Prediction and Validation

Figure 12a shows the voltage variation characteristics of the fuel cell with an anode nitrogen concentration for a current density of 1.6 A·cm−2. Figure 12b–e show a quadratic polynomial fit based on data with different nitrogen concentrations to determine whether less data can be used to estimate the nitrogen concentration of the anode. It is shown that when the voltage variation characteristics at 0–17% nitrogen concentration are used for data prediction and validation, the voltage characteristics at 20% nitrogen concentration are not well predicted. As shown in Figure 12d, when the voltage variation characteristics at 0–18% nitrogen concentration are used for data prediction and validation, the voltage characteristics at 20% nitrogen concentration can be predicted better, and in this case, the correlation coefficient R2 can reach 0.9975. This indicates that the prediction of nitrogen concentration in the fuel cell anode based on the voltage variation characteristics will be better as the amount of data increases.

4. Conclusions

The influence of anode nitrogen concentration on fuel cell performance degradation is discussed. Based on this effect, a method for estimating anode nitrogen concentration in PEMFCs on the basis of voltage variation characteristics is proposed. The innovation lies in proposing an easy method to achieve the estimation of nitrogen concentration in anodes by experimental and data-processing methods without adding additional equipment or using complex algorithms, and to provide a reference for the purging strategy of the anode. The following are the main points:
  • The influence of reducing hydrogen concentration on the performance of PEMFCs at varied current densities was investigated. Although a decrease in hydrogen concentration can significantly affect the overall fuel cell performance, to what extent it affects the fuel cell performance varies for a specific cell. With a current density of 1.4 A·cm−2 and an increase in nitrogen concentration from 0 to 20%, the average stack voltage, cell 11’s voltage, and cell 4’s voltage drop are 3.4%, 9.8%, and 2.8%, respectively. This may be due to the fact that the consistency of fuel cells is influenced by various aspects, like structural layout, component materials, and manufacturing processes.
  • An estimation method of nitrogen concentration in the anodes of PEMFC is proposed on the basis of voltage variation characteristics. The nitrogen concentration of the anode could be evaluated more accurately by analyzing the decreasing pattern of fuel cell voltage, and the prediction of anode nitrogen concentration based on voltage variation characteristics becomes increasingly accurate with the increase in data amount. The maximum absolute percentage error obtained by this method is only 0.35%, which has high accuracy.
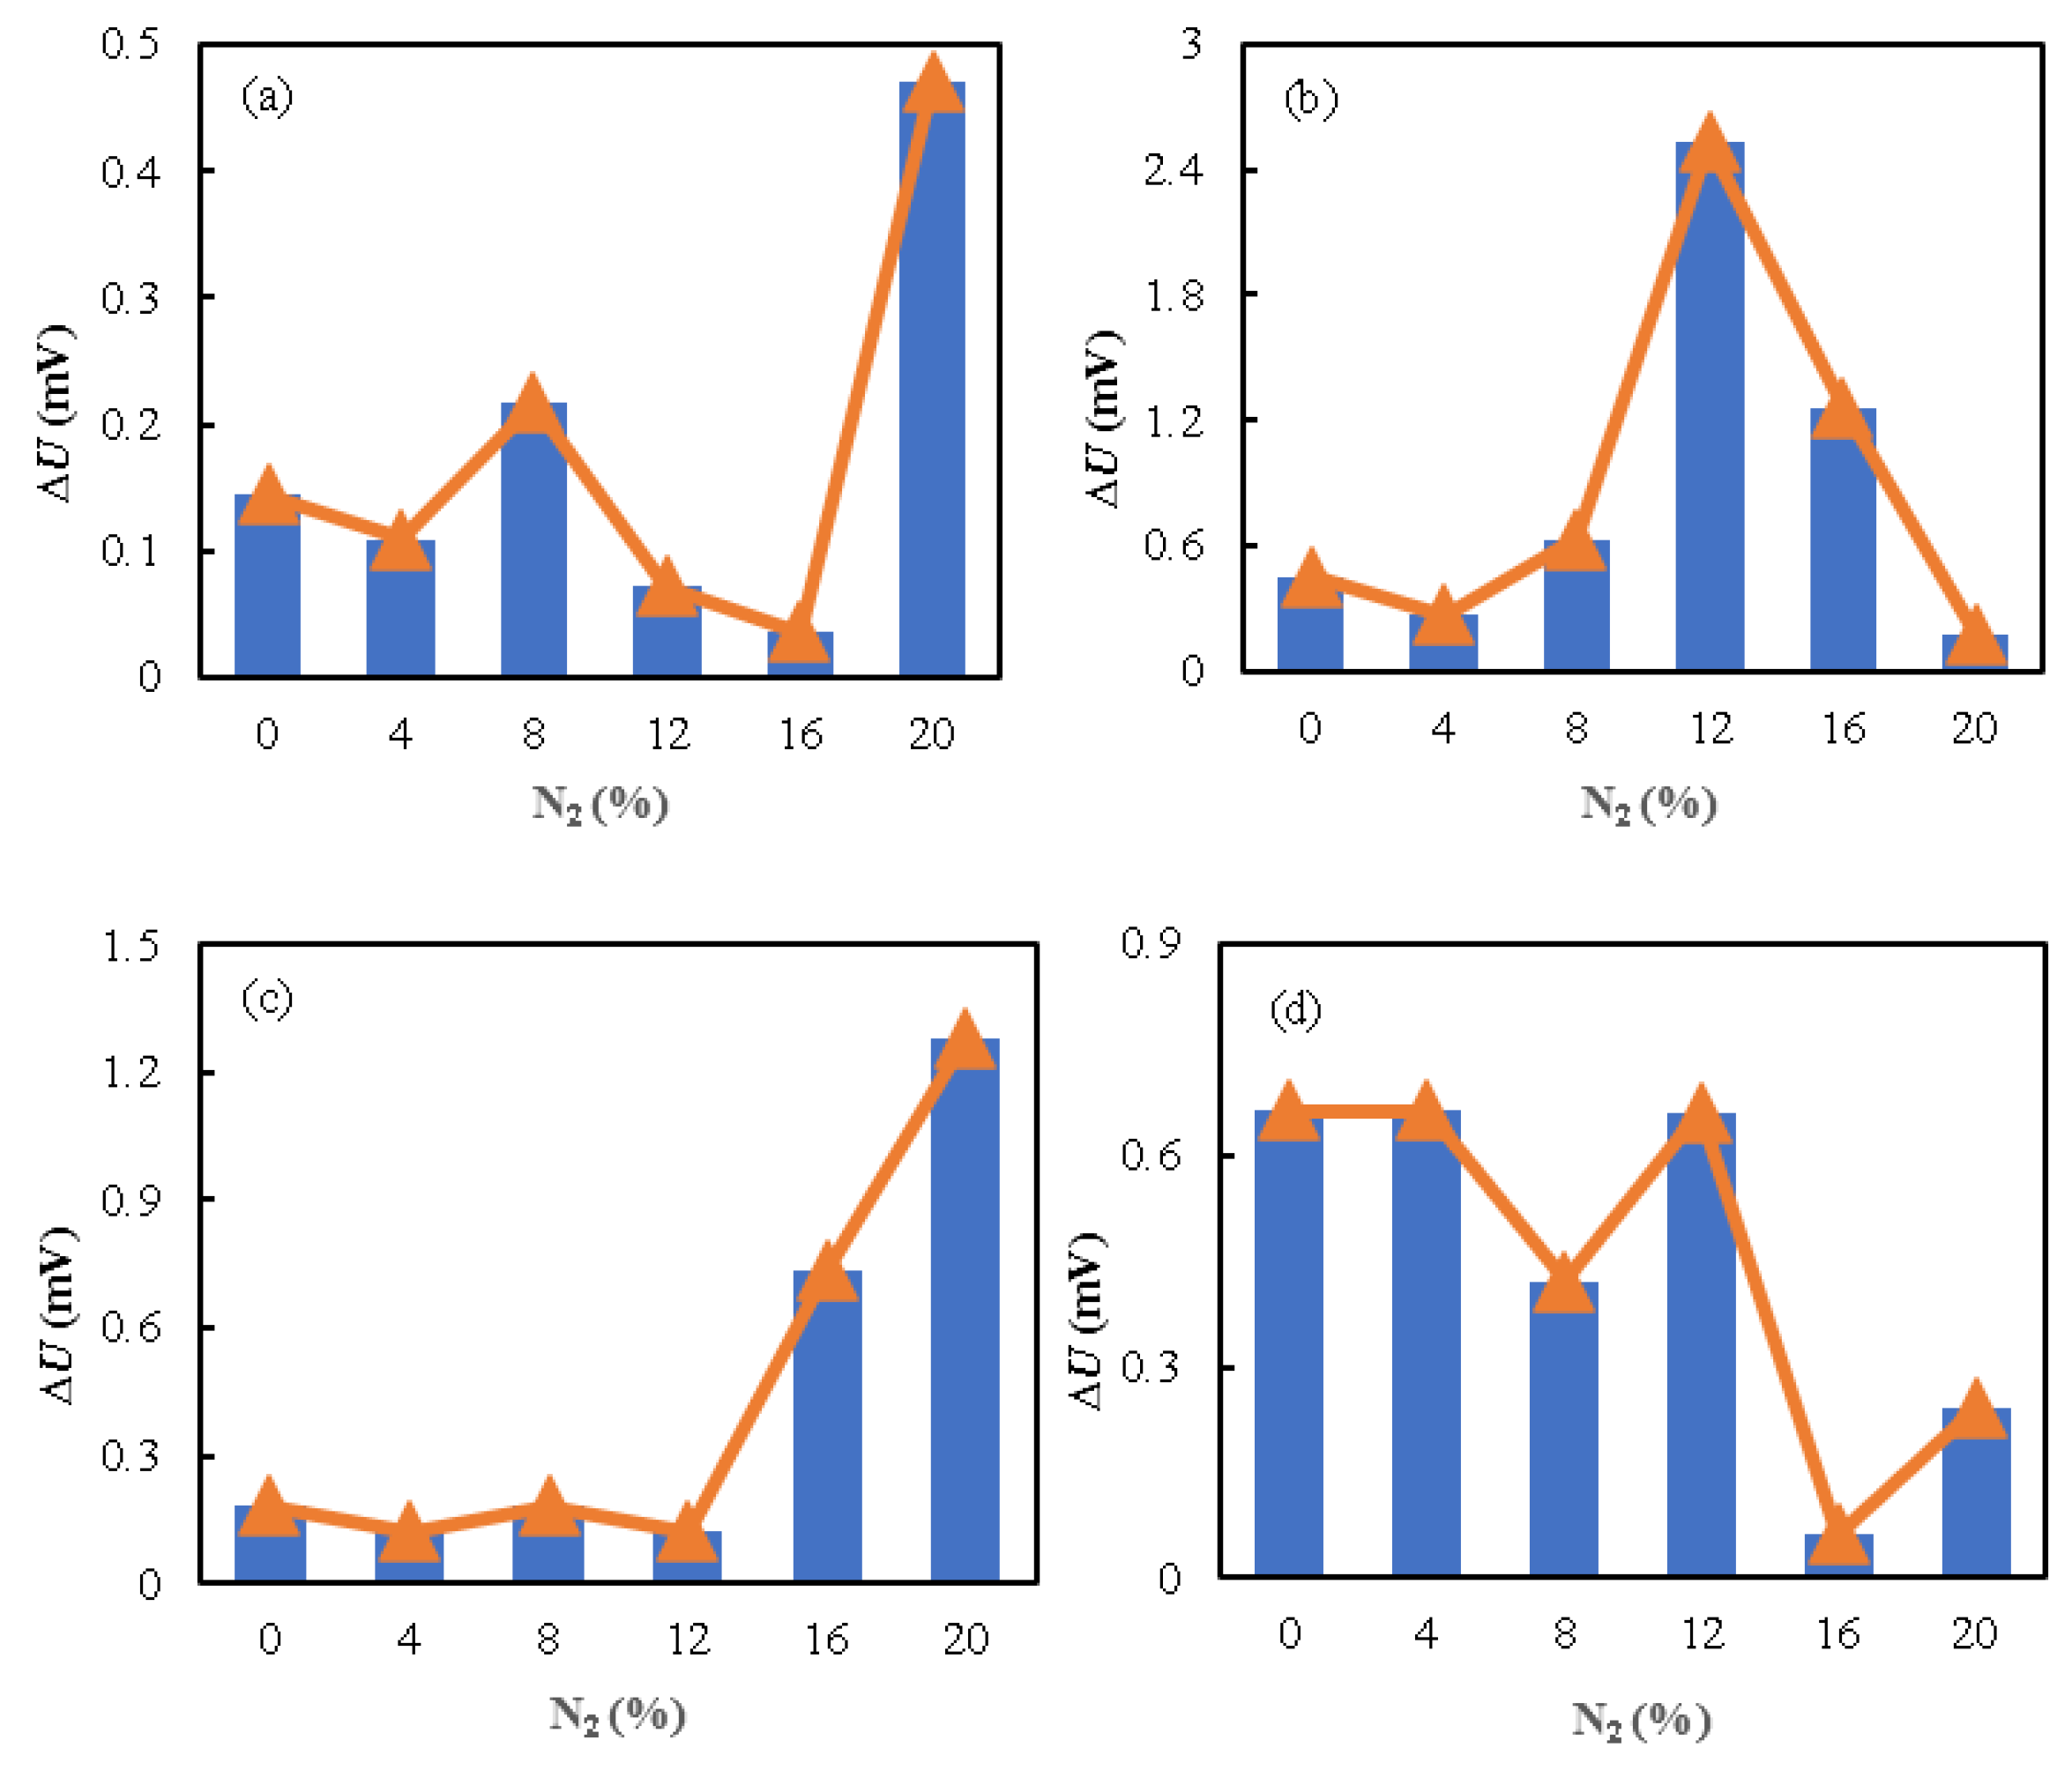
  • Due to the non-uniform distribution of gases within the anode, the anode nitrogen concentration may not be accurately estimated using a single-cell voltage. Under different current densities, the relative mean maximum values of the absolute residual values are 0.350%, 1.980%, and 1.224% for the average voltage, cells 11 and 4, respectively. Therefore, the anode nitrogen concentration is estimated using the mean cell voltage. The accumulation of nitrogen in the anode at varying current densities can be expressed as a function of the working voltage, which can be programmed into the controller for PEMFC management.
  • Anode nitrogen concentration estimation and nitrogen purge algorithms have been the focus of PEMFC research. This paper uses experimental and data analysis methods to evaluate the nitrogen concentration of an anode, and this method has less error in estimating the steady-state nitrogen concentration and requires less calculation. However, at the same time, this method does not consider the water and thermal characteristics of the stack, and it is very difficult to operate at a constant current density because the fuel cell has frequent load changes under on-vehicle operation, so this method is more suitable for operating under conditions where the load is constant for a long time. A combination of modeling and actual operating data analysis can be investigated in the future to more accurately evaluate the nitrogen concentration and to decrease the nitrogen concentration in the anode manifold by purge valve nitrogen purging.

Author Contributions

R.G. performed the calculations and paper writing. D.C. and W.W. proposed innovative points on anode nitrogen concentration estimation based on the voltage variation characteristics of the PEMFC stacks. Y.L. and D.C. performed the investigation and validation. S.H. and X.X. performed the review and editing of the paper. All authors have read and agreed to the published version of the manuscript.

Funding

This work is funded by the National Key Research and Development Program of China (No. 2021YFB4001702), the National Natural Science Foundation of China (Nos. 22005026 and 52202446), and the Beijing Association for Science and Technology’s Golden-Bridge Seed Funding Program (No. ZZ22042).

Institutional Review Board Statement

Not applicable.

Informed Consent Statement

Not applicable.

Data Availability Statement

Not applicable.

Conflicts of Interest

The authors declare no conflict of interest.

References

  1. Hren, R.; Vujanović, A.; Van Fan, Y.; Klemeš, J.J.; Krajnc, D.; Čuček, L. Hydrogen production, storage and transport for renewable energy and chemicals: An environmental footprint assessment. Renew. Sustain. Energy Rev. 2023, 173, 113113. [Google Scholar] [CrossRef]
  2. Sallam, E.R.; Khairy, H.M.; Elshobary, M.; Fetouh, H.A. Application of Algae for Hydrogen Generation and Utilization. In Handbook of Research on Algae as a Sustainable Solution for Food, Energy, and the Environment; IGI Global: Hershey, PA, USA, 2022; pp. 354–378. [Google Scholar] [CrossRef]
  3. Sallam, E.R.; Fetouh, H.A. Comparative Study for the Production of Sustainable Electricity from Marine Sediment Using Recyclable Low-Cost Solid Wastes Aluminum Foil and Graphite Anodes. ChemistrySelect 2022, 7, e202103972. [Google Scholar] [CrossRef]
  4. Sallam, E.R.; Khairy, H.M.; Elnouby, M.S.; Fetouh, H.A. Sustainable electricity production from seawater using Spirulina platensis microbial fuel cell catalyzed by silver nanoparticles-activated carbon composite prepared by a new modified photolysis method. Biomass Bioenergy 2021, 148, 106038. [Google Scholar] [CrossRef]
  5. Liu, S.; Li, X.; Pang, L.; Geng, T.; Guo, Y.; Jiang, L.; Kang, K.; Wang, X.; Liu, Z. Study on the effect of purging time on the performance of PEMFC with dead-ended anode under gravity. Renew. Energy 2022, 200, 1141–1151. [Google Scholar] [CrossRef]
  6. Li, Y.; Yang, F.; Chen, D.; Hu, S.; Xu, X. Thermal-physical modeling and parameter identification method for dynamic model with unmeasurable state in 10-kW scale proton exchange membrane fuel cell system. Energy Convers. Manag. 2023, 276, 116580. [Google Scholar] [CrossRef]
  7. İnci, M. Future vision of hydrogen fuel cells: A statistical review and research on applications, socio-economic impacts and forecasting prospects. Sustain. Energy Technol. Assess. 2022, 53, 102739. [Google Scholar] [CrossRef]
  8. Ahluwalia, R.; Wang, X.; Papadias, D.; Star, A. Performance and Total Cost of Ownership of a Fuel Cell Hybrid Mining Truck. Energies 2022, 16, 286. [Google Scholar] [CrossRef]
  9. Ren, P.; Pei, P.; Li, Y.; Chen, D.; Fu, X.; Zhu, Z.; Zhang, L.; Wang, M. In-situ characterization of gas distribution in proton exchange membrane fuel cell stacks. Energy Convers. Manag. 2022, 269, 116143. [Google Scholar] [CrossRef]
  10. Deng, X.; Huang, C.; Pei, X.; Hu, B.; Zhou, W. Recent progresses and remaining issues on the ultrathin catalyst layer design strategy for high-performance proton exchange membrane fuel cell with further reduced Pt loadings: A review. Int. J. Hydrogen Energy 2022, 47, 1529–1542. [Google Scholar] [CrossRef]
  11. Olabi, A.G.; Wilberforce, T.; Alanazi, A.; Vichare, P.; Sayed, E.T.; Maghrabie, H.M.; Elsaid, K.; Abdelkareem, M.A. Novel Trends in Proton Exchange Membrane Fuel Cells. Energies 2022, 15, 4949. [Google Scholar] [CrossRef]
  12. Pourrahmani, H.; Siavashi, M.; Yavarinasab, A.; Matian, M.; Chitgar, N.; Wang, L.; Van herle, J. A Review on the Long-Term Performance of Proton Exchange Membrane Fuel Cells: From Degradation Modeling to the Effects of Bipolar Plates, Sealings, and Contaminants. Energies 2022, 15, 5081. [Google Scholar] [CrossRef]
  13. Fan, L.; Xing, L.; Tu, Z.; Hwa Chan, S. A breakthrough hydrogen and oxygen utilization in a H2-O2 PEMFC stack with dead-ended anode and cathode. Energy Convers. Manag. 2021, 243, 114404. [Google Scholar] [CrossRef]
  14. Chen, L.; Xu, K.; Yang, Z.; Yan, Z.; Dong, Z. Optimal Design and Operation of Dual-Ejector PEMFC Hydrogen Supply and Circulation System. Energies 2022, 15, 5427. [Google Scholar] [CrossRef]
  15. Ding, R.; Chen, Y.; Chen, P.; Wang, R.; Wang, J.; Ding, Y.; Yin, W.; Liu, Y.; Li, J.; Liu, J. Machine Learning-Guided Discovery of Underlying Decisive Factors and New Mechanisms for the Design of Nonprecious Metal Electrocatalysts. ACS Catal. 2021, 11, 9798–9808. [Google Scholar] [CrossRef]
  16. Wang, J.; Ding, R.; Cao, F.; Li, J.; Dong, H.; Shi, T.; Xing, L.; Liu, J. Comparison of state-of-the-art machine learning algorithms and data-driven optimization methods for mitigating nitrogen crossover in PEM fuel cells. Chem. Eng. J. 2022, 442, 136064. [Google Scholar] [CrossRef]
  17. Legala, A.; Zhao, J.; Li, X. Machine learning modeling for proton exchange membrane fuel cell performance. Energy AI 2022, 10, 100183. [Google Scholar] [CrossRef]
  18. Mao, X.; Liu, S.; Tan, J.; Hu, H.; Lu, C.; Xuan, D. Multi-objective optimization of gradient porosity of gas diffusion layer and operation parameters in PEMFC based on recombination optimization compromise strategy. Int. J. Hydrogen Energy 2023, in press. [Google Scholar] [CrossRef]
  19. Chen, D.; Pei, P.; Meng, Y.; Ren, P.; Li, Y.; Wang, M.; Wang, X. Novel extraction method of working condition spectrum for the lifetime prediction and energy management strategy evaluation of automotive fuel cells. Energy 2022, 255, 124523. [Google Scholar] [CrossRef]
  20. Omrani, R.; Shabani, B. An analytical model for hydrogen and nitrogen crossover rates in proton exchange membrane fuel cells. Int. J. Hydrogen Energy 2020, 45, 31041–31055. [Google Scholar] [CrossRef]
  21. Tang, Q.; Li, B.; Yang, D.; Ming, P.; Zhang, C.; Wang, Y. Review of hydrogen crossover through the polymer electrolyte membrane. Int. J. Hydrogen Energy 2021, 46, 22040–22061. [Google Scholar] [CrossRef]
  22. Zhou, Z.; Ye, L.; Qiu, D.; Peng, L.; Lai, X. Experimental investigation and decoupling of voltage losses distribution in proton exchange membrane fuel cells with a large active area. Chem. Eng. J. 2023, 452, 139497. [Google Scholar] [CrossRef]
  23. Goo, B.-H.; Paek, S.Y.; Al Munsur, A.Z.; Choi, O.; Kim, Y.; Kwon, O.J.; Lee, S.Y.; Kim, H.-J.; Kim, T.-H. Polyamide-coated Nafion composite membranes with reduced hydrogen crossover produced via interfacial polymerization. Int. J. Hydrogen Energy 2022, 47, 1202–1216. [Google Scholar] [CrossRef]
  24. Zhu, K.-Q.; Ding, Q.; Xu, J.-H.; Yang, Y.-R.; Yang, C.; Zhang, J.; Zhang, Y.; Huang, T.-M.; Yan, W.-M.; Wan, Z.-M.; et al. Optimization of gas diffusion layer thickness for proton exchange membrane fuel cells under steady-state and load-varying conditions. Energy Convers. Manag. 2022, 267, 115915. [Google Scholar] [CrossRef]
  25. Chen, D.; Pei, P.; Ren, P.; Song, X.; Wang, H.; Zhang, L.; Wang, M. Analytical methods for the effect of anode nitrogen concentration on performance and voltage consistency of proton exchange membrane fuel cell stack. Energy 2022, 258, 124850. [Google Scholar] [CrossRef]
  26. Zhou, M.; Frensch, S.; Liso, V.; Li, N.; Sahlin, S.L.; Cinti, G.; Simon Araya, S. Modeling the Performance Degradation of a High-Temperature PEM Fuel Cell. Energies 2022, 15, 5651. [Google Scholar] [CrossRef]
  27. Chen, B.; Zhou, H.; He, S.; Meng, K.; Liu, Y.; Cai, Y. Numerical simulation on purge strategy of proton exchange membrane fuel cell with dead-ended anode. Energy 2021, 234, 121265. [Google Scholar] [CrossRef]
  28. Jiao, J.; Chen, F. Humidity estimation of vehicle proton exchange membrane fuel cell under variable operating temperature based on adaptive sliding mode observation. Appl. Energy 2022, 313, 118779. [Google Scholar] [CrossRef]
  29. Xu, Q.; Zhao, J.; Chen, Y.; Liu, S.; Wang, Z. Effects of gas permeation on the sealing performance of PEMFC stacks. Int. J. Hydrogen Energy 2021, 46, 36424–36435. [Google Scholar] [CrossRef]
  30. Shen, K.-Y.; Park, S.; Kim, Y.-B. Hydrogen utilization enhancement of proton exchange membrane fuel cell with anode recirculation system through a purge strategy. Int. J. Hydrogen Energy 2020, 45, 16773–16786. [Google Scholar] [CrossRef]
  31. Baik, K.D.; Kim, M.S. Characterization of nitrogen gas crossover through the membrane in proton-exchange membrane fuel cells. Int. J. Hydrogen Energy 2011, 36, 732–739. [Google Scholar] [CrossRef]
  32. Ziogou, C.; Voutetakis, S.; Papadopoulou, S.; Georgiadis, M.C. Modeling, simulation and experimental validation of a PEM fuel cell system. Comput. Chem. Eng. 2011, 35, 1886–1900. [Google Scholar] [CrossRef]
  33. Liu, Z.; Chen, J.; Liu, H.; Yan, C.; Hou, Y.; He, Q.; Zhang, J.; Hissel, D. Anode purge management for hydrogen utilization and stack durability improvement of PEM fuel cell systems. Appl. Energy 2020, 275, 115110. [Google Scholar] [CrossRef]
  34. Piffard, M.; Gerard, M.; Fonseca, R.D.; Massioni, P.; Bideaux, E. Sliding mode observer for proton exchange membrane fuel cell: Automotive application. J. Power Sources 2018, 388, 71–77. [Google Scholar] [CrossRef] [Green Version]
  35. Wu, W.; Chen, D.; Li, Y.; Hong, J.; Xu, X. Methods for estimating the accumulated nitrogen concentration in anode of proton exchange membrane fuel cell stacks based on back propagation neural network. Int. J. Energy Res. 2022, 46, 22530–22540. [Google Scholar] [CrossRef]
  36. Karimäki, H.; Pérez, L.C.; Nikiforow, K.; Keränen, T.M.; Viitakangas, J.; Ihonen, J. The use of on-line hydrogen sensor for studying inert gas effects and nitrogen crossover in PEMFC system. Int. J. Hydrogen Energy 2011, 36, 10179–10187. [Google Scholar] [CrossRef]
  37. Chen, Y.-S.; Yang, C.-W.; Lee, J.-Y. Implementation and evaluation for anode purging of a fuel cell based on nitrogen concentration. Appl. Energy 2014, 113, 1519–1524. [Google Scholar] [CrossRef]
  38. Xu, L.; Hu, Z.; Fang, C.; Li, J.; Hong, P.; Jiang, H.; Guo, D.; Ouyang, M. Anode state observation of polymer electrolyte membrane fuel cell based on unscented Kalman filter and relative humidity sensor before flooding. Renew. Energy 2021, 168, 1294–1307. [Google Scholar] [CrossRef]
Figure 1. The schematic diagram of the experimental setup.
Energies 16 02111 g001
Figure 2. Flow chart of experiments and data processing: (a) Experimental procedure; (b) Data processing process.
Energies 16 02111 g002
Figure 3. Test results of the fuel cell stack at different current densities: (a) 0.2 A·cm−2; (b) 0.6 A·cm−2; (c) 1.0 A·cm−2; (d) 1.4 A·cm−2.
Energies 16 02111 g003
Figure 4. Fitting results of the experiment data at different current densities: (a) 0.2 A·cm−2; (b) 0.6 A·cm−2; (c) 1.0 A·cm−2; (d) 1.4 A·cm−2.
Energies 16 02111 g004
Figure 5. Error analysis with different nitrogen concentrations at different current densities: (a) 0.2 A·cm−2; (b) 0.6 A·cm−2; (c) 1.0 A·cm−2; (d) 1.4 A·cm−2.
Energies 16 02111 g005
Figure 6. Test results of cell 11 at different current densities: (a) 0.2 A·cm−2; (b) 0.6 A·cm−2; (c) 1.0 A·cm−2; (d) 1.4 A·cm−2.
Energies 16 02111 g006
Figure 7. Fitting results of cell 11 at different current densities: (a) 0.2 A·cm−2; (b) 0.6 A·cm−2; (c) 1.0 A·cm−2; (d) 1.4 A·cm−2.
Energies 16 02111 g007
Figure 8. Error analysis of cell 11 with different nitrogen concentrations at different current densities: (a) 0.2 A·cm−2; (b) 0.6 A·cm−2; (c) 1.0 A·cm−2; (d) 1.4 A·cm−2.
Energies 16 02111 g008
Figure 9. Test results of cell 4 at different current densities: (a) 0.2 A·cm−2; (b) 0.6 A·cm−2; (c) 1.0 A·cm−2; (d) 1.4 A·cm−2.
Energies 16 02111 g009
Figure 10. Fitting results of cell 4 at different current densities: (a) 0.2 A·cm−2; (b) 0.6 A·cm−2; (c) 1.0 A·cm−2; (d) 1.4 A·cm−2.
Energies 16 02111 g010
Figure 11. Error analysis of cell 4 with different nitrogen concentrations at different current densities: (a) 0.2 A·cm−2; (b) 0.6 A·cm−2; (c) 1.0 A·cm−2; (d) 1.4 A·cm−2.
Energies 16 02111 g011
Figure 12. Prediction and validation for 1.6 A·cm−2: (a) Test results; (b) Prediction and validation of data based on 0–16% nitrogen concentration; (c) Prediction and validation of data based on 0–17% nitrogen concentration; (d) Prediction and validation of data based on 0–18% nitrogen concentration; (e) Prediction and validation of data based on 0–20% nitrogen concentration.
Energies 16 02111 g012
Table 1. Stack parameters and operating parameters.
ParametersValue
Membrane active area301 cm2
Power5 kW
Number of cells16
Anode (Pt)0.1 mg∙cm−2
Cathode (Pt)0.4 mg∙cm−2
Bipolar plate316 L stainless steel
Excess ratio λ1 of hydrogen/nitrogen flow channel1.498
Inlet pressure P1 of hydrogen/nitrogen flow channel260 kPa(abs.)
Humidifier dew temperature T1 of hydrogen/nitrogen flow channel60 °C
Excess ratio λ2 of air flow channel1.697
Inlet pressure P2 of air flow channel250 kPa(abs.)
Humidifier dew temperature T2 of air flow channel60 °C
Coolant inlet temperature T374 °C
Table 2. Error analysis.
Current Density (A·cm−2)Serial NumberΔUmax (mV)ΔUmin (mV)ΔUa (mV)δr (%)
0.2Mean Cell Voltage0.497 0.090 0.241 0.308
Cell Voltage 110.689 0.109 0.368 0.474
Cell Voltage 40.470 0.036 0.175 0.224
0.6Mean Cell Voltage0.242 0.061 0.171 0.236
Cell Voltage 114.699 0.180 1.386 1.980
Cell Voltage 42.530 0.181 0.889 1.224
1.0 Mean Cell Voltage0.273 0.091 0.152 0.219
Cell Voltage 110.651 0.072 0.361 0.465
Cell Voltage 41.281 0.122 0.437 0.628
1.4Mean Cell Voltage0.361 0.090 0.226 0.350
Cell Voltage 112.892 0.359 1.144 1.867
Cell Voltage 40.663 0.061 0.452 0.691
Table 3. Comparison of different nitrogen concentration estimation methods.
Nitrogen Concentration
Estimation Method
AdvantageDisadvantageReferences
Use of designed on-line
hydrogen sensors
The real-time concentration of anode nitrogen can be obtained directly with a time delay of maximum 1.1 s.Additional parts added, not suitable for installation.[36]
Using mass spectrometryCan obtain high-precision nitrogen concentration dataThe gas concentration is measured for a period of 30 min or more while maintaining a certain working condition.[31]
Using the integration of electrical densityA simple method can be used to estimate the nitrogen concentration and control the nitrogen concentration within 15%.Cannot accurately estimate the nitrogen concentration in the flow channel.[37]
Using a modeling approachMore accurate data can be obtained without adding additional components by reducing the nitrogen concentration from 20% to 2%.Complex, computationally intensive, and difficult to ascertain parameters.[32,38]
This StudySimple method, easy to repeat, and more accurate results.Lower accuracy compared to using a mass spectrometer and a modeling approach.
Disclaimer/Publisher’s Note: The statements, opinions and data contained in all publications are solely those of the individual author(s) and contributor(s) and not of MDPI and/or the editor(s). MDPI and/or the editor(s) disclaim responsibility for any injury to people or property resulting from any ideas, methods, instructions or products referred to in the content.

