Article

Applied Complex Diagnostics and Monitoring of Special Power Transformers

1
Centralna Energoremontna Baza EAD, Cerb TRAFO, Lokomotiv 1, 1220 Sofia, Bulgaria
2
Department of Electrical Apparatus, Technical University of Sofia, 1797 Sofia, Bulgaria
3
Centralna Himicheska Laboratoria Ltd., Lokomotiv 1, 1220 Sofia, Bulgaria
*
Author to whom correspondence should be addressed.
Energies 2023, 16(5), 2142; https://doi.org/10.3390/en16052142
Submission received: 26 December 2022 / Revised: 15 February 2023 / Accepted: 17 February 2023 / Published: 22 February 2023

Abstract

:
As a major component in electric power systems, power transformers are one of the most expensive and important pieces of electrical equipment. The trouble-free operation of power transformers is an important criterion for safety and stability in a power system. Technical diagnostics of electrical equipment are a mandatory part of preventing accidents and ensuring the continuity of the power supply. In this study, a complex diagnostic methodology was proposed and applied for special power transformers’ risk estimation. Twenty special power transformers were scored with the proposed risk estimation methodology. For each transformer, dissolved gas analysis (DGA) tests, transformer oil quality analysis, visual inspections of all current equipment on-site and historical data for the operation of each electrical research were conducted. All data were collected and analyzed under historical records of malfunctioning events. Statistical data for expected fault risk, based on long-term records, with such types of transformers were used to make more precise estimations of the current state of each machine and expected operational resource. The calculated degree of insulation polymerization was made via an ANN-assisted predictive method. Assessment of the collected data was applied to allow detailed information of the state of the power transformer to be rated. A method for risk assessment and reliability estimation was proposed and applied, based on the health index (HI) for each transformer.

1. Introduction

Assuming power transformers are operated properly and undergo regular maintenance, their life expectancy is around 20–25 years. There are transformers which have been working for more than 30 years of service and still have huge operating resources remaining [1,2,3,4]. After the initial warranty, which usually lasts about 4–5 years depending on the class and purpose of the transformer, maintenance becomes the responsibility of the owner. For a transformer under operation, a few possible methods and technologies are traditionally adopted to analyze and evaluate the current operational state [1,2,3,4,5,6,7,8,9,10]; these include all tests performed on the transformer oil, e.g., DGA and chemical tests, and visual inspection from the outside [11,12,13,14,15,16]. Transformers play an important role in the power system; hence, proper monitoring, maintenance, diagnostics and upgrading help to reduce the risks of major faults and breakdowns. Accurate assessment of the condition of power transformers is a key factor in building and maintaining high reliability in a power system [17,18,19]. Timely diagnosis helps prevent serious accidents, which are often associated with serious financial costs. Power transformers often supply responsible equipment, and emergency modes are usually associated with consequential damage. Complex diagnostic and monitoring of power and special transformers is needed in order to prevent damage and accidents, on and from the transformer, to extend the life of the transformer asset, reducing the risk of serious and irreparable damage to power transformers and other electrical equipment in the substation, ensuring the continuity of the power supply and the normal operation of the power system; such measures increase the reliability of the power grid to greatly reduce repair and maintenance costs, and extend the life of the initial materials used in creating the transformer [1,2,3,4,5,6,7,8,9,17,18,19,20,21,22]. Diagnostics and monitoring of power and special transformers are always needed to prevent serious damage, which can result in even greater consequences; such measures can reduce the high costs of repair, refurbishing and replacement of the electrical equipment [23,24,25].
The classical approach for on-field testing and preventative diagnostics would be performing several different tests: electrical tests and reports that would test the electromagnetics and the bushing system of the transformer; an oil test to estimate its condition; and DGA tests to determine hidden defects or ongoing faults [17,18,19,21,22,23,24,25,26,27,28,29,30,31,32]. All applied preventive on-field diagnostics test individual systems of transformers; however, transformer systems work together, and usually when there is fault in one component, all other parts of the transformer experience some stresses. A typical example would be a fault in the cooling system, which would lead to higher temperatures and hot spots in the active part of the transformer; over a prolonged time, this may result in damage which could be avoided if all systems were constantly monitored [29,30,31,32,33,34]. Moreover, on-field testing usually does not show the range of faults, and a lot of experience is usually needed to translate and adjust the results [35,36,37,38]. In recent years, power and special transformers have been equipped with many different sensors that are constantly measuring different parameters; these could be deployed to collect real-time data. With the rise of online monitoring, large databases could be created and worked through algorithms to estimate and predict faults, as well as their origins [36,38]. For this purpose, algorithms to process and combine all collected data are emerging [36,37,39].
In this study, a new complex diagnostic methodology is proposed for special power transformers’ risk estimation. Twenty special power transformers were scored with the proposed risk estimation methodology. For each transformer, dissolved gas analysis (DGA) tests, transformer oil quality analysis, visual inspection onsite of all current equipment and historical data for operation of each electrical research were conducted. All data were collected and analyzed under historical records of malfunctioning events. Statistical data for expected fault risk, based on long-term records with such types of transformers, were used to make more precise estimations of the current state of each machine and its expected operational resources. Assessment of the collected data was applied to allow a detailed prediction of the state of the power transformer to be rated. A method for risk assessment and reliability estimation was proposed and applied based on the health index for each transformer.

2. Methods Used to Investigate Transformers

Here, the technical diagnostic method is presented to estimate a power transformer’s current state and remaining operating lifespan in terms of expected End of Life (EOL). The used technique for diagnostics was to combine four different methods for on-field testing data processing and estimation through algorithms. We combined oil tests for estimation of dissolved gases and oil quality, degree of polymerization calculations based on indirect measurements from dissolved 2-FAL in transformer oil, the health index approach for processing data collected through visual inspection, history and test results and calculation of risk of failure based on the health index. Methods were used to prioritize transformers for repair, close monitoring, maintenance or scrap.
Twenty special transformers, which operate in Europe, Bulgaria, and are used in railway substations, were subjected to the proposed diagnostics. The diagnostics were separated into five different stages, which are explained below [24]:
  • Estimation of the current state of the transformer: includes all tests performed on transformer oil (DGA and chemical tests) and a visual inspection [11,13,14,16];
  • Collecting history data: includes collecting data from previous faults, repairs and maintenance. Collecting data for load history of the transformer. and investigating annual tests reports [13,15,16];
  • Analyzing through algorithms: results from each test are analyzed and subjected to different algorithms, in order to obtain additional information about the technical state of the transformers and find hidden defects and catch trends [40,41];
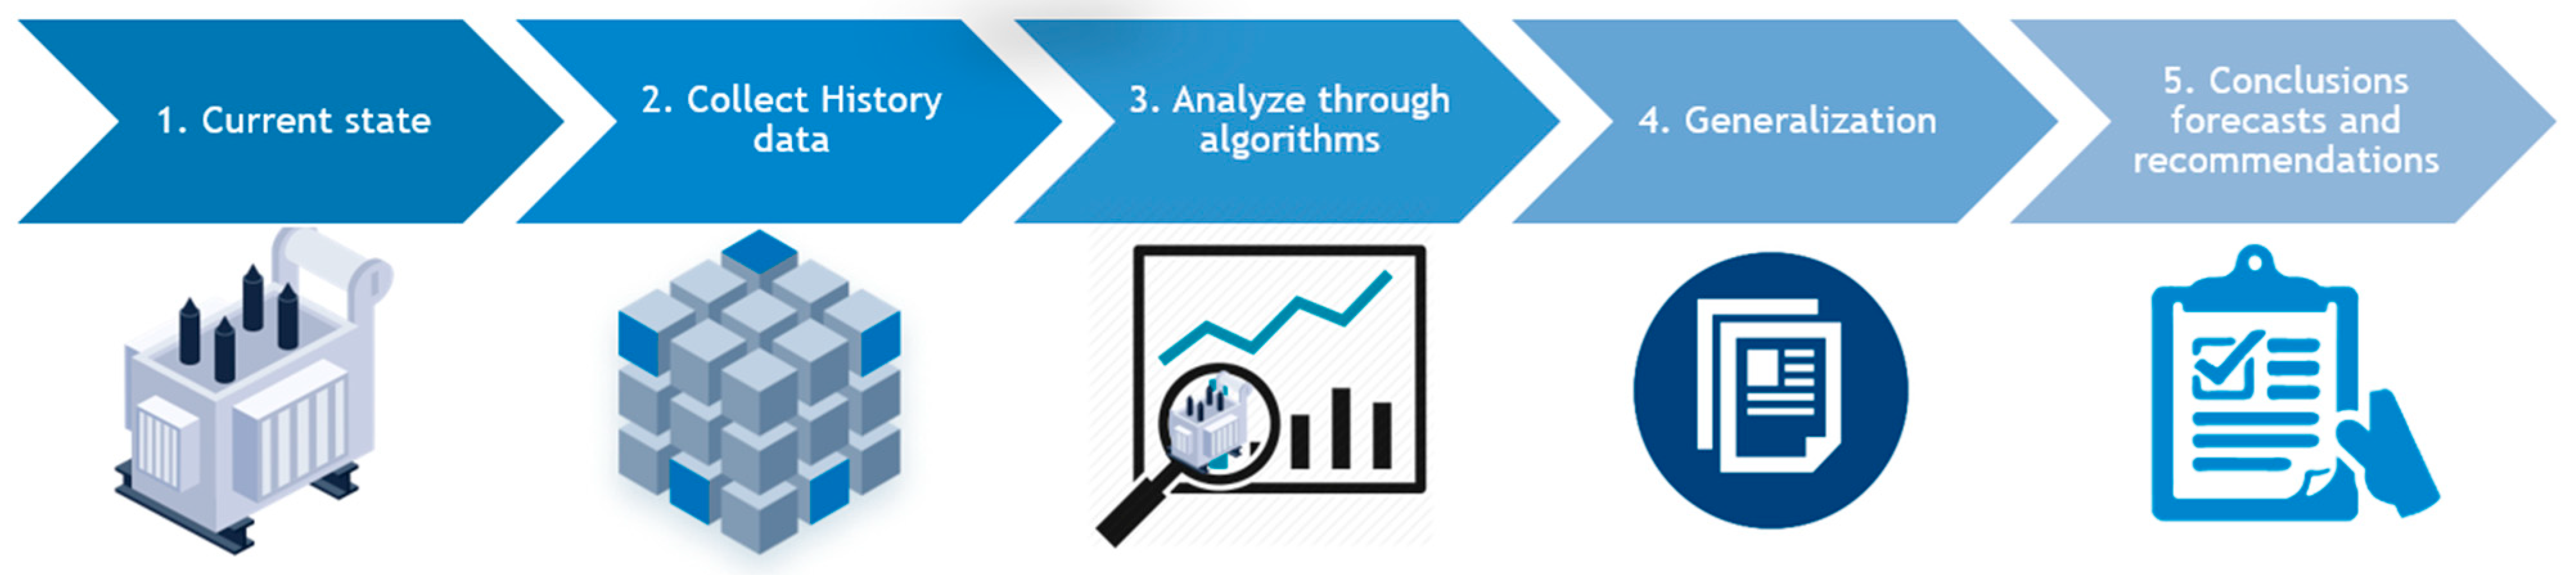
  • Generalization: all information which is received via different tests and algorithms is generalized and discussed to receive more detailed information about the current state of the transformer. Most of the tests usually result in data which are detailed for specific subsystems of the transformer [16,40,42,43];
  • Conclusions, forecasts and recommendations: based on results achieved from the applied diagnostic tests and methods, conclusions are drawn, and forecasts are made for probability of failure, EOL of the transformers and reliability. Recommendations are given to prioritize repair for the most degenerated transformers or to scrap them if end of life is reached [10,17,44]. In Figure 1 is shown a block scheme of the five stages used during the technical diagnostics.
All collected data from the history of the transformer, performed tests and visual diagnostics are used to forecast upcoming failures and EOL of each transformer, and based on these criteria there is a decision to prioritize transformers for repair, maintenance or replacement, if a transformer has reached the end of its life [10,18,22]. In Figure 2 is shown the principal illustrative scheme of the method used, which is based on health index calculations.
The investigated transformers were produced in various year spans, and some of them had already more than 30 years of service. The rated power ranged from 8.33 MVA to 10.50 MVA; the primary voltage was 110 kV, and secondary voltage was 27.5 kV. Transformer designs varied depending on the year of production. There was one transformer which had been subjected to maintenance during its lifetime. Transformers’ cooling system designs varied from ONAN to ONAN/ONAF. Technical data for the investigated transformer group are provided in Table 1.
For the purpose of estimating the current state of each transformer, a diagnostic plan was established. For all transformers, the following tests and analyses were accomplished.

2.1. Diagnostic Measuments Conducted on the Transformer Oil

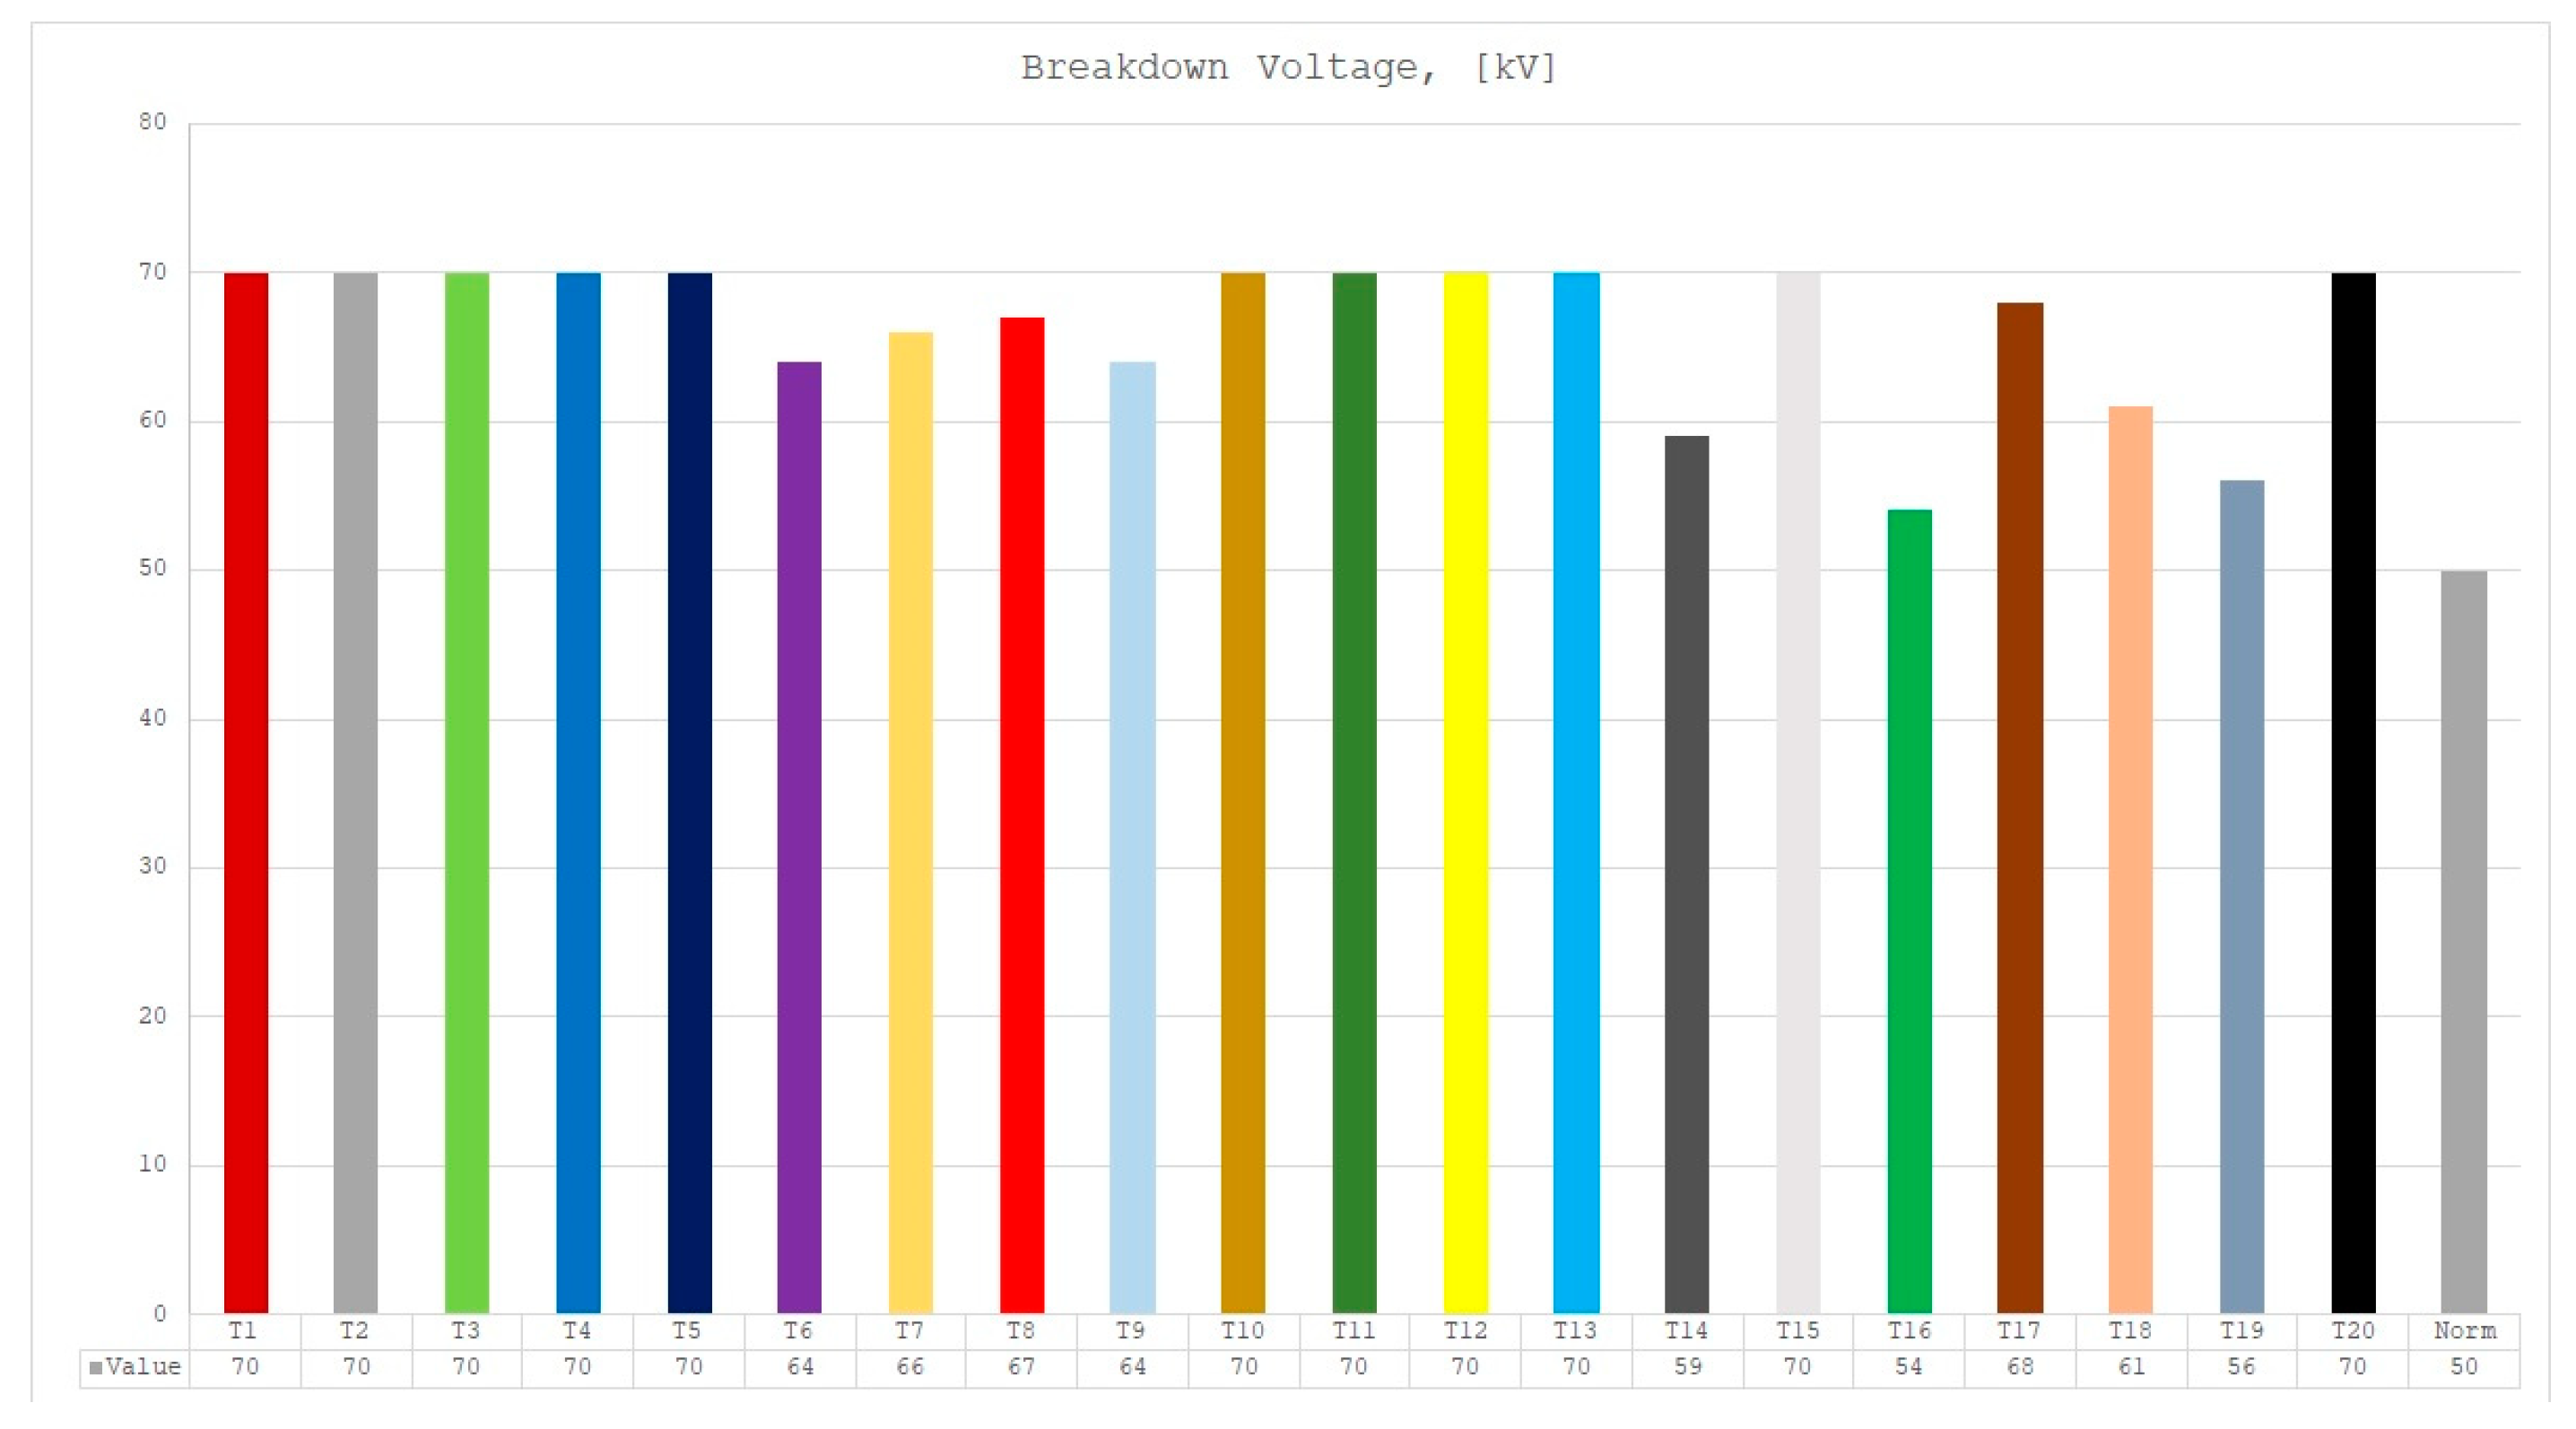
  • Measurement of breakdown voltage of the transformer oil according to IEC 60,156 Insulating Liquids: determination of the breakdown voltage at power frequency-test method [30];
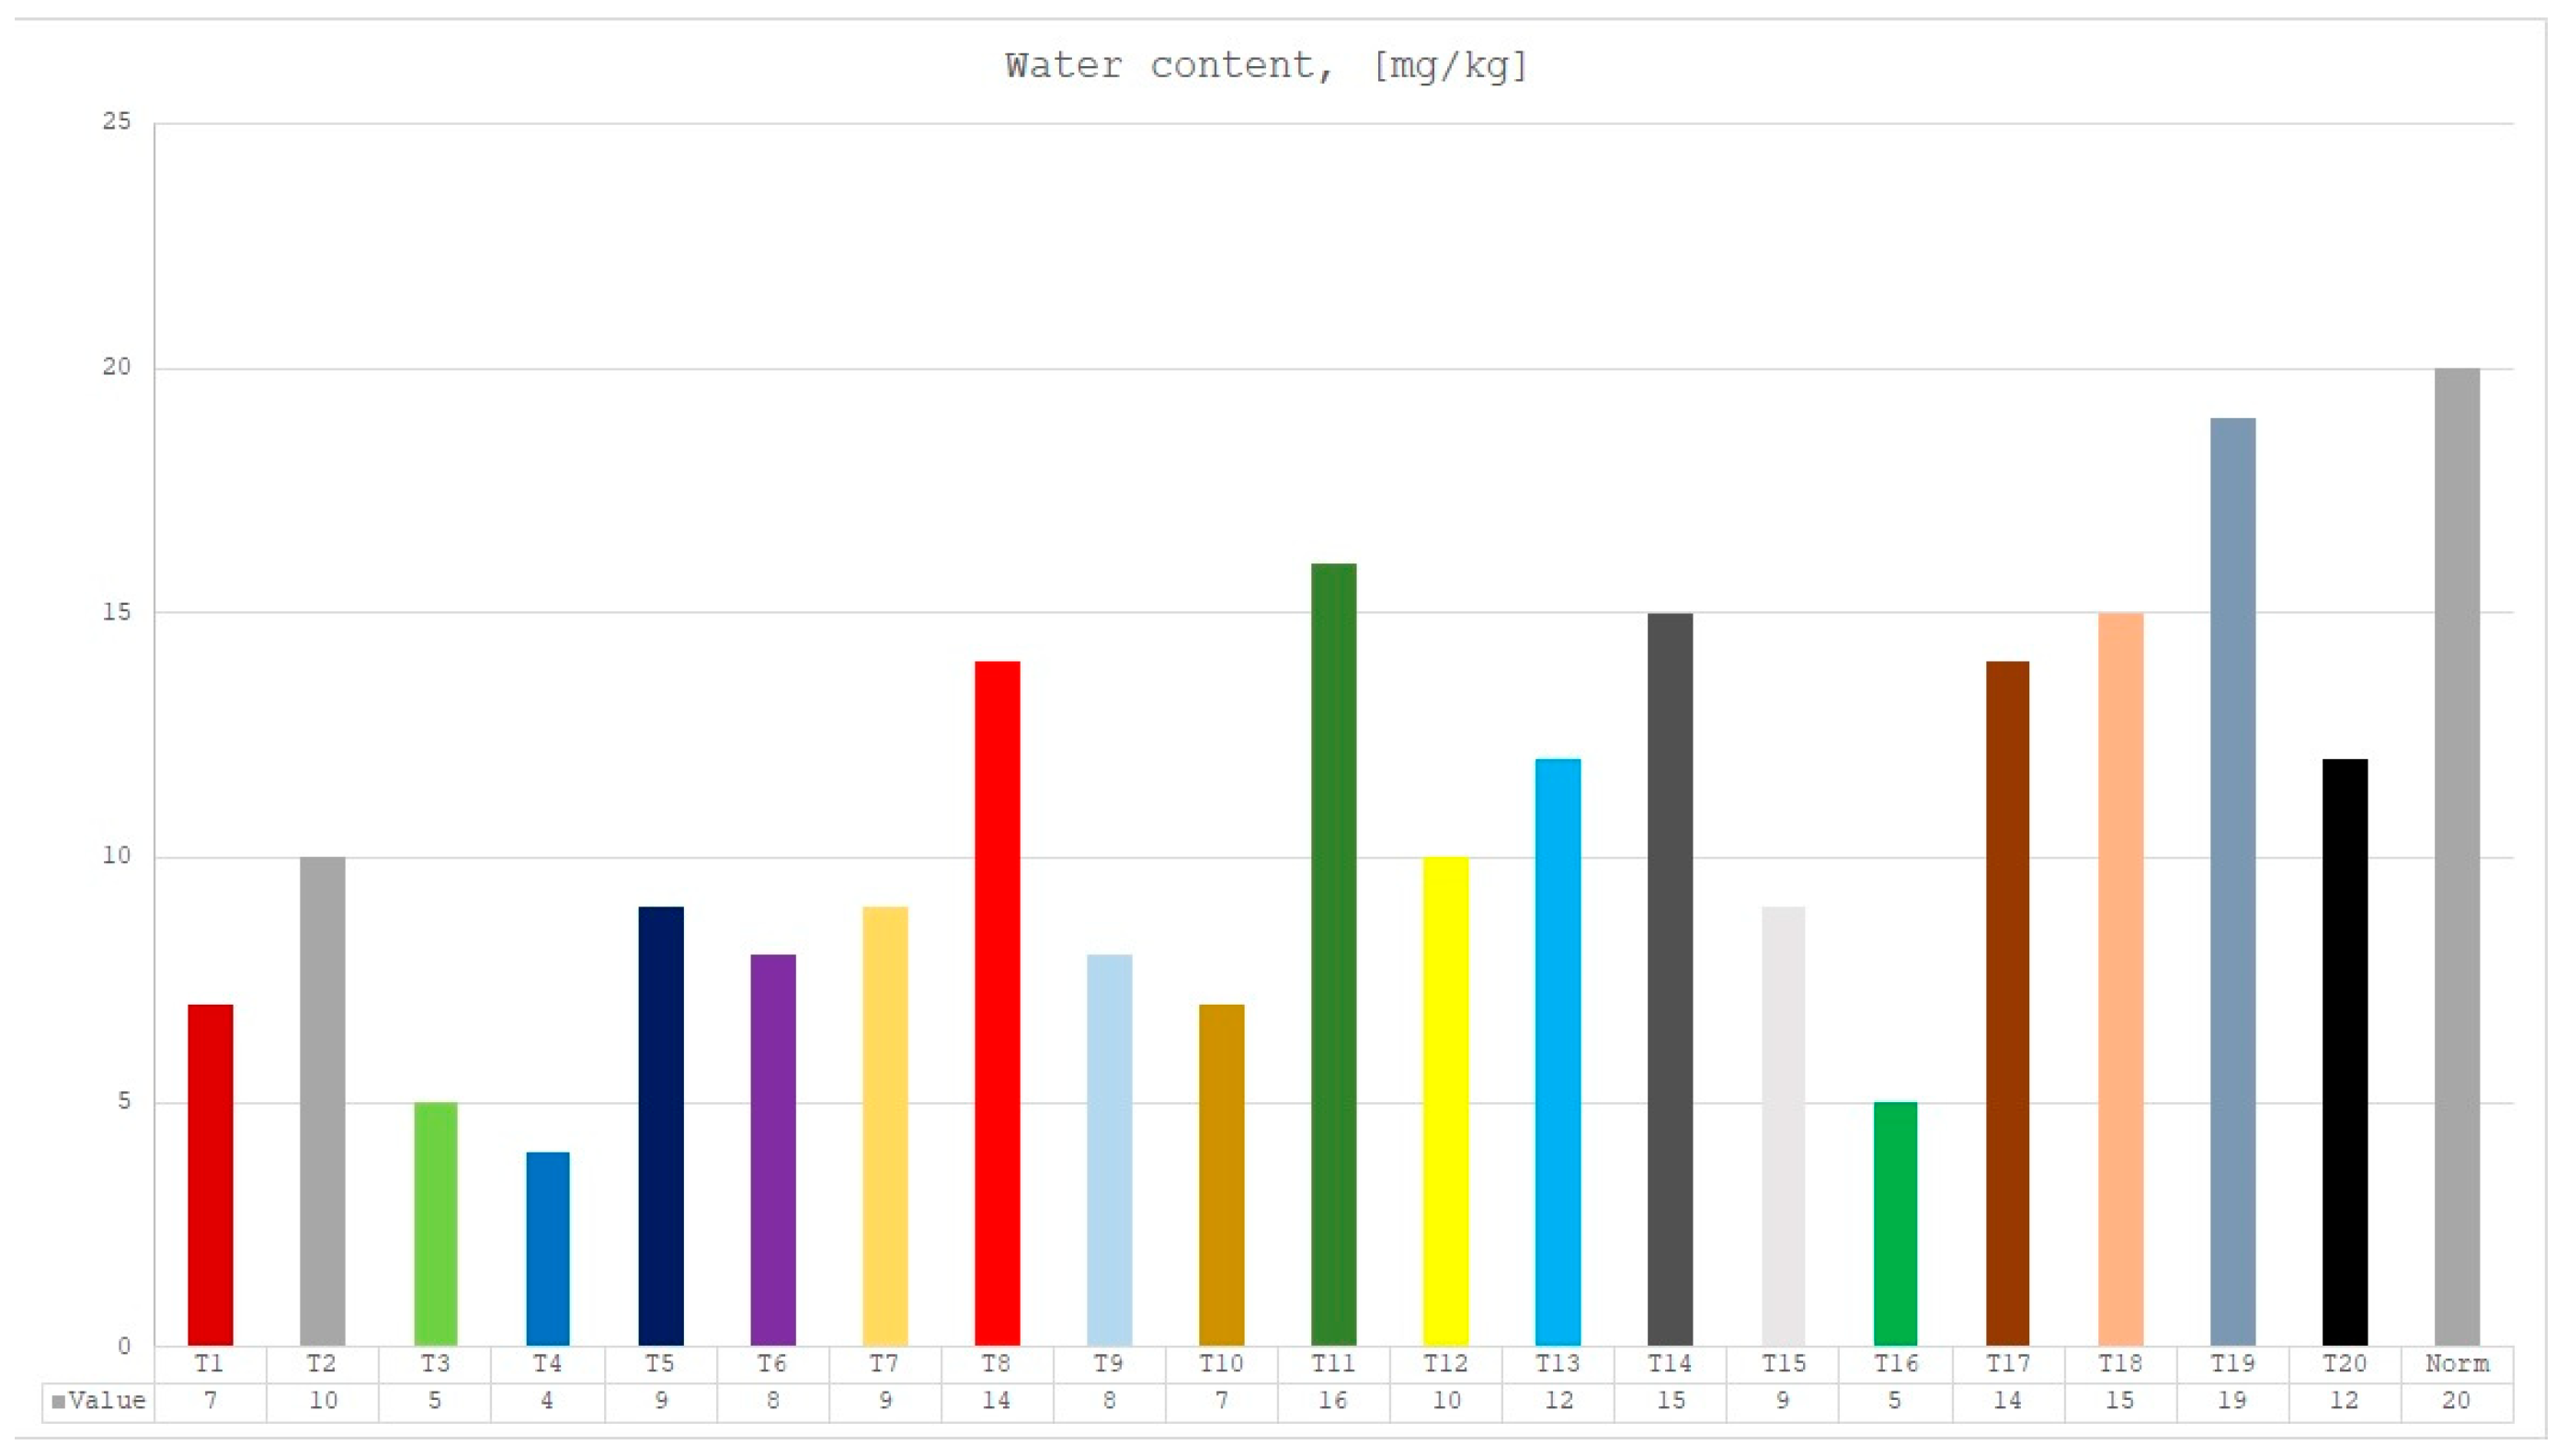
  • Measurement of water content in the transformer oil according to IEC 60,814 Oil-impregnated paper and pressboard: determination of water by automatic coulometric Karl Fischer titration [29];
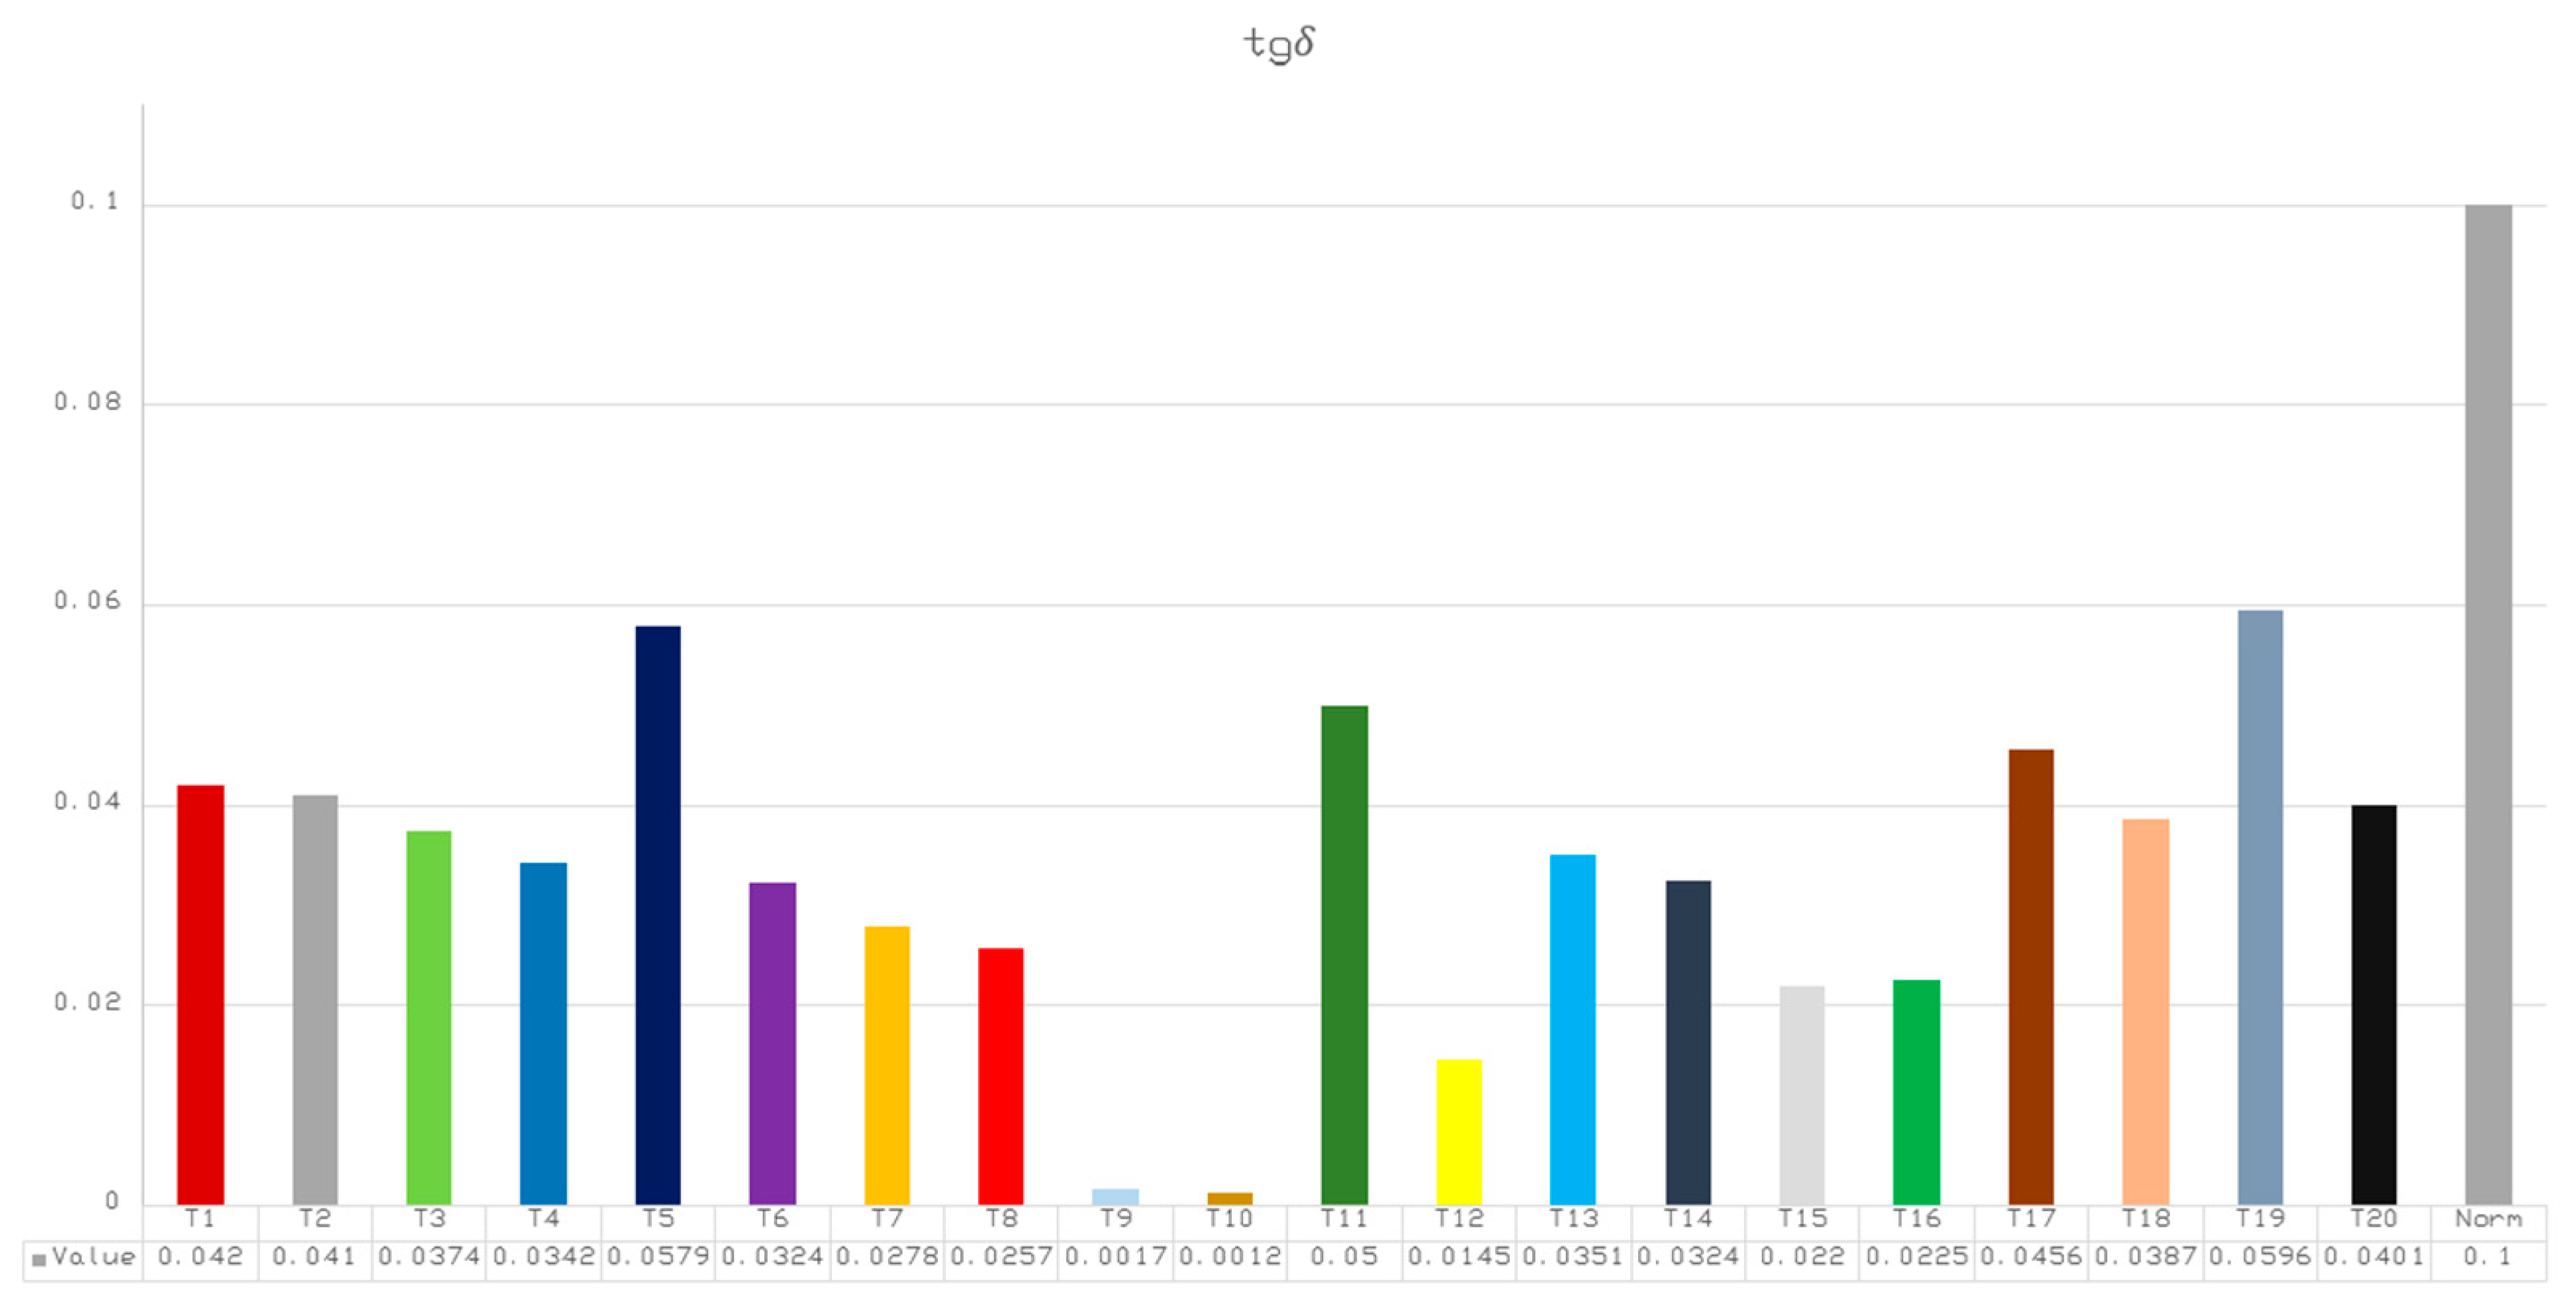
  • Measurement of dissipation factor of the transformer oil tan δ according to IEC 60,247 Insulating Liquids: measurement of relative permittivity, dielectric dissipation factor (tan δ) and d.c. resistivity [31];
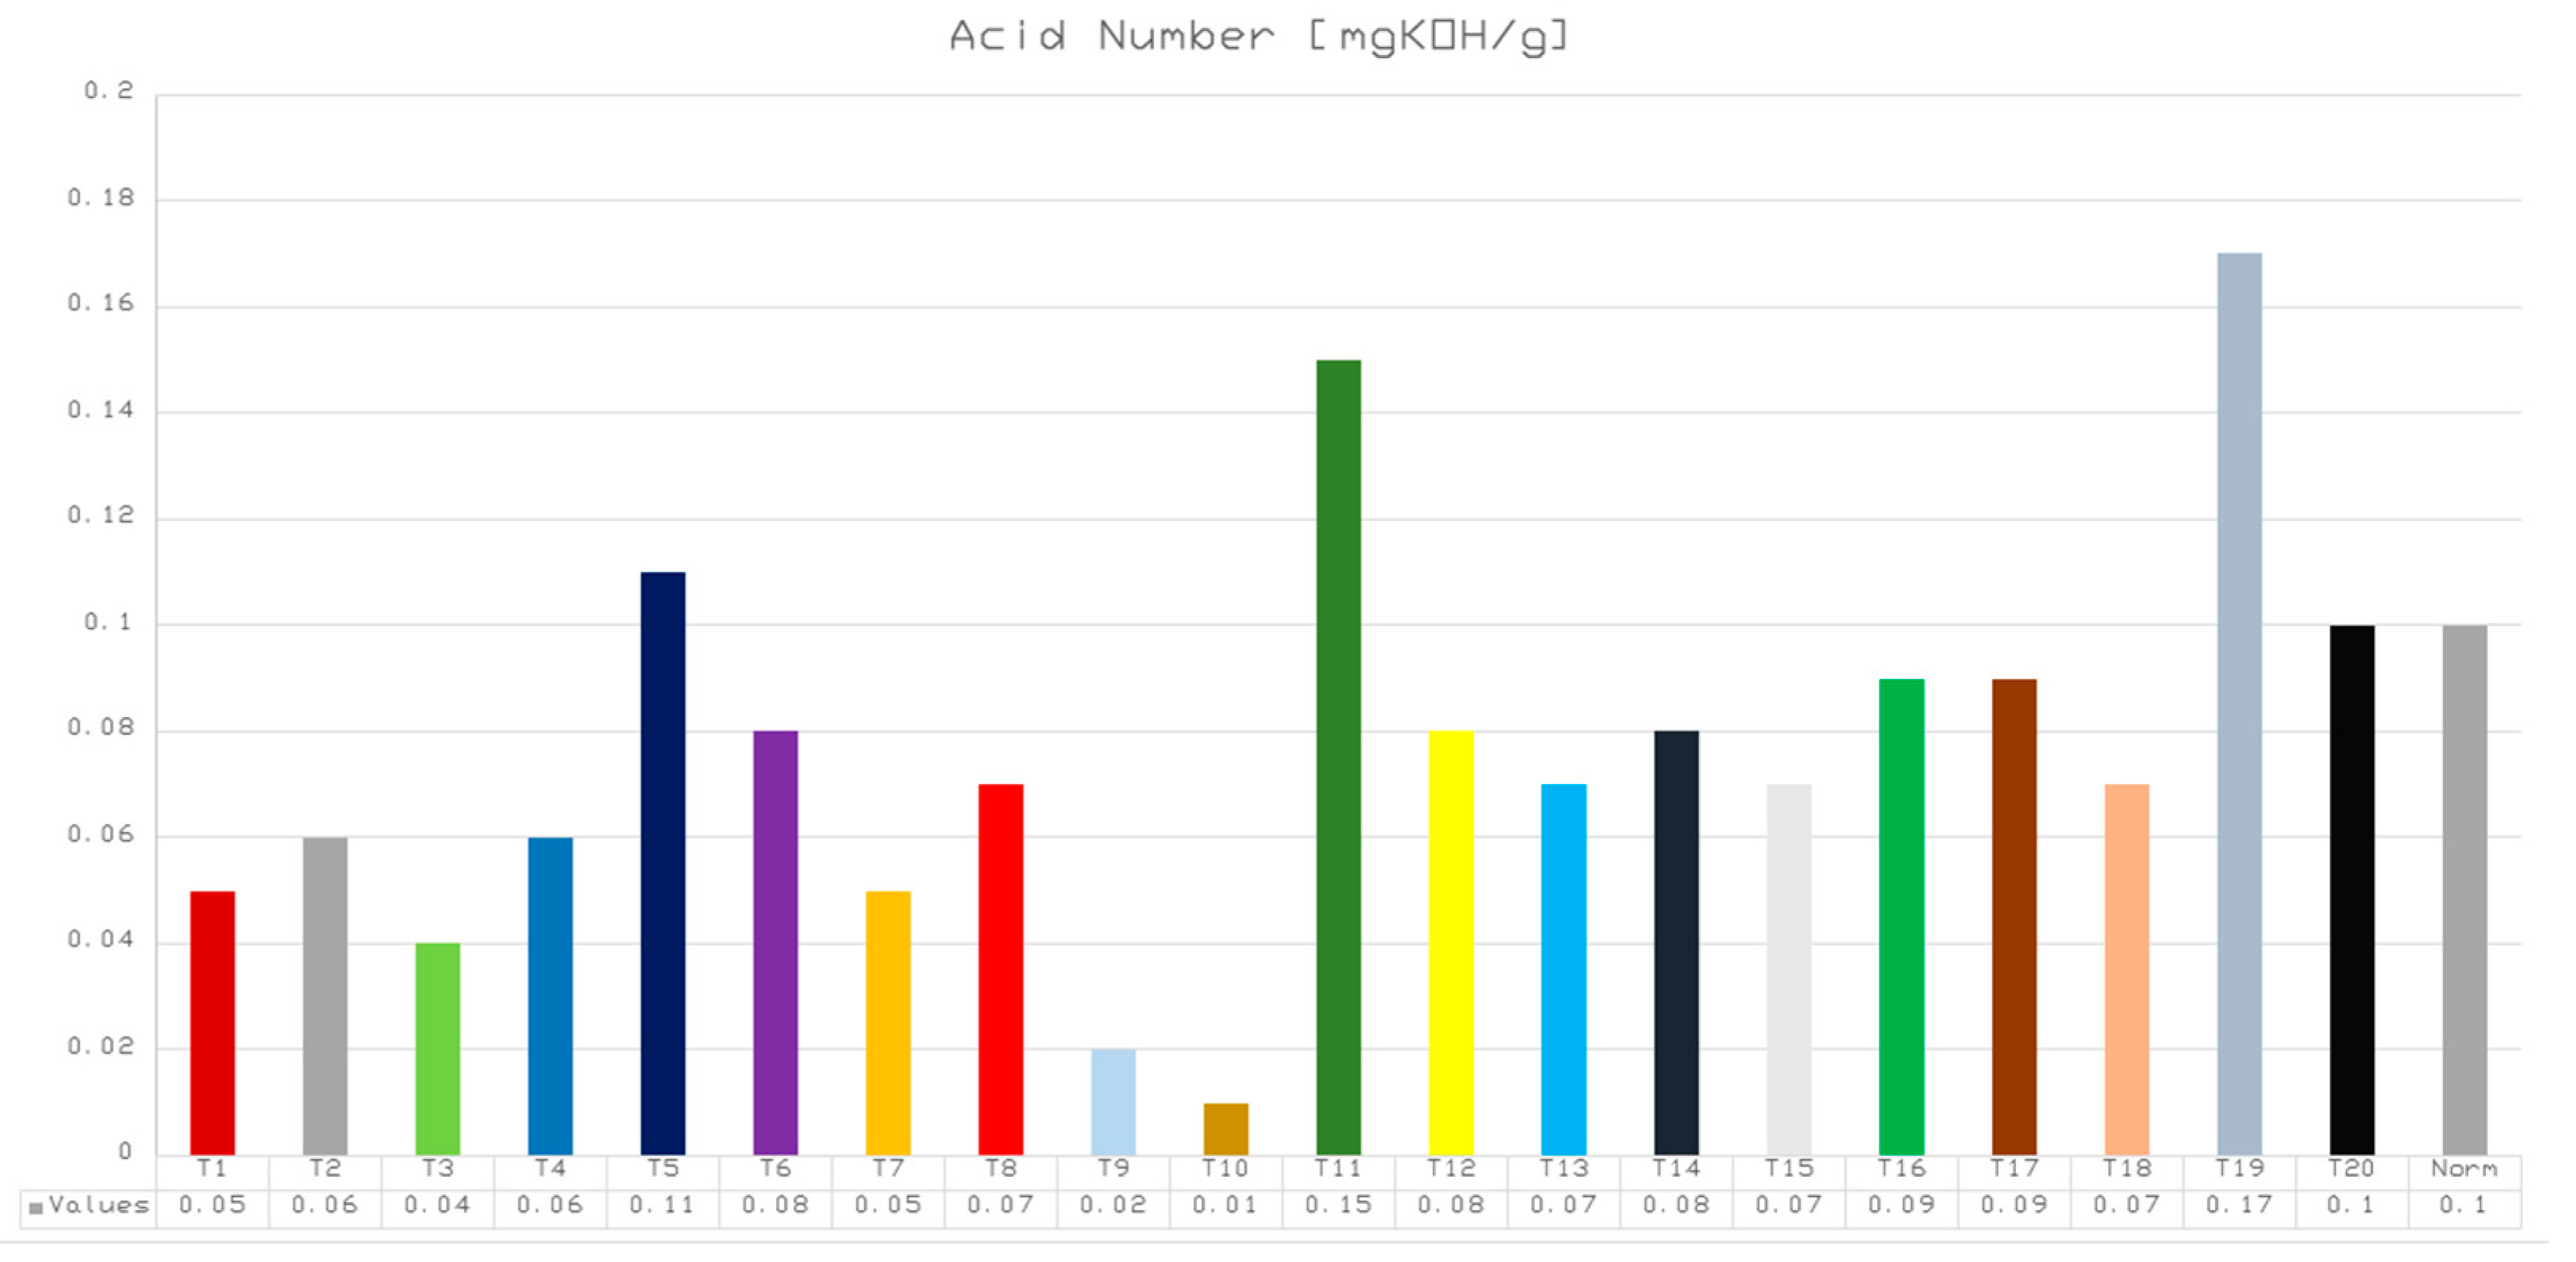
  • Measurement of acid number of the transformer oil according to IEC 62021-1 Insulating liquids—determination of acidity—part 1: automatic potentiometric titration [33];
  • Measurement of corrosive sulfur of transformer oil according to ASTM D1275-15 Standard test method for corrosive sulfur in electrical insulating liquids;
  • Estimation of water content in insulating paper according to IEC 60,814 [29];
  • Dissolved gas analyses of the transformer oil IEC 60,599 [32];
  • Dissolved furans analyses of the transformer oil IEC 60,567 [32].

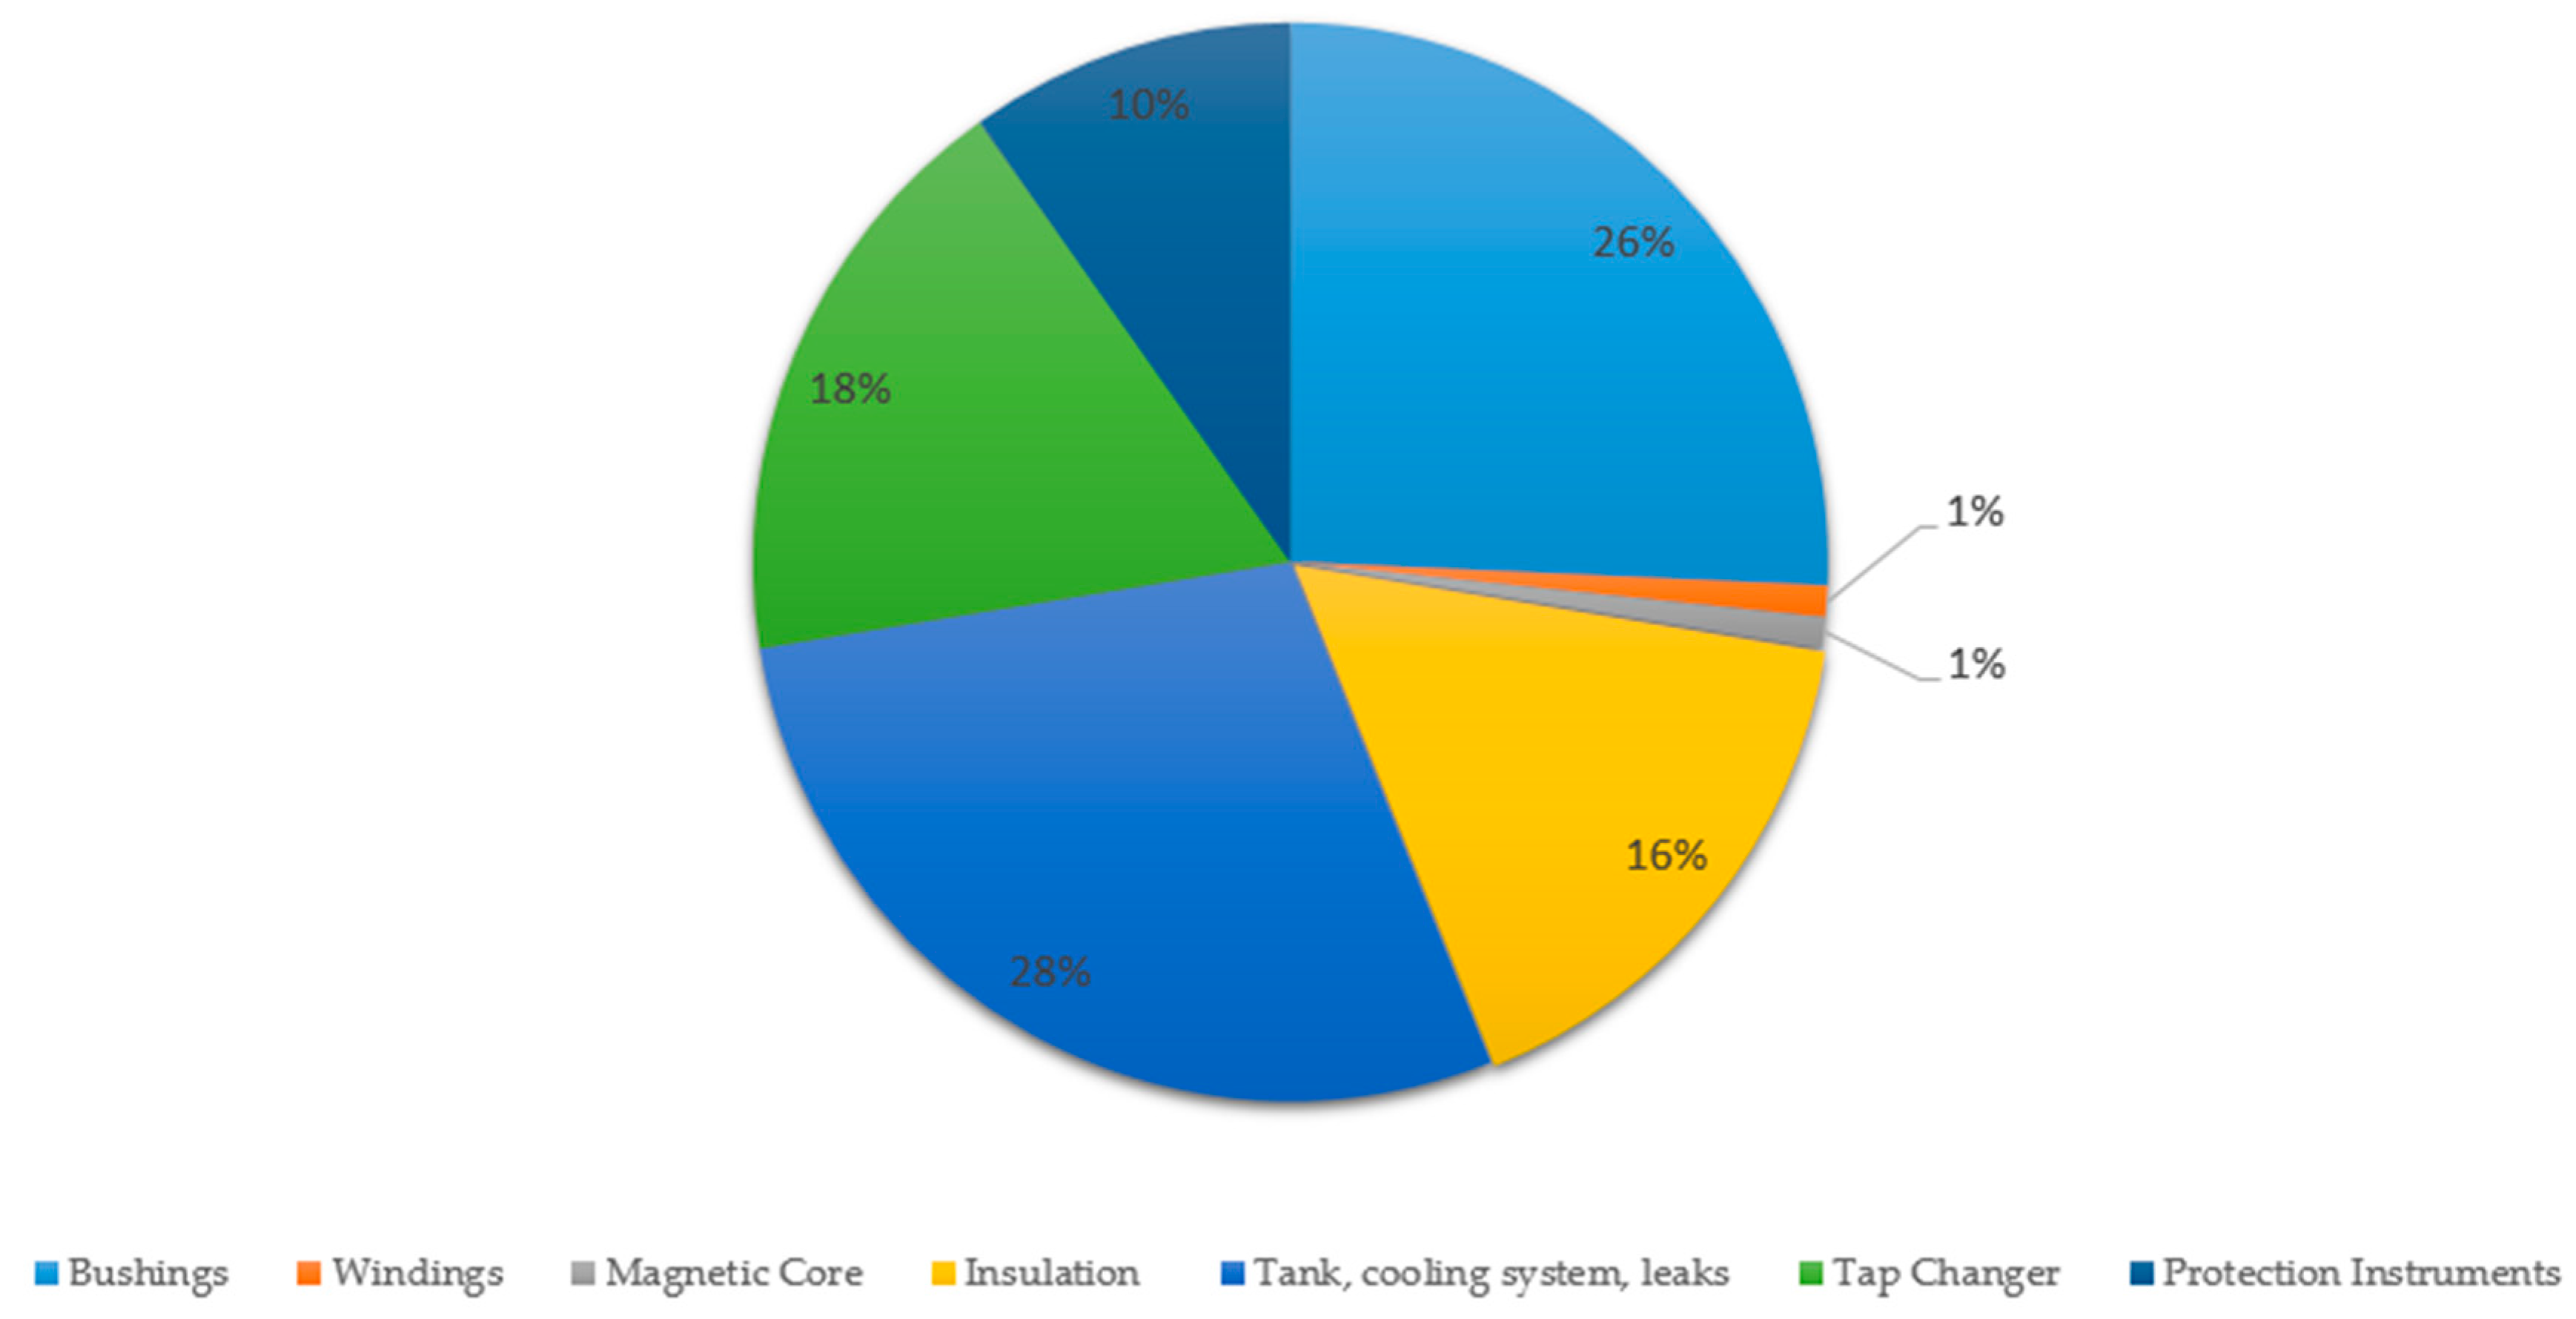
2.2. Visual Inspection Diagnostics Were Conducted on All Accessible Systems of the Transformers

  • Cooling system;
  • Bushings;
  • Tank, conservator and valves;
  • Protection instruments: breathers, Buchholz relays, temperature indicators, pressure relieve systems, magnetic oil levelers, gas relays.

2.3. Analysis of the Data Consisted of Several Methods for Assessment

Analysis of the current condition of the transformers based on oil tests and DGA results:
  • Chemical analysis of transformer oil was carried out to determine some of its parameters which are vital for the technical operation of the equipment these included the following:
    Chemical parameters: water content, corrosive sulfur and acidity number [30,31];
    Electrical parameters: dielectric strength, specific resistance and dielectric dissipation factor (tan δ) [30,31].
    Each of these parameters has an impact on the quality and longevity of transformer oil, as well as on its insulating properties. As for the chemical parameters, excessive water content in transformer oil could lead to a reduced dielectric strength. The content of corrosive sulfur in transformer oil forms an acidic environment in the transformer oil, which leads to increased decomposition of paper insulation and the oil becoming more acidic. The acidity number is a very important parameter that characterizes the quality of transformer oil. It determines the degree of acidity of the transformer oil. The greater the number, the more acidic is the oil. This leads to increased decomposition of paper insulation and to better dissolution of water in oil so that the dielectric strength also decreases [27,28,30,31].
    Electrical parameters include the dielectric strength of the transformer oil, which indicates the maximum applied voltage which the oil will withstand as an insulator; specific resistance, which again reflects the insulating properties of transformer oil; and dielectric dissipation factor (tan δ), which reflects the quality of the transformer oil as an insulator and the level of losses when voltage is applied across it [27,28,30,31].
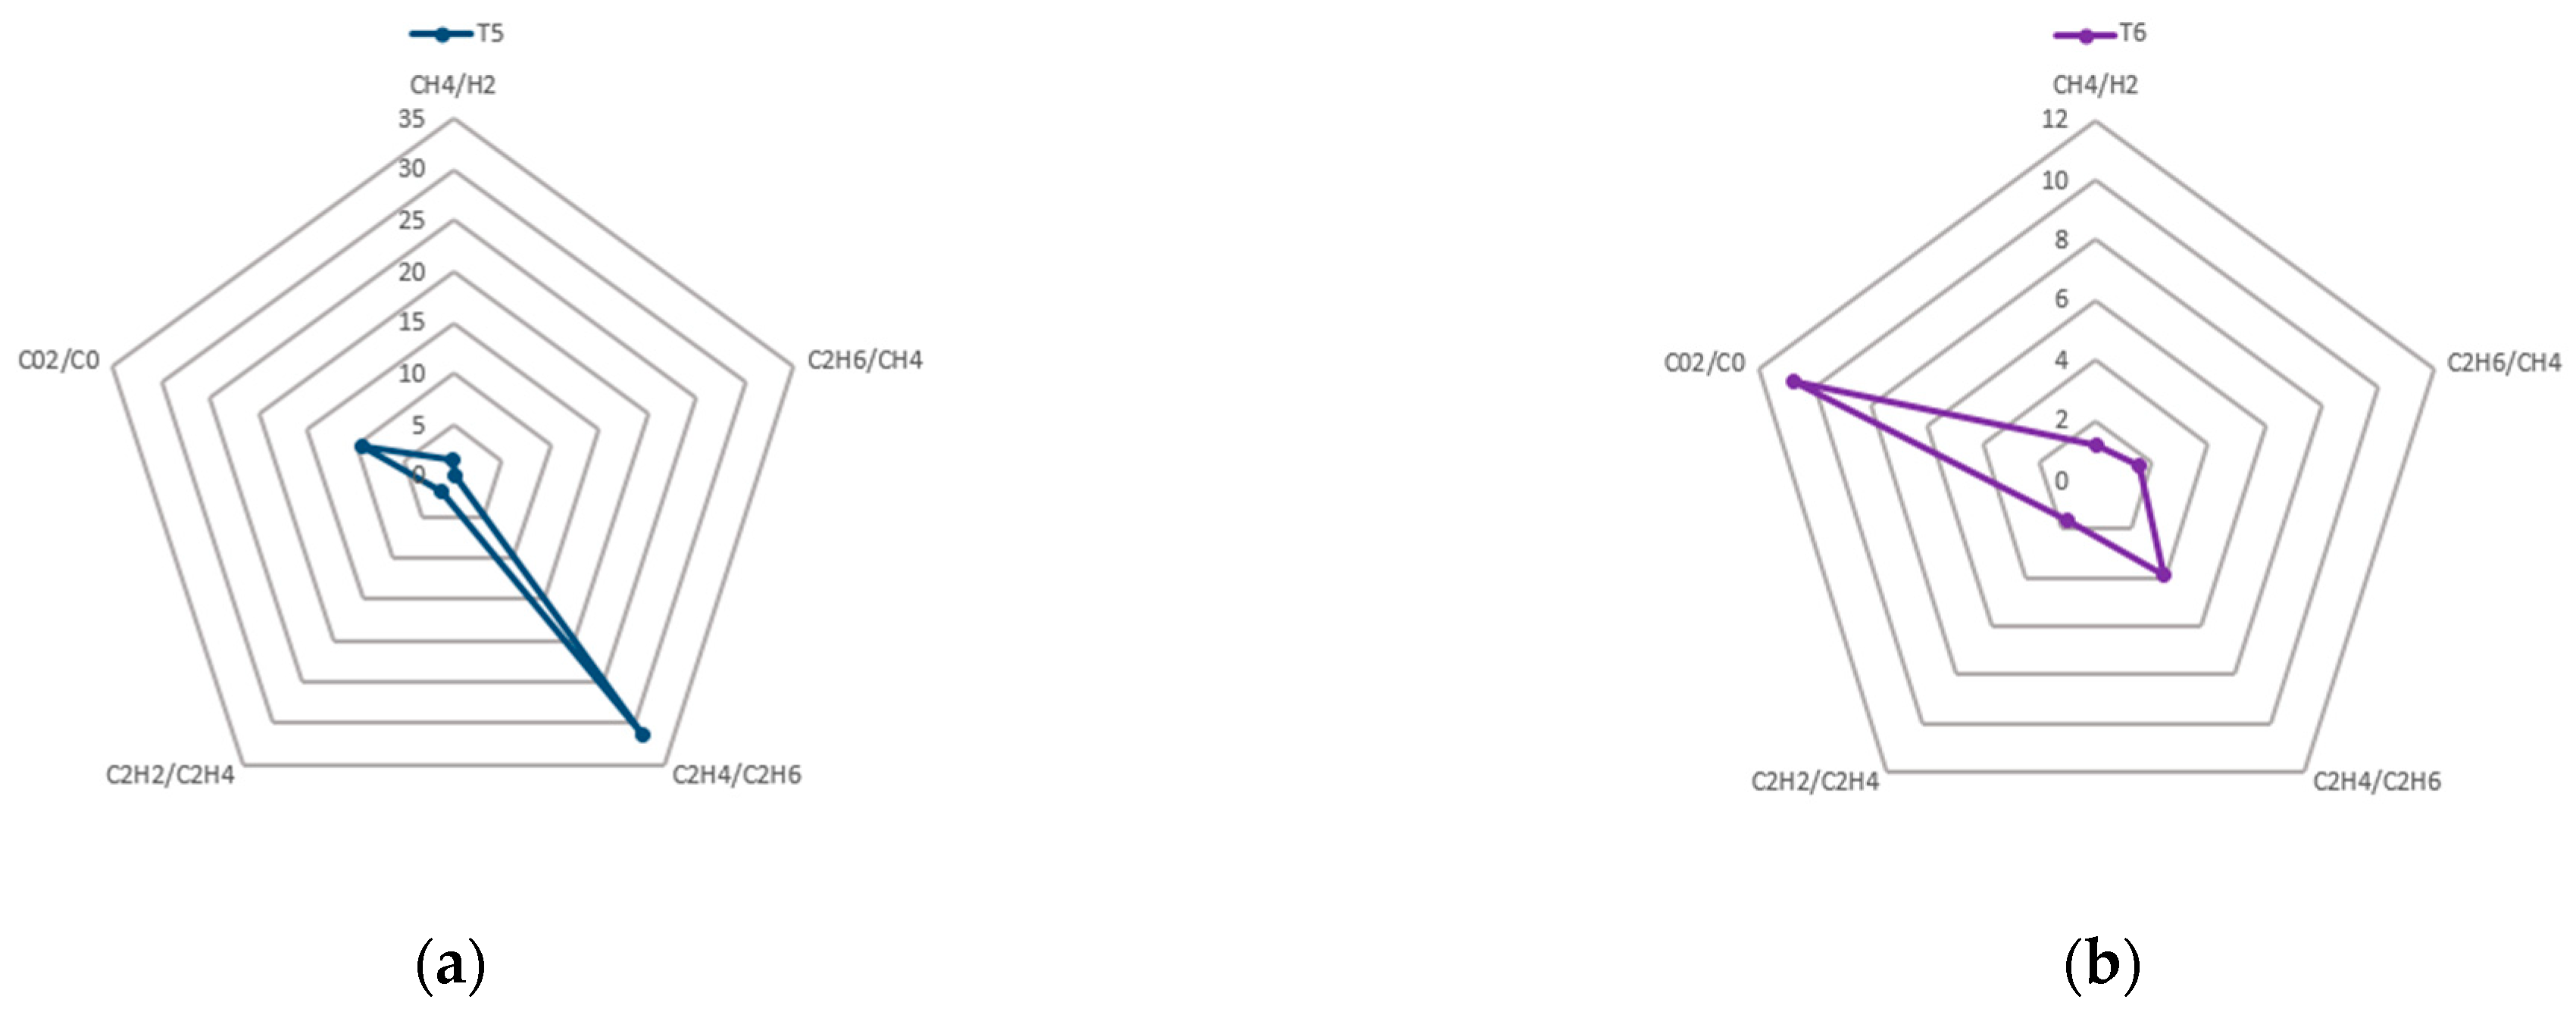
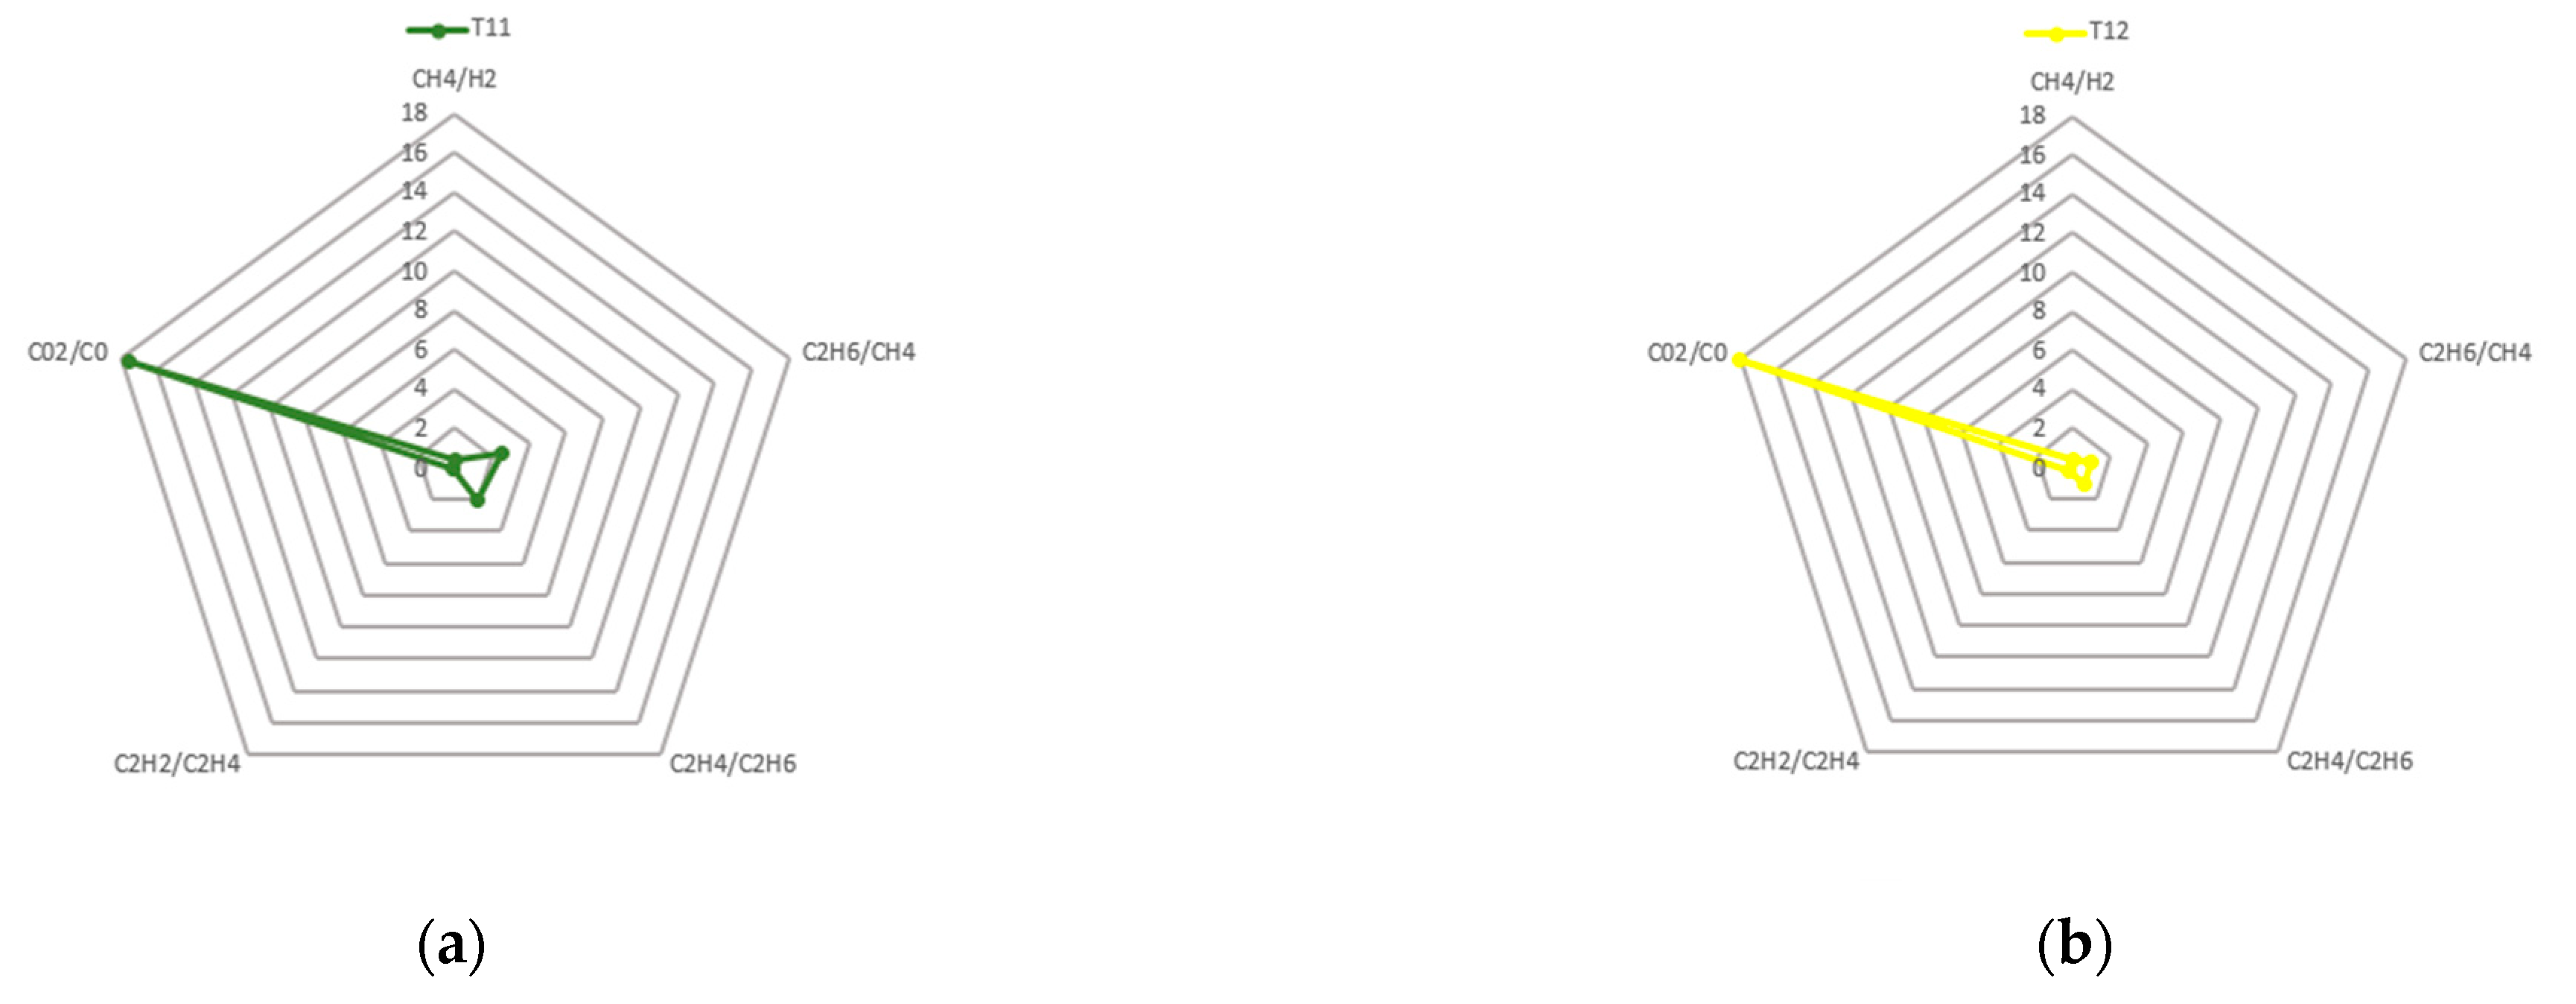
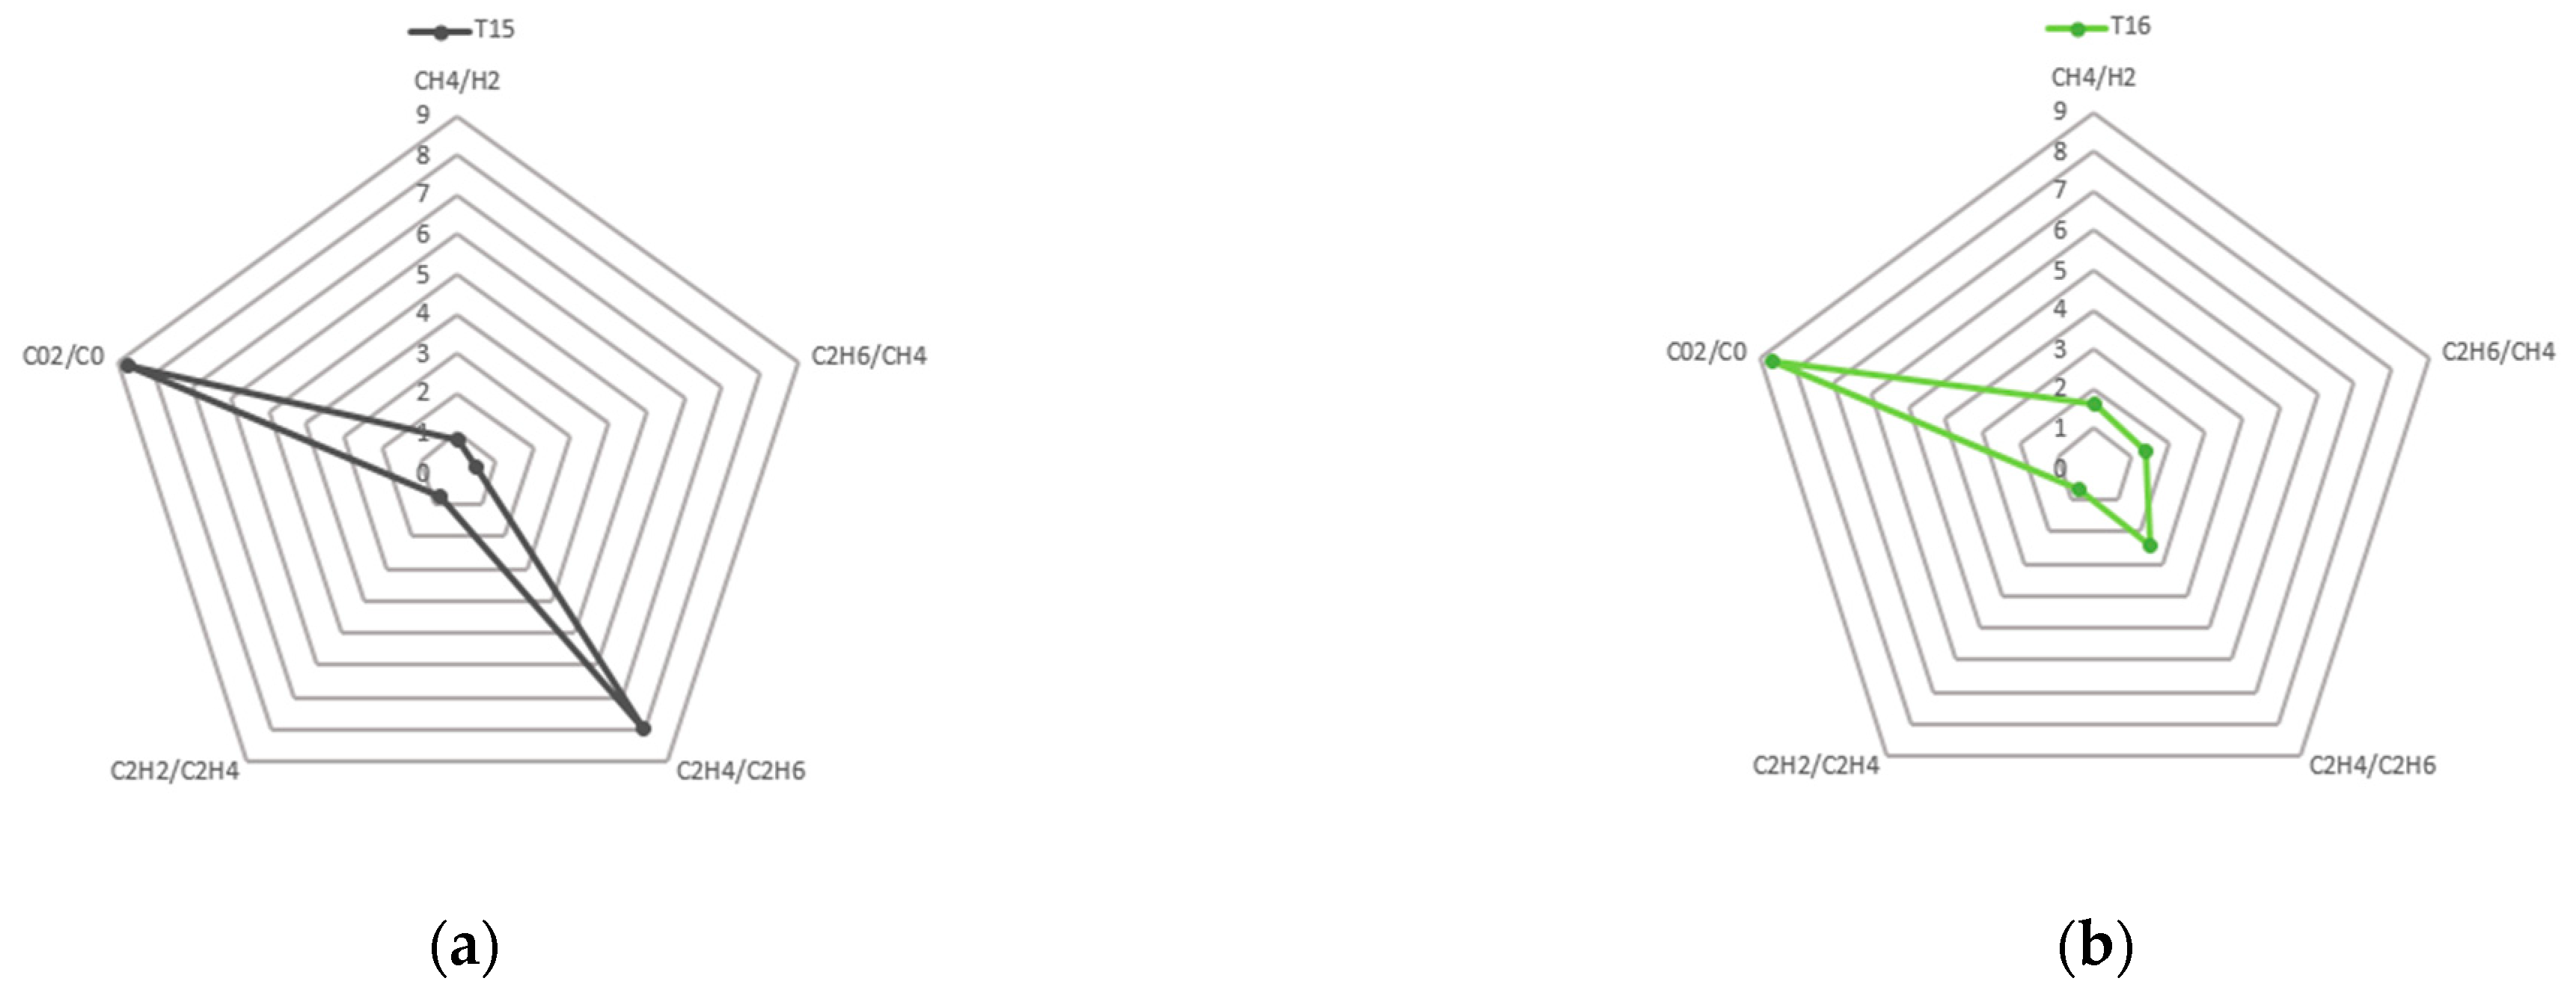
  • During operation, power transformers generate decomposition gases which originate mainly from the organic insulation. The process of gas generation is due to thermal or electrical stresses, and decomposition of the transformer oil or the insulating paper. This could result from the normal exploitation of the transformer, or it could be caused by an emergency with the equipment. A certain amount of the generated gases dissolve in the transformer oil [22,26,27].
    Dissolved gas analysis (DGA) is a method used for analyzing the quantity of dissolved gases in transformer oil and afterward for making diagnostics of the transformer. This method is useful for detection of certain faults (thermal or electrical) and for monitoring the normal operation of transformers [32].
    There are various approaches for interpretation of the DGA. Generally, a combination of them is used to determine the source of gases. These methods include the identification of key gases (H2, CO2, CO, CH4, C2H4, C2H6 and C2H2) and their quantity in the oil. Increased content of more than one of these gases could be an indication for a problem. If so, the gas ratio should be determined. Then, a method for interpretating gas ratios proposed in IEC 60,599 could be used to determine the problem. Alternately, the Duval’s triangle also could be used as a method for interpretation of the results. In these methods, the levels of the determined gas ratios suggest a certain defect in the operation of the power transformer [27,32].
    Overall, the DGA has been used for many years, and it is a fairly accurate method for the diagnostics of transformers. It could also be employed for periodic tests, and a comparison between the results over time could be performed to follow the frequency of gas generation and determine the actual state of the transformer [32].
Analysis of the condition of the transformers through algorithms
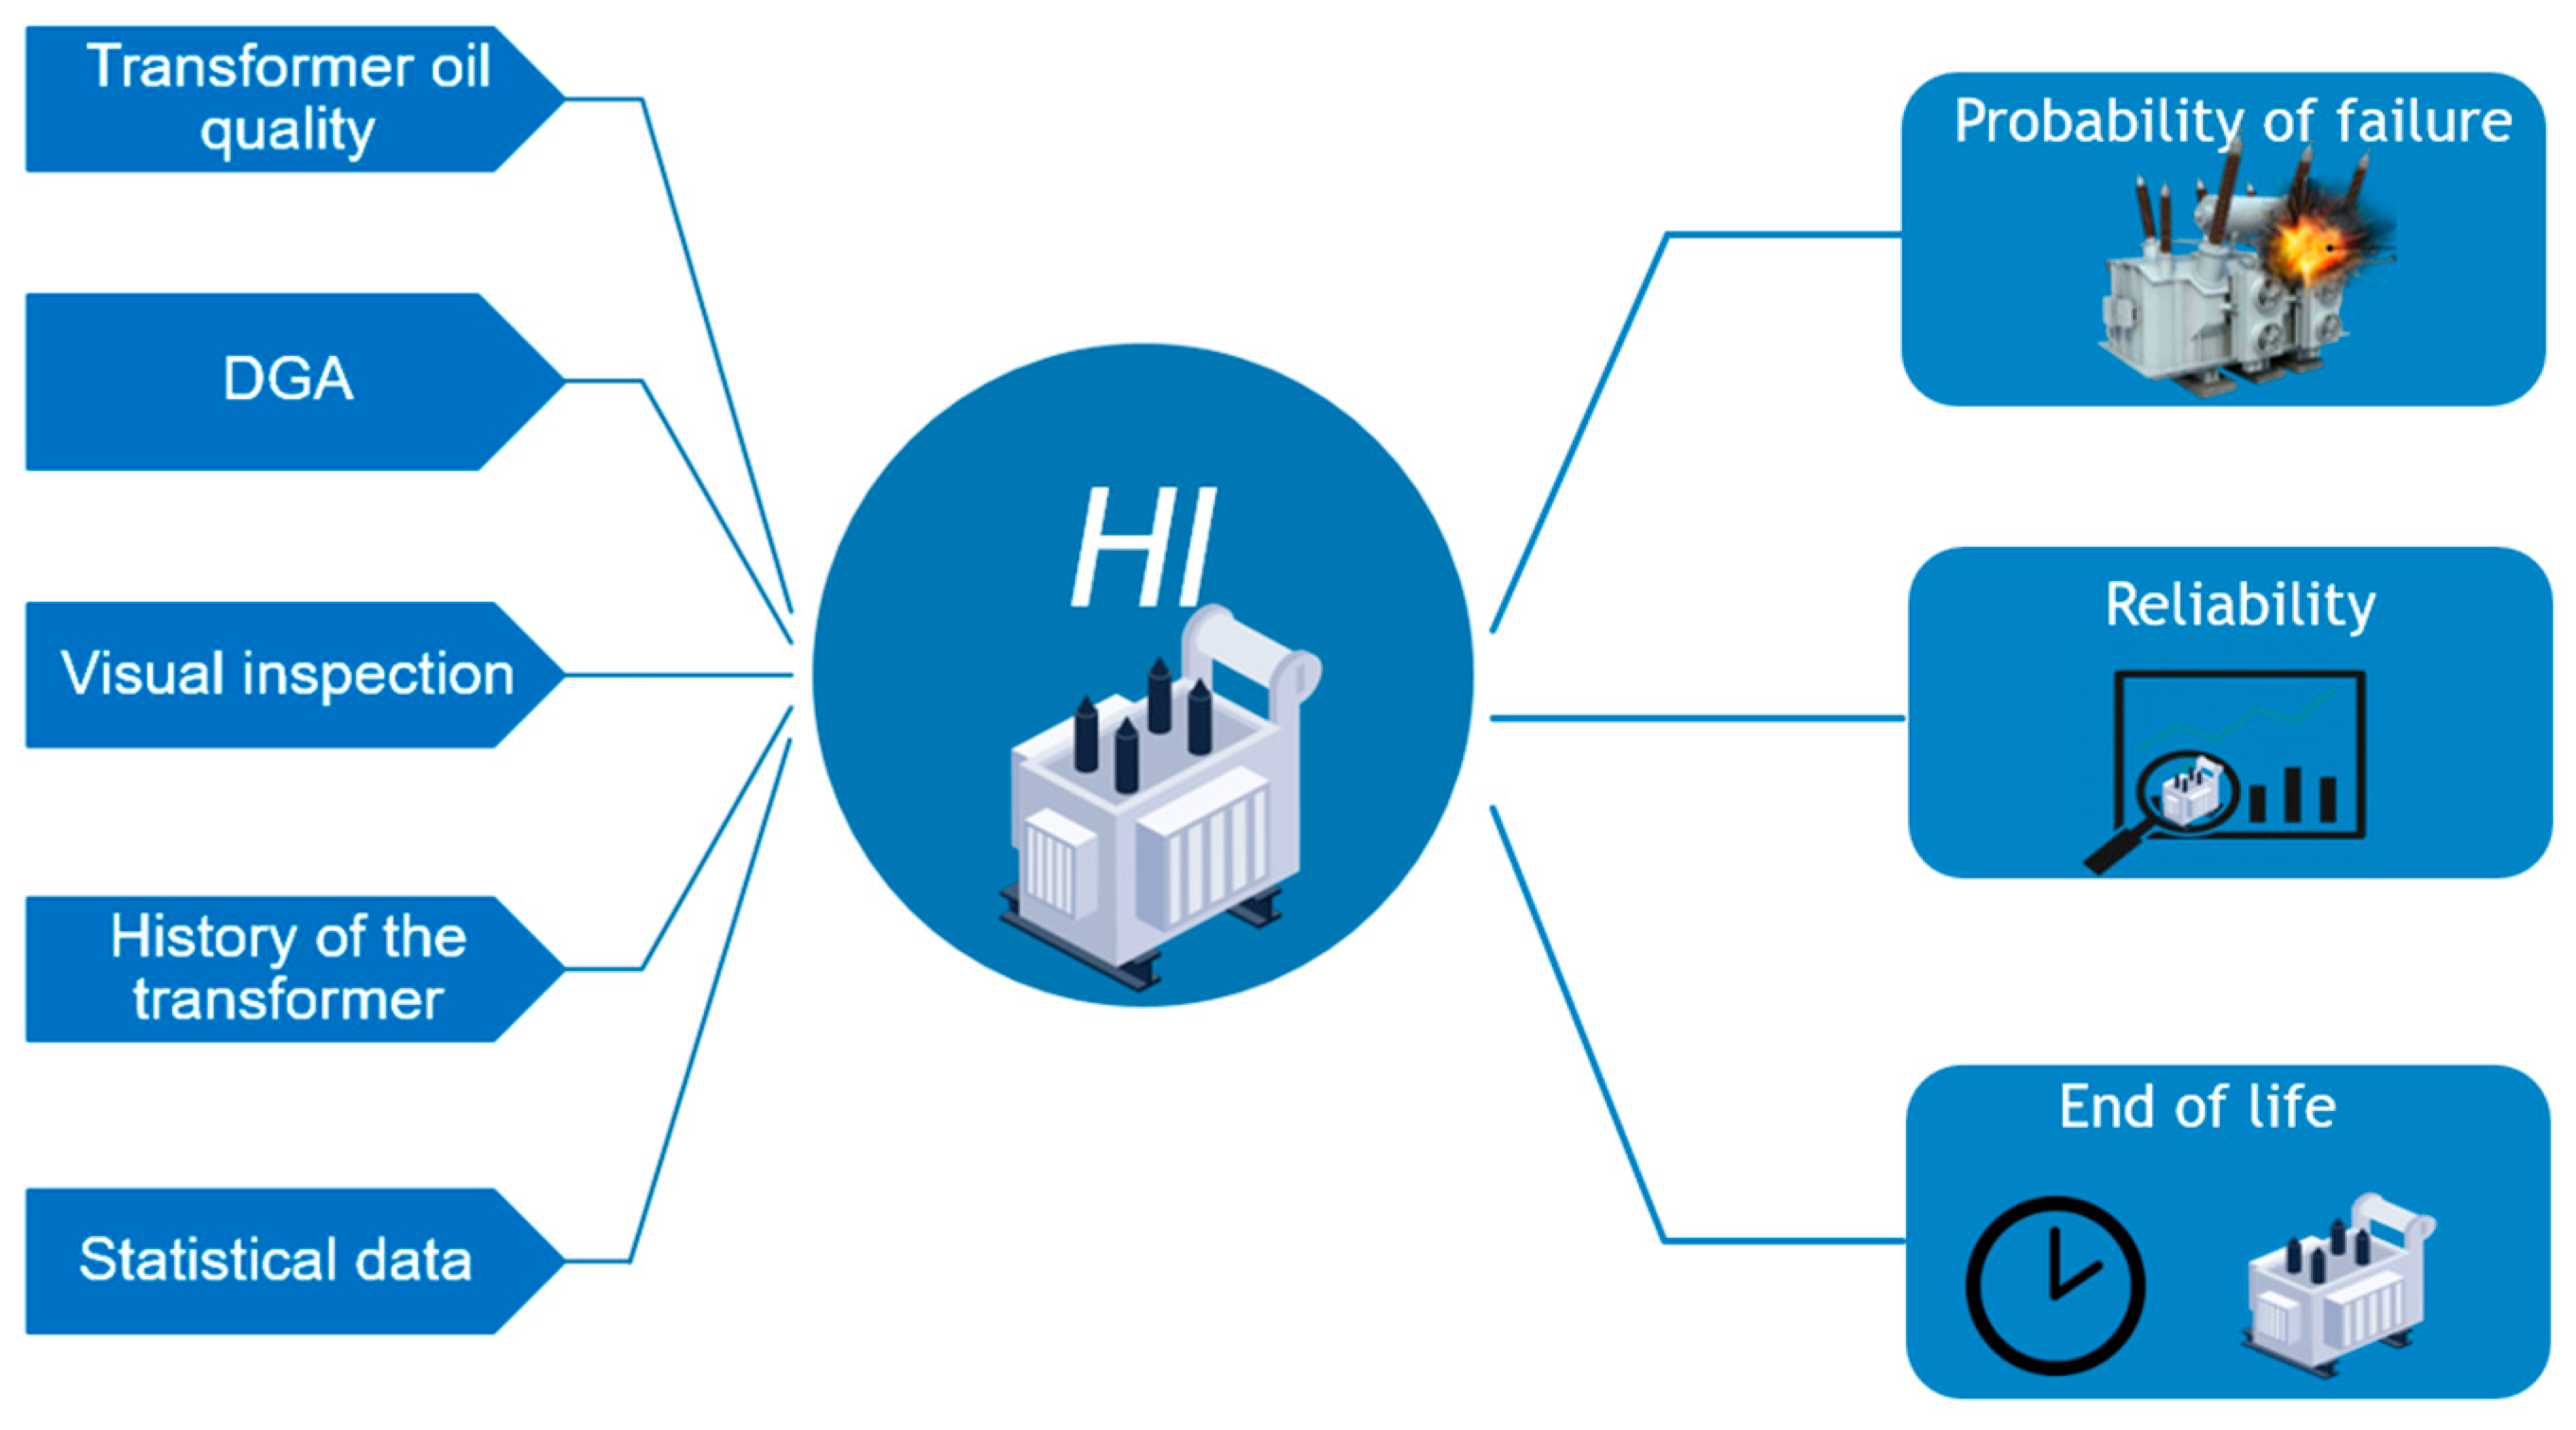
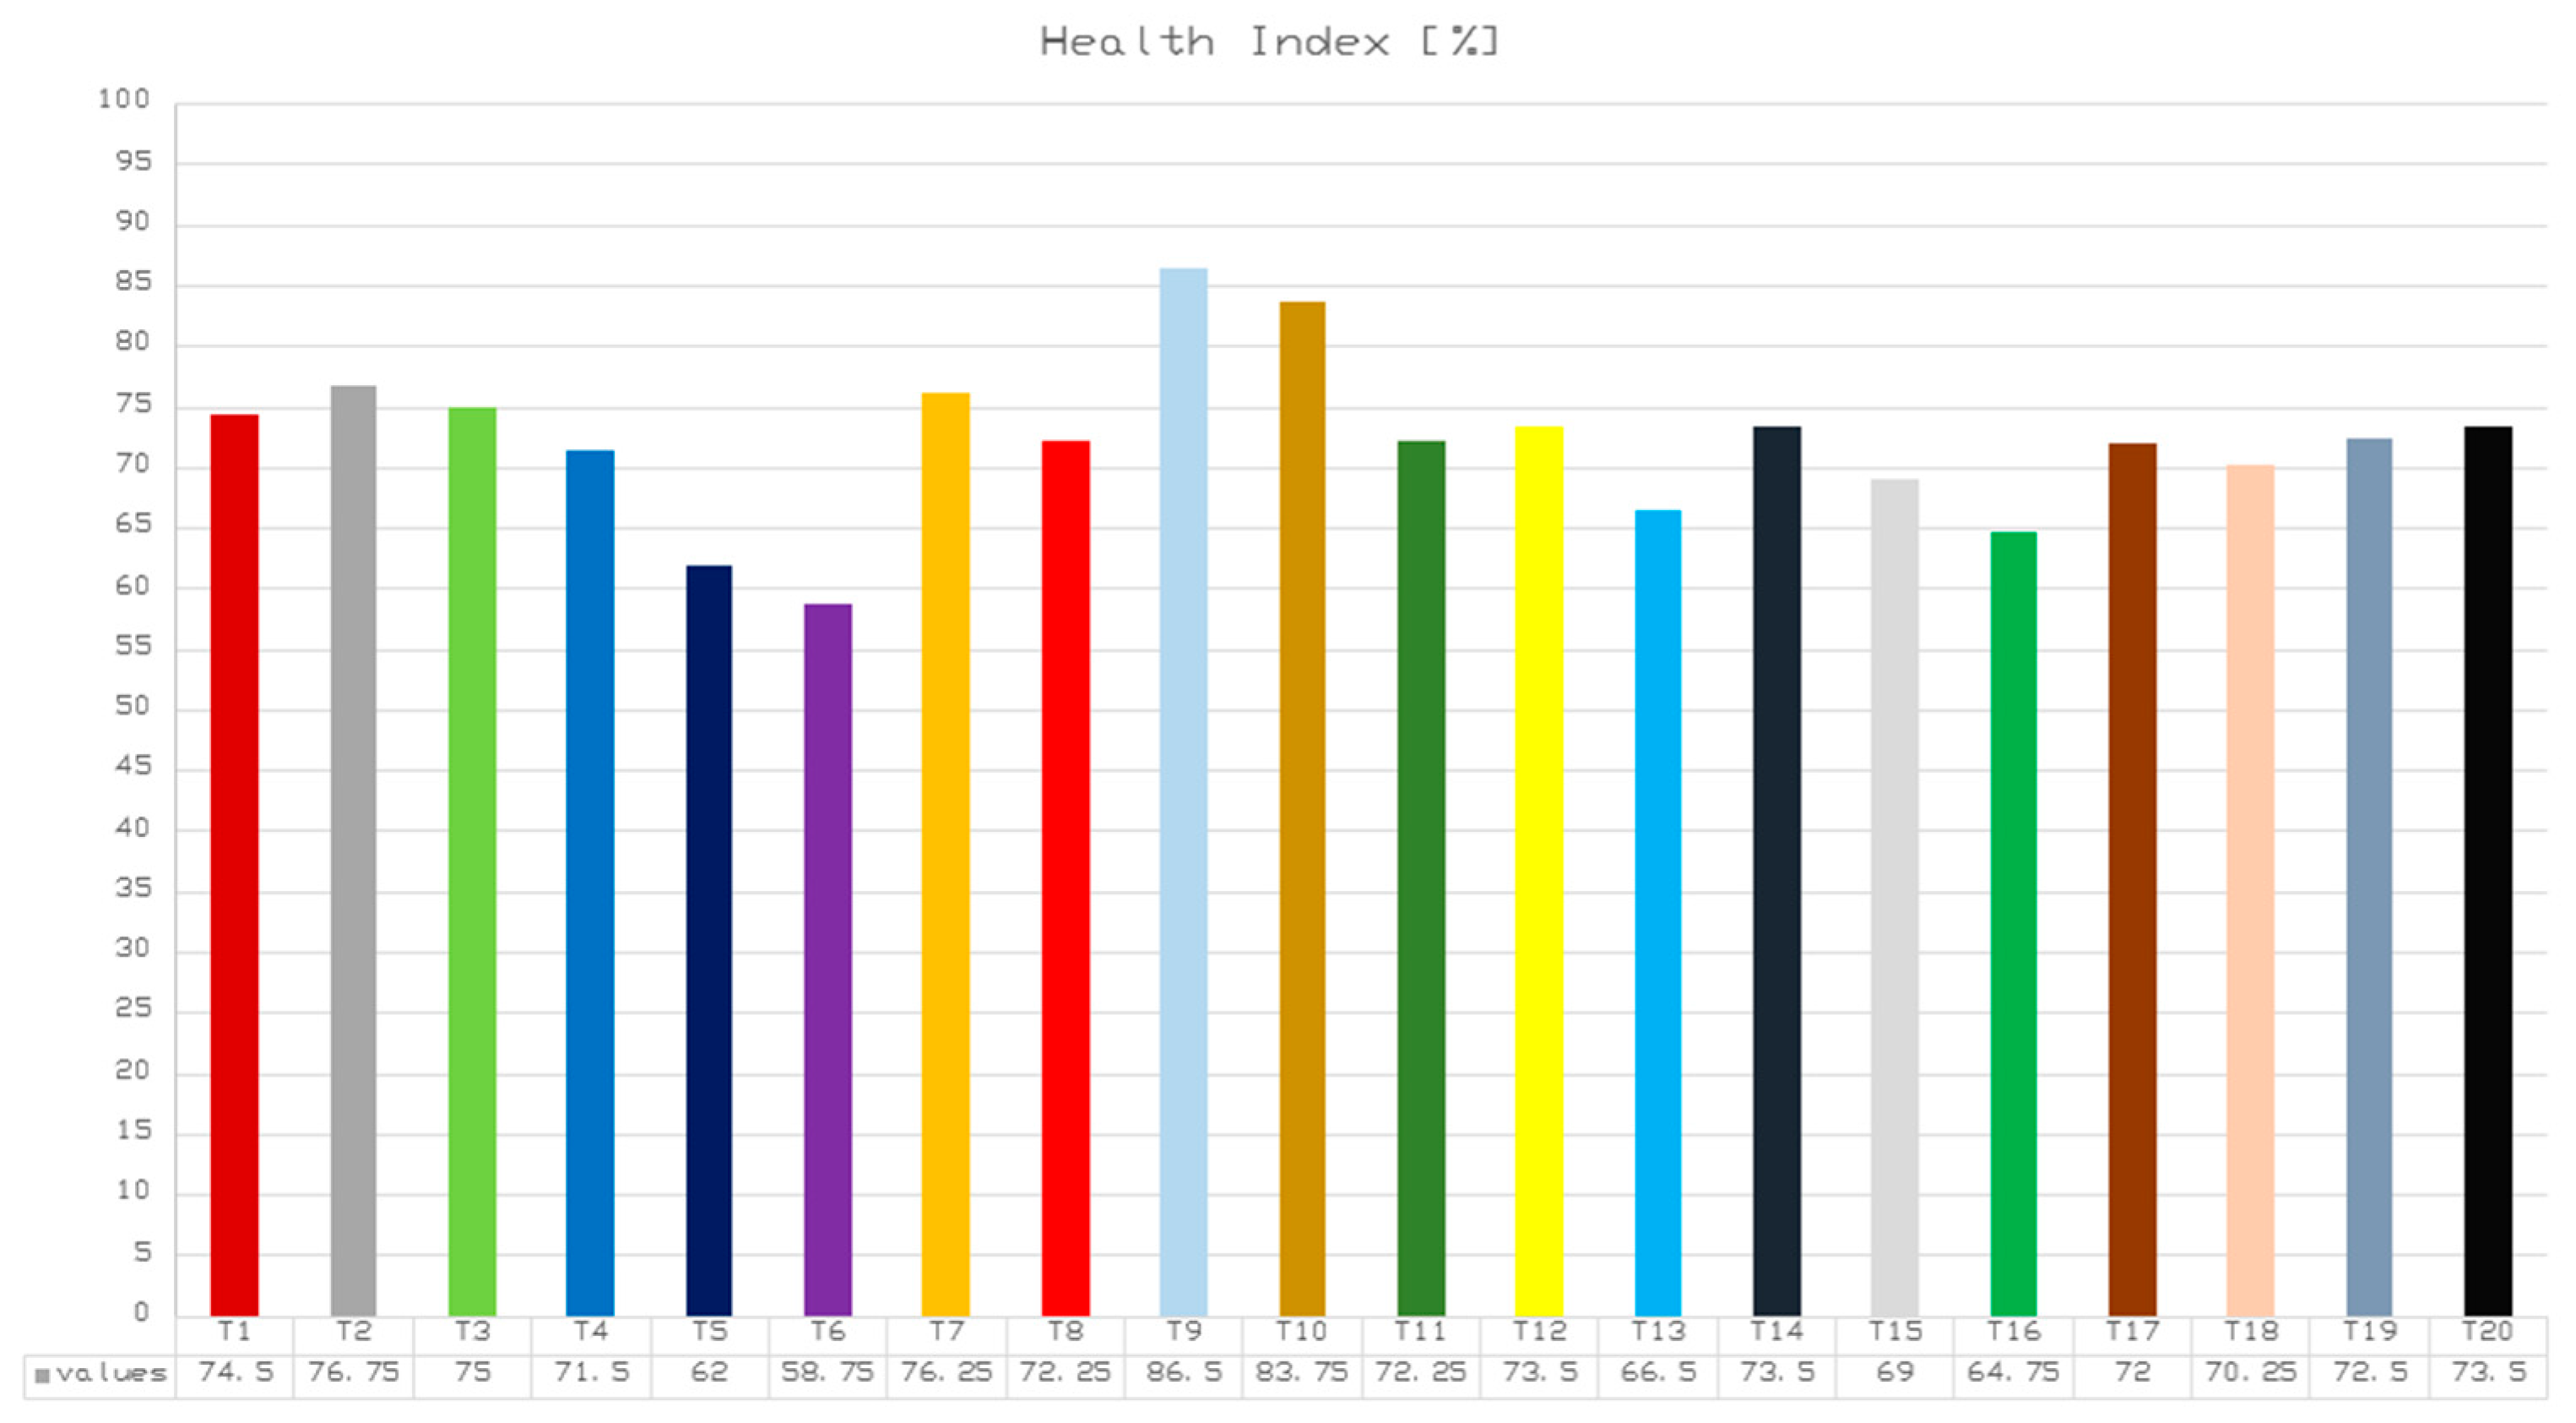
  • This analysis involved calculations of the health indexes (HI) of transformers based on collected and measured data. To be able to obtain an overall picture of the condition of the transformer, measurements based on an approach with weighting coefficients is applied, through which is calculated a total HI factor [1,2]. In Figure 3 is shown calculation of HI components and results.
The applied method included the following steps:
Evaluations of the measured results were converted into qualitative results, which ranged from A “Excellent” to E “Very Poor” condition; all measurements and findings were classified according to their significance by weighting coefficients; forming a general HI of each transformer; total HI was normalized to 100 based on the reported parameters; dominant factors were normalized to 100 [1,2].
H I = j = 1 n S j H I W j j = 1 n 4 S j .
Here, S is the weighting coefficient for each criterion; n is the number of criteria used; and HIW is coefficient scoring.
S and HIW are introduced in Table 2. The health index coefficients were graded and corrected using statistical data of faulty transformers of the same type and voltage class. In Figure 4 is shown the distribution of the most common faults in transformers in the database, which were used to adjust coefficients.
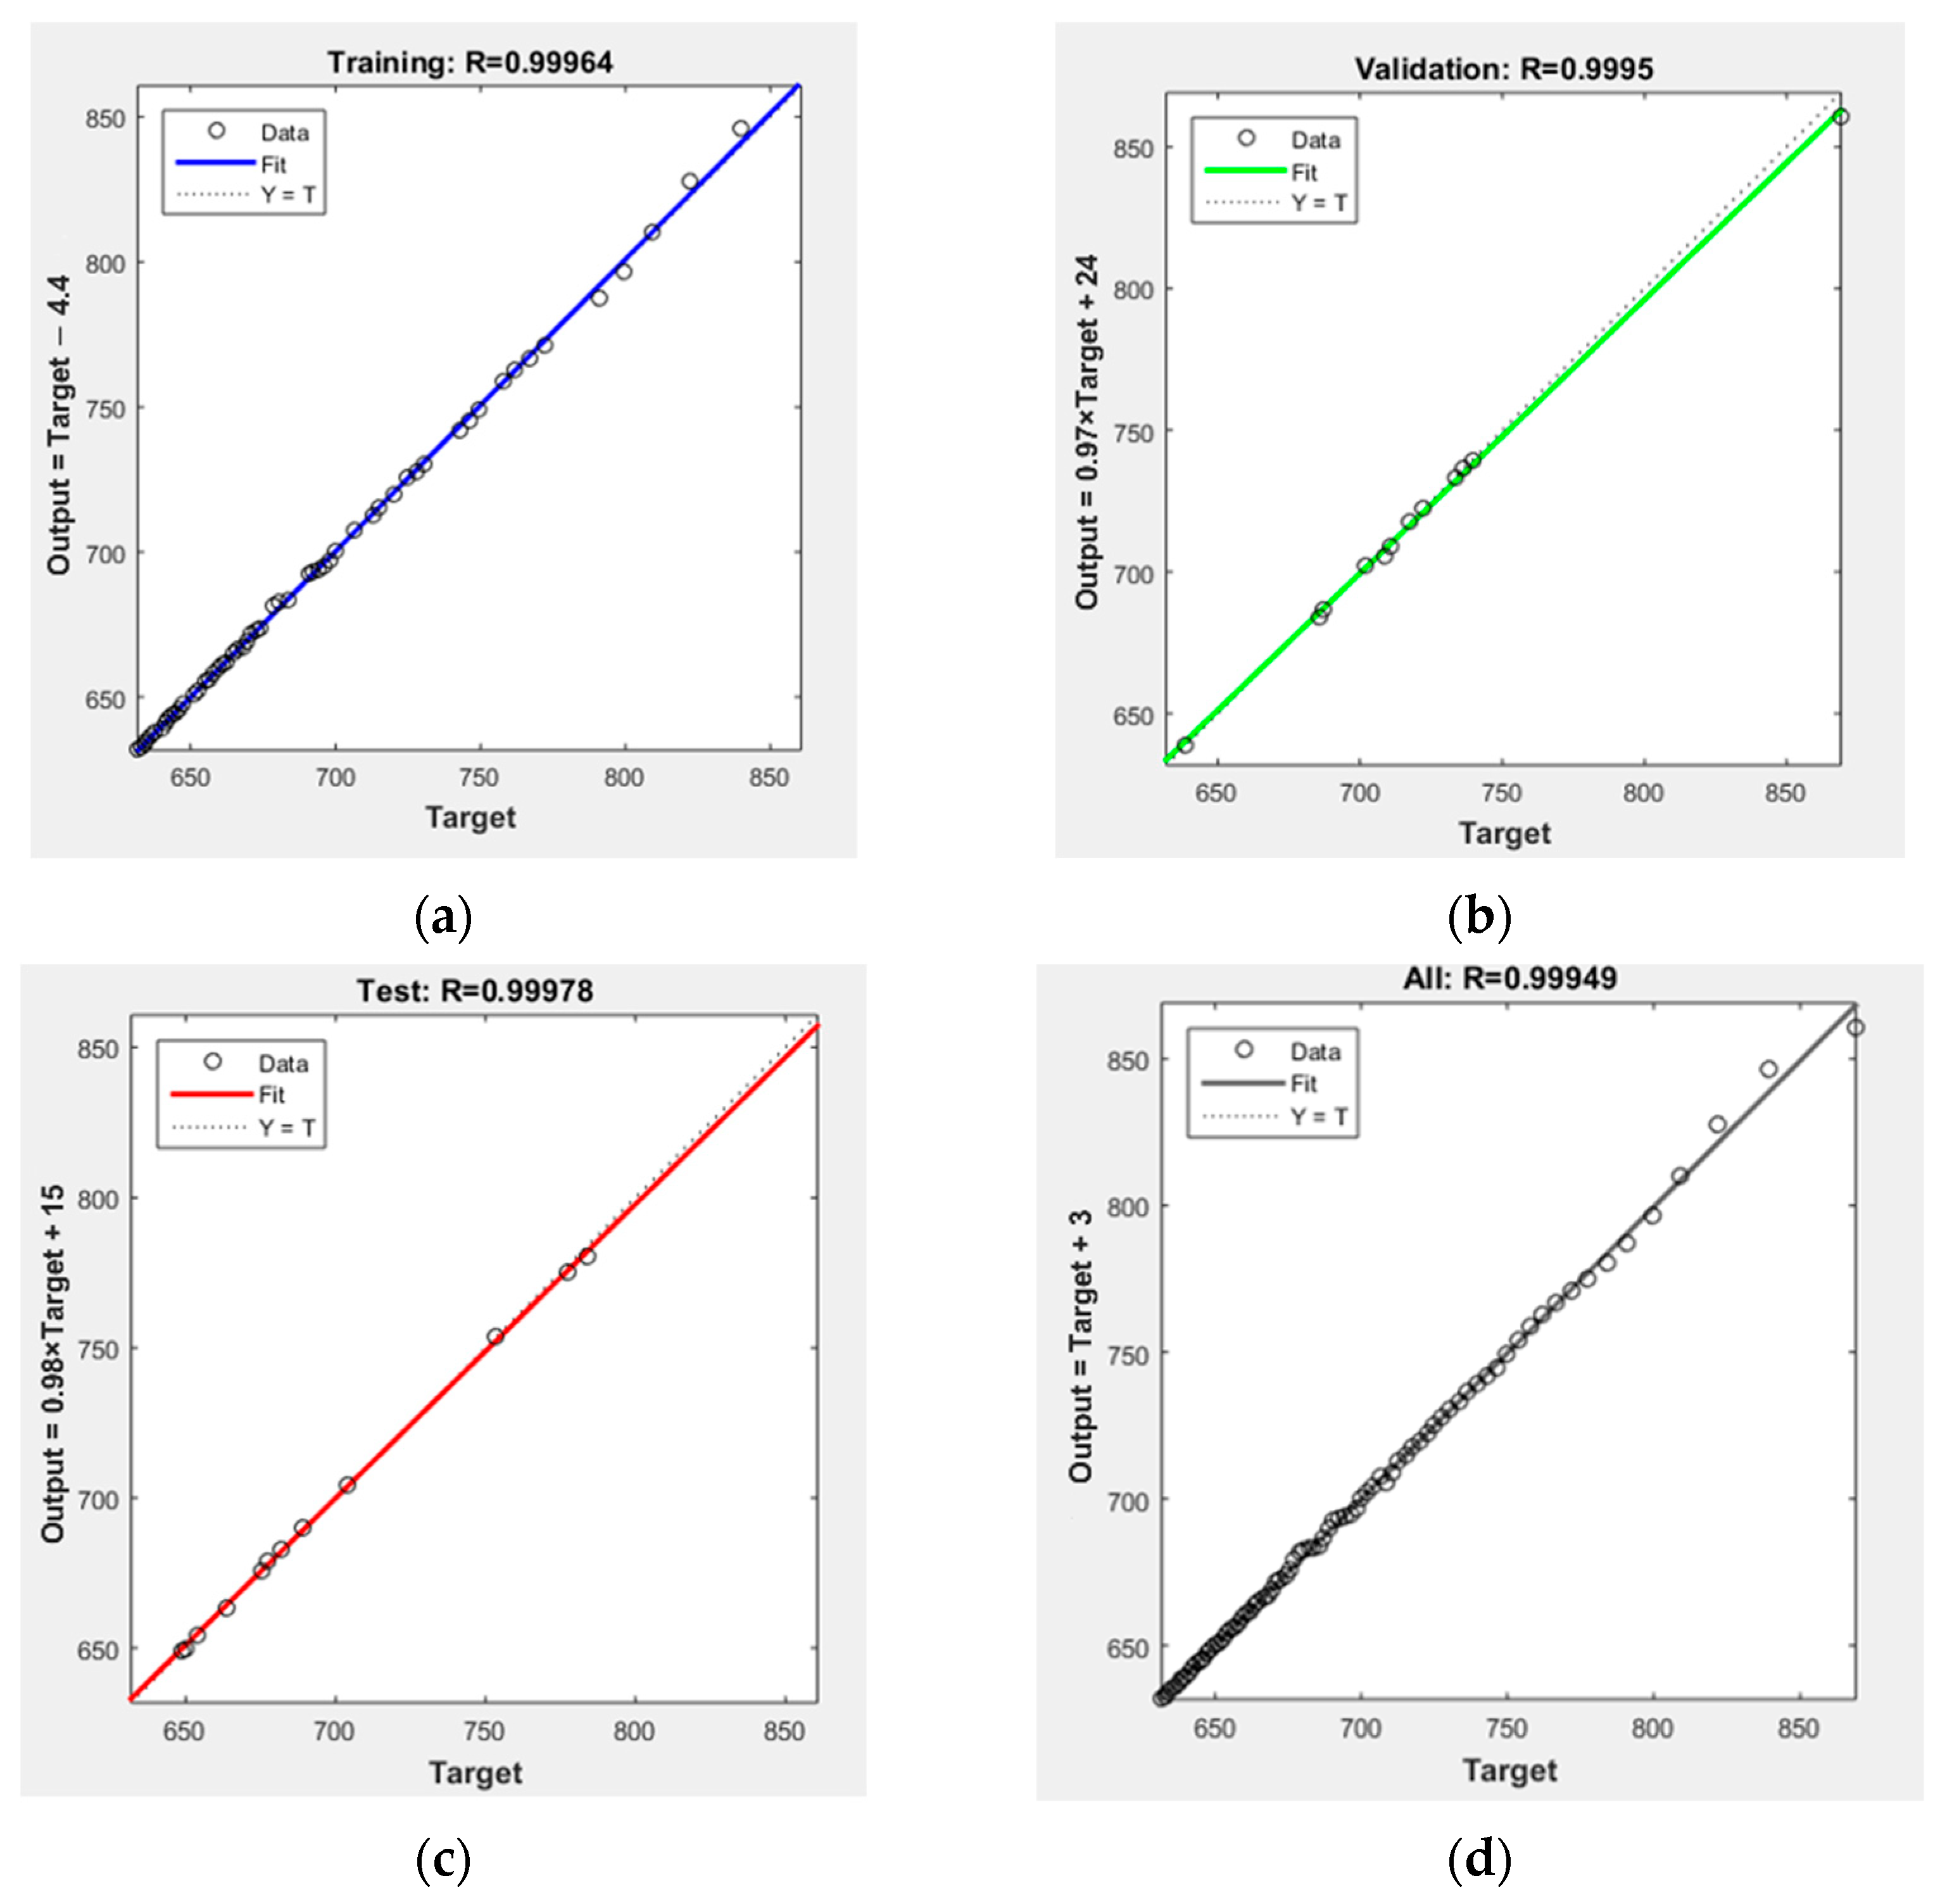
  • Analysis of the remaining life of the power transformer was based on the degree of polymerization (DP) of insulation paper. The DP was calculated using indirect methods via values of furans 2-FAL in the oil. Correct estimation of DP to 2-FAL was carried out by deploying an artificial neural network (ANN) with feed-forward. The created ANN was trained with raw data of previous direct paper measurements of DP to 2-FAL. The ANN was fed data for 120 correlations between 2-FAL and DP. In Figure 5 is shown the topology of the created ANN, and in Figure 6 and Figure 7 are given some results of trained neurons [10,35,43].
In Figure 6 are shown the parameters of the created ANN: training, validation, reaction and testing.
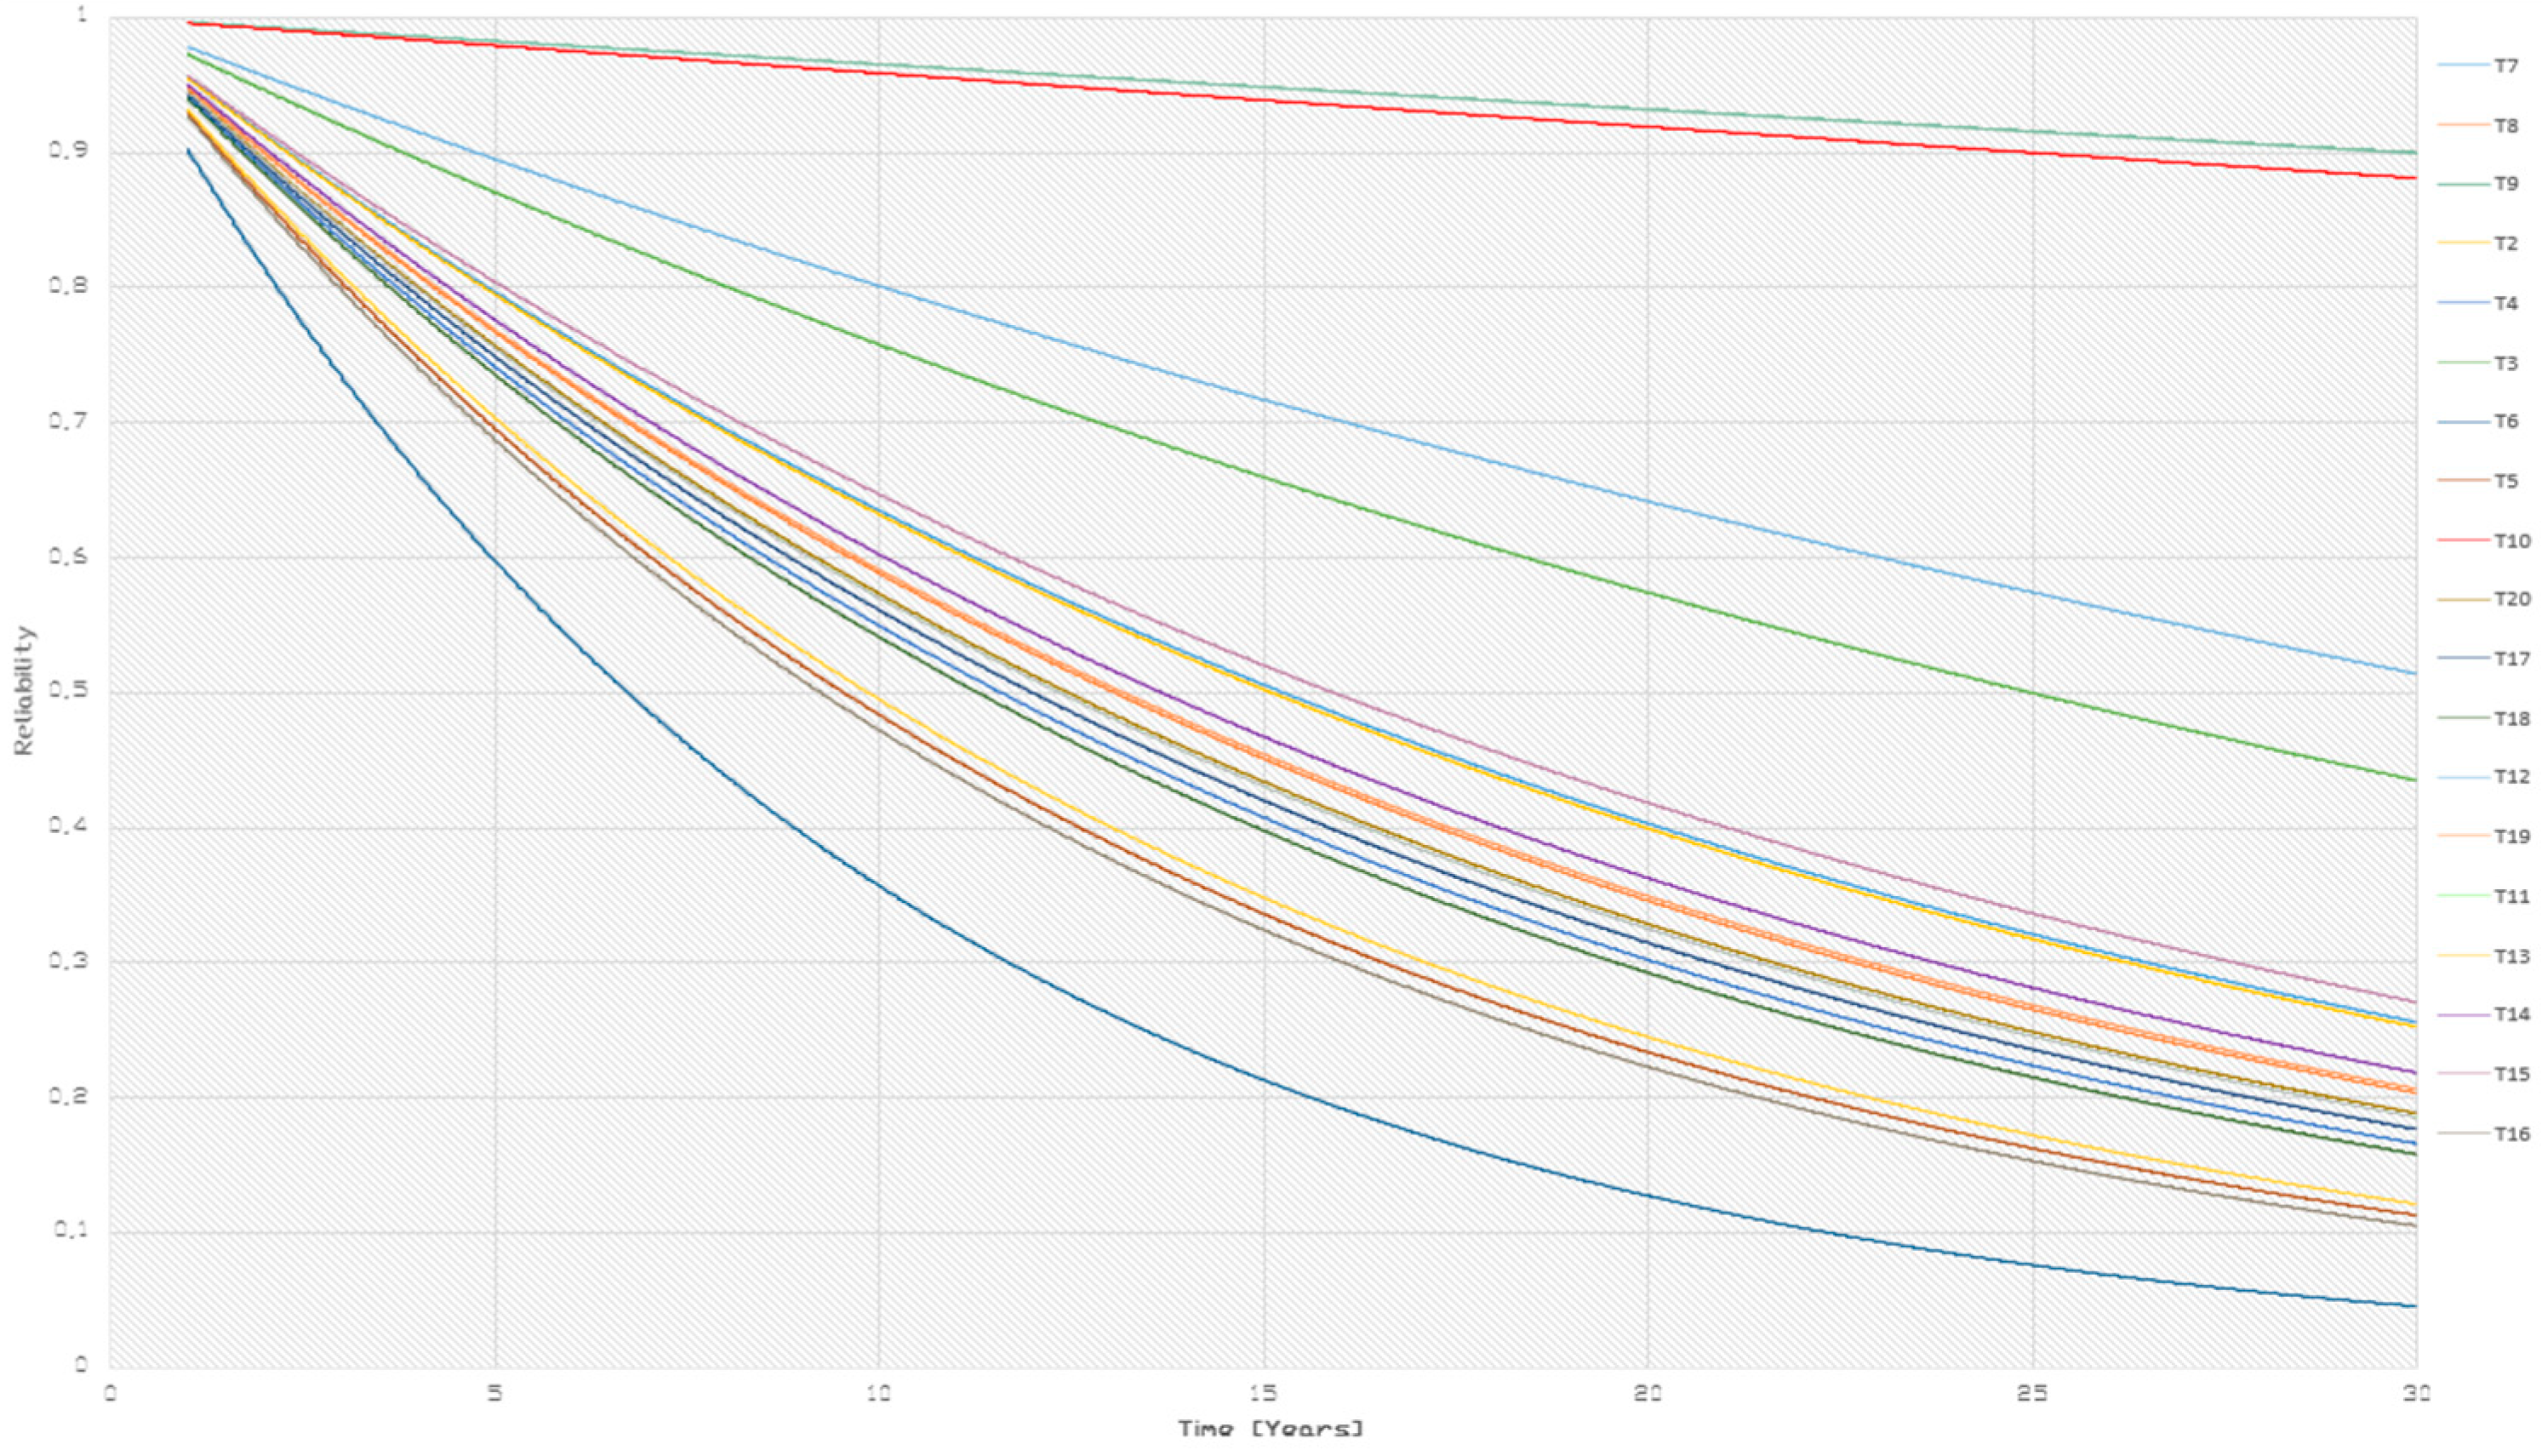
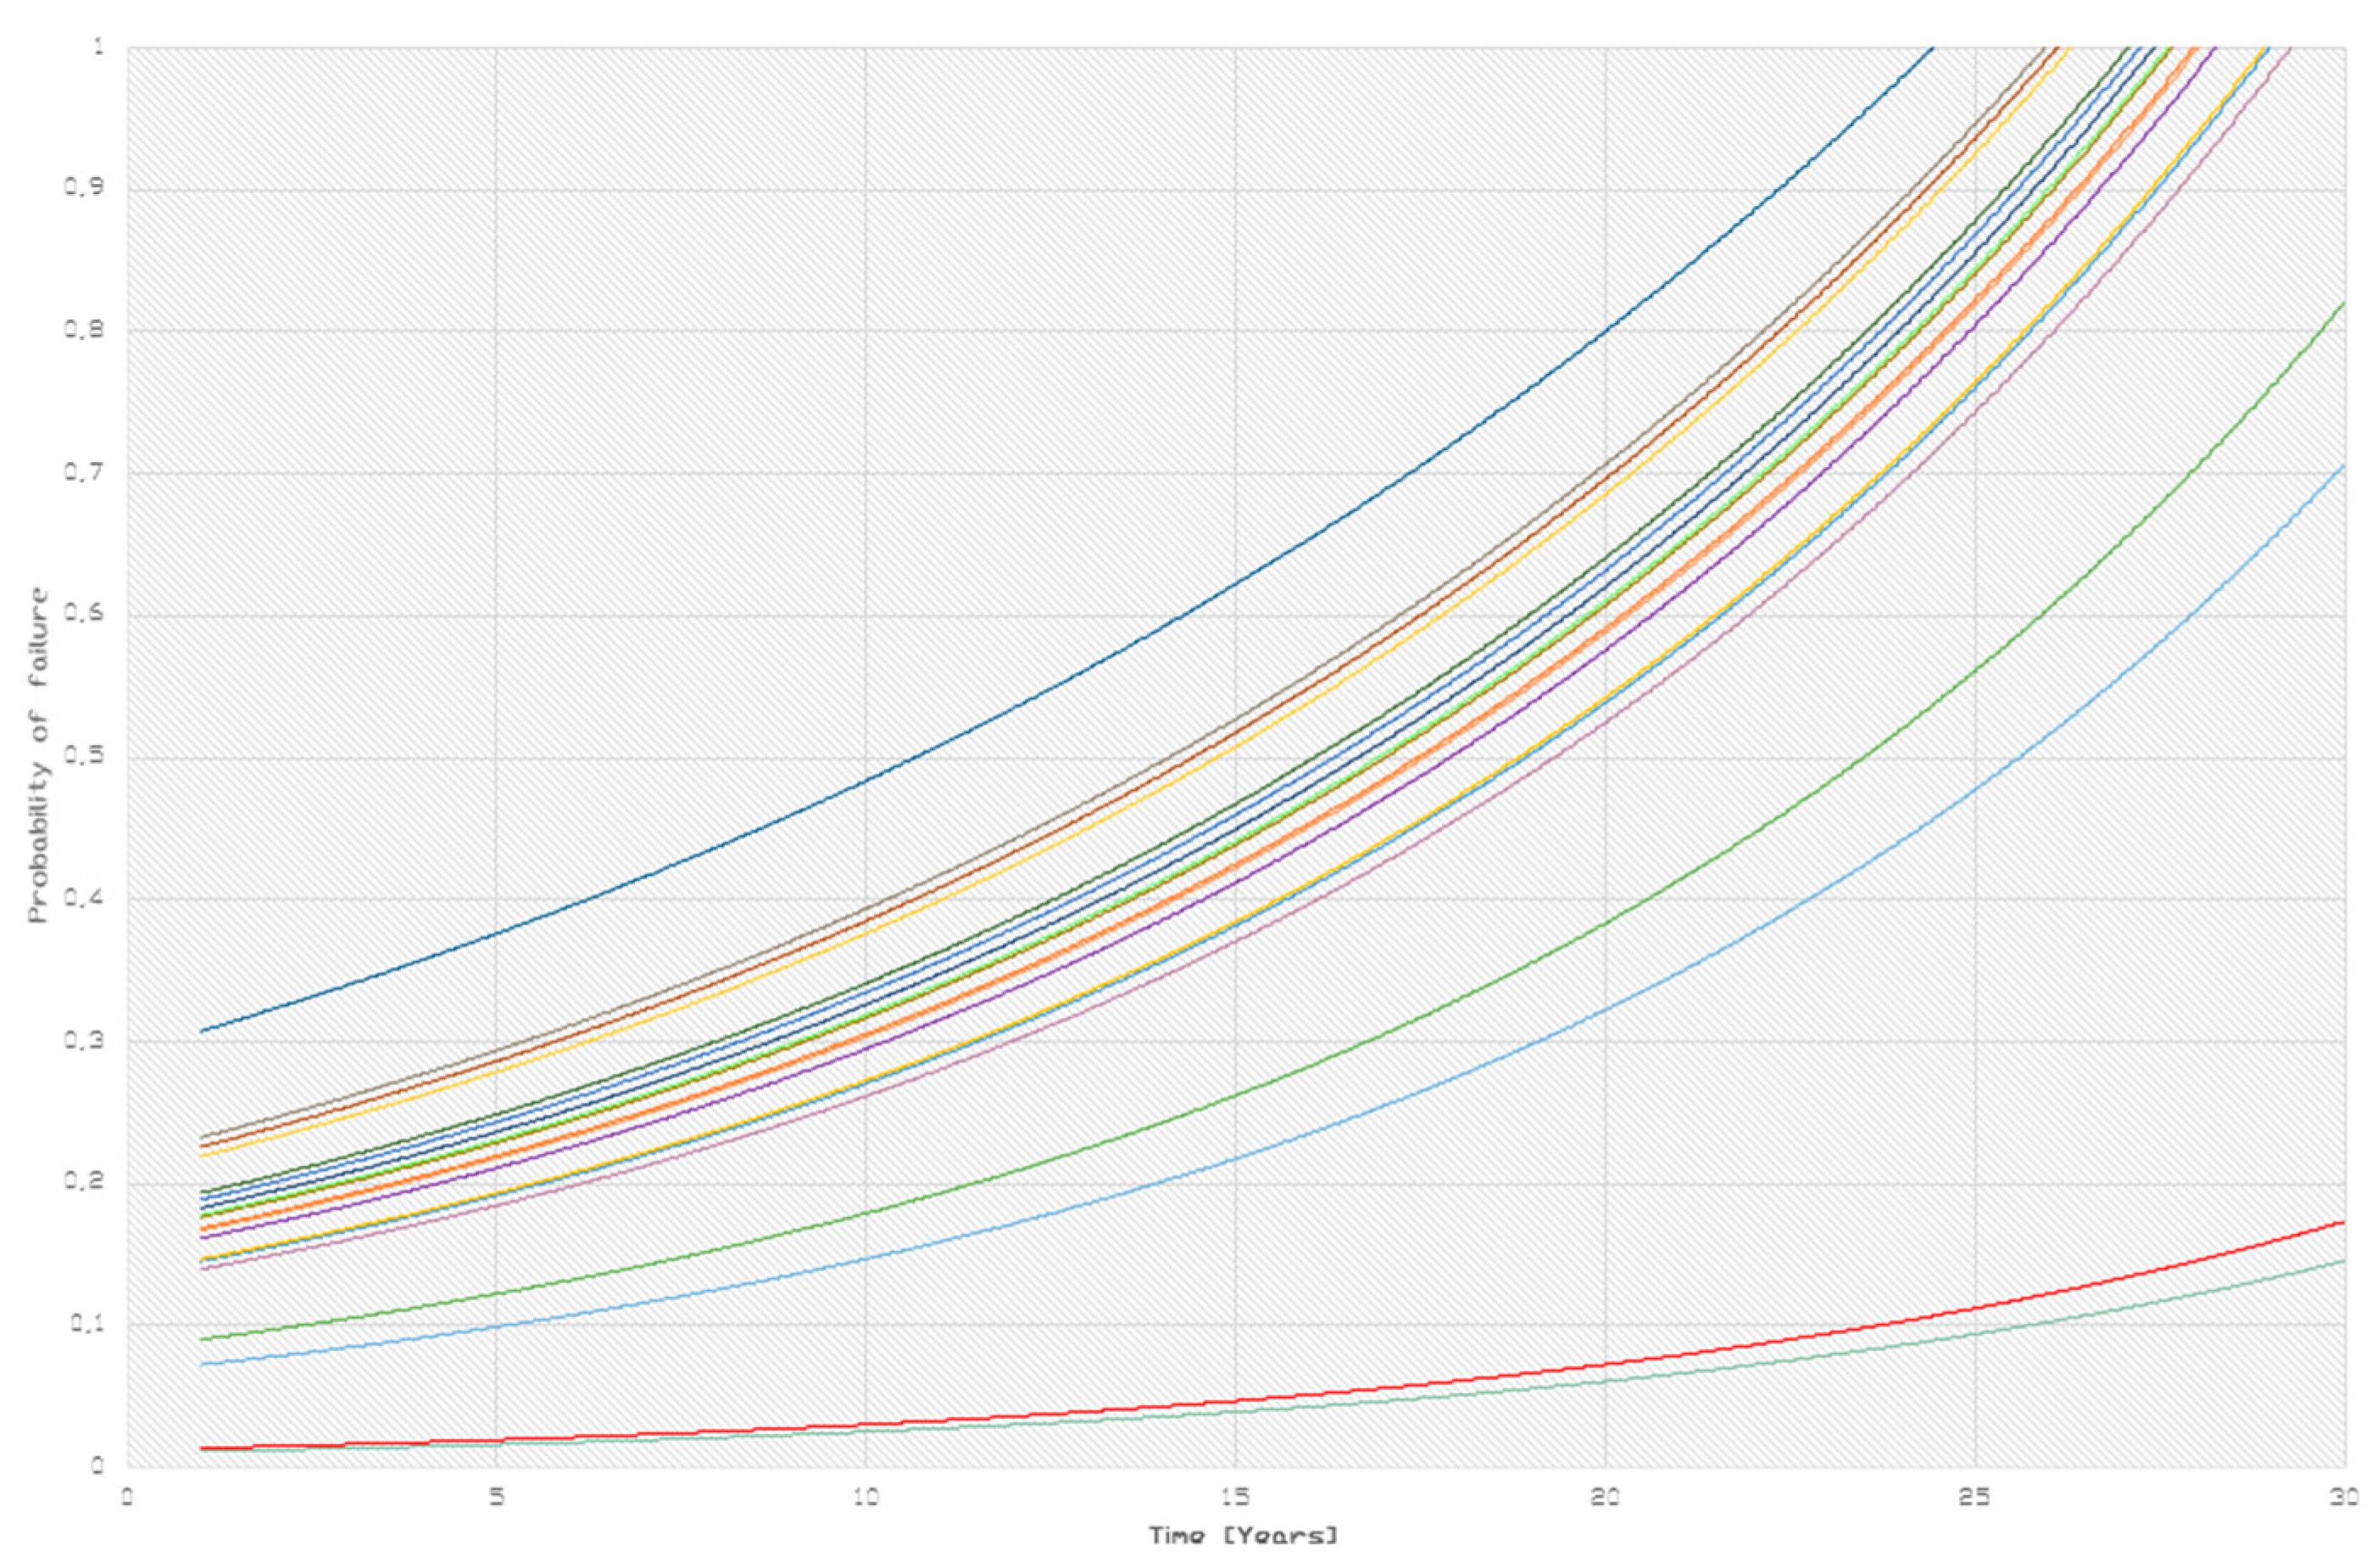
  • Reliability calculations were carried out for transformers based on the calculated health index coefficient. The transformer’s reliability was defined as the ability of the unit to withstand nominal loads and stresses by maintaining its technical parameters over time. Transformer condition reliability can be calculated as follows [20,45]:
    R i ( t ) = e λ t ,
    where t is the time in years, and λ = f (HI).
If a transformer is working under normal conditions without external or sudden stresses that can possibly lead to failure, all systems of the unit degrade at a constant rate, which is normally defined by its working years and current state of all systems. By incorporating HI into calculating the reliability of the transformer, we can include all systems of the transformer which are affecting its condition over long periods, years. The rate of failure is calculated using [20,45]:
λ = 1 H I A 2 .
where parameter A = f (t, γ). Parameter A is calculated by Equation (4) as follows:
A = t e t y .
where t is years of service of the transformer; γ is coefficient 1, 2 or 3, depending on the degrading curve (γ = 1 if the transformer is relatively new and it is in the zone of sudden failures; γ = 2 if the transformer is working normally but we do not have its designed working years; γ = 3 when the transformer has already exceeded its initially planned years of service); and te is the expected working years of the transformer. All calculations were performed with te = 50 years.
The risk of failure was calculated by deriving it from reliability. Results for reliability and risk of failure are presented in the expected years transformers continue to work without failing [12,20].

3. Results

Results from all the performed tests and applied algorithms are presented for all investigated transformers, from T1 to T20. Measured data were based on transformer oil tests and dissolved gas analysis DGA. Calculations were carried out to estimate water content in insulating paper from the chemical tests for oil quality. Collected data were based on performed visual inspections and on the history of the transformer, which was researched during the inspection. The results from the applied algorithms were based on health index calculations, results for expected transformer life based on calculated degree of polymerization via the ANN and calculations for reliability and risk of failure based on the HI. All data were generalized for all performed tests and analyses on all investigated transformers.

3.1. Transformer Oil Measurements and Test Data

3.1.1. Dissolved Gas Analysis (DGA) of the Transformer Oil

In Table 3 are shown quantities of dissolved gases measured in transformer oils of the investigated special transformers.
In Figure 7 is shown the total gas dissolved in the oil, which is the sum of all quantities of gases measured.

3.1.2. Chemical Analyses of the Transformer Oil

In Figure 8, Figure 9, Figure 10, Figure 11 and Figure 12 are shown chemical and electrical parameters of the investigated transformer oils.

3.2. Data Collected through Visiual Inspection

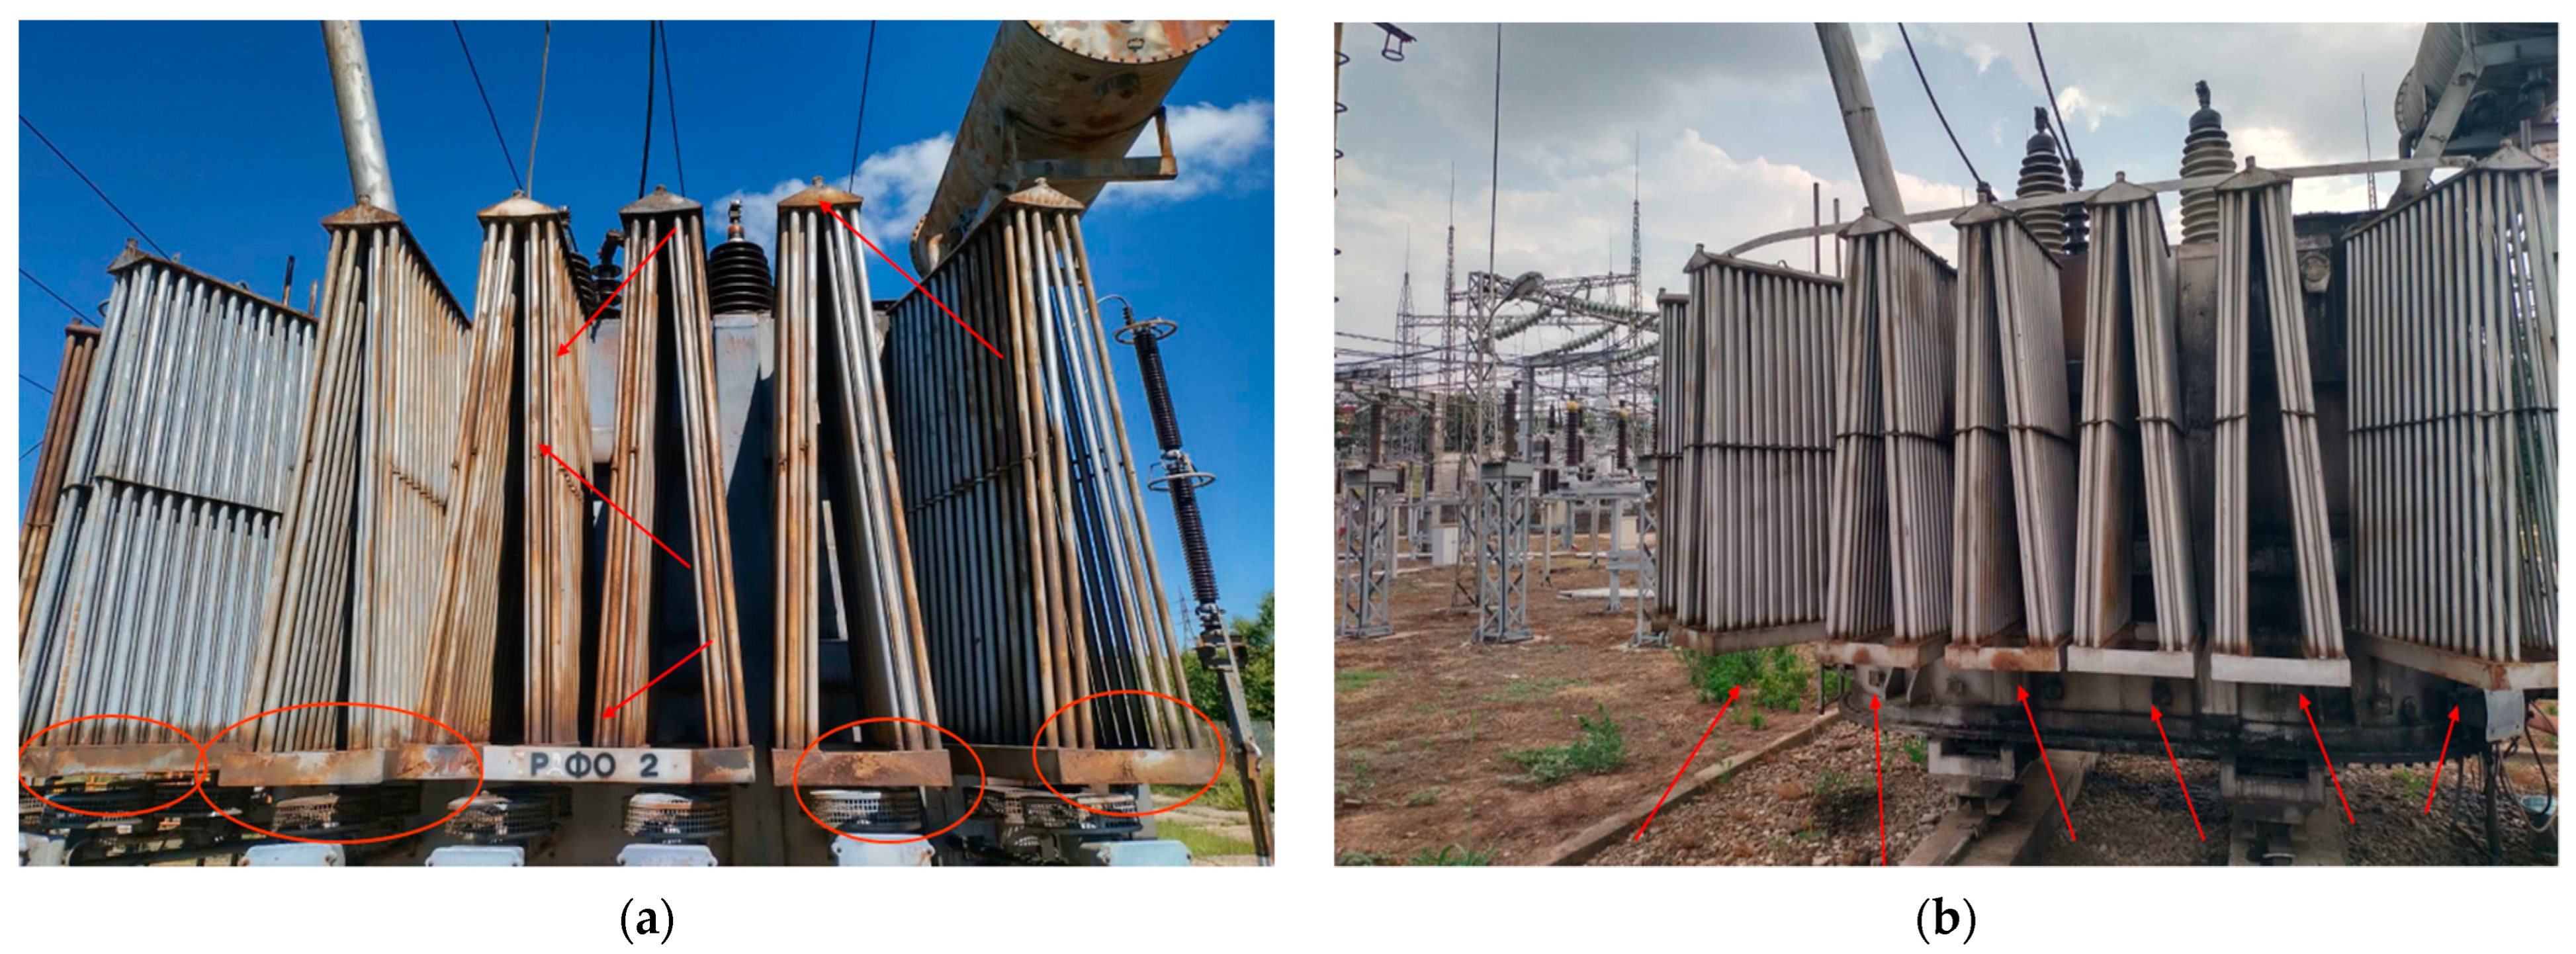
3.2.1. Cooling System
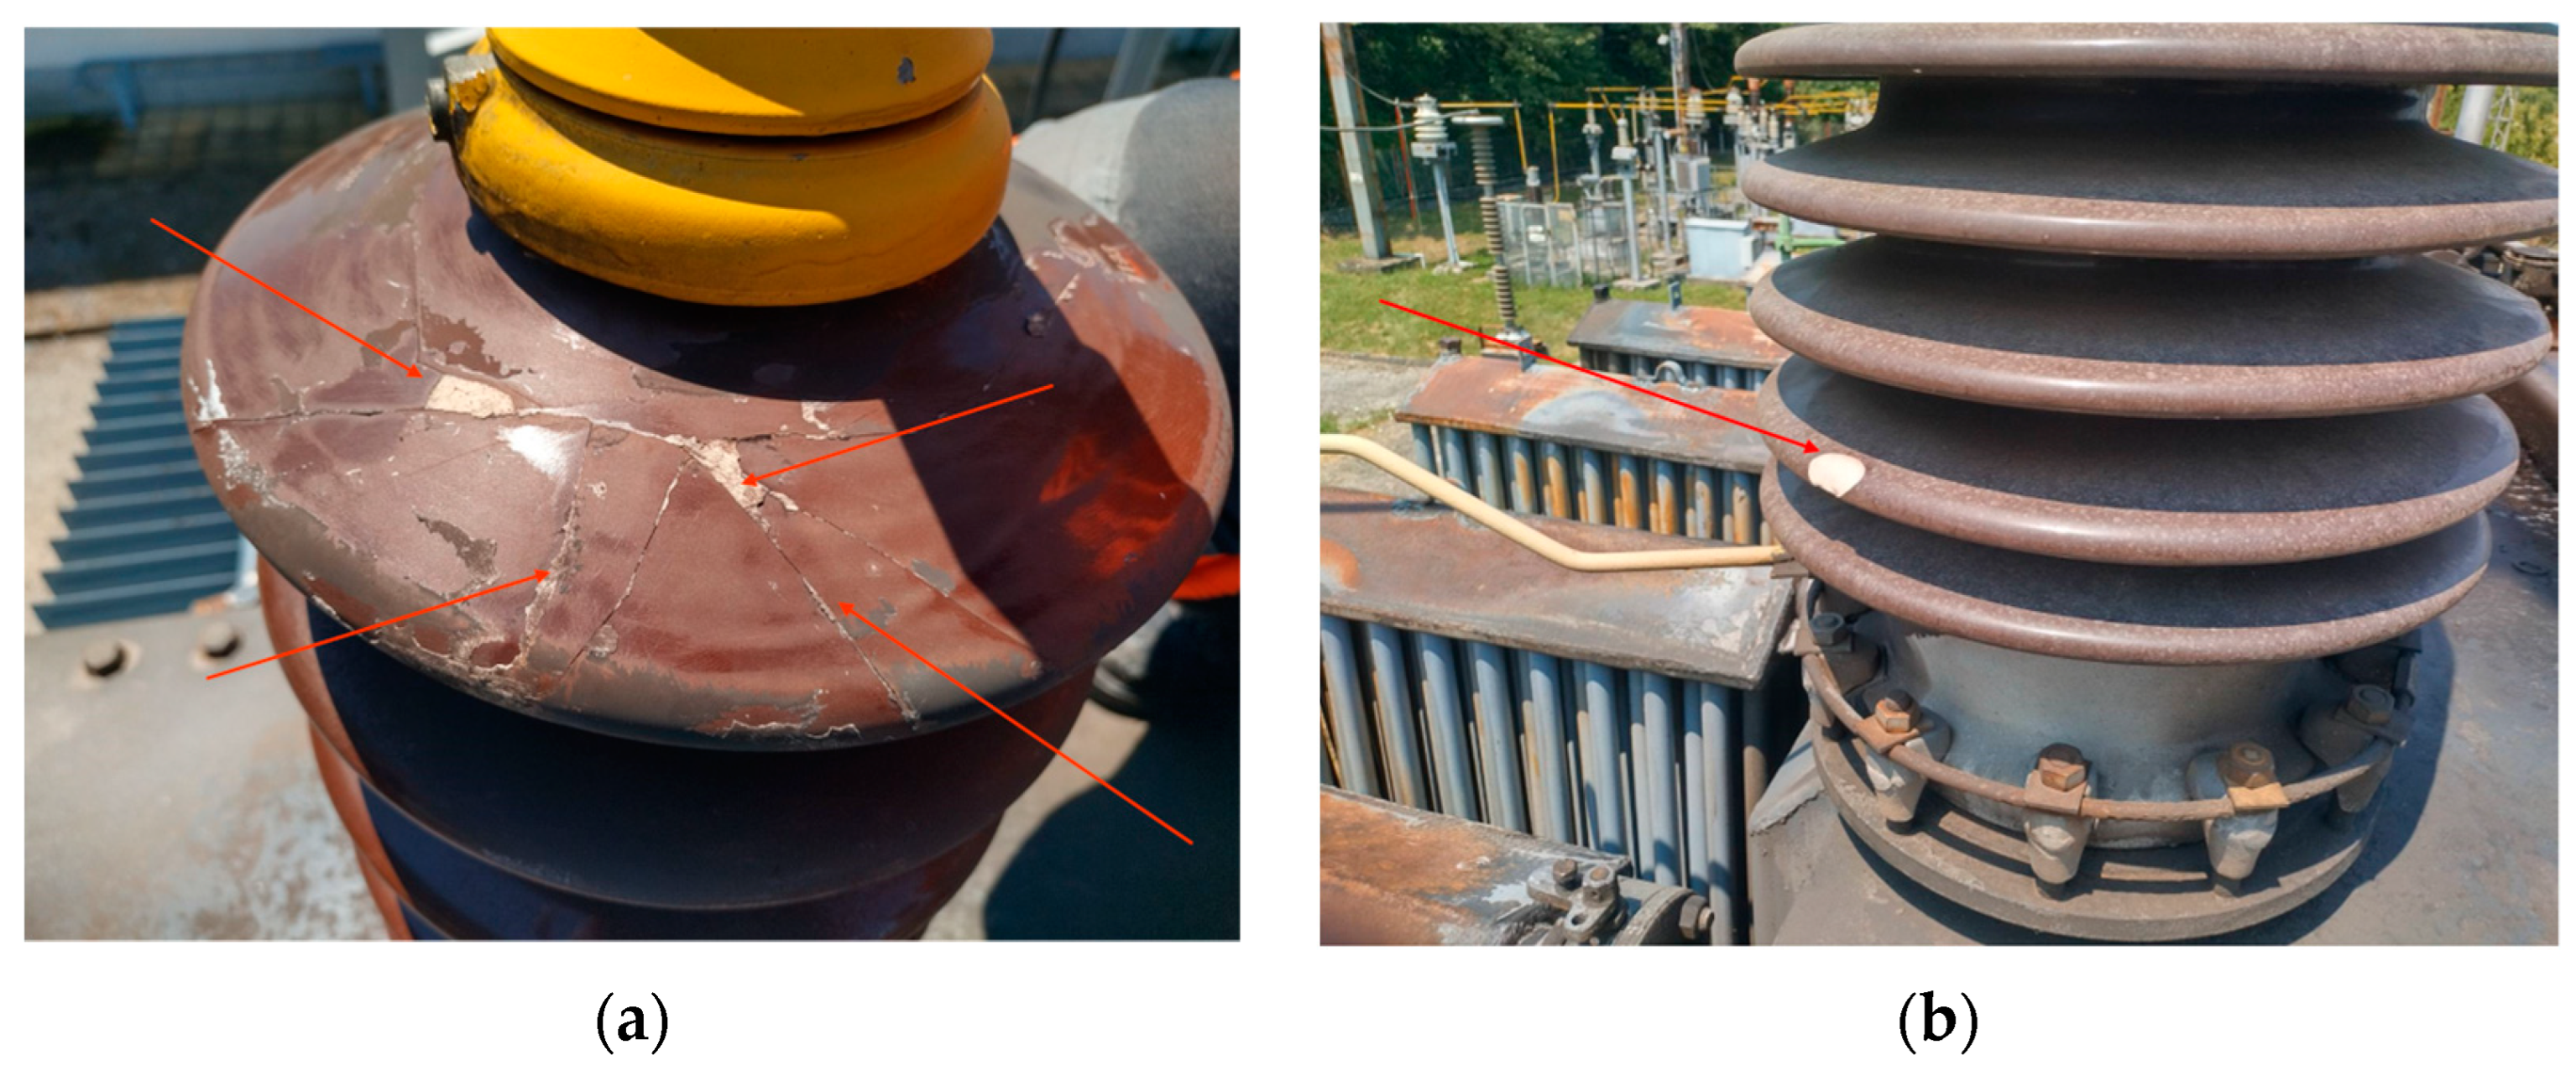
Data collected through visual inspection [17,26] of the cooling system of all investigated transformers are summarized in Table 4.
In Figure 13 are shown pictures of some of the most common faults observed during the visual diagnostics on cooling systems of the investigated transformers. All transformers had transformer oil leakages from valves or radiators. One of the biggest issues noted was corrosion.

3.2.2. Bushings

Data collected through visual inspections of the HV and LV bushings of all investigated transformers are summarized in Table 5.
In Figure 14 are shown pictures of some of the most common faults observed on the bushings during the visual inspection. Most of the bushings experienced small to medium oil leaks and were polluted. The most important issue that was observed was partially broken porcelain on several bushings.

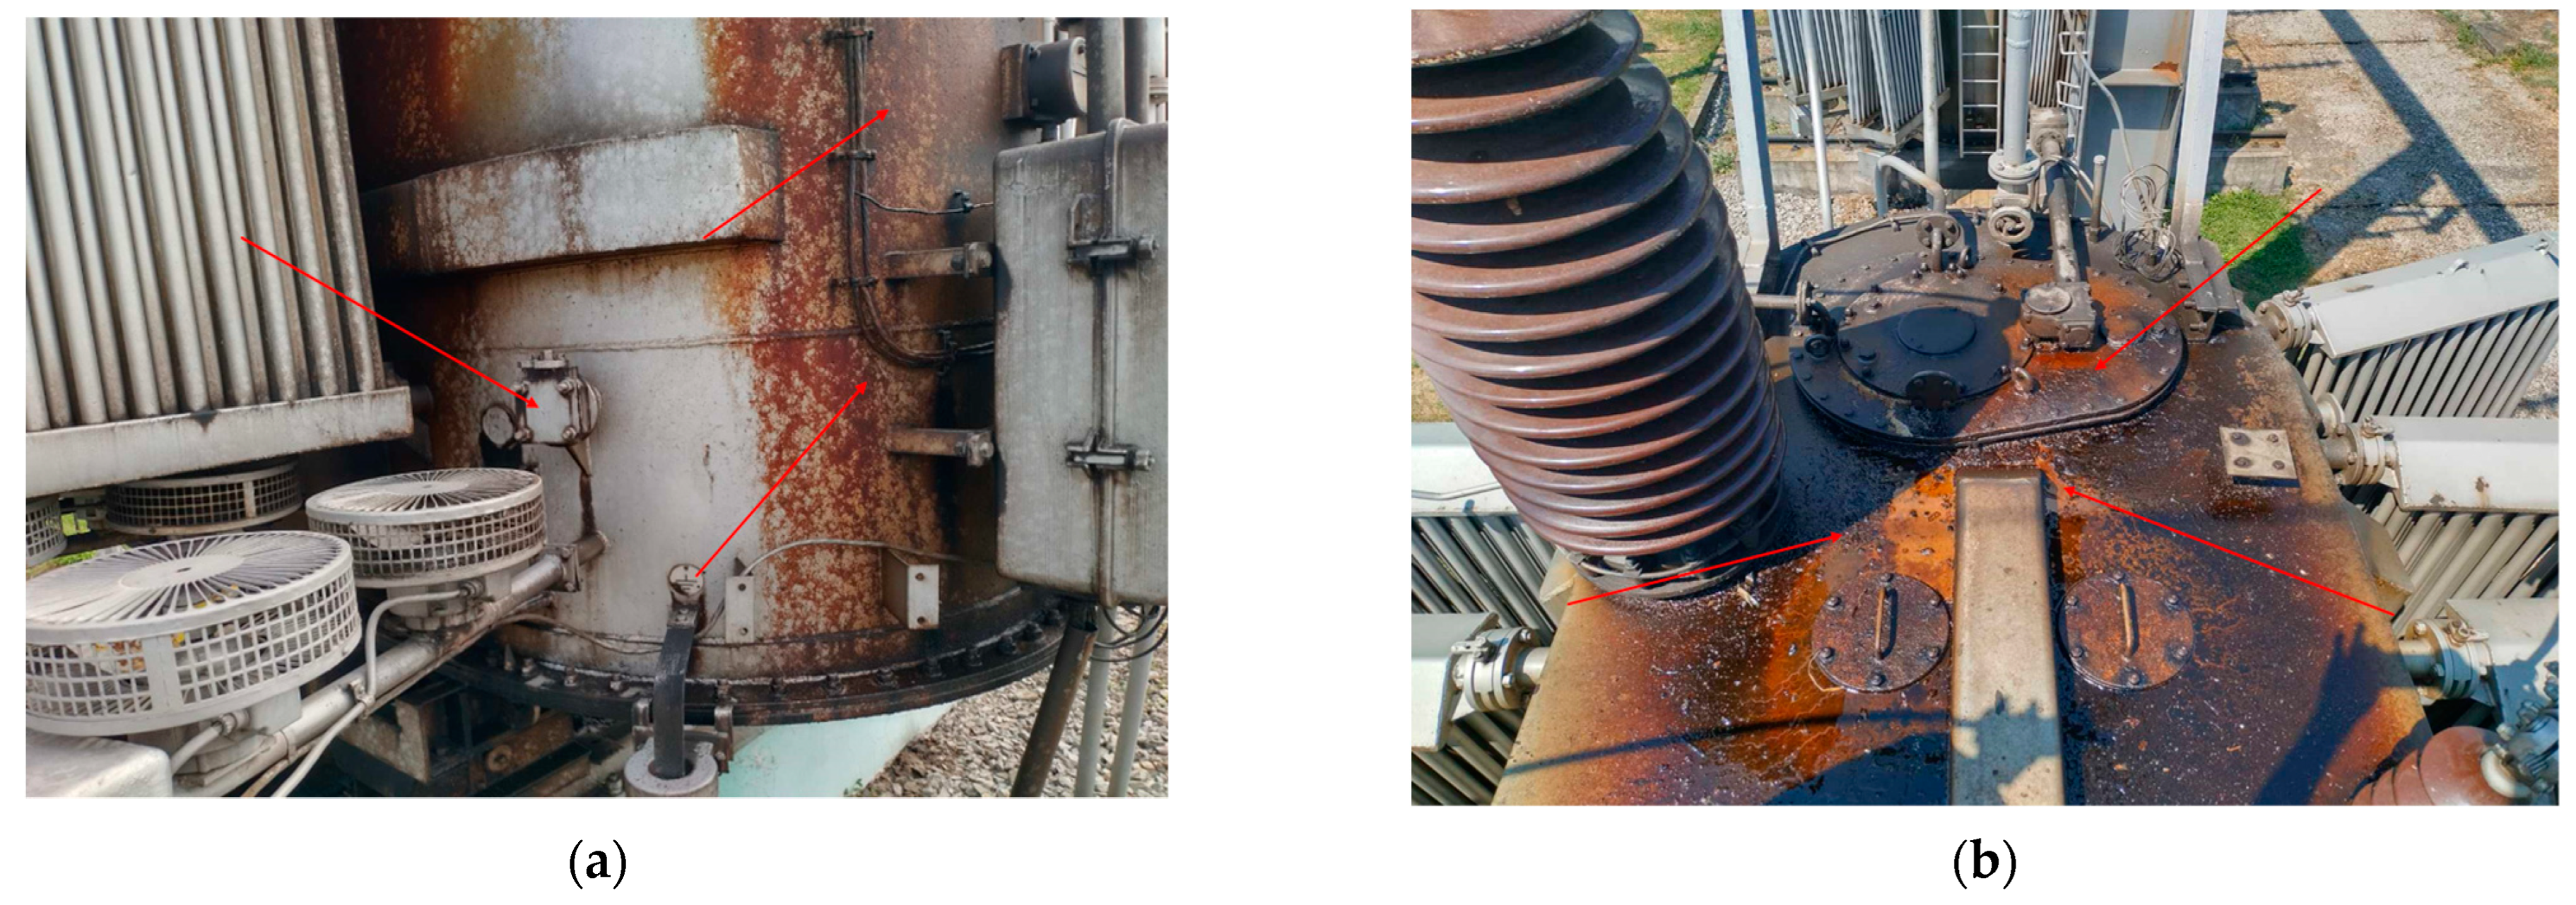
3.2.3. Tank, Conservator and Valves

Data collected through visual inspections of the tank, conservator and valves of all investigated transformers are summarized in Table 6.
In Figure 15 are shown pictures of some of the most common defects observed on the tank, conservator and valves during the visual inspection.

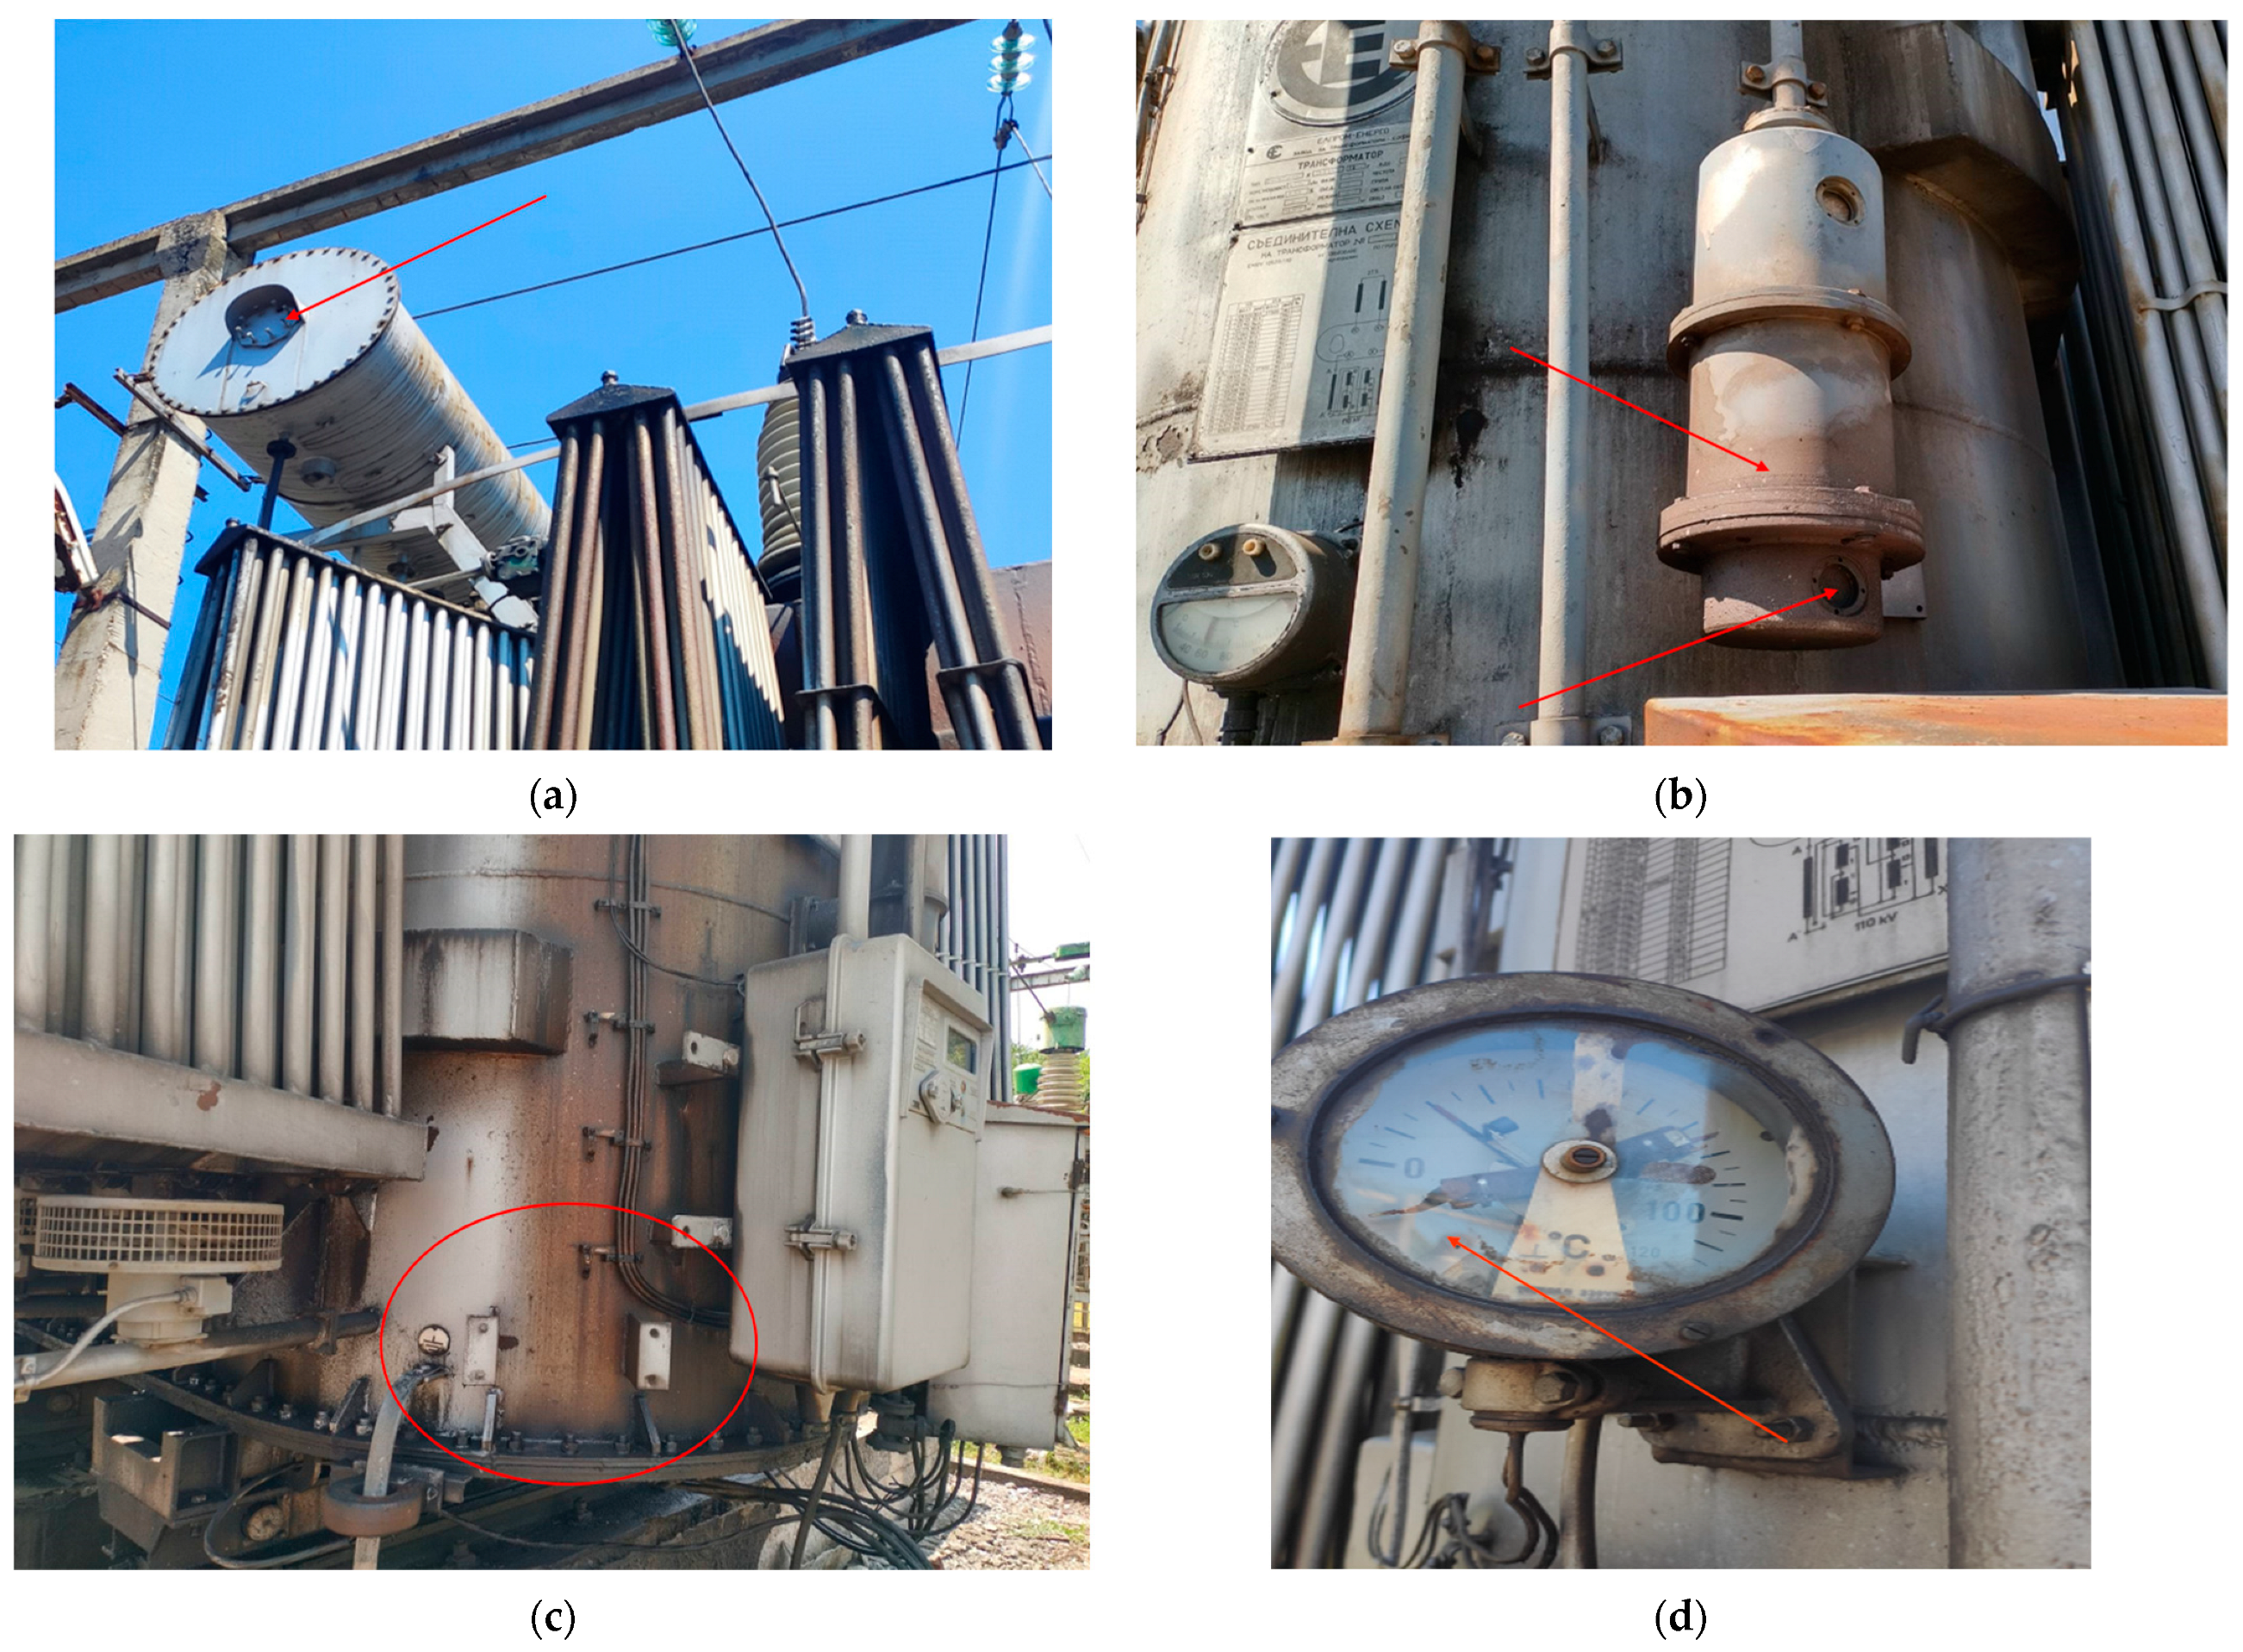
3.2.4. Protection Instruments

Data collected through visual inspections of protection instruments—breathers, Buchholz relays, temperature indicators, pressure relieve systems, magnetic oil levelers, gas relays of investigated transformers—are summarized in Table 7.
In Figure 16 are shown pictures of some of the most common defects observed in protection instruments during the visual inspection.

3.3. Results Received through Applied Analysis on Collected Data

3.3.1. Dissolved Gas Analysis (DGA) of the Transformer Oil and Oils Tests

It was concluded there were faults in transformers T5 and T6. On transformer T15 and T16 were detected high quantities of acetylene, C2H2. High acid numbers on T5, T15, T19 and T20 were registered that exceed the recommended values in the standards. Table 8 presents the summarized conclusions from analyzing the results obtained.
In Figure 17, Figure 18 and Figure 19 are shown typical cases of gas ratios found from investigating transformers. A very distinct pattern was observed for faulty transformers T5 and T6. For T15 and T16, a process of repeating gases generation of T5 and T6 was observed, but no apparent fault. T11 and T12 lacked any key gas ratios out of the inner circle quantities; therefore, no fault was detected.

3.3.2. Calculated Health Indexes for Investigated Transformers

A health index calculation was applied based on the method proposed in Section 3.3.1, and the results obtained are shown in Figure 20.
Calculated HIs and years of service are shown for each transformer in Figure 21.
In Table 9 are shown expected years of service based on the calculated HI for each transformer. Only one transformer was expected to work more than 15 years. No transformers were found with end-of-life or near end-of-life resources. In all transformers were found small to medium faults that could be repaired to prevent major breakdowns. Five transformers were prioritized for repair and maintenance.

3.3.3. Calculated Degree of Polymerization

In Figure 22 is shown the calculated DP for each transformer through the deployed ANN, and in Table 10 is shown the summarized results for all machines. No transformer was found to be near end-of-life zones. All investigated transformers fit the normal aging zone of insulating paper.

3.3.4. Calculated Reliability and Risk of Failure

The reliability R of the investigated transformers was modeled by the total depreciation and wear factor HI in the expected years of life. In Figure 23 is shown the calculated reliability R = f (HI, t) for each transformer. Calculated risks of failure as a probability for, F = f (HI, t), for 30 years’ service life, for each transformer in the studied group, are presented on Figure 24. Risk is approaching the 100% after 25th year for all transformers.

4. Discussion

Predictive diagnostics and monitoring with a combination of measures for modernization, optimization and prolonging the initial life of assets (power transformers) is a widespread method of ensuring the safety and high efficiency of high voltage equipment. The used methods for complex diagnostics and on-field testing allow for scheduling transformers for maintenance, repair or even replacements if they have reached End of Life (EOL) of their resources. The ability to manage equipment depreciation creates opportunities to reduce maintenance and repair costs, as well as to avoid several emergency situations. Failure, reliability and EOL predictions are an important part of any analysis and diagnostics.
In the blooming digitalization of energy sector methods, online and remote monitoring and predictive diagnostics are needed. The HI approach presented here can be used and applied for real-time monitoring of power transformers by combining any number of measurable parameters. Secondary and protection system measurement instruments can be deployed to feed necessary data for precise calculation of the HI.
Creating databases and tracking the degradation of assets, such as for power and special transformers, will be a next step in building smart substations. Each power grid will need large databases and online monitoring to become more energy efficient and prevent major breakdowns. Tracking and recording the degradation of the assets will help predict failures and control the process more accurately, which will greatly reduce costs for repairs and will give the ability to plan replacements of transformers near EOL. Furthermore, with already created databases which are fed data for asset conditions, an opportunity is arising for deploying artificial neural networks for big-data analysis to predict problems.
The reuse of already built-in materials has become a key focus in recent times, and accurate estimation of assets with a combination of preventive maintenance and modernization can increase the life of already-in-service power transformers. This will allow for the long exploration of invested materials and a reduction in the initial energy needed to produce new machines.
The investigated twenty traction transformers, which were the subject of applied complex diagnostics and monitoring, were discussed and selected in different categories based on their HI, DP, DGA and R (risk of failure). Categories were created regarding planned maintenance and repair. None of the transformers were scheduled for replacement, due to a high amount of residual life of the assets calculated via the HI and the technical possibility of being exploited in service for more years. Transformers T9, T10 and T12 showed the lowest chances in risk-of-failure calculations. T9 and T10 were transformers with the fewest years in service compared to the other transformers. T12 was a transformer that had been repaired in the past and, despite its years in service, had very high reliability and a very high degree of polymerization of its insulation paper. An electrical fault was diagnosed based on DGA findings in transformers T5 and T6. In T15 and T16, acetylene levels were peaking near warning levels and were scheduled for further diagnostics and monitoring. In Table 11 are summarized conclusions of the performed complex diagnostics and monitoring of the investigated twenty traction transformers, with color-coded parameters.
A combination of the four methods provided more precise information about the state of each transformer and its remaining life. All of the transformers showed very low insulation wear and a high degree of polymerization based on 2-FAL findings from oil sampling. However, their estimated life in years of service varied differently, and what we observed based on the HI was that only one transformer, T9, had excellent results. Overall, all transformers showed very high wear levels to their secondary systems, which has the potential to lead to major faults. DGA findings showed two transformers with electrical faults and two transformers with peaking gases; all other units were estimated to be excellent. We observed that the sensitivity and range of all four methods used were different, and they could lead to wrong conclusions if final decisions were based only on one of them. Table 12 presents comparisons based on the findings from all diagnostic methods used.

5. Conclusions

Applied complex diagnostics and monitoring of power and special transformers was presented and applied. Twenty special traction transformers were subjected to diagnostic and monitoring tests. The applied diagnostics were separated into five different stages: estimation of the current state of the transformer, including all tests performed on transformer oil (DGA and chemical tests) and visual inspection; collecting historical data; analyzing the results through algorithms; generalization for states for each transformer; and conclusions, forecasts and recommendations.
The methods used incorporated on-field testing and inspection of transformers with the algorithm-based health index approach for prioritizing assets for repair, maintenance or replacement. An indirect method was used to estimate wear levels of insulation, based on a feed forward neural network. A method for reliability and risk of failure calculations was proposed and used. A combination of all four diagnostic methods’ results was obtained and discussed, and a selection of transformers was recommended for repair, maintenance and close monitoring.
The proposed approach is suitable for the predictive automated maintenance of large-scale transformer networks and equipment. The results obtained and the methods shown can be used for overall real-time online monitoring for large groups of power transformers based on large-scale databases. The achieved results and methodology can be further be deployed to collect data and process them on all electrical equipment in substations and further digitalize the sector.

Author Contributions

Conceptualization, G.I., A.S., V.M. and I.M.; methodology, G.I., A.S., V.M. and I.M.; formal analysis, G.I., A.S., V.M. and I.M.; investigation, G.I. and A.S.; resources, V.M. and I.M.; data curation, G.I., A.S., V.M. and I.M.; writing—original draft preparation, G.I. and V.M.; writing—review and editing, G.I., A.S., V.M. and I.M.; visualization, G.I., A.S., V.M. and I.M.; supervision, V.M. and I.M.; project administration, V.M. and I.M.; funding acquisition, I.M. All authors have read and agreed to the published version of the manuscript.

Funding

This work was supported by the European Regional Development Fund within the Operational Programme “Science and Education for Smart Growth 2014–2020” under the Project CoE “National center of mechatronics and clean technologies” BG05M2OP001-1.001-0008.

Data Availability Statement

Not applicable.

Acknowledgments

Authors want to acknowledge and express gratitude for continues support and cooperation of “Centralna Energoremontna Baza EAD, CERB Trafo, Sofia, Bulgaria” for providing datasets, expertise and methodological support for that research.

Conflicts of Interest

The authors declare no conflict of interest.

References

  1. Jahromi, A.; Piercy, R.; Cress, S.; Service, J.; Fan, W. An approach to power transformer asset management using health index. IEEE Electr. Insul. Mag. 2009, 25, 20–34. [Google Scholar] [CrossRef]
  2. Naderian, A.; Cress, S.; Piercy, R.; Wang, F.; Service, J. An approach to determine the health index of power transformers. In Proceedings of the Conference Record of the 2008 IEEE International Symposium on Electrical Insulation, Vancouver, BC, Canada, 8–11 June 2008. [Google Scholar]
  3. Badune, J.; Vitolina, S.; Maskalonok, V. Methods for Predicting Remaining Service Life of Power Transformers and Their Components. Power Electr. Eng. 2013, 31, 123–126. [Google Scholar]
  4. Hong, Y.; Meeker, W.Q.; McCalley, J.D. Prediction of remaining life of power transformers based on left truncated and right censored lifetime data. Ann. Appl. Stat. 2009, 3, 857–879. [Google Scholar] [CrossRef] [Green Version]
  5. Tan, C.; Wang, S.; Deng, H.; Han, G.; Du, G.; Song, W.; Zhang, X. The Health Index Prediction Model and Application of PCP in CBM Wells Based on Deep Learning. Geofluids 2021, 2021, 1–13. [Google Scholar] [CrossRef]
  6. Morais, N.F.O. Estimating the Remaining Lifetime of Power Transformers Using Paper Insulation Degradation. Master Thesis, Universidade do Porto, Porto, Portugal, 2018. Available online: https://hdl.handle.net/10216/115985 (accessed on 25 December 2022).
  7. Luopajärvi, J. Condition Monitoring of Power Transformer as Part of Power Plant Maintenance Process. Master Thesis, University of Vaasa, Vaasa, Finland, 2010. Available online: http://osuva.uwasa.fi/handle/10024/2886 (accessed on 25 December 2022).
  8. Quiñones, L.I.A.; Lozano-Moncada, C.A.; Montenegro, D.A.B. Machine learning for predictive maintenance scheduling of distribution transformers. J. Qual. Maint. Eng. 2022; ahead-of-print. [Google Scholar] [CrossRef]
  9. Tran, Q.T.; Davies, K.; Roose, L.; Wiriyakitikun, P.; Janjampop, J.; Sanseverino, E.R.; Zizzo, G. A Review of Health Assessment Techniques for Distribution Transformers in Smart Distribution Grids. Appl. Sci. 2020, 10, 8115. [Google Scholar] [CrossRef]
  10. Bektas, O.; Jones, J.A.; Sankararaman, S.; Roychoudhury, I.; Goebel, K. A neural network filtering approach for similarity-based remaining useful life estimation. Int. J. Adv. Manuf. Technol. 2018, 101, 87–103. [Google Scholar] [CrossRef] [Green Version]
  11. Dekker, K.J. Maintenance Optimization Through Remaining Useful Life Prediction A Case Study for Damen Shipyards. Master’s Thesis, Faculty of Industrial Engineering and Business Information Systems, University of Twente, Enschede, The Netherlands, 2020. [Google Scholar]
  12. Xu, C.; Wang, G.; Liu, X.; Guo, D.; Liu, T.-Y. Health Status Assessment and Failure Prediction for Hard Drives with Recurrent Neural Networks. IEEE Trans. Comput. 2016, 65, 3502–3508. [Google Scholar] [CrossRef]
  13. Yahaya, M.S.; Azis, N.; Ab Kadir, M.Z.A.; Jasni, J.; Hairi, M.H.; Talib, M.A. Estimation of Transformers Health Index Based on the Markov Chain. Energies 2017, 10, 1824. [Google Scholar] [CrossRef] [Green Version]
  14. Alqudsi, A.; El-Hag, A. Application of Machine Learning in Transformer Health Index Prediction. Energies 2019, 12, 2694. [Google Scholar] [CrossRef] [Green Version]
  15. Bohatyrewicz, P.; Mrozik, A. The Analysis of Power Transformer Population Working in Different Operating Conditions with the Use of Health Index. Energies 2021, 14, 5213. [Google Scholar] [CrossRef]
  16. Karlsson, S. A Review of Lifetime Assessment of Tranformers and the Use of Dissolved Gas Analysis; Elektroteknisk Teori & Konstruktion: Stockholm, Sweden, 2008. [Google Scholar]
  17. IEEE Std 62-1995; IEEE Guide for Diagnostic Field Testing of Electric Power Apparatus-Part 1: Oil Filled Power Transformers, Regulators, and Reactors. IEEE: Piscataway, NJ, USA, 1995.
  18. Guo, H.; Guo, L. Health index for power transformer condition assessment based on operation history and test data. Energy Rep. 2022, 8, 9038–9045. [Google Scholar] [CrossRef]
  19. Padmanaban, S.; Khalili, M.; Nasab, M.A.; Zand, M.; Shamim, A.G.; Khan, B. Determination of Power Transformers Health Index Using Parameters Affecting the Transformer’s Life. IETE J. Res. 2022, 1–22. [Google Scholar] [CrossRef]
  20. Nadai, N.; Melani, A.H.A.; Souza, G.F.M.; Nabeta, S.I. Equipment failure prediction based on neural network analysis incorporating maintainers inspection findings. In Proceedings of the 2017 Annual Reliability and Maintainability Symposium (RAMS), Orlando, FL, USA, 23–26 January 2017; pp. 1–7. [Google Scholar] [CrossRef]
  21. Youssef, M.M.; Ibrahim, R.A.; Desouki, H.; Moustafa, M.M.Z. An Overview on Condition Monitoring & Health Assessment Techniques for Distribution Transformers. In Proceedings of the 2022 6th International Conference on Green Energy and Applications (ICGEA), Singapore, 4–6 March 2022; pp. 187–192. [Google Scholar] [CrossRef]
  22. lal Rajora, G.; Sanz-Bobi, M.A.; Domingo, C.M. Application of Machine Learning Methods for Asset Management on Power Distribution Networks. Emerg. Sci. J. 2022, 6, 905–920. [Google Scholar] [CrossRef]
  23. Sharma, N.K.; Bhalla, D.; Manisha; Kaur,, K. Smart Techniques for Fault Diagnosis in Power Transformer. IOP Conf. Ser. Mater. Sci. Eng. 2022, 1228. [Google Scholar] [CrossRef]
  24. Bhushan, U.P.; Jarial, R.K.; Jadoun, V.K.; Agarwal, A. On Condition Monitoring Aspects of in-Service Power Transformers Using Computational Techniques. In Advances in Electromechanical Technologies; Springer: Singapore, 2021; pp. 343–355. [Google Scholar] [CrossRef]
  25. Wang, J.; Zhang, X.; Zhang, F.; Wan, J.; Kou, L.; Ke, W. Review on Evolution of Intelligent Algorithms for Transformer Condition Assessment. Front. Energy Res. 2022, 10, 904109. [Google Scholar] [CrossRef]
  26. IEC 60076-1; Power transformers–Part 1: General. International Electrotechnical Commission: Geneva, Switzerland, 2011.
  27. IEC 60422:2013; Mineral Insulating Oils in Electrical Equipment–Supervision and Maintenance Guidance. International Electrotechnical Commission: Geneva, Switzerland, 2013.
  28. IEC 60296:2020; Fluids for Electrotechnical Applications—Mineral Insulating Oils for Electrical Equipment. International Electrotechnical Commission: Geneva, Switzerland, 2020.
  29. IEC 60814:1997; Insulating liquids—Oil-impregnated paper and pressboard—Determination of water by automatic coulometric Karl Fischer titration. International Electrotechnical Commission: Geneva, Switzerland, 1997.
  30. IEC 60156:2018; Insulating Liquids—Determination of the Breakdown Voltage at Power Frequency—Test Method. International Electrotechnical Commission: Geneva, Switzerland, 2018.
  31. IEC 60247:2004; Insulating Liquids-Measurement of Relative Permittivity, Dielectric Dissipation Factor (tan d) and d.c. Resistivity. International Electrotechnical Commission: Geneva, Switzerland, 2004.
  32. IEC 60599:2022; Mineral Oil-Filled Electrical Equipment In Service—Guidance on the Interpretation of Dissolved and Free Gases Analysis. International Electrotechnical Commission: Geneva, Switzerland, 2022.
  33. EN 62021-1:2003; Insulating Liquids—Determination of Acidity—Part 1: Automatic Potentiometric Titration. International Electrotechnical Commission: Geneva, Switzerland, 2003.
  34. Badawi, M.; Ibrahim, S.A.; Mansour, D.-E.A.; El-Faraskoury, A.A.; Ward, S.A.; Mahmoud, K.; Lehtonen, M.; Darwish, M.M.F. Reliable Estimation for Health Index of Transformer Oil Based on Novel Combined Predictive Maintenance Techniques. IEEE Access 2022, 10, 25954–25972. [Google Scholar] [CrossRef]
  35. Thango, B.A.; Bokoro, P.N. Prediction of the Degree of Polymerization in Transformer Cellulose Insulation Using the Feedforward Backpropagation Artificial Neural Network. Energies 2022, 15, 4209. [Google Scholar] [CrossRef]
  36. Ma, H.; Yang, P.; Wang, F.; Wang, X.; Yang, D.; Feng, B. Short-Term Heavy Overload Forecasting of Public Transformers Based on Combined LSTM-XGBoost Model. Energies 2023, 16, 1507. [Google Scholar] [CrossRef]
  37. Putchala, S.R.; Kotha, R.; Guda, V.; Ramadevi, Y. Transformer Data Analysis for Predictive Maintenance. In Proceedings of the Second International Conference on Advances in Computer Engineering and Communication Systems; Springer: Singapore, 2022. [Google Scholar]
  38. Barkas, D.A.; Kaminaris, S.D.; Kalkanis, K.K.; Ioannidis, G.C.; Psomopoulos, C.S. Condition Assessment of Power Transformers through DGA Measurements Evaluation Using Adaptive Algorithms and Deep Learning. Energies 2022, 16, 54. [Google Scholar] [CrossRef]
  39. Ralchev, M.; Mateev, V.; Ivanov, G.; Marinova, I. Remote Monitoring of On-Load Tap Changer Switching Cycle Based on Acoustic Sensing. In Proceedings of the 2021 13th Electrical Engineering Faculty Conference (BulEF), Varna, Bulgaria, 8–11 September 2021; pp. 1–4. [Google Scholar] [CrossRef]
  40. Salim, N.A.; Jasni, J.; Mohamad, H.; Yasin, Z.M. Transformer health index prediction using feedforward neural network according to scoring and ranking method. Int. J. Adv. Technol. Eng. Explor. 2021, 8, 292–303. [Google Scholar] [CrossRef]
  41. Peimankar, A. Intelligent Condition Assessment of Power Transformers; University of Canterbury: Christchurch, New Zealand, 2017. [Google Scholar]
  42. Voronov, S. Machine Learning Models for Predictive Maintenance. Ph.D. Thesis, Linköping University Electronic, Linköping, Sweden, 2020. [Google Scholar] [CrossRef]
  43. Roland, U.; Eseosa, O. Artificial neural network approach to distribution transformers maintenance. Int. J. Sci. Res. Eng. Technol. 2015, 1, 62–70. [Google Scholar]
  44. Taha, I.B.M.; Ibrahim, S.; Mansour, D.-E.A. Power Transformer Fault Diagnosis Based on DGA Using a Convolutional Neural Network with Noise in Measurements. IEEE Access 2021, 9, 111162–111170. [Google Scholar] [CrossRef]
  45. Ibrahim, K.; Sharkawy, R.; Temraz, H.; Salama, M. Reliability calculations based on an enhanced transformer life expectancy model. Ain Shams Eng. J. 2021, 13, 101661. [Google Scholar] [CrossRef]
Figure 1. Stages of the technical diagnostics.
Energies 16 02142 g001
Figure 2. Forecasting upcoming failures and end of life based on the HI and historical data.
Energies 16 02142 g002
Figure 3. Calculation of the HI.
Energies 16 02142 g003
Figure 4. Distribution of the most common faults in traction transformers 110 kV/27.5 kV.
Energies 16 02142 g004
Figure 5. Topology of created ANN for estimation of DP.
Energies 16 02142 g005
Figure 6. ANN results for estimation of DP from 2-FAL. (a) ANN training; (b) ANN validation; (c) ANN testing; (d) overall reaction.
Energies 16 02142 g006
Figure 7. Measured total gas dissolved (TGD).
Energies 16 02142 g007
Figure 8. Measured breakdown voltage in kV.
Energies 16 02142 g008
Figure 9. Measured water content [mg/kg].
Energies 16 02142 g009
Figure 10. Measured dielectric dissipation factor tanδ distribution for the group.
Energies 16 02142 g010
Figure 11. Measured acid number.
Energies 16 02142 g011
Figure 12. Calculated water content in insulating paper [%].
Energies 16 02142 g012
Figure 13. These are defects observed during visual inspections of investigated transformers. (a) Corroded oil coolers and oil leakages observed on transformer T3; (b) missing fans from the cooling system noted on transformer T19.
Energies 16 02142 g013
Figure 14. These are results from visual inspection, representing defects observed on the LV and HV bushings on visual inspection. (a) Broken porcelain on LV bushing on T10; (b) broken porcelain and oil leaks on HV bushing on T14.
Energies 16 02142 g014
Figure 15. These are defects observed on the tank, conservator and vales during visual inspection. (a) Corroded tank and missing radiator on T16; (b) heavy oil leaks from tap changer on T17.
Energies 16 02142 g015
Figure 16. These are defects observed in protection instruments during the visual inspection. (a) Missing magnetic oil level indicator observed on transformer T11; (b) wet silica and oil leakages on the breather for the conservator on transformer T1; (c) missing cable box for protection instruments on T14; (d) faulty oil temperature indicator from transformer T7.
Energies 16 02142 g016
Figure 17. Faults detected in T5 and T6. (a) Gas ratio distribution in T5; (b) gas ratio distribution in T6.
Energies 16 02142 g017
Figure 18. No Fault detected in T11 and T12. (a) Gas ratio distribution in T11; (b) gas ratio distribution in T12.
Energies 16 02142 g018
Figure 19. A fault emerging and requiring caution in T15 and T16. (a) Gas ratio distribution in T15; (b) gas ratio distribution in T16.
Energies 16 02142 g019
Figure 20. Calculated health indexes for transformers T1 to T20.
Energies 16 02142 g020
Figure 21. Health indexes and years of service for T1 to T20.
Energies 16 02142 g021
Figure 22. Calculated DPs for each transformer.
Energies 16 02142 g022
Figure 23. Calculated reliabilities of the investigated transformers.
Energies 16 02142 g023
Figure 24. Calculated risks of failure for each transformer, F = f (HI, t).
Energies 16 02142 g024
Table 1. Technical data of investigated transformers.
IndexSerial NumberRated Power and Rated VoltageYear of Manufacturing
T110955310.5 MVA 110 kV/27.5 kV1984
T210915310.5 MVA 110 kV/27.5 kV1981
T311192710.5 MVA 110 kV/27.5 kV1987
T410915210.5 MVA 110 kV/27.5 kV1984
T510862810.5 MVA 110 kV/27.5 kV1988
T610664710.5 MVA 110 kV/27.5 kV1982
T71036428.33 MVA 110 kV/27.5 kV1980
T81036438.33 MVA 110 kV/27.5 kV1980
T911275210.33 MVA 110 kV/27.5 kV2003
T1011275310.33 MVA 110 kV/27.5 kV2003
T11852348.33 MVA 110 kV/27.5 kV1973
T12942098.33 MVA 110 kV/27.5 kV1991
T1310955410.5 MVA 110 kV/27.5 kV1984
T1410955510.5 MVA 110 kV/27.5 kV1984
T1511093210.5 MVA 110 kV/27.5 kV1988
T1611098110.5 MVA 110 kV/27.5 kV1985
T1710826910.5 MVA 110 kV/27.5 kV1983
T1810827010.5 MVA 110 kV/27.5 kV1983
T199583310.5 MVA 110 kV/27.5 kV1980
T2010509010.5 MVA 110 kV/27.5 kV1981
Table 2. HI coefficients and grades.
No.Criteria SGradesHIW
1DGA16A, B, C, D, E4, 3, 2, 1, 0
2Load History5A, B, C, D, E4, 3, 2, 1, 0
3Temperature and hot spots3A, B, C, D, E4, 3, 2, 1, 0
4Oil Quality16A, B, C, D, E4, 3, 2, 1, 0
5Furans8A, B, C, D, E4, 3, 2, 1, 0
6Water content in insulating paper4A, B, C, D, E4, 3, 2, 1, 0
7Bushing Condition4A, B, C, D, E4, 3, 2, 1, 0
8Tank Corrosion3A, B, C, D, E4, 3, 2, 1, 0
9Cooling System Condition4A, B, C, D, E4, 3, 2, 1, 0
10Gaskets Condition2A, B, C, D, E4, 3, 2, 1, 0
11Protection Instruments Condition5A, B, C, D, E4, 3, 2, 1, 0
12Oil Leaks3A, B, C, D, E4, 3, 2, 1, 0
13Oil Level1A, B, C, D, E4, 3, 2, 1, 0
14Overall Condition of Tap Changer26A, B, C, D, E4, 3, 2, 1, 0
Table 3. Measured gases in ppm from DGA for investigated transformers.
IndexHydrogen H2Ethylene C2H4Acetylene C2H2Ethane C2H6Methane CH4Carbon Monoxide COCarbon Dioxide CO2
T15160.58253723
T25110.517287762
T3565.52269638
T451583282702
T5963115.5213102944
T653558.69674794
T751933269767
T852127257820
T9570.52264936
T10540.52263960
T115100.55250874
T12520.52229522
T1351710.17239899
T1451582240899
T1551611.52492802
T1652718.711889771
T1752826257797
T1851952249773
T195988274788
T20521210427857
Table 4. Observed defects during visual inspection on cooling system.
Observed DefectNumber Transformers
Observed with the Defect
Transformers without Noted Defect
Corrosion on coolers17T6, T7 and T17
Corrosion on fans5T1 to T3, T5 to T11, T13 to T15 and T19 to T20
Oil leakages from coolers18T9 and T10
Oil leakages from valves20-
Missing coolers5T1, T2, T4 to T10, T12 to T15 and T19 to T20
Missing fans9T4 to T12 and T15, T16
Table 5. Observed defects during visual inspections of transformer bushings.
Observed DefectNumber of Transformers
Observed with the Defect
Transformers without Noted Defect
Oil leakage LV bushing14T7 to T10 and T15, T16
Oil leakage HV bushings17T10, T15 and T16
Broken porcelain LV bushing3T1 to T9 and T12 to T19
Broken porcelain HV bushing2T1 to T13 and T15 to T18
Polluted LV bushing17T7 to T9
Polluted HV bushings 20-
Table 6. Observed defects during visual inspections of the tank, conservator, and valves.
Observed DefectNumber of Transformers
with Observed Defect
Transformers without Noted Defect
Medium to high corrosion on tank18T9 and T10
Oil leaks from tank19T10
Medium to high corrosion on conservator18T9 and T10
Oil leaks from conservator18T9 and T10
Medium to high corrosion on valves19T9
Oil leaks from valves19T10
Oil leaks from tap changer19T10
Table 7. Observed defects during visual inspections of protection instruments.
Observed DefectNumber of Transformers
with Observed Defect
Transformers without Noted Defect
Missing magnetic oil level indicator14T3, T4, T9, T10 and T15, T16
Faulty magnetic oil level indicator2T1 to T10 and T13 to T20
Missing oil temperature indicator2T1 to T13, T15 and T17 to T20
Faulty oil temperature indicator7T2, T3, T7, T9 to T14, T16 to T18, T20
Breather with wet silica12T3, T4, T12, T13, T15, T17, T19 and T20
Table 8. Conclusions from analyzing the DGA and oil tests.
IndexDGA ResultsOil Tests Results
T1No fault detectedNormal
T2No fault detectedNormal
T3No fault detectedNormal
T4No fault detectedNormal
T5Fault was detected with low-intensity partial discharges and overheating with temperature below T < 300 °CHigh acid number
T6Fault was detected with low-intensity partial discharges and overheating with temperature below T < 300 °CNormal
T7No fault detectedNormal
T8No fault detectedNormal
T9No fault detectedNormal
T10No fault detectedNormal
T11No fault detectedNormal
T12No fault detectedNormal
T13No fault detectedNormal
T14No fault detectedNormal
T15No fault detected. High quantities of acetylene, C2H2, caution is needed.High acid number
T16No fault detected. High quantities of acetylene, C2H2, caution is needed.Normal
T17No fault detectedNormal
T18No fault detectedNormal
T19No fault detectedHigh acid number
T20No fault detectedHigh acid number
Table 9. Heath index values and expected years of service.
Health Index [%]ConditionExpected Years of ServiceNumber of Transformers
85–100Excellent>151
70–85Good>1014
50–70Fair<105
30–50Poor<30
0–30Very PoorEnd of life0
Table 10. DPs and conditions of insulating paper.
DP UnitsConditionNumber of Transformers
600–800Normal Aging Rate20
360–600Accelerated Aging Rate0
300–360Excessive Aging Rate (Danger Zone)0
200–300High Risk of Failure0
<200End of life 0
Table 11. Schedule for actions power transformers.
ActionTransformersCriteria
DGAHIDPR
RepairT5PoorFairExcellentPoor
T6PoorFairExcellentPoor
Close monitoring and further diagnosticsT15FairFairExcellentFair
T16FairFairExcellentFair
MaintenanceT1ExcellentGoodExcellentGood
T2ExcellentGoodExcellentGood
T3ExcellentGoodExcellentGood
T4ExcellentGoodExcellentGood
T7ExcellentGoodExcellentGood
T8ExcellentGoodExcellentGood
T9ExcellentExcellentExcellentGood
T10ExcellentGoodExcellentGood
T11ExcellentGoodExcellentGood
T12ExcellentGoodExcellentGood
T13ExcellentFairExcellentGood
T14ExcellentGoodExcellentGood
T17ExcellentGoodExcellentGood
T18ExcellentGoodExcellentGood
T19ExcellentGoodExcellentGood
T20ExcellentGoodExcellentGood
Table 12. Comparison of grades for all four tests used.
Method UsedNumber of Transformers
ExcellentFair GoodPoor
Dissolved gas analysis16202
Health Index15140
Degree of Polymerization 20000
Risk of failure02162
Disclaimer/Publisher’s Note: The statements, opinions and data contained in all publications are solely those of the individual author(s) and contributor(s) and not of MDPI and/or the editor(s). MDPI and/or the editor(s) disclaim responsibility for any injury to people or property resulting from any ideas, methods, instructions or products referred to in the content.

