Review

A Review of the Levelized Cost of Wave Energy Based on a Techno-Economic Model

1
College of Economics and Management, Nanjing Forestry University, Nanjing 210037, China
2
School of Engineering, Lancaster University, Lancaster LA1 4YW, UK
3
Department of Economics, Lancaster University, Lancaster LA1 4YW, UK
*
Author to whom correspondence should be addressed.
Energies 2023, 16(5), 2144; https://doi.org/10.3390/en16052144
Submission received: 5 January 2023 / Revised: 9 February 2023 / Accepted: 14 February 2023 / Published: 22 February 2023

Abstract

:
Wave energy provides a renewable and clear power for the future energy mix and fights against climate change. Currently, there are many different wave energy converters, but their costs of extracting wave energy are still much higher than other matured renewables. One of the best indicators of calculating the generating cost of wave energy is the ‘levelized cost of energy’ (LCOE), which is the combined capital expenditure (CAPEX), operational expenditure (OPEX), and decommissioning cost with the inclusion of the annual energy production, discount factor, and project’s lifespan. However, the results of the LCOE are in disagreement. Hence, it is important to explore the cost breakdown of wave energy by the wave energy converter (WEC), so for finding potential ways to decrease the cost, and finally compare it with other renewable energies. Different WECs have been installed in the same place; the Wave Dragon LCOE platform is the best one, with an energy conversion of EUR 316.90/MWh, followed by Pelamis with EUR 735.94/MWh and AquaBuOY with EUR 2967.85/MWh. Even when using different locations to test, the rank of the LCOE would remain unchanged with the different value. As the CAPEX and OPEX dramatically drop, the availability and capacity factors slowly increase, and the LCOE decreases from a maximum of USD 470/MWh to a minimum of USD 120/MWh. When the discount rate is down from 11% to 6%, the LCOE reduces from USD 160/MWh to USD 102/MWh. Under the ideal condition of the optimal combination of multiple factors, in theory, the LCOE can be less than USD 0.3/KWh. To better explore the LCOE for WECs, the detailed cost elements found in the CAPEX and OPEX have been examined for the scenarios of the undiscounted, half-discounted, and discounted cost models. When the AEP is discounted, the lowest LCOE is equal to USD 1.171/kWh in scene 2 when using a five-step investment, which is below the LCOE value of USD 1.211/kWh in scene 1 when using a two-step investment. Meanwhile, the highest LCOE amounts to USD 2.416/kWh using the five-step investment, whose value is below the LCOE of a two-step investment. When using a one-step investment in scene 3, the lowest LCOE is equal to USD 0.296/kWh, which accounts for 25% of the lowest value in the five-step investment. Meanwhile, the highest LCOE amounts to USD 0.616/kWh, which accounts for 24% of the highest value in the two-step investment. The results of the case study show that a one-step investment program in the half-discounted model is superior to the multi-step investment in the discounted model. This paper examines the viability of wave energy technologies, which is a critical factor for the LCOE of wave energy; furthermore, the form of investment in the wave energy project is also important when calculating the LCOE.

1. Introduction

The global energy demand will increase with the population and economic growth by 20–30% or more by 2040 [1], while there is an emergent task to reduce greenhouse gas emissions and secure energy supplies for human survival and development. Currently, the global fossil fuel consumption is still 78.5% of the total energy consumption in 2020, while renewable energy sources are only at 12.6% and other energies are at 8.9% [2]. In the “Energy Roadmap 2050”, the proposed aim is to reduce greenhouse gas emissions by 80% by 2050 compared with levels from 1990 and have renewable energy account for at least 40% and up to 80% of the electricity consumed [3]. The Trends and Projections in Europe 2021 issued by the European Environment Agency points out that the EU has adopted a 55% net emissions reduction target by 2030 and aims for climate neutrality in the EU by 2050 [4].
There is an obvious conflict between the high consumption and the emissions of fossil fuels and requirement of carbon neutrality. To solve the dilemma, one of the well accepted solutions is to gradually replace fossil fuels with renewable energies and zero-emission sources, which also could enhance the independence of energy supplies for many countries.
Ocean renewable energy, with its vast resources, space to develop projects, as well as zero emissions of greenhouse gas, has currently been seeing a vigorous development. Among the different ocean renewable energies, wave energy has several potential advantages over other renewables, such as being more predictable than wind energy and being available at night unlike solar energy [5]. Compared with other ocean renewable sources, wave energy is characterized by a high power density and low visual impact, and it is presumed to have a low impact on the environment [6,7].
It is estimated that the total wave energy has a yearly theoretical potential of 32,000 TWh in areas located between the 30° and the 60° latitude lines (in both the northern and southern hemispheres) [8,9], whereas 2 TW of power can be extracted from the wave resource [10]. According to the “Wave energy: technology brief” issued by the International Renewable Energy Agency (IRENA) [11], 2% of the 8 million kilometers of coastlines around the world have wave power densities exceeding 30 kilowatt per meter (kW/m) (which is the wave energy density that is suitable for extraction if commercial wave energy farms are developed). The estimated wave energy production is 500 gigawatts (GW) of electric power if a 40% conversion efficiency can be reached [11]. The great potential is encouraging researchers and developers to develop various wave harvesting technologies to convert the wave energy into electricity or other useful energies. Many institutions and companies are focusing on the development and design of wave energy converters.
Understanding the cost of wave energy technology is crucial to ensure that it is competitive in the electric power market and to help make appropriate business decisions. The levelized cost of energy (LCOE) is a widely used benchmark for the economic viability of various energy generation technologies [12], including wave energy; it can effectively indicate the difference between the costs of electricity generated using different wave energy technologies as well as the gaps among the costs of wave energy and other ocean renewable energies, exploring both the technical and non-technical ways to reduce the cost gap. That is, the LCOE feedback can help to continually innovate the wave energy output and optimize the wave energy generator entity.
Certainly, if the wave energy is qualified with a competitive power supplier in the power grid market, the technology factor is not the only problem. The LCOE, which implies both technical and non-technical characteristics to evaluate the economic performance of the wave energy project, must be studied so as to support researchers, investors, project managers, and policy makers in project decisions, even if the different wave energy technologies are still being developed in small-scale marine tests or in the laboratory.
The results of the LCOEs, based on different wave energy converters, are in disagreement. Moreover, the LCOE of wave energy is much higher than the cost of other matured renewable energies, which is a major obstacle to the commercialization of wave energy production; these problems are related to the technological, financial, and political barriers that need to be overcome before wave energy can make a significant contribution to the future energy mixture.
Previous reviews of the LCOE for marine energy have been conducted [13,14,15,16,17,18,19]. When the LCOE has been used to evaluate the economic performance of wave energy, most researchers have focused on the comparison of the LCOE with the same cost centers. In fact, the breakdown of wave energy cost may generally be conducted in a similar manner, but the measurable cost element of the cost centers can change under different assumptions. The assumptions and justifications of the LCOE for wave projects lack a systematic clarity and comparison with each other. Especially, the investment mode of the wave energy project has not been discussed in previous reviews. Misleading results may have occurred. Thus, the traditional LCOE metric is inappropriate for comparing the dispatchable generation with renewable energy [20].
With the explanation of the appraisal model in this review, a homologous form of the LCOE model for wave energy is studied to identify LCOE reduction methods, summarize existing LCOE results in different technological wave energy converters, and comprehensively and systematically sum up the sub-cost of capital expenditure and operational expenditure. As the aim is to reach competitive commercial costs, a variety of clues are summarized in this review. After all, the management activities and business processes are beside the cost. In contrast, the optimization of business activities and management policies will reduce the part costs of CAPEX and OPEX. In addition, three investment modes are discussed in the case study, and the result further supports the above conclusions.
As a result, as it is well-accepted as the metric for the cost and economic analysis of wave power generation systems, the LCOE was used to evaluate whether the project is commercially feasible or not.
The rest of the paper is arranged as follows: Section 2 reviews the research achievements on the LCOE for wave energy. Section 3 briefly introduces the current wave energy technologies. Section 4 discusses the sub-costs of cost centers and calculates the levelized cost of wave energy by the present value model. Section 5 introduces the cost models. Meanwhile, in Section 6, a case study is carried out to compare the LCOE, which would affect the investment program. Section 7 draws conclusions from the above discussion and highlights some considerations for the application of wave energy in the future.

2. Literature Review

The LCOE calculation of the unit cost of energy can provide a useful comparative measure between projects and technologies or alternative sources of energy. More recently, the LCOE approach has been employed using the discounting techniques to assess the future cost flows and energy production and assess its economic performance in wave energy projects [21]. Most WEC projects for wave energy have used the LCOE to assess their technical and economic characteristics. Due to the limited amount of electricity generated by wave energy converters (WECs) so far, technologies of utilizing wave energy are still at a pre-commercial stage [22]. However, for the developers of WEC technology to attract private investment, it is vital that they obtain realistic estimates for the LCOE.
There are some different LCOE methods in the literature, such as the annuity LCOE [23], stochastic levelized cost of energy model [24,25], and other improvements methods based on the LCOE [26,27]; as well as the reversed LCOE [28] has been applied to find the potentials for the reduction cost of wave energy.
Most LCOEs of wave energy estimate their values as nearly ranging between EUR 0.30/kWh and EUR 1.20/kWh [29,30]. Even if measured in different currencies, the LCOE of WECs is in a range of USD 0.18–0.87/kWh, whereas that of solar energy varies from USD 0.06/kWh to USD 0.38/kWh; offshore wind energy varies from USD 0.10/kWh to USD 0.56/kWh [31]. The LCOE of the various wave energy generation technologies is much greater than other renewable energy sources.
In the view of most of the literature, two costs, CAPEX and OPEX, are involved in the LCOE calculation divided by the AEP. The CAPEX for wave energy is often a fixed number or depends on a single variable (e.g., converter characteristic mass or reference cost). Nowadays, most CAPEX components are accessible by wave companies [32]. The CAPEX can be accumulated by the cost centers, which usually include the cost of one converter and its installation, cost of cable, cost of the substation, cost of the electrical installation, and cost of the mooring system and its installation [33]. Calculating the OPEX is a complex process, as there is not enough experience in wave energy installations. Nevertheless, it can obtain the reference cost based on the experience of oil and gas and offshore wind energy sectors.
One of the aims of calculating the LCOE is to look for the cost reduction pathways of the wave energy so that wave energy conversion projects are competitive relative to alternative energy industries [30]. However, cost reduction by the LCOE involves the efficiency of WECs (technical factor), construction of the wave energy project (engineering factor) [28,34], sizes and arrays of WECs (management factor) [35,36], cost measurement (method factor) [37], local potential of the sea wave state (environment factor) [38], etc.
This study aims to examine the LCOE method for wave energy and systematically sum up the element costs of CAPEX and OPEX and their measurement methods. Finally, a case study is discussed by the LCOE method with the related cost centers and their element cost.

3. Current Wave Energy Technologies

Different WECs would have different electrical outputs of wave energy extraction [39] and thus a different levelized cost of wave energy. Over 100 different types of WECs have been proposed and developed, and some of them have undergone testing and development for decades, and some have generated power to the grid [40].
There are different standards for classifying the WECs. According to bathymetry, WECs can be classified into fixed and floating devices depending on their depth [41], i.e., up to 50 m (shallow waters) or more than 50 m (deep waters) [42]. Based on the working principle, they are classified into oscillating body WECs (OBWECs), oscillating water column WECs (OWCWECs), overtopping WECs (OWECs) [43] and novel concepts that are beyond the above categories, such as the devices using flexible membranes [44,45,46], hybrid technology [47], multi-axis technology, etc. For example, the TALOS II multi-DOF WEC is a new design idea for extracting wave power from three dimensions to raise the output rate. The output of the TALOS II multi-DOF WEC may be bigger than that of other WECs [48]. In terms of device realization, OBWECs can be subdivided into point absorber type, attenuator type, and terminator type. In terms of technical principles, wave power production technology can be divided into three types: type of oscillating buoy, type of oscillating water column, and type of overflow [43].
The selected WECs are listed in Table 1. Many countries, companies, and research institutions are testing their WEC equipment and are performing small- or large-scale WEC projects at sea sites or in laboratories. It is necessary to know the potential of electrical power produced by the WEC and the potential wave resource at the sea location as well [49].
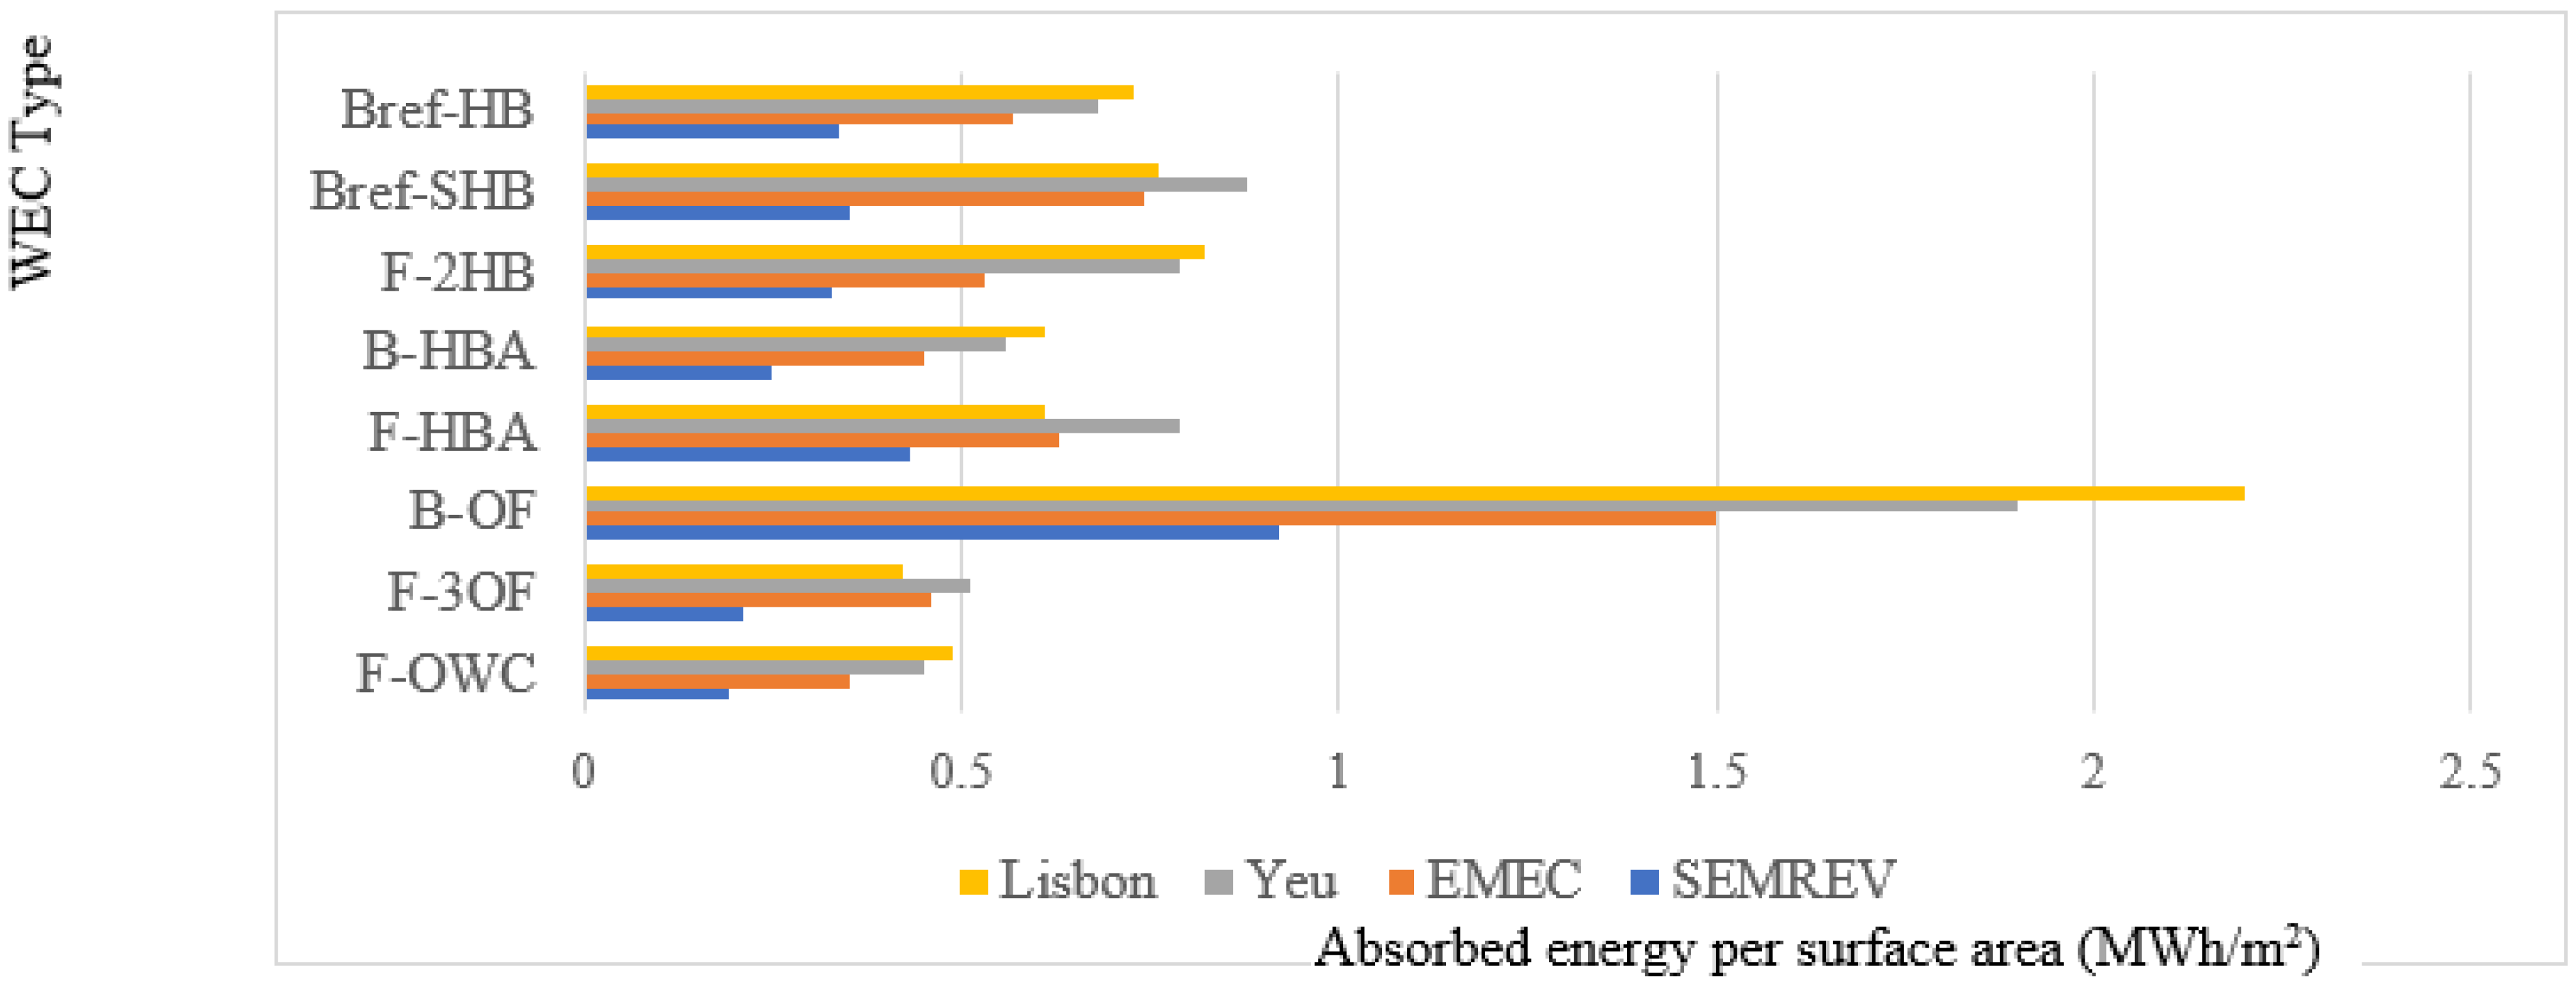
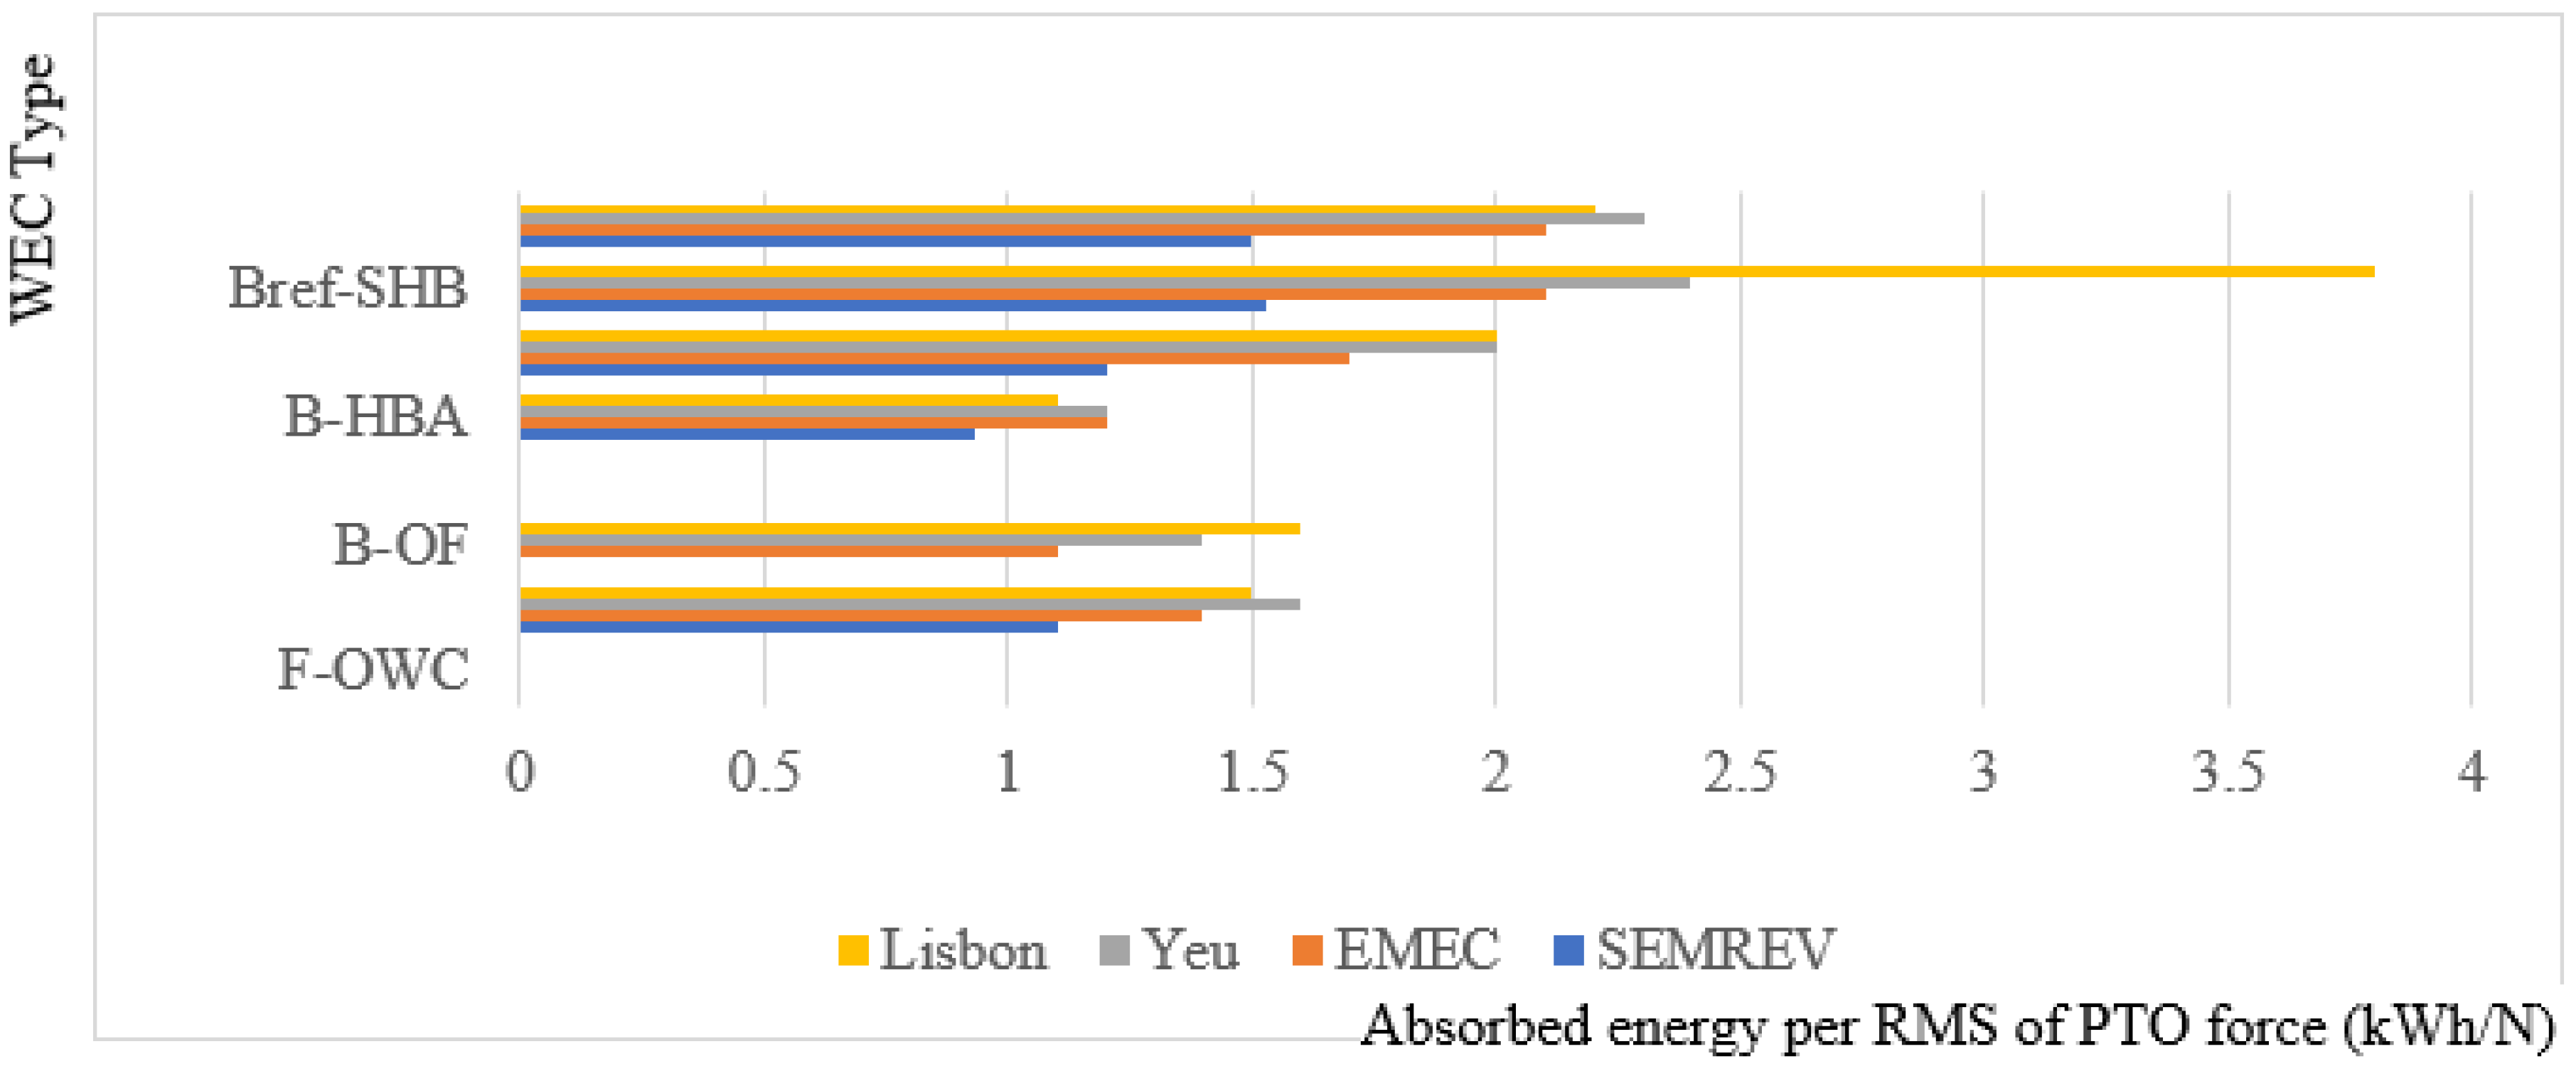
Because the goal of different WECs is to develop competitive technology and commercialization, the parameters related to this goal should become part of the framework for the economic and technical performance comparison. The efficiency through the capture width ratio, power absorbed per weight, and surface area or power-take-off (PTO) force need to be considered to decide the output of the WECs. The eight different WECs were executed to compare their technical performance in Figure 1, Figure 2, Figure 3 and Figure 4 [60]. The bottom-fixed oscillating flap (B-OF) has significant advantages in the capture width ratio and absorbed energy per surface area (MWh/m2). The bottom-fixed heave-buoy array (B-HBA) and floating oscillating water column (F-OWC) have significant advantages in the absorbed energy per characteristic mass (MWh/kg). When discussing the PTO—the core technology of the WEC—the bottom-referenced submerged heave-buoy (Bref-SHB) and small bottom-referenced heaving buoy (Bref-HB) illustrate their preponderance in the parameters of absorbed energy per RMS of PTO force (kWh/N) [60]. The highest performance of absorbed energy per characteristic mass among the Bref-SHB, F-3OF, F-OWC, Pelamis, F-HBA, Brif-HB, and F-2HB appears in F-2HB, which amounts to 6.292 kWh/kg. The floating three-body oscillating flap (F-3OF) capture width ratio accounts for 36.5% by the scaled devices [61]. From the performance presented by the absorbed energy per surface area (MWh/m2), the Bre-SHB system performs very well among Bre-HB, F-HBA, F-3OF, F-2HB, and F-OWC WECs [30].
The technical mechanism of WECs generally includes an energy capture mechanism, a transmission mechanism, and a power generation mechanism. It is usual to consider the ratio between the absorbed power and the scale displaced by the converter. However, considering the difference between the existing PTO systems and the scales and sizes of the WECs, the performance index, technology cost economy (TECO), is preferable for identifying the technical and cost performance in relative terms. TECO uses the scale of WECs, mean absorbed power, width of the device, seawater density, gravity, wave surface, and wave period difference [43] to build the indicator. The results show that the multi-axis series structure WECs (three-DOF WEC and six-DOF WEC) developed by the research team from Lancaster University have an obvious technical performance advantage among the point absorber, attenuator, terminator, OWC, OWEC, and MDWEC.
Many research papers have focused on the detailed assessment of the energy production of WECs in specific locations or simulations [62,63,64,65,66,67,68,69]. In order to achieve the initial goals of wave energy and avoid damaging the marine environment where the WEC is assembled in a sea location, it is important to identify the local wave pattern and then judge the optimal WEC configuration, taking into account the domino effects that may occur in neighboring coastal sectors. Based on its power matrices, the existing WECs have differently rated power operating ranges. The capacity factor of a WEC is in the range of 25–35% [70]. The higher the capacity factor is, the greater the electrical power output. If the output power rate increases, the LCOE can be reduced while other parameters remain unchanged.
The LCOE indicator has dual characteristics. The measurement model of LCOE puts the technology of WEC and its expenditure together. So, the LCOE can reflect the technical advancement and continually propel the technological development of WECs; it can also optimize the cost structure of the wave energy project and help to find the available cost reduction.

4. Methodology

The LCOE is widely used to compare the cost advantage and then decide the choice of investment scheme. Wave energy has not yet been able to break into the commercial marketplace as currently, cost is a major barrier. The element costs of the total project cost are reexamined and integrated into the appraisal model, which decides the fate of a wave energy project. The purpose of this article is to systematically describe the model of the LCOE as a reference for the next case study and group different element cost calculation methods for future wave energy priorities.

4.1. Distribution of Costs

The costs of a project over its lifecycle are distributed over different stages: pre-operation, initial investment, operational investment, and decommissioning cost at the end of the project [71]. Each kind of cost at year t can be divided into a cost center. The cost centers are shown as follows [33,71,72].
(1) Pre-installation cost (or pre-operating cost), described by PC; (2) implementation cost (capital expenditure), described by CAPEX; (3) operational cost, described by OPEX; and (4) decommissioning cost, described by DC. Most studies focus on the last three cost centers. The details of the cost centers vary according to the assumptions of cost. These costs centers in the techno-economic model will determine the cost competitiveness of the levelized cost of wave energy. The position of the slider s (Figure 5) stands for the start point of the project, which is generally set as zero. The start point of the project is up to the position of slider s at the time axis. As a result, the discounted methods of the cost centers in the techno-economic appraisal models would be up to the position of the slider s in the time axis.

4.2. Techno-Economic Model

There are three types of techno-economic models used to calculate the levelized cost. The requirement of the discount factors in the model is an important key.
(1)
Undiscounted cost of energy
Undiscounted cost of energy (UCE) is the total cost divided by energy production [28,73]. This kind of model is shown as Equation (1).
U C E = t = i n T C t t = i n E t
where TCt stands for the total expenditure at year t in the project lifespan, Et describes the energy production at year t, and UCE denotes the levelized cost of the project over the whole period.
This kind of cost model is distinguished by its simplicity to calculate the cost per unit of energy. However, the UCE ignores the time value of cashflow and accumulated process of energy production.
While it might compare the cost of projects with the same technology, the UCE model cannot directly evaluate the levelized cost of the project of the different technological devices [73].
(2)
Half-discounted cost of energy
The time value of capital is considered into the cost of the project. The model of the half-discounted cost of energy (HDCE) is shown as the Equation (2).
H D C E = t = i n N P V ( T C t ) t = i n E t = t = i n T C t × D F t t = i n E t
where DF denotes the discount factor, which makes the total cost discount into the present value at year i; HDCE still denotes the levelized cost of the project over the whole period.
This kind of cost measure is originally comparable to the net present cost per barrel measure commonly used as a tool in the oil industry [74]. The discount of the energy production at year t is not included in Equation (2) [75]. The annual energy production output may vary within a limited range because of the WECs gradually reaching their peak output due to the efficiency improvement or output loss due to the device’s failure. This model can appraise the performance of investment schemes with the same scale of installment. However, the energy production output does not map with its risk over the whole project; it fails to compensate for the production capacity of WECs. As a result, the sub-costs of OPEX are biased, such as the repair costs of the WEC’s components, etc., and then have an impact on the LCOE.
(3)
Discounted cost of energy
The discounted cost of energy (DCE) is defined as the present value of the total cost divided by the discounted energy output, as shown in Equation (3).
D C E = t = i n N P V ( T C t ) t = i n N P V ( E t ) = t = i n T C t × D F t t = i n E t × D F t
This method is used by the Nuclear Energy Agency and International Energy Agency (2005) in their joint reports [76]. Considering the time value of capital and discounted output of WECs, the model of the discounted cost of energy is a good choice for calculating the levelized cost of wave energy by different technological WECs and comparing the advantages and disadvantages of investment schemes.
Until now, most techno-economic models consider that the investment of the wave energy project occurs at one time. As a matter of fact, the money would be gradually invested into the project out of the principle of prudence. Thus, an investment mode should be concerned about the LCOE of a wave energy project.

4.3. Discount Factor

The discount factor (DF) in the model is an important key, as well; it makes each future value over the lifespan discount into its present value at year zero and then help to compare the different investment plan. The discount factor (DF) is generally defined as Equation (4) [30].
D F t = 1 ( 1 + r ) t
where r is the discount rate, which is replaced by the interest rate; t is the year number of payments; and DFt denotes the discount factor at year t.
The discount rate represents the profitable judgement and investment attitude of stakeholders. In essence, the discount factor is the necessary return rate required by an enterprise when purchasing devices or investing in a project. The aim of the DF is to discount each future value over the lifespan to the value at year zero. The DF makes the levelized cost of wave energy more fair and reasonable. The necessary DF ensures that investors accept the cost of the wave energy project. Therefore, they are willing to invest in the technology development and provide capital for the later implementation of the wave energy project.
The capital faces the choices from the investment in the project and bank deposits to obtain its return. The discount rate is used to convert between one-time costs and annualized costs [77]. In general, the interest rate is used as the discount rate, which represents all future cash flows being converted to a present value. Both of them are like a coin, having two sides. On the one hand, the interest rate should be grouped with the inflation rate, which is to compensate economic losses out of currency policy, etc., when the inflation occurs; on the other hand, the discount rate should exclude the inflation rate to describe the future value converted into the present value in project. If the discount rate with the higher risk is greater than or equal to the interest rate with the lower risk, investors are propelled to invest in the project. To balance, there are compromises in Equation (5); its transformation is also shown by Equation (6) [71,77,78]. The inflation rate has a simultaneous change with the discount rate, which impacts the power generation costs and investment returns out of the economic analysis. In essence, the discount rate and loan rate describe the time value, and both of them may change together. According to Equation (6), the inflation rate increases, and the discount rate becomes great for offsetting the negative effect of inflation and vice versa. Certainly, there are several different considerations regarding the discount rate and inflation. However, the consideration of inflation is excluded from the main discussed topic.
r ( 1 r i n f l a t i o n ) = r i n f l a t i o n + r l o a n
where r, rinflation, and rloan denote the discount rate, inflation rate, and loan rate, respectively.
r = r i n f l a t i o n + r l o a n 1 r i n f l a t i o n

4.4. Levelized Cost of Wave Energy

The LCOE represents the average minimum price at which the electricity produced can be sold to break even over the lifetime of the project [79]. Also, the annual revenue must include the feed-in tariff [80]. The total costs occur over the lifetime of the project. The annual present value of energy production is divided by the difference between the present value of cumulated revenues flows and the total cumulated costs. Both the discount rate and the feed-in tariff are usually considered as constant. Furthermore, inflation and taxes are neglected over the project lifetime for simplifying the calculation. Of course, the present value coefficient of the future value of compound interest is used to discount the revenue flows, total costs, and annual energy production. The techno-economic appraisal model is shown as Equation (7) [81].
N P V O C = t = 1 n R E V t ( 1 + r ) t t = 1 n T C t ( 1 + r ) t t = 1 n A E P t ( 1 + r ) t
where REVt means the total revenue flows from electricity sales at year t, TCt denotes the total costs of the wave energy project at year t, AEPt is the annual electricity output at year t, r presents the discount rate, n is the terminal year of the lifespan or the deadline of the project, and NPVOC is named as the result in the right of Equation (7).
According to the LCOE’s original definition, the present value of cumulated revenue flows just compensate for the present value of total cumulated costs at the break-even point. So, the total cumulated revenues are equal to the counterpart costs shown in Equation (8). In order to measure the cost, the LCOE is named for the right side of Equation (8).
t = 1 n R E V T ( 1 + r ) t t = 1 n A E P t ( 1 + r ) t = t = 1 n T C t ( 1 + r ) t t = 1 n A E P t ( 1 + r ) t
In order to calculate the LCOE, three quantities are required: the total project cost, the total energy produced over its lifetime, and the discount rate. When a wave energy project is carried out from start point i in Figure 1, money is paid for the activities or services from year i to year n. At year t, CAPEX supports the technological research and manufacturing of WEC systems [82], enlarges the wave energy array, and replaces the old-fashioned WECs with new equipment that complies with capital expenditure regulations.
During the lifespan, the wave projects and their WECs need to keep normal operation and maintenance. The OPEX deals with the hiring of staff, port facilities and equipment, daily expenses on system of software, repair of damaged components, etc. The equipment that is terminated needs to be dismantled. Inevitably, the dismantling costs are paid. So, the CAPEX, OPEX, and DC constitute the TC. The LCOE calculation is described in Equation (9).
L C O E = t = 1 n C A P E X t + O P E X t + D C t ( 1 + r ) t t = 1 n A E P t ( 1 + r ) t
Because the DC in the CAPEX is small, estimated to be 0.5–1% [83], it is usually negligible to zero [84], assembled into the CAPEX [80], or grouped into the OPEX [85]. As a result, the LCOE can be described by Equation (10). Many opinions assume that the sub-costs of CAPEX occur at time zero and that CAPEX does not need to discount for the present value. Thus, the LCOE only comprises the CAPEX without discount and OPEX with discount presented by Equation (11) [30,35,80,86,87,88].
L C O E = t = 1 n C A P E X t + O P E X t ( 1 + r ) t t = 1 n A E P t ( 1 + r ) t
L C O E = C A P E X + t = 1 n O P E X t ( 1 + r ) t t = 1 n A E P t ( 1 + r ) t
The first point is to clarify the composition of the CAPEX and OPEX. Once the element costs are confirmed, they will be gathered into different sub-costs which consist of the CAPEX and OPEX. Most researchers are in favor of the LCOE model shown in Equations (10) and (11) [29,30,89]. This method actually minimizes the cost of the wave energy output at the time axis divided by the AEP with the design parameters configuration [90]. Despite calculating the LCOE using Equation (10), most researchers still insist that the CAPEX occurs at year one. Thus, no matter what the equation structure is, the calculation of the model tends to converge. From the description of the model, the change in the LCOE remains monotonous with the CAPEX and OPEX.
Due to the current limited commercial significance of wave energy and the lack of large-scale verification of wave energy projects, the LCOE has been starved of tremendous and reliable operation and maintenance data. Thus, the calculation of the LCOE remains controversial.

5. Configuration of LCOE

5.1. Pre-Installation Cost and Decommissioning Cost

(1)
Pre-installation cost
Pre-installation cost (PC) refers to the development and consenting costs that begin from developing the concept of a project to the point of a financial close or commitment to build; it is often ignored. Generally speaking, the stage of pre-installation is prior to the project start point, year i, which is about 3 years ahead [91]. The PC incorporates the selection of the place, size of plant, environmental impact assessment, permits and licenses [29], preliminary studies, consenting procedures, direction and coordination [33], market study, legislative factors, and farm design [92].
If the PC is included in the TC to estimate the LCOE, the start point of the project is moved to the year i–3; the LCOE model is shown in Equation (12). In fact, the PC must be incurred whether the project is ultimately successful or not. The PC is a sunk cost once it is paid. If the project begins to execute preliminary research at year i–3 but the start point of a wave project persists in year i, the PC would accumulate by compound interest into the future value at year i, and then the LCOE model should be revised as Equation (13).
L C O E = t = i 3 n P C t + C A P E X t + O P E X t + D C t ( 1 + r ) t t = i 3 n A E P t ( 1 + r ) t
L C O E = t = i 3 i P C t × ( 1 + r ) t + t = i n C A P E X t + O P E X t + D C t ( 1 + r ) t t = i n A E P t ( 1 + r ) t
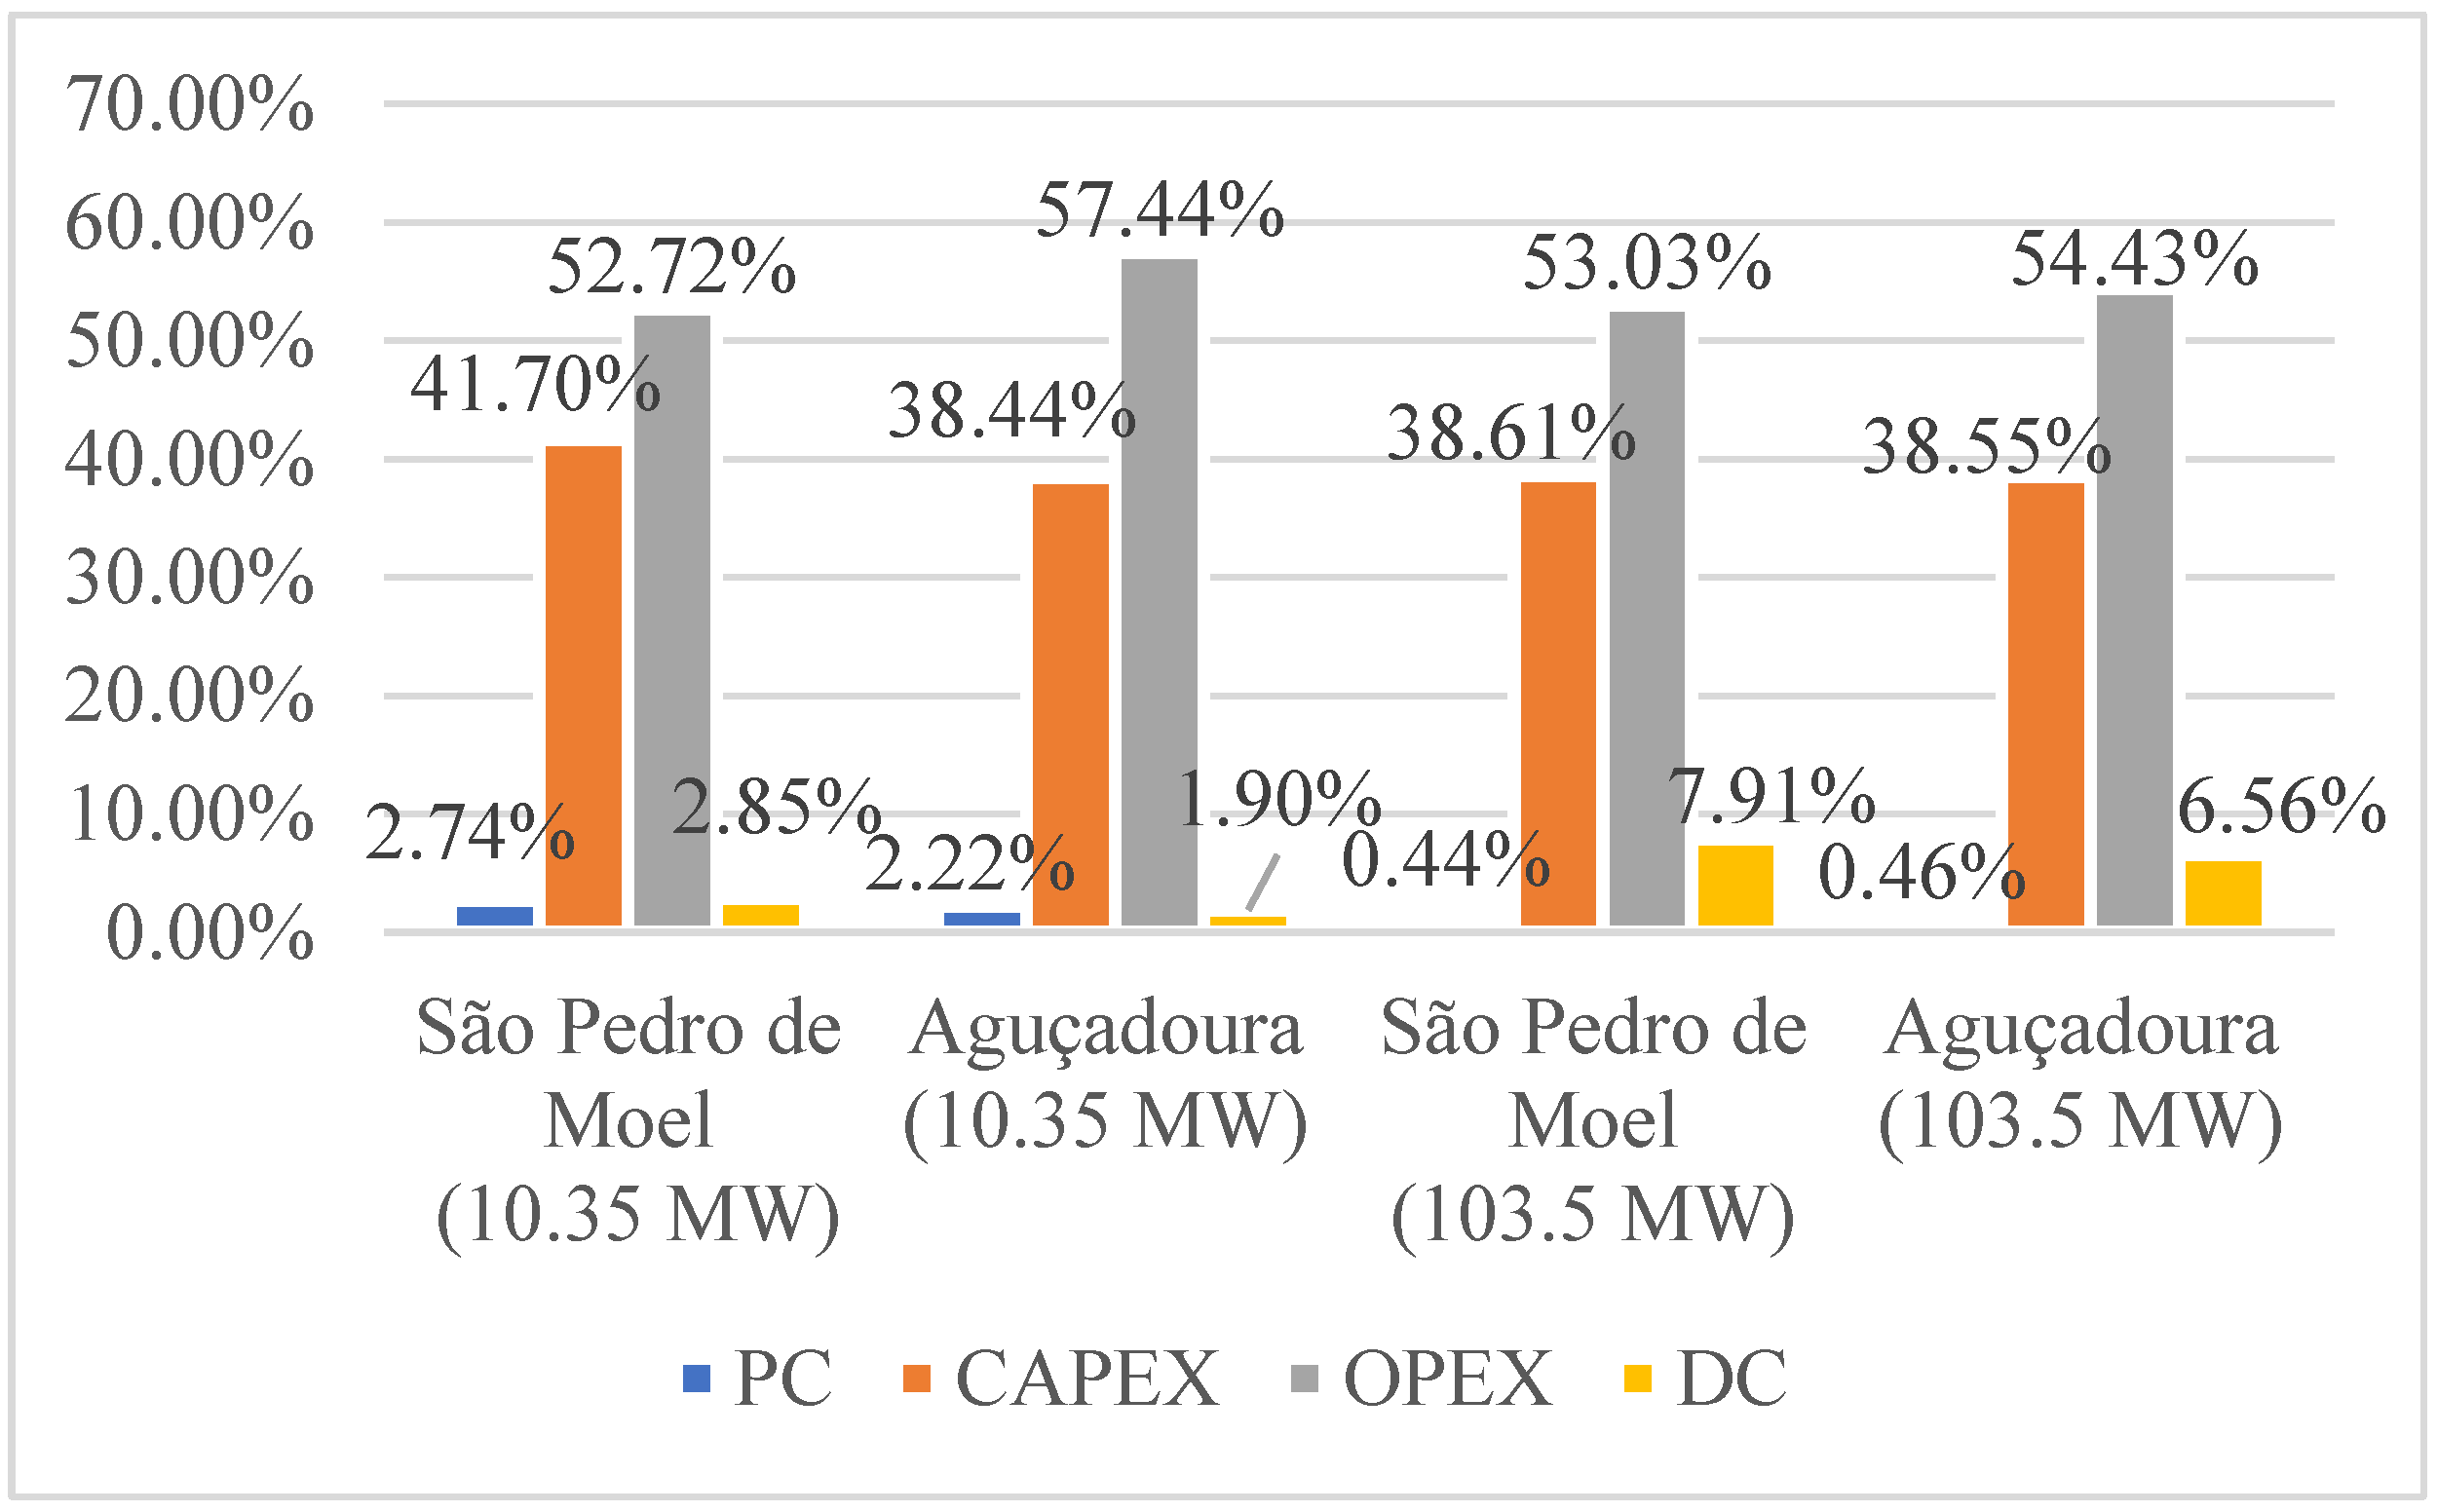
The start point of a wave project will determine how to deal with the PC and then increases or decreases the value of the LCOE. However, the estimation of the PC is a complex process and makes the overall project cost most sensitive [77]. Sometimes, the PC is included in the CAPEX. The PC is normally estimated to be a small percentage of the total cost of a wind energy project and a combined wind–wave farm project [92], which are shown in Figure 6 and Figure 7. However, it usually does not fully describe how these element costs of the PC are being calculated [71], and it may make the cost calculation a mess. Most economic analyses of wave projects do not include the PC [93,94,95,96] due to its small percentage and its attribute of sunk cost. The PC involved in the TC will depend on investment preferences, investor caution, externality of investment projects, and so on. Perhaps the technological development of WECs is the main focus, which may have a great impact on the CAPEX and OPEX.
(2)
Decommissioning costs
The DC refers to the money spent on dismantling this kind of equipment. When the project lifespan is over, expenditure will pay to remove any devices, moorings, anchors, and electrical systems and to clean the energy site [71]. It is often estimated by the percentage of other costs. There is a big difference in the percentage gap among the DC towards the different counterpart costs. The DC percentage of the CAPEX (or initial cost) ranges from 0.0017% to 10% [75,77,97,98]; the DC can be included into the CAPEX in the calculation [80,99]. When compared with the TC, the DC percentage amounts to 3–6.26% [44,92]. When the wave project is put into an ocean test, the sub-costs of the DC get their detailed values, as shown in Table 2. The measure of the DC is different in the seas of the world due to equipment difference, local sea situation complexity, labor cost, etc. In general, the percentage of the DC is still small. Sometimes, the DC is also negligible [71].
The PC and DC percentages are insignificant. On the contrary, the gross percentage of the CAPEX and OPEX of the total cost is beyond 90% [48,92]. It is clearly necessary to be concerned about the CAPEX and OPEX.

5.2. Capital Expenditure

The inner structure of capital expenditure and its measurement method would influence the investment mode of the wave energy project and the result of the LCOE. The systematic analysis of the capital expenditure makes researchers and investors know where and how to invest and then reduce the LCOE of project implementation in the future.

5.2.1. Cost Measure

Different methods of cost measures make the CAPEX precise and reliable. As a result, investors know why they should spend money, how to spend money, and what to spend money on.
Capital expenditure often refers to the initial investment needed to acquire physical assets for a wave project and external non-technological costs. All of the expenditures relate to project development, deployment, and commissioning before the operation of the WECs. The key sub-costs of the CAPEX involve the structure and prime mover, PTO, foundations, moorings, installation, grid connection [100,101], and cost margin [90]. The extra sub-costs consist of the hook-up cost [102], pre-assembly and transport, and control and safety [103].
The selected issues of critical importance to the WEC design include the PTO system, control and optimization, survivability, mooring, power transfer and electrical grid interfacing, manufacture and logistics, environmental impact, and legislation [77]. These sub-costs of the CAPEX are assumed to occur at time zero. Due to the differences among the WECs, the CAPEX structure is not exactly the same. Overall, the sub-cost of the CAPEX includes the cost of devices, electrical systems, and installation cost [80]. When the CAPEX is estimated, the values are different from the technical principle of the wave converter, classification of cost, sea locations of world, benchmarks of cost measure, etc. As a result, they are measured by different element costs, as shown in Table 3.
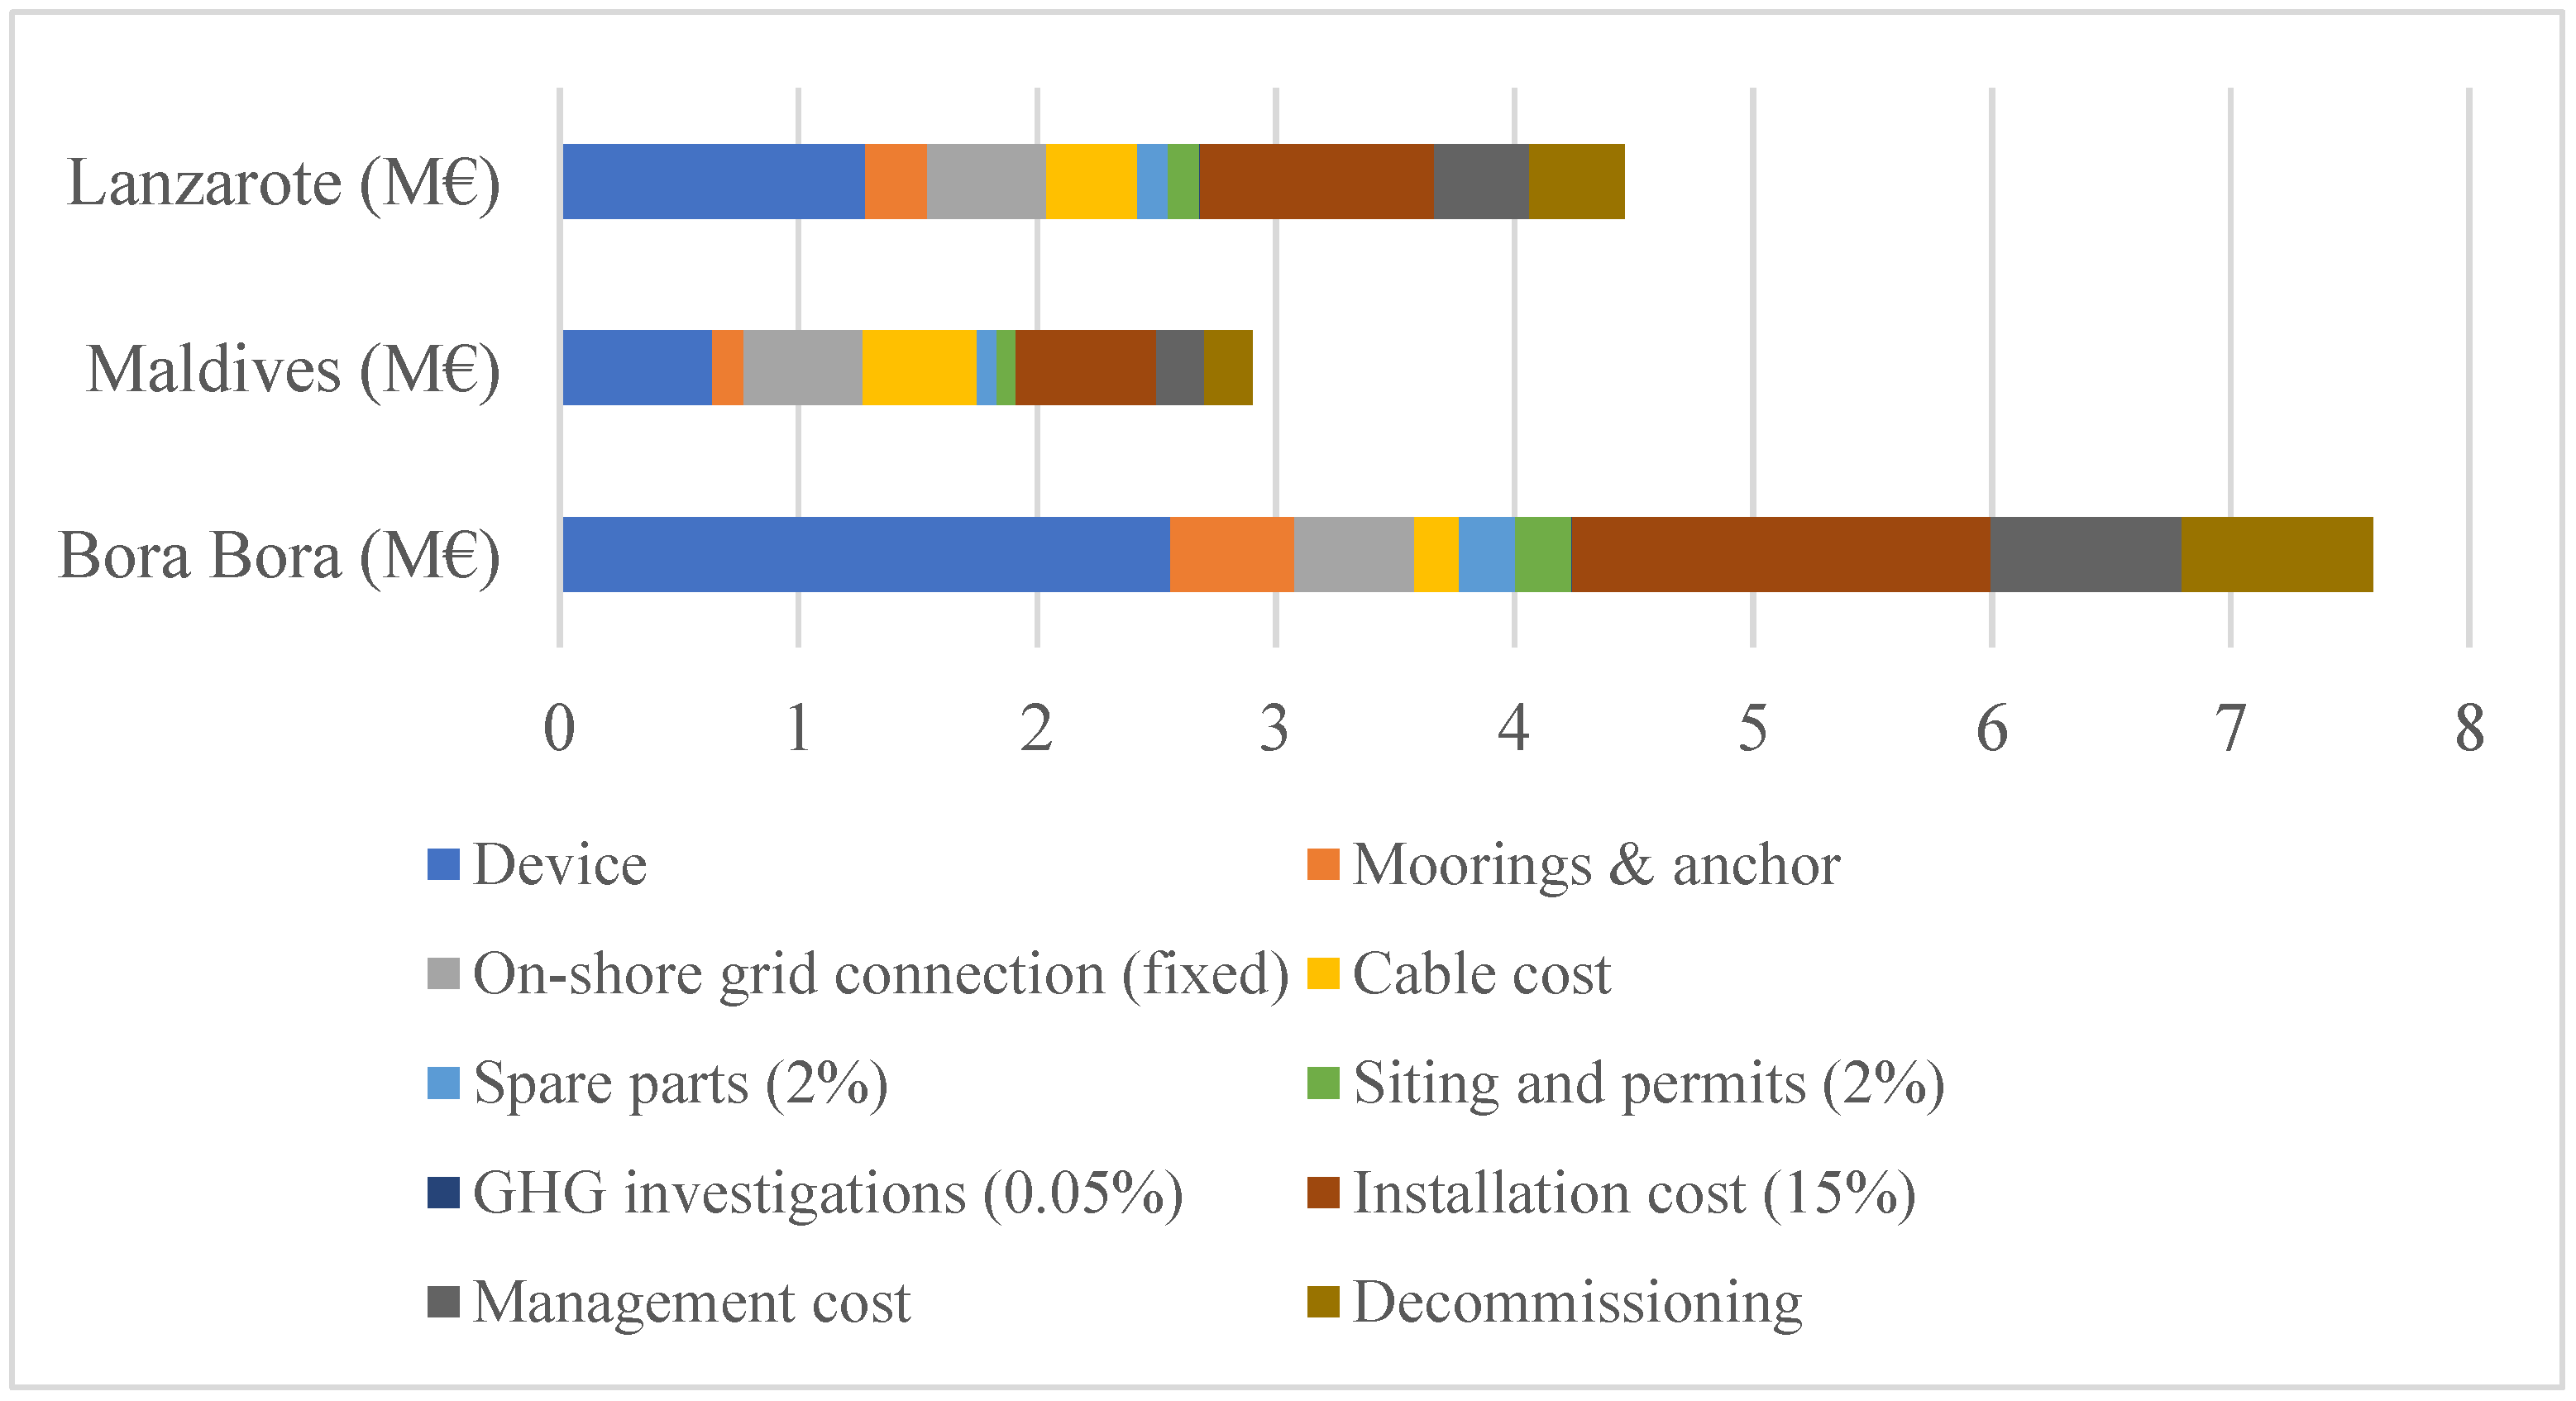
The structure cost shows the highest position in the CAPEX, whose normalized cost value amounts to 0.455 (Table 3). The percentage of the structure cost is 38.2% of the CAPEX [35]. The structure cost usually includes the infrastructure design and mooring attachments. The PTO cost is the next one in the sequence. The gross values of the structure cost and PTO cost is over 50% of the CAPEX. The actual testing results executed in Bora Bora (French Polynesia), Maldives, and Lanzarote (Spain) show that the device cost (which includes the structure cost, PTO cost, and associated costs) is predominant in the CAPEX structure (Figure 8).
(1)
Mass cost
Though there is a lack of data of real commercial WEC operations, the price of the material mass can measure the costs of WECs. Thus, the CAPEX can be divided into mass-related costs (structure, foundation and mooring, and installation) and power-related costs (cost of the PTO and grid connect) [104]. The price of materials is easily received from the market. The structure cost [84] and device cost can be calculated from the material mass and its market price. For example, the PTO is the core technology of the wave energy converter. There is no direct market price reference; thus, it is difficult to estimate the cost. However, the manufacturing materials of PTO provide new ideas for cost estimation. The PTO cost (which consists of iron, copper, and permanent magnet) is equivalent to the unit price, which is assumed to be 3.3 EUR/kg, 15.2 EUR/kg, and 24.7 EUR/kg [101] multiplied by the mass of the materials consumed, respectively. The material of the WEC and its accessories, which are often constructed by the concrete and iron, etc., can easily be precisely measured. The mass cost can be used to calculate the cost of the stake in the sea bottom to fix or moor the WEC, the hull of WEC, and so on. It is good to calculate the CAPEX because it is close to market value and overcomes the lack of cost data to some degree.
(2)
Flexible cost
Although the flexible cost varies with the volume of production or business, the unit cost (price) is unchanged. Some components of the WEC can be calculated by this method to measure their costs. The total flexible cable costs depend on a unit price of 500 EUR/km [80] and the length of the underground cable and submarine cable. The flexible cost can estimate the labor cost and fee of vessels when the WECs are installed into the sea location; it can even calculate the total expenditure on the WECs when each device cost is provided in the wave farm project. Other similar costs can be evaluated by this method. With the scale enlarging year-by-year, it is an appropriate choice to measure the flexible cable cost at year t so that the results keep pace with the market price
(3)
Direct cost
Some element costs are paid for purchasing the accessories of WEC. Especially, sharing common components are used to the WEC and operation of wave project, these total purchase prices are considered as the element costs. Some money is distributed on some business activities to maintain normal operation by fixed amount money in the fixed period, such as equipment replacement or enlarging scale by installment investment. These kinds of cost with a market signal can be precisely measured to calculate the sub-cost of CAPEX.
(4)
Intangible cost
The technological value-added, human capital value, and administrative costs are not ignored but are difficult to assess. The estimation of technological value-added can be replaced by research and development (R&D) expenses of the WEC or by a similar technology transfer price in the patent market. The labor cost would comply with local minimum wage laws, but the administrative hierarchy makes human capital estimates imprecise. It can also be considered as a percentage of the counterpart reference cost. For example, the percentage of labor costs (EUR 25,000) amounts to 31.23% of the device cost [80]. The percentage shows that human capital value is a remarkable part of the capital cost. This kind of intangible cost can encourage the activation of human intelligence for technological development or high efficiency of management.
(5)
Percentage cost
The Innovativeness of WEC make some element cost hardly estimated. Without direct or market signals, some element costs are estimated by percentage of similar activities cost accounting on special costs of other energies sectors by their business experience. After all, there are some homologies on business activities and technological application when different primary energies generate electronic power output. It is appropriate to select the method of percentage cost.

5.2.2. Comparison of CAPEX

While the first commercial-scale project of WECs simulates the CAPEX, the results are up to 2700 USD/kWh per year (minimum) and 9100 USD/kWh per year (maximum) [105] or 2194 GBP/kWh per year (minimum) and 7394 GBP/kWh per year (maximum) [106]. These calculated results of the CAPEX per kWh a year are based on the assumption that the expenditure occurs at year 0. The CAPEX bears a big risk in a one-step investment.
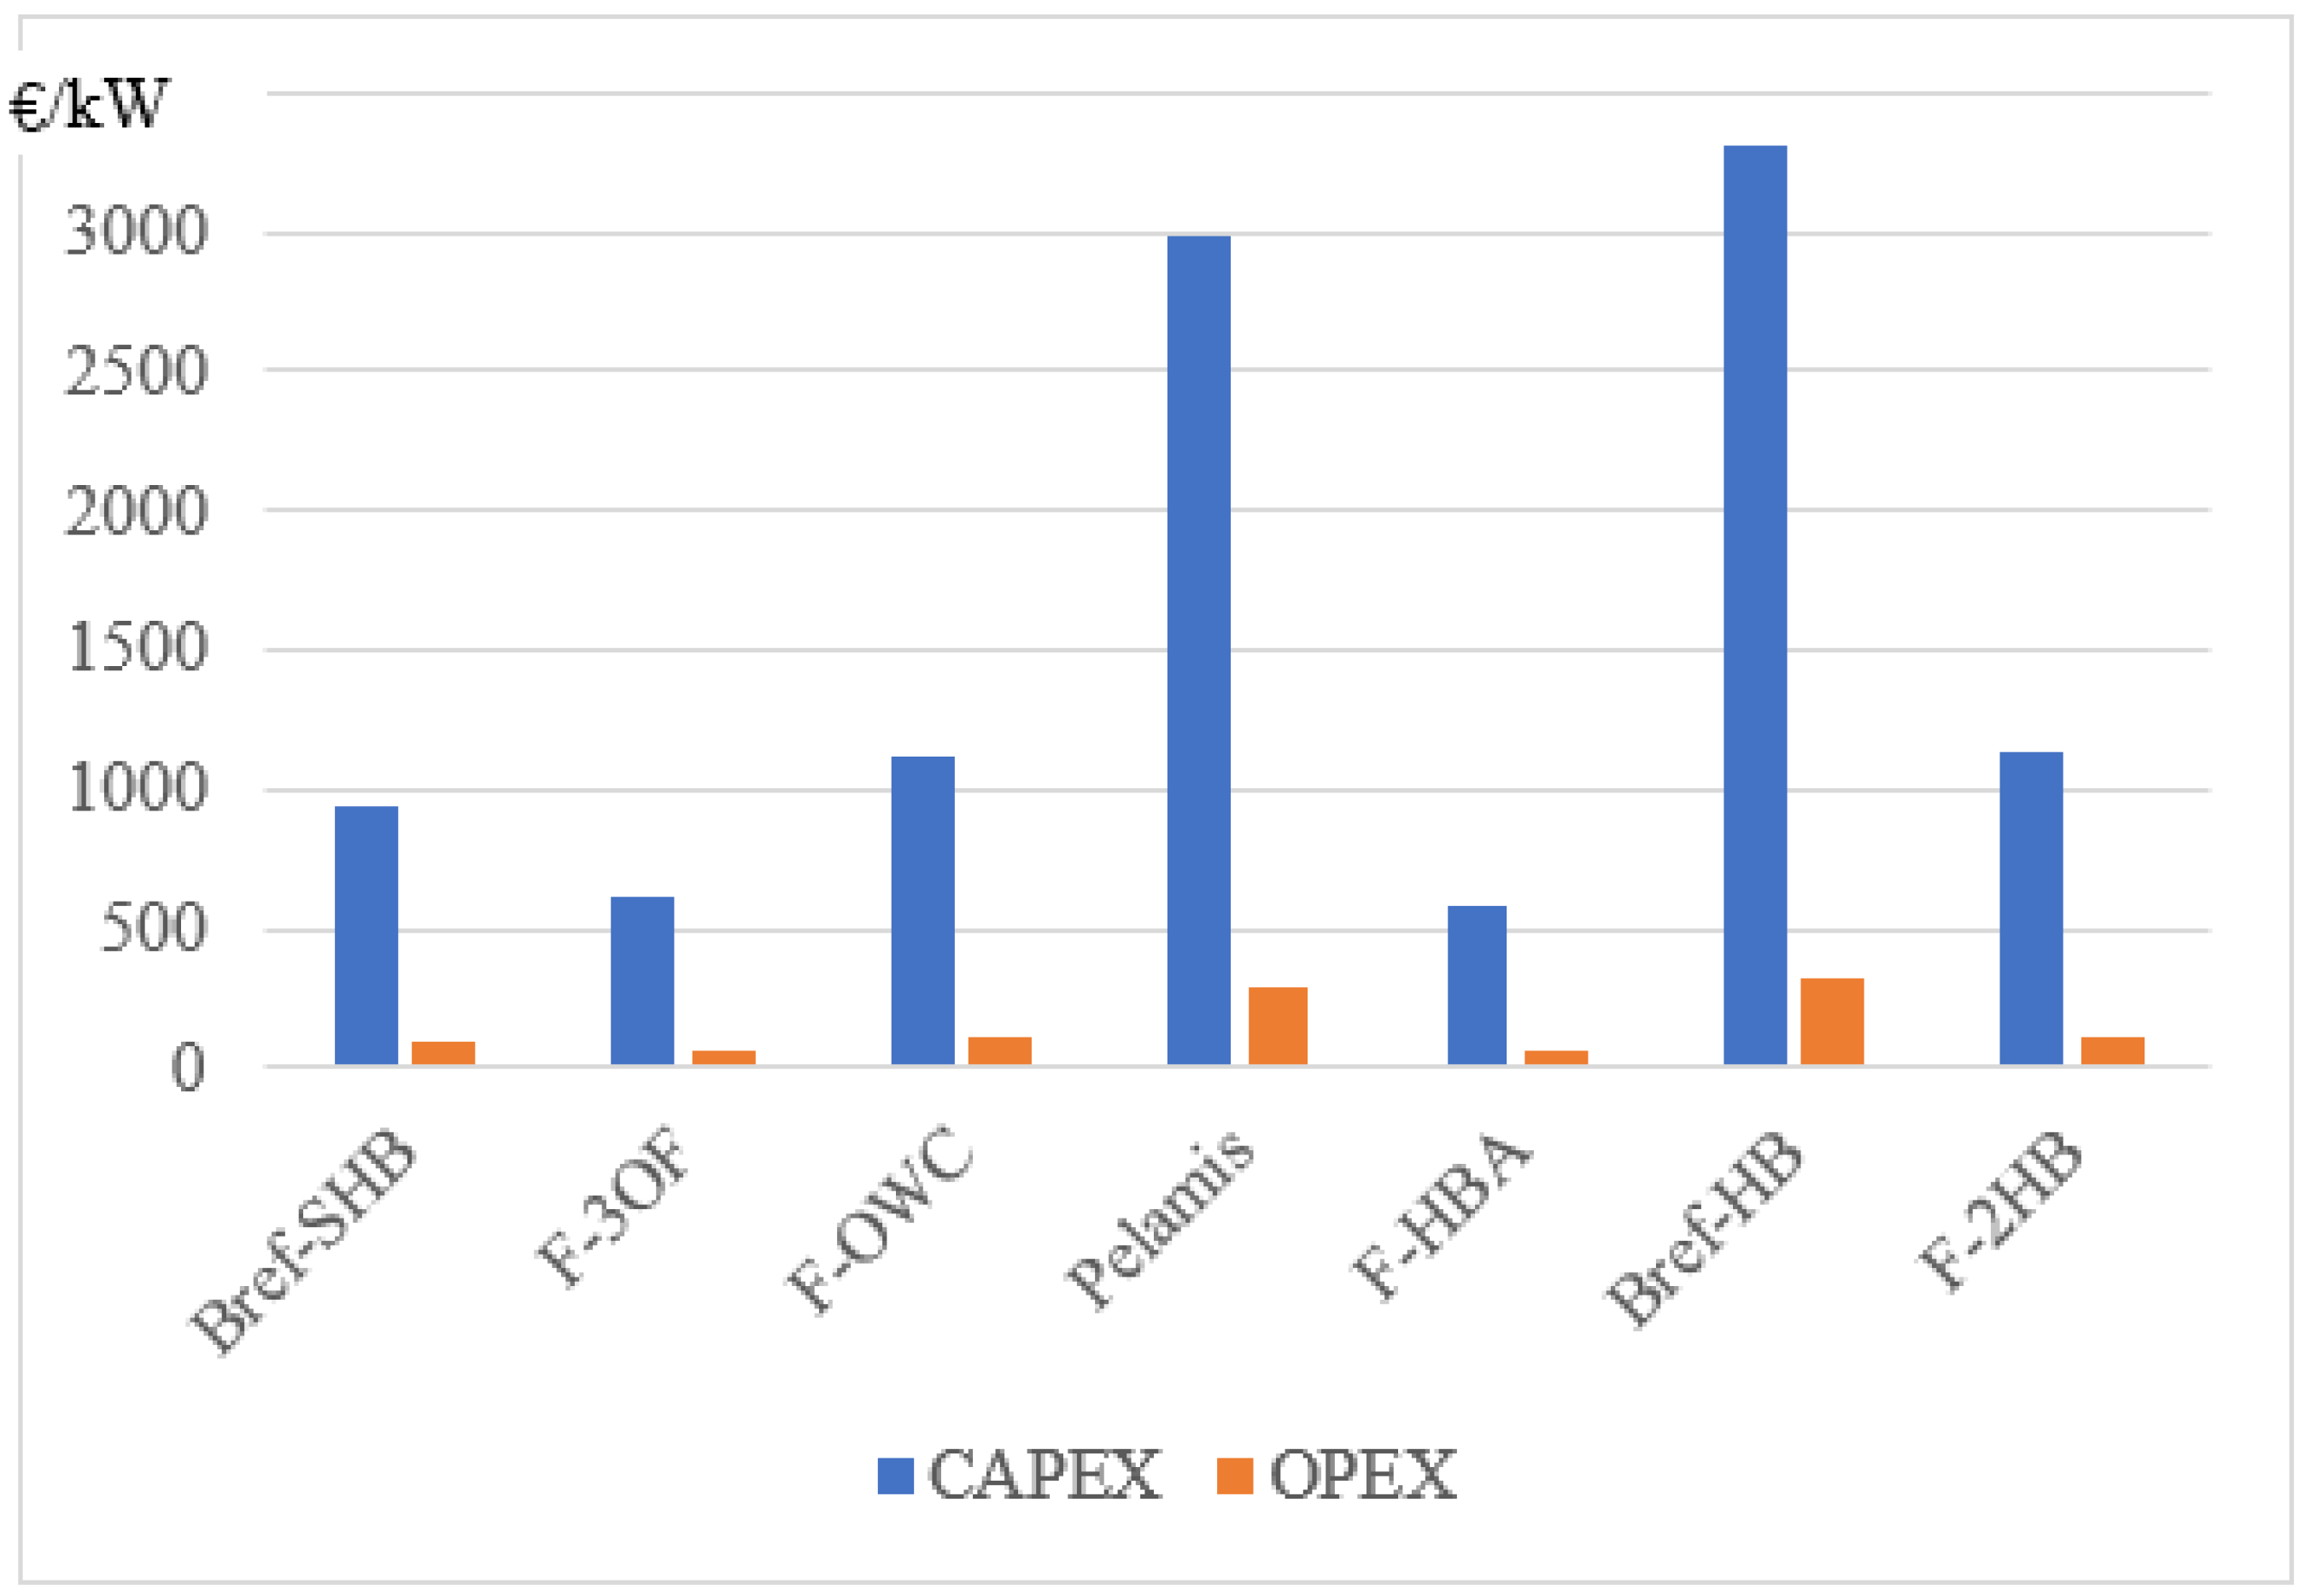
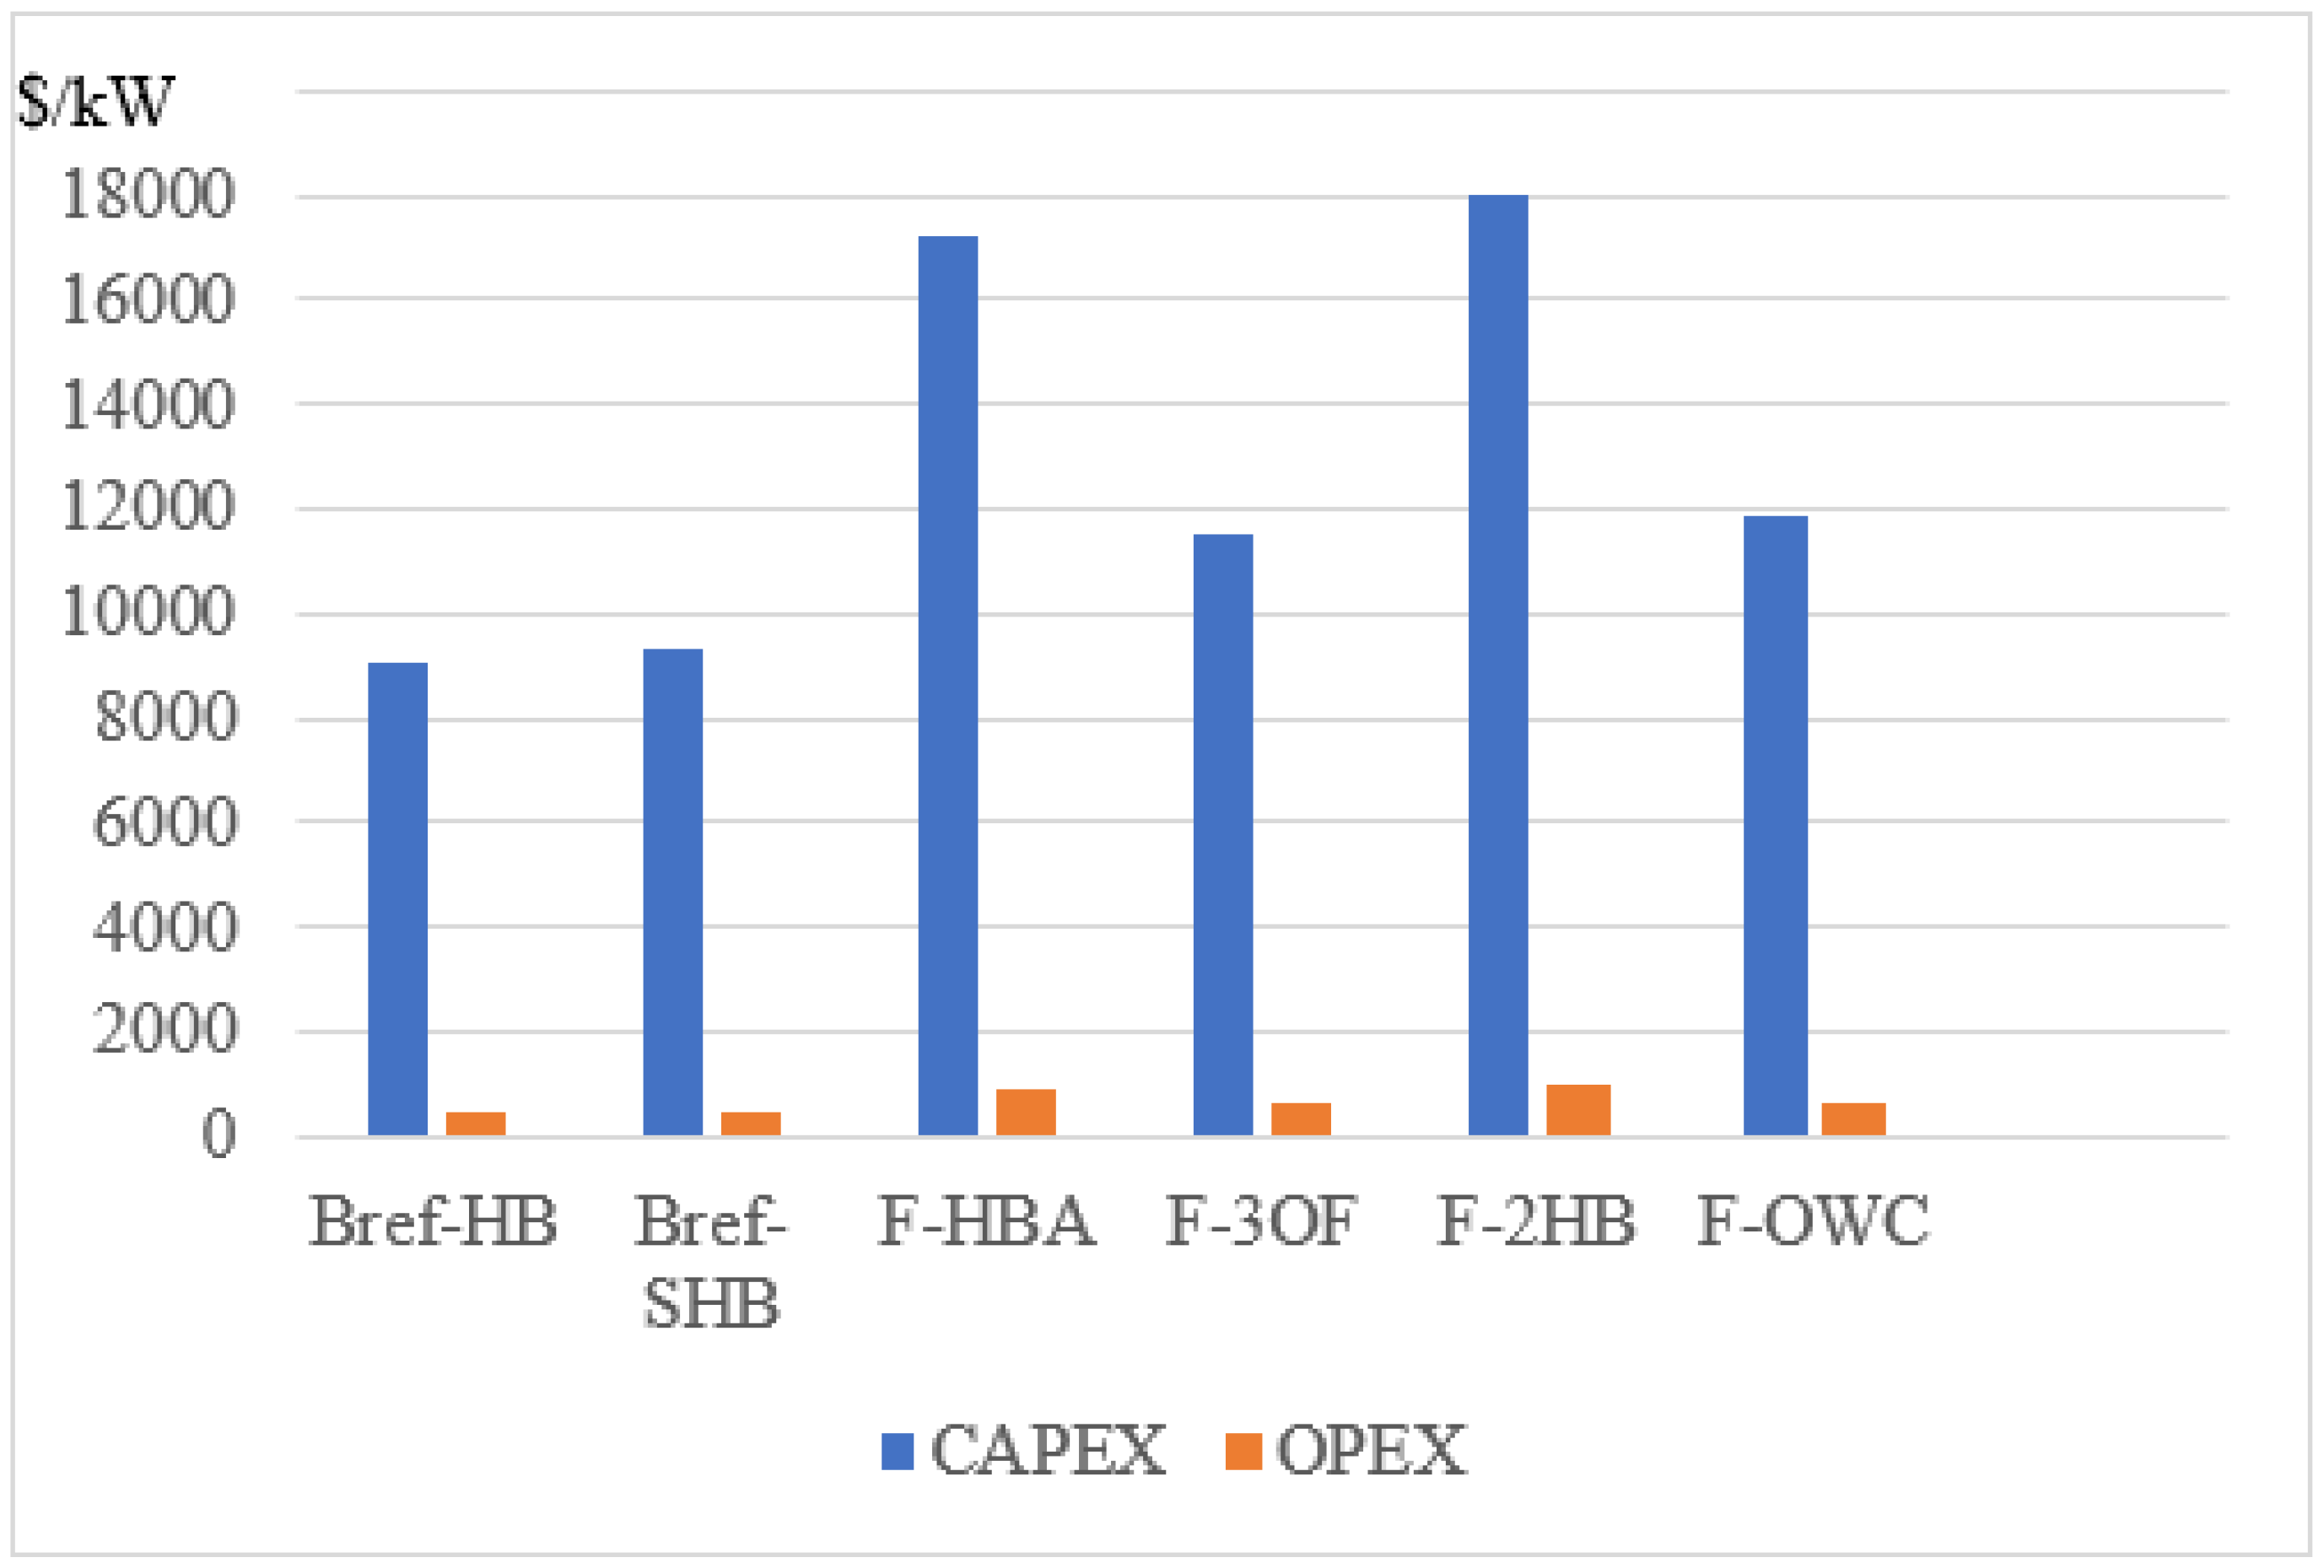
Obviously, the different devices located in the same position or same devices located in the different places give different conclusions [62]. The assumption of the sub-costs of the CAPEX and even the element costs are practical in the estimation. The estimation of the CAPEX mixture is performed by different methods [33]. The CAPEX per unit with the same technologies may give birth to a different value. For example, the highest CAPEX per unit is the output of the Bref-HB (Figure 9), which reaches 3312 EUR/kW. However, its value per unit is the smallest in Figure 10, which amounts to 9049 USD/kW. So, the configuration of CAPEX is not only involved in WEC technologies, but also in the wave project location. The situation associated with the CAPEX involves the sea situation, parameters of the wave farm, coefficient of devices, etc. The results of the CAPEX per unit are not suitable for direct comparison of the initial investment but can be used as a reference for investment options.

5.3. Operational Expenditure

Operational expenditure refers to all expenditures associated with the operation of WEC farms from the moment a takeover certificate is issued, including the cost of all operation and maintenance (O&M) activities and services and the cost associated with site leasing and insurance [75]. In general, the O&M, insurance costs, and costs associated with ongoing business, administration, and legal services comprise the OPEX [71]. The methods of cost percentage, fixed cost per year, and flexible cost are usually used to assess the sub-cost of the OPEX, as shown in Table 4. The OPEX is roughly estimated per year and frequently ranges from 5% to 15% of the CAPEX, as shown in the literature [28,35,37,100,107,108,109].
The difference in OPEX percentages is influenced by many factors (single prototype or utility-scale project, distance to shore, floating or submerged WEC, innovative or traditional O&M techniques). Some sub-costs of OPEX are depicted by a fixed value per year or are assumed to be the percentage of the OPEX and CAPEX. The O&M is defined as all annual costs spent on maintaining an optimum mechanical performance of wave farm devices [110]. It can be classified into the measurable fixed O&M cost and flexible O&M cost [111,112]. The assessment of the O&M cost often uses the percentage method, whose percentage would amount to 29% of the OPEX [110].
Due to risky sea conditions, it is inevitably necessary to repair the generators, which may cost EUR 10,000 per year and amount to 63.6% of the OPEX. The replacement cost per year is the biggest sub-cost, which accounts for 45% of the OPEX in the breakdown [80]. So, the hardware cost of the device accounts for the dominant percentage.
Due to the multi-risk and uncertainty of the project, insurance costs are incurred to compensate for the accidental loss of the wave energy project in the future. The insurance cost accounts for 11% of the OPEX or 1% of the CAPEX [37]. It is good to estimate these types of contract costs, such as the site lease and insurance cost, which refer to the counterpart reference cost of other commercial ocean energy.
The intangible cost in the OPEX uses the flexible cost methods and then precisely obtains the total value of the cost. For example, the cost of checking and the adjustment of tension can obtain the price of the labor cost and vessel fee from the market, which is measured by 4 vessel-days and 16 person-days [102].
Many factors (single prototype or utility-scale project, floating or submerged WEC, innovative or traditional O&M techniques) influence the sub-cost of the OPEX. There is not enough historical data to support the reliability of long years of operation. If possible, the OPEX mixture is measured by different indicators to reduce the uncertainty and risk. After all, the impact of the OPEX on the LCOE shows significance [30] in the follow-up discussion.

5.4. Annual Energy Production

The AEP is an important adjustable parameter that determines the LCOE behavior. The AEP is considered as a function of the project capacity (or named power rating), device capacity (or named capture width ratio), and device availability [85,109,110], as shown in Equation (14).
AEP = f ( PCF ,   DCF ,   DAF ,   T )  
where PCF is the project capacity factor, DCF is the device capacity factor, DAF is the device availability factor, and T is the number of hours in a year (which is equivalent to 8766 h).
For simplification, the irregular wave state often ends up transferring to a regular one by Equation (15) [30]. Although the AEP calculation will be presented by different descriptions, it is beyond the topic covered here.
AEP =   PCF DCF DAF 8766   hour / year  

5.5. Discount Rate and Lifespan of Project

When the payment at year t is changed into the value in the fixed start point, the present value can be compared with the LCOE. Considering the principles of consistency and simplicity, the comparison is based on the method of present value of the future value of compound interest. Other discount factors, such as equivalent annuity and present value coefficient (capital recovery factor) [113], are beyond the topic of discussion. The discount rate often ranges from 5% to 15% in the projects or simulations. A higher discount rate means that the present value of revenues will fall by more than the present value of costs, increasing the total levelized cost [114]. The discount rates of 8% and 10% are popular in many studies [30,75,86,103]. These discount rates become the default standard used in many papers, thus leading to some convergence of the investment programs.
The lifespan affects the present net value of a project. The lifespan is usually set from 20 years [86,103,115] to 32 years [88]. The lifespan expresses the prospects of the project for the stakeholders. The extension of the lifespan to 50 years is appropriate for the wave energy project. If other parameters are fixed, the longer the lifespan, the lower the LCOE of wave energy. Lifespan expresses risk judgments for stakeholders.

5.6. Levelized Cost of Wave Energy

Though the current LCOE for wave energy is much higher than fossil fuels and renewable energy on land, it can still be used to compare and benchmark the cost-effectiveness of different energy generation technologies [13] across scale, geography, type, etc. Furthermore, it can be used to find competitive commercial energy supply costs in the whole lifetime [17] despite their different cost structure. To propel the efficiency of WEC and drive the LCOE down, the researchers are continuously improving technologies of WEC or make iteration of device for the next array. In efforts to catch up with the LCOE of fossil fuels, several target LCOEs are put forward in Table 5. For example, the EU Strategic Energy Technology Plan forecasts that the LCOE will decrease to EUR 0.15/kW h by 2030 and EUR 0.10/kW h by 2035 [116]. The target LCOE for offshore wind generation projects in the U.S. has been quoted from less than USD 0.30/kWh by the year 2022 to USD 0.25/kWh by 2027 [117]. An LCOE of GBP 150 MWh−1 for wave energy is assumed as a target as set by Wave Energy Scotland (WES) [118] in its funding calls. These values of LCOE are ordinarily regarded as standard costs.
Certainly, different technical WECs obtain different results. In Table 6, the LCOEs of the devices for Wave Dragon, Pelamis, and AquaBuOY systems are EUR 513.17/MWh, EUR 1710.98/MWh and EUR 2627.60/MWh in the Galician region of Spain, respectively [121]. The LCOEs of the Wave Dragon and Pelamis systems are EUR 156.30/MWh and EUR 132.33/MWh (exchange rate of US dollar to Euro is 0.9589) [122]. Six different WEC devices (Bref-HB, Bref-SHB, F-HBA, F-3OF, F-2HB, and F-OWC) are being carried out at four U.S. Pacific coast locations. On the one hand, the results show that the LCOE is not cost-competitive with other energy sources; on the other hand, the higher LCOEs are driven by the higher estimated CAPEX and OPEX values [30], whose points of view are the same as previous studies [108]. The big different gap of LCOE does not only involve the technology itself, but also concerns the array of the device, local sea situation, and so on. All of these factors can be transformed into the techno-economic measure depicted by the cost. It is necessary that the CAPEX and OPEX values are made more accurate and reliable as they dominate the LCOE of wave energy.
The optimization of a WEC’s configuration will improve the efficiency and electric power output. It can suggest to technology developers that the prior array of devices and design of certain components and subsystems will help WECs to achieve a high-level output. The LCOE for a 20 MW array of WECs for several European locations is estimated to range between USD 0.36/kWh and USD 1.87/kWh (2016 Euro to USD monetary conversion) [108]. There is clearly a reduction in the optimal LCOE with an increase of float numbers per device, which drives the reduction in the CAPEX. The reduction in LCOE from the single-float configuration to the six-float configuration is around 21% [90]. In another test, the normalized value of the LCOE decreased from 0.79 to 0.69 and then increased up to 0.7 during the increase in float numbers [90]. The results imply that there is a U-shaped relationship between LCOE and CAPEX.
Although the LCOE of wave energy can compare with that of other energy industries, the LCOE has congenital assumption defects. In the process of arraying the devices and operation of the WEC, the scale effect cannot be ignored, which can reduce the LCOE. When the scale of the point absorber increases, the average LCOEs decreases: USD 4.36/kWh for 1 unit, USD 1.41/KWh for 10 units, USD 0.83/kWh for 50 units, and USD 0.73/kWh for 100 units [89]. The results of surge and OWC seem to follow the same trend. If deployment levels of more than 2 gigawatts (GW) are achieved, the projected LCOE for wave energy in 2030 is estimated to be between EUR 113/MWh and 226/MWh [123]. With the layout optimization of wave energy parks, the LCOE will reduce (by about 80%) from 1 to 10 WECs. The simulation results show that the relationship between LCOE reduction and WEC size is not necessarily inversely linear. When the test is executed in the Arabian Sea, the lowest LCOE is USD 0.88/KWh with the increase in float numbers (Table 5), which reminds us that the learning rate might affect the reduction cost.
The ocean location is also important. For example, the LCOE of the WECs at Bora Bora (French Polynesia) and Lanzarote (Spain) are EUR 0.310/KWh and EUR 0.282/KWh, respectively. Due to special geographic and energy needs, the LCOEs at both Bora Bora and Lanzarote show somewhat competitive prices [98]. At the same location—the U.S. Pacific coast—the lowest LCOEs (ranging between USD 0.37/kWh and USD 0.42/kWh) are found for the Bref-HB device, followed by costs of USD 0.60 ± 0.05/kWh for the F-OWC WEC device deployed in U.S. mainland locations and for the Bref-SHB device deployed at Mokapu [30]. When comparing different WECs deployed along the Portuguese continental coast, the Wave Dragon device shows the best LCOE, with EUR 316.90/MWh; the next is Pelamis with an LCOE of EUR 735.94/MWh, followed by AquaBuOY with EUR 2967.85/MWh. Even if a different location, e.g., the northwest of Spain (Galicia), were to install the same WECs, the rank of the LCOE would remain unchanged with the different value of EUR 513.17/MWh for the Wave Dragon, EUR 1710.98/MWh for the Pelamis, and EUR 2627.60/MWh for the AquaBuOY systems [121]. The different values of LCOE show that both the local resource characterization and device selection ought to be taken into account simultaneously.
The discount rate is representative of the reduction in the risk associated with investment, and the maturity of the wave energy industry, technology development, and market control. The change in the discount rate will cause a great difference in the results of the cost appraisal. When the discount rate decreases in the LCOE model, the LCOE synchronously reduces. For example, the LCOE is calculated to be USD 134/MWh in Western Australia. When the discount rate falls from 11% to 6%, the LCOE reduces from USD 160/MWh to USD 102/MWh [115], and the LCOE of the overtopping system ranges from EUR 1.77–1.25/kWh with a 10% discount rate to EUR 1.52–1.05/kWh with a 7.5% discount rate (Table 5). The changing results show that the alternative technologies gain a competitive cost in the future. When the discount rate decreases, the required interest rate of return appears to be less. Moreover, investors have greater confidence in the wave energy project now than before, since they could accept a low rate of return.
The optimized LCOE of the WEC with reactive control ranges from around EUR 0.2/KWh to 0.35/KWh, and this value ranges from around EUR 0.35/KWh to EUR 0.55/KWh in the case of passive control. This is to be expected as the WEC with reactive control produces much more power than the WEC with passive control at the same sea location [35]; it shows that the management policy and process control, where the learning curve often exercises its influence, can reduce the flexible costs of the CAPEX and OPEX, and then decrease the LCOE.
When the CAPEX and OPEX dramatically drop, the availability and capacity factors slowly increase; the LCOE is down from a maximum of USD 470/MWh to a minimum of USD 120/MWh [124]. It implies that decisions about expenditure ought to pay more attention to the combination of element costs and technological parameters. However, this is difficult to factor in because the technology is always advancing and is becoming costlier. The target LCOE of USD 0.30/KWh in the selected scenarios can be reached by reducing the CAPEX and OPEX of 75%, using the combined system with an array arrangement and control strategies, and increasing the AEP by 12–55% [125].
Compared with other energy industries, the LCOE for wave energy has congenital assumption defects. However, the result of the LCOE can be considered as a reference for a wave energy project through the optimization of the sub-costs and their element costs.

6. Case Study and Discussions

6.1. Assumption of Model

As a case study for this paper, the WEC of CorPower Ocean AB (CPO) was used to extract the wave power. The major technical parameters of the WECs are the original assumptions shown in Table 7. The original cost data came from the published paper [98]. The three testing locations, Bora Bora (France), Maldives, and Lanzarote (Spain), were used to calculate the LCOE. The basic sub-cost data are in Table 8. In order to calculate and compare the LCOE, the basic data in Table 7 and Table 8 were assumed to be constant. Some of the assumptions are laid out as follows: the learning curve effect does not have to be considered when the wave energy converters are installed; the operational devices reach their rated output once they are put to use; the DC is ignored; there are monotonic and linear relationships among the CAPEX, OPEX, and AEP; the wave project will continue to be operated for 50 years; the CAPEX occurs at the beginning of investment year t; the OPEX and AEP occur at the end of year t.
The cost of capital for renewable projects is affected by the nature of the market, government policy, technological maturity, and capacity factors [126]. The wave energy project is impacted by these factors as well. Not only does the LCOE associate with the electronic power extracted by the technology of the device itself, but it also associates with the form of investment. The property of asset-heavy investment on the wave energy project makes it harder to accomplish asset realization in the short run.
The fund of CAPEX and OPEX is paid by the investment form of equity and loans. Equity is more expensive than secured loans, all else being equal, because it carries more risk in the eventuality that the project underperforms or goes bankrupt. These costs of equity and loans are often separately reported under project development costs [98]. The investors must be careful to decide whether to fully invest in the project at one time. A project with greater risk (e.g., a project of non-payment of electricity sales, currency risk, inflation risk, or country risk) will require a higher rate of return. The investment risk impacts the discount rate and pay-back. The discount rate is influenced by the pressure of the synthetic fund cost rate, which can be reduced by the adjustment of the mixture of funds.
Considering the technology of iteration, once new equipment is installed to enlarge the scale or replace the used devices at year t, the system generates more electronic power than the previous equipment and provides more competitiveness for the LCOE of wave energy.
The next stage of operation with ongoing devices and new installed devices can reduce intangible costs and improve management efficiency. So, a multi-step investment model should be considered when measuring performances of LCOEs. As a result, two models of discounted cost and half-discounted cost were used to calculate the LCOE in the Bora Bora (BB), Maldives (MA), and Lanzarote (LA) cases.
Equation (16) with discount is suitable for a multi-step investment. When the CAPEX at year t is finished, the AEP simultaneously increases with the linear times. When the scale of the wave project is carried out by a one-time investment, its output is confirmed during the operation span. Equation (17) with half-discount was used to calculate the LCOE for the scenario of a one-time investment.
There are three investment plans to compare the results of LCOE via Equations (16) and (17). The new costs and AEP in scene 1 are 2.5 times greater than the original figures. It is assumed that the investment occurs every 10 years in scene 2; thus, the costs and AEP in scene 2 are same to the original figures in each investment period. The last is assumed that CAPEX occurs at the beginning of investment year 1 with five times the original data in scene 3. Its OPEX and AEP without discount occur every year with five times the original data. The final scales of the wave project in scene 1 and scene 2 were the same as in scene 3. Namely, at the end of year 50, the total nominal AEPs in the three scenes amounted to 788,500 MWh in BB, 123,250 MWh in MA, and 492,750 MWh in LA. Inflation is explicitly built into strike prices [73]. All costs were calculated in the case study, which is none of the electrical price; thus, the inflation is not discussed. The discount rate was 8% in the three scenes when the LCOE is calculated.
L C O E D = t = 1 n C A P E X t ( 1 + r ) t + 1 n O P E X t ( 1 + r ) t t = 1 n A E P t ( 1 + r ) t
L C O E H = C A P E X + 1 n O P E X t ( 1 + r ) t t = 1 n A E P t

6.2. Results and Discussion

The cases were calculated, and the results are shown in Table 9. When the AEP is discounted, the lowest LCOE amounts to EUR 1.171/kWh in scene 2 by the five-step investment at Lanzarote, which is below the LCOE value of EUR 1.211/kWh in the scene 1 by the two-step investment. The highest LCOE is equal to EUR 2.416/kWh by the five-step investment at Maldives; its value is still below the LCOE of the two-step investment. It seems that the result of LCOE in five-step investment is better than the value in two-step investment. The reason is involved that operators and investors can summarize the experience and lessons to reduce the probability of failure, control the project cost of the next phase by improving the array of devices and locations, and improve the management efficiency at the periodic year. The results imply that the more investment steps executed, the more total cost savings that can be had.
If there is enough money to pay for the project, the LCOE of a large one-off investment is much lower than the cost of a five-step investment. In scene 3, the lowest LCOE is equal to EUR 0.296/kWh in Lanzarote, accounting for only 25% of the lowest value in the multi-step investment; the highest LCOE amounts to EUR 0.616/kWh in Maldives, accounting for 24% of the highest value in the two-step investment. Due to the installment of large-scale devices, the output of AEP reaches its rated power from the beginning of operation without discount, which is beyond the total output in the multi-step programs. Although the CAPEX and OPEX in scene 3 are larger than the cost value of scene 1 and scene 2, the smallest AEP of scene 3 is more than seven times the value in scene 1 and scene 2. It implies that scale of devices may impact on the LCOE to a degree. If there is enough money to support the fund demand at any stage of whole project, the LCOE of a large one-off investment is much lower than the cost of the multi-step investments. As a matter of fact, the LCOE calculation of the case study by multi-step investment is still a static result. Without consideration of the scale effect and learning curve, the CAPEX and OPEX are derived from the linear sum of element costs. So, the results should be reexamined by the commercial consideration and business activities.
The LCOE method can calculate the minimum cost of wave power generation to the grid via the CAPEX and OPEX. However, many factors such as resource potential, site characteristics, cost input, installed project capacity, etc., make LCOE comparisons difficult to some degree. As a matter of fact, a shortcoming of the LCOE method is the lack of comparability and transparency in the calculation assumptions [100]. The estimation will influence the LCOE and competitive advantages for wave energy. Due to cost characteristics and aggregation structure of sub-costs, different measurement methods should be used to calculate them. Furthermore, the techno-economic model needs to be modified to calculate the LCOE for wave energy. The detailed elements costs of the CAPEX and OPEX would be very different in the opinions of different researchers. It is possible to find similar element costs from the fossil energy and renewable energy sectors. These kinds of element costs would serve as cost references for the CAPEX and OPEX of wave energy. The configuration of the CAPEX and OPEX tends to be improved, and their conclusions are reliable.
What cannot be ignored is that the potential cost loss caused by a certain failure probability is also relatively large. The WECs installed in the sea location cannot be replaced by more advanced technological equipment until the used devices are totally broken. In the long run, the technological effect on the LCOE is at a standstill and cannot keep pace with technological progress. Obviously, the LCOE value with half-discount is lower than the LCOE value with a discount. Whatever the scene, the LCOE values are far above the target cost (EUR 0.15/kWh by 2030) proposed by the EU Strategic Energy Technology Plan. There is a long way to go to develop more efficient technologies and make level the cost of generation for wave energy.
Different organizations and researchers have put forward the target of the LCOE. The common target cost of wave energy gradually converges to EUR 0.20/kWh by 2025 and EUR 0.15/kWh or GBP 150/MWh by 2030. The trend of the LCOE is decreasing, but it is still far away from the accepted target cost. It cannot superficially judge which WEC is superior to others. The selected WEC in the special sea location makes the LCOE decrease, whose LCOE is associated with discount rate, technology of iteration, reactive control, and management policy.
In three scenes, the highest CAPEX per AEP is equal to EUR 0.455/KWh in the MA of scene 1. The CAPEX per AEP in scene 1 and scene 2 is higher than the value in scene 3; it clearly expresses that the burden of CAPEX on AEP in the multi-step investment is more than the value in the one-step investment. However, the CAPEX per AEP in scene 1 is beyond the one obtained in scene 2. This result implies that the less frequent the investment, the lower the cost pressure. The AEP–CAPEX relationship depends on WEC configuration designs and site parameters [127]. The arrangement and combination of the CAPEX and the AEP should be selected for reducing the CAPEX per unit by the AEP. When the CAPEX discount lasts for longer, the CAPEX per AEP will face less pressure. Thus, it would reduce the cost part of the LCOE [32].
In essence, the length of years of OPEX levelized by AEP in scene 1 and scene 2 is less than 50 years. So, the OPEX per AEP in scene 1 and scene 2 is higher than the one in the one-step investment of scene 3, which is equal to EUR 0.254/KWh. The highest value of the OPEX per AEP, EUR 2.069/KWh, appears in the multi-step investment. The smallest value of the OPEX per AEP in the multi-step investment amounts to EUR 1.040/KWh. However, both of their values are still much larger than the value of the one-step investment, which shows that it is important to select investment programs for optimizing the relationship between the OPEX and the AEP. Due to linear assumptions with actual equal proportions of OPEX changing, the OPEXs per AEP in scene 1 and scene 2 are not varied.
The CAPEX can only be recovered through accumulated depreciation. This kind of cost cannot influence the reduction in the LCOE during the operational span. On the contrary, the impact of the OPEX on the LCOE is much higher than the impact of the CAPEX in the three scenes, even though the value of the CAPEX is bigger than the OPEX. For example, the rate of the OPEX per AEP on the LCOE, which is beyond 81%, is higher than the rate of the CAPEX per AEP in the three scenes.
During the whole lifespan of the wave project, the accumulated present value of the OPEX is actually much greater than the value of the CAPEX per AEP in the three scenes. The largest gap between the OPEX per AEP and the CAPEX per AEP is EUR 1.722/KWh in scene 2 at Maldives. This difference will influence the LCOE.
When the CAPEX is paid, it becomes a sunk cost. If the wave project continues to operate, the CAPEX can only be recovered through accumulated depreciation. This kind of cost cannot continually influence the reduction in the LCOE during the operational span. In general, the rates of the OPEX per AEP on the LCOE, which are all beyond 81%, is higher than the rates of the CAPEX per AEP in three scenes. Especially, the AEP in the BB case amounts to 3154 MWh per year, and its influence of the OPEX per AEP on the LCOE with the five-step investment is the greatest of every location in the three scenes.
The OPEX corresponds to management activities, which implies a learning curve effect. The process and results in the previous operation stage or experience from oil and gas and offshore wind energy sectors can help reduce equipment failure in the next investment span. For instance, the incidence of the repair of buoy, repair of generator, replacement, etc., and thus, the OPEX in the multi-step investment program, will gradually decrease. The advancement of management efficiency benefits the optimization of the business process and improves the cost performance of the wave energy project for the next stage with a multi-step investment policy. For example, the cost of inspection and maintenance and the cost of checking and adjusting tension will reduce because of skill maturity and improved efficiency. The OPEX will decrease to an extent when the operation and maintenance cost is concentrated, which is the key part cost of the OPEX [128]. As a result, the LCOE would benefit from a reduction in the OPEX. Therefore, future research needs to weigh the influence of the OPEX per AEP on the LCOE with different investment models.
In addition to the complex sea conditions, the failure rates are also affected by the reliability of equipment manufacture and installation (which are combined with the CAPEX and OPEX). With the reliability improving in the sea location, the CAPEX will increase, but the OPEX will also decrease to a degree due to the reduction of O&M costs [128]. The extraction of wave energy is the top priority. The technological development of WECs is still an important point for generating a greater output of AEP. There is not a simply linear relationship among CAPEX, OPEX, and AEP. Because of the original relationship assumption between the OPEX and CAPEX, the conclusion of this case is not accurate enough. Thus, the LCOE of the wave project faces a challenge for measurement between the expenditure and output of the AEP in the investment plans.

7. Concluding Remarks

This paper reviews the LCOE calculation method for wave energy technologies. The result of LCOE is largely depended on the CAPEX and OPEX that almost dominate the total cost breakdown.
-
The identification and estimation of sub-costs are a good way to calculate the CAPEX and OPEX more accurately. Some sub-costs can be measured by different element costs, and the cost of device occupies an important portion in the CAPEX mixture.
-
The calculation of the OPEX is relatively simpler than the CAPEX. The most used method is to use the percentage method to include both the flexible cost and fixed cost as the sub-costs of the OPEX.
-
The AEP is considered as a function of the project capacity, device capacity factor, device availability factor, and time. The discount rate often arranges from 5% to 15% to discount the costs. The AEP, discount rate, and project time may determine the uncertainty, risk, requirements of return on investment, and technological selection.
-
In the case study, one-step and multi-step models were proposed to analyze the difference in the LCOEs and to examine the influence of three variables—the CAPEX, OPEX, and AEP—on the LCOEs by considering the impact of the complex relationship between the CAPEX, OPEX, and AEP on the LCOE; the final project program is up to the appraisal of the LCOE and the arrangement of the CAPEX, OPEX and AEP.
The conclusions provide technical and non-technical conference for harnessing wave energy. The effect of the CAPEX on the LCOE would be apportioned by increasing the AEP. The improved aggregation of element costs, if involved into the optimized business management, would affect the OPEX. The LCOE could be reduced by the relationship between the OPEX per AEP during the project lifespan. Thus, it could provide some guidance for measuring the cost of extracting electrical power from wave energy. Moreover, it even provides some clues for reducing the commercial cost of the renewable energy and fossil energy sectors.
Certainly, there are disadvantages in this paper, but they are worth exploring in future works. It should be noted that the method of the LCOE may be too static and does not take uncertainties into account. The probability methods should be introduced into the OPEX for the failure rate buoy and failure rate generator [51] to measure the uncertainty [44]. For example, some expenditures on the iterative devices for enlarging the scales of the wave energy project belong to a fixed-asset investment at year t, and it should be grouped into the CAPEX. The learning curve should be considered into reducing the part costs of the CAPEX and OPEX in multi-step investment programs. Furthermore, non-technological costs should be incorporated into the LCOE [102]. For instance, the inflation and price fluctuations are not included in the general analysis. The classification of the wave converter should be optimized after homologous or similar technologies are built up. In an inner group of wave converters, one should not only compare the priority of the projects by the value of the LCOE, but also appraise the advantages and disadvantages of the CAPEX and OPEX. This would pave the way for the commercial application of wave converters in the future. Future research will focus on the above aspects.

Funding

This research was funded by Jiangsu Government Scholarship for Overseas Studies, grant number JS-2020-005.

Data Availability Statement

Data come from reference [30,60,61,92,98] in this paper.

Acknowledgments

The first author, a visiting scholar to Lancaster University (UK) from Nanjing Forestry University, China; the second and last authors are under the funding support provided by the EPSRC (grant number EP/V040561/1) for the project ‘Novel High Performance Wave Energy Converters with advanced control, reliability and survivability systems through machine-learning forecasting (NHP-WEC)’.

Conflicts of Interest

The authors declare no conflict of interest.

References

  1. Kober, T.; Schiffer, H.W.; Densing, M.; Panos, E. Global energy perspectives to 2060–WEC’s World Energy Scenarios 2019. Energy Strategy Rev. 2020, 31, 100523. [Google Scholar] [CrossRef]
  2. REN21.Renewables 2022 Global Status Report [R/OL]. 2022. Available online: https://www.ren21.net/wp-content/uploads/2019/05/GSR2022_Full_Report.pdf (accessed on 1 March 2022).
  3. European Climate Foundation (ECF). Roadmap 2050: A Practical Guide to a Prosperous, Low-Carbon Europe [R/OL]. Available online: https://www.roadmap2050.eu/attachments/files/Volume1_fullreport_PressPack.pdf (accessed on 1 March 2022).
  4. European Environment Agency. Climate Trends and Projections in Europe 2021 [R/OL]. Available online: https://www.eea.europa.eu/publications/trends-and-projections-in-europe-2021 (accessed on 2 March 2022).
  5. Reikard, G.; Robertson, B.; Bidlot, J.R. Combining wave energy with wind and solar: Short-term forecasting. Renew. Energy 2015, 81, 442–456. [Google Scholar] [CrossRef]
  6. Izadparast, A.H.; Niedzwecki, J.M. Estimating the potential of ocean wave power resources. Ocean. Eng. 2011, 38, 177–185. [Google Scholar] [CrossRef]
  7. Lenee-Bluhm, P.; Paasch, R.; Özkan-Haller, H.T. Characterizing the wave energy resource of the US Pacific Northwest. Renew. Energy. 2011, 36, 2106–2119. [Google Scholar] [CrossRef]
  8. Guo, B.; Ringwood, J.V. A review of wave energy technology from a research and commercial perspective. IET Renew. Power Gener. 2021, 14, 3065–3090. [Google Scholar] [CrossRef]
  9. Malik, A.Q. Renewables for Fiji–Path for green power generation. Renew. Energy Rev. 2021, 149, 111374. [Google Scholar] [CrossRef]
  10. Gunn, K.; Stock-Williams, C. Quantifying the global wave power resource. Renew. Energy 2012, 44, 296–304. [Google Scholar] [CrossRef]
  11. International Renewable Energy Agency. Wave Energy Technology Brief. Abu Dhabi, United Arab Emirates, 2014. Available online: https://www.irena.org/publications/2014/Jun/Wave-energy (accessed on 5 May 2022).
  12. Wang, L.; Zhao, T.; Lin, M.; Li, H. Towards realistic power performance and techno-economic performance of wave power farms: The impact of control strategies and wave climates. Ocean. Eng. 2022, 248, 110754. [Google Scholar] [CrossRef]
  13. Branker, K.; Pathak MJ, M.; Pearce, J.M. A review of solar photovoltaic levelized cost of electricity. Renew. Sustain. Energy Rev. 2011, 15, 4470–4482. [Google Scholar] [CrossRef] [Green Version]
  14. Tsvetkova, O.; Ouarda, T.B.M.J. A review of sensitivity analysis practices in wind resource assessment. Energy Convers. Manag. 2021, 238, 114112. [Google Scholar] [CrossRef]
  15. Coles, D.; Angeloudis, A.; Greaves, D.; Hastie, G.; Lewis, M.; Mackie, L.; McNaughton, J.; Miles, J.; Neill, S.; Piggott, M.; et al. A review of the UK and British Channel Islands practical tidal stream energy resource. Proc. R. Soc. A 2021, 477, 20210469. [Google Scholar] [CrossRef]
  16. Clauser, C.; Ewert, M. The renewables cost challenge: Levelized cost of geothermal electric energy compared to other sources of primary energy–Review and case study. Renew. Sustain. Energy Rev. 2018, 82, 3683–3693. [Google Scholar] [CrossRef]
  17. Astariz, A.V.S.; Iglesias, G. Evaluation and comparison of the levelized cost of tidal, wave, and offshore wind energy. J. Renew. Sustain. Energy 2015, 7, 053112. [Google Scholar] [CrossRef]
  18. Xu, Y.; Yang, K.; Yuan, J. Levelized cost of offshore wind power in China. Environ. Sci. Pollut. Res. 2021, 28, 25614–25627. [Google Scholar] [CrossRef]
  19. Arshad, M.; O’Kelly, B.C. Offshore wind-turbine structures: A review. Proc. Inst. Civ. Eng.-Energy 2013, 166, 139–152. [Google Scholar] [CrossRef]
  20. Joskow, P.L. Comparing the costs of intermittent and dispatchable electricity generating technologies. Am. Econ. Rev. 2011, 101, 238–241. [Google Scholar] [CrossRef] [Green Version]
  21. Teillant, B.; Costello, R.; Weber, J.; Ringwood, J. Productivity and economic assessment of wave energy projects through operational simulations. Renew. Energy 2012, 48, 220–230. [Google Scholar] [CrossRef] [Green Version]
  22. Wang, L.; Isberg, J.; Tedeschi, E. Review of control strategies for wave energy conversion systems and their validation:the wave-to-wire approach. Renew. Sustain. Energy Rev. 2018, 81, 266–279. [Google Scholar] [CrossRef]
  23. Barney, A.; Polatidis, H.; Jelić, M.; Tomašević, N.; Pillai, G.; Haralambopoulos, D. Transition towards decarbonisation for islands: Development of an integrated energy planning platform and application. Sustain. Energy Technol. Assess. 2021, 47, 101501. [Google Scholar] [CrossRef]
  24. Barutha, P.; Nahvi, A.; Cai, B.; Jeong, H.D.; Sritharan, S. Evaluating commercial feasibility of a new tall wind tower design concept using a stochastic levelized cost of energy model. J. Clean. Prod. 2019, 240, 118001. [Google Scholar] [CrossRef]
  25. Tazi, N.; Safaei, F.; Hnaien, F. Assessment of the levelized cost of energy using a stochastic model. Energy 2022, 238, 121776. [Google Scholar] [CrossRef]
  26. Harvey, L.D. Clarifications of and improvements to the equations used to calculate the levelized cost of electricity (LCOE), and comments on the weighted average cost of capital (WACC). Energy 2020, 207, 118340. [Google Scholar] [CrossRef]
  27. Geissmann, T.; Ponta, O. A probabilistic approach to the computation of the levelized cost of electricity. Energy 2017, 124, 372–381. [Google Scholar] [CrossRef]
  28. de Andres, A.; Medina-Lopez, E.; Crooks, D.; Roberts, O.; Jeffrey, H. On the reversed LCOE calculation: Design constraints for wave energy commercialization. Int. J. Mar. Energy 2017, 18, 88–108. [Google Scholar] [CrossRef]
  29. Astariz, S.; Iglesias, G. Wave energy vs. other energy sources: A reassessment of the economics. Int. J. Green Energy 2016, 13, 747–755. [Google Scholar] [CrossRef]
  30. Chang, G.; Jones, C.A.; Roberts, J.D.; Neary, V.S. A comprehensive evaluation of factors affecting the levelized cost of wave energy conversion projects. Renew. Energy 2018, 127, 344–354. [Google Scholar] [CrossRef]
  31. Shen, W.; Chen, X.; Qiu, J.; Hayward, J.A.; Sayeef, S.; Osman, P.; Meng, K.; Dong, Z.Y. A comprehensive review of variable renewable energy levelized cost of electricity. Renew. Sustain. Energy Rev. 2020, 133, 110301. [Google Scholar] [CrossRef]
  32. Choupin, O.; Henriksen, M.; Etemad-Shahidi, A.; Tomlinson, R. Strategically Estimated CapEx: Wave Energy Converter Costs Breakdown and Parameterization. 2020. Available online: https://assets.researchsquare.com/files/rs-133554/v1_covered.pdf?c=1631849668 (accessed on 10 May 2022).
  33. Astariz, S.; Iglesias, G. The economics of wave energy: A review. Renew. Sustain. Energy Rev. 2015, 45, 397–408. [Google Scholar] [CrossRef]
  34. Piscopo, V.; Benassai, G.; Della Morte, R.; Scamardella, A. Cost-Based design and selection of Point Absorber Devices for the Mediterranean Sea. Energies 2018, 11, 946. [Google Scholar] [CrossRef] [Green Version]
  35. Tan, J.; Polinder, H.; Laguna, A.; Wellens, P.; Miedema, S. The influence of sizing of wave energy converters on the techno-economic performance. J. Mar. Sci. Eng. 2021, 9, 52. [Google Scholar] [CrossRef]
  36. Göteman, M.; Giassi, M.; Engström, J.; Isberg, J. Advances and challenges in wave energy park optimization—A review. Front. Energy Res. 2020, 8, 26. [Google Scholar] [CrossRef] [Green Version]
  37. Biyela, S.S.; Cronje, W.A. Techno-economic analysis framework for wave energy conversion schemes under South African conditions: Modeling and simulations. Int. J. Energy Power Eng. 2016, 10, 786–792. [Google Scholar]
  38. Clemente, D.; Rosa-Santos, P.; Taveira-Pinto, F. On the potential synergies and applications of wave energy converters: A review. Renew. Sustain. Energy Rev. 2021, 135, 110162. [Google Scholar] [CrossRef]
  39. Shadman, M.; Silva, C.; Faller, D.; Wu, Z.; Assad, L.P.D.F.; Landau, L.; Levi, C.; Estefen, S.F. Ocean renewable energy potential, technology, and deployments: A case study of Brazil. Energies 2019, 12, 3658. [Google Scholar] [CrossRef] [Green Version]
  40. Ahamed, R.; McKee, K.; Howard, I. Advancements of wave energy converters based on power take off (PTO) systems: A review. Ocean. Eng. 2020, 204, 107248. [Google Scholar] [CrossRef]
  41. Myhr, A.; Bjerkseter, C.; Ågotnes, A.; Nygaard, T.A. Levelised cost of energy for offshore floating wind turbines in a life cycle perspective. Renew. Energy 2014, 66, 714–728. [Google Scholar] [CrossRef] [Green Version]
  42. Esteban, M.; Leary, D. Current developments and future prospects of offshore wind and ocean energy. Appl. Energy 2012, 90, 128–136. [Google Scholar] [CrossRef]
  43. Zhang, Y.; Zhao, Y.; Sun, W.; Li, J. Ocean wave energy converters: Technical principle, device realization, and performance evaluation. Renew. Sustain. Energy Rev. 2021, 141, 110764. [Google Scholar] [CrossRef]
  44. King, A. Numerical modelling of the bomborawave energy conversion device. In Proceedings of the 19th Australasian Fluid Mechanics Conference, Melbourne, Australia, 8–11 December 2014. [Google Scholar]
  45. Collins, I.; Hossain, M.; Dettmer, W.; Masters, I. Flexible membrane structures for wave energy harvesting: A review of the developments, materials and computational modelling approaches. Renew. Sustain. Energy Rev. 2021, 151, 111478. [Google Scholar] [CrossRef]
  46. Liu, C.; Huang, Z. A flexible membrane breakwater with a piezoelectric layer for providing harborage and wave-energy conversion. J. Coast. Res. 2020, 36, 148–156. [Google Scholar] [CrossRef]
  47. Xu, S.; Wang, S.; Soares, C.G. Experimental investigation on hybrid mooring systems for wave energy converters. Renew. Energy 2020, 158, 130–153. [Google Scholar] [CrossRef]
  48. Aggidis, G.A.; Taylor, C.J. Overview of wave energy converter devices and the development of a new multi-axis laboratory prototype. IFAC-Pap. Online 2017, 50, 15651–15656. [Google Scholar] [CrossRef]
  49. Iglesias, G.; Carballo, R. Wave resource in El Hierro—An island towards energy self-sufficiency. Renew. Energy 2011, 36, 689–698. [Google Scholar] [CrossRef]
  50. Castro-Santos, L.; Silva, D.; Bento, A.R.; Salvação, N.; Soares, C.G. Economic feasibility of wave energy farms in Portugal. Energies 2018, 11, 3149. [Google Scholar] [CrossRef] [Green Version]
  51. Castro-Santos, L.; Filgueira-Vizoso, A.; Piegari, L. Calculation of the levelized cost of energy and the internal rate of return using GIS: The case study of a floating wave energy farm. In Proceedings of the 2019 International Conference on Clean Electrical Power (ICCEP), Otranto, Italy, 2–4 July 2019; pp. 674–679. [Google Scholar]
  52. Rusu, L.; Onea, F. Assessment of the performances of various wave energy converters along the European continental coasts. Energy 2015, 82, 889–904. [Google Scholar] [CrossRef]
  53. Zanuttigh, B.; Angelelli, E.; Kofoed, J.P. Effects of mooring systems on the performance of a wave activated body energy converter. Renew. Energy 2013, 57, 422–431. [Google Scholar] [CrossRef]
  54. Cameron, L.; Doherty, R.; Henry, A.; Doherty, K.; Van’t Hoff, J.; Kaye, D.; Naylor, D.; Bourdier, S.; Whittaker, T. Design of the next generation of the Oyster wave energy converter. In Proceedings of the 3rd International Conference on Ocean Energy, Bilbao, Spain, 6–9 October 2010; Volume 6, pp. 1–12. [Google Scholar]
  55. Zhang, D.; Li, W.; Lin, Y. Wave energy in China: Current status and perspectives. Renew. Energy 2009, 34, 2089–2092. [Google Scholar] [CrossRef]
  56. Arena, F.; Romolo, A.; Malara, G.; Ascanelli, A. On design and building of a U-OWC wave energy converter in the Mediterranean Sea: A case study. In Proceedings of the International Conference on Offshore Mechanics and Arctic Engineering, Nantes, France, 9–14 June 2013; Volume 55423, p. V008T09A102. [Google Scholar]
  57. Washio, Y.; Osawa, H.; Nagata, Y.; Fujii, F.; Furuyama, H.; Fujita, T. The offshore floating type Wave Power Device “Mighty Whale”: Open sea tests. In Proceedings of the Tenth International Offshore and Polar Engineering Conference, Seattle, WA, USA, 28 May–2 June 2000. [Google Scholar]
  58. Kofoed, J.P.; Frigaard, P.; Friis-Madsen, E.; Sørensen, H.C. Prototype testing of the wave energy converter wave dragon. Renew. Energy 2006, 31, 181–189. [Google Scholar] [CrossRef] [Green Version]
  59. Vicinanza, D.; Margheritini, L.; Kofoed, J.P.; Buccino, M. The SSG wave energy converter: Performance, status and recent developments. Energies 2012, 5, 193–226. [Google Scholar] [CrossRef] [Green Version]
  60. Babarit, A.; Hals, J.; Muliawan, M.; Kurniawan, A.; Moan, T.; Krokstad, J. Numerical benchmarking study of a selection of wave energy converters. Renew. Energy 2012, 41, 44–63. [Google Scholar] [CrossRef]
  61. Oliveira-Pinto, S.; Rosa-Santos, P.; Taveira-Pinto, F. Electricity supply to offshore oil and gas platforms from renewable ocean wave energy: Overview and case study analysis. Energy Convers. Manag. 2019, 186, 556–569. [Google Scholar] [CrossRef]
  62. Neill, S.P.; Hashemi, M.R. Wave power variability over the northwest European shelf seas. Appl. Energy 2013, 106, 31–46. [Google Scholar] [CrossRef]
  63. Langodan, S.; Viswanadhapalli, Y.; Dasari, H.P.; Knio, O.; Hoteit, I. A high-resolution assessment of wind and wave energy potentials in the Red Sea. Appl. Energy 2016, 181, 244–255. [Google Scholar] [CrossRef]
  64. Coe, R.G.; Michelen, C.; Eckert-Gallup, A.; Sallaberry, C. Full long-term design response analysis of a wave energy converter. Renew. Energy 2018, 116, 356–366. [Google Scholar] [CrossRef]
  65. Dang, T.D.; Phan, C.B.; Ahn, K.K. Design and investigation of a novel point absorber on performance optimization mechanism for wave energy converter in heave mode. Int. J. Precis. Eng. Manuf.-Green Technol. 2019, 6, 477–488. [Google Scholar] [CrossRef]
  66. Neshat, M.; Sergiienko, N.Y.; Amini, E.; Nezhad, M.M.; Garcia, D.A.; Alexander, B.; Wagner, M. A new bi-level optimisation framework for optimising a multi-mode wave energy converter design: A case study for the Marettimo Island, Mediterranean Sea. Energies 2020, 13, 5498. [Google Scholar] [CrossRef]
  67. Amini, E.; Asadi, R.; Golbaz, D.; Nasiri, M.; Naeeni, S.T.O.; Nezhad, M.M.; Piras, G.; Neshat, M. Comparative study of oscillating surge wave energy converter performance: A case study for southern coasts of the Caspian sea. Sustainability 2021, 13, 10932. [Google Scholar] [CrossRef]
  68. Orphin, J.; Nader, J.R.; Penesis, I. Size matters: Scale effects of an OWC wave energy converter. Renew. Energy 2022, 185, 111–122. [Google Scholar] [CrossRef]
  69. Sheng, W.; Tapoglou, E.; Ma, X.; Taylor, C.; Dorrell, R.; Parsons, D.; Aggidis, G. Hydrodynamic studies of floating structures: Comparison of wave-structure interaction modelling. Ocean. Eng. 2022, 249, 110878. [Google Scholar] [CrossRef]
  70. Rusu, E.; Onea, F. A review of the technologies for wave energy extraction. Clean Energy 2018, 2, 10–19. [Google Scholar] [CrossRef] [Green Version]
  71. Clark, C.E.; Miller, A.; DuPont, B. An analytical cost model for co-located floating wind-wave energy arrays. Renew. Energy 2019, 132, 885–897. [Google Scholar] [CrossRef]
  72. Sharay, A.; Gregorio, I. Enhancing wave energy competitiveness through co-located wind and wave energy farms. A review on the shadow effect. Energies 2015, 8, 7344–7366. [Google Scholar]
  73. Aldersey-Williams, J.; Rubert, T. Levelised cost of energy–A theoretical justification and critical assessment. Energy Policy 2019, 124, 169–179. [Google Scholar] [CrossRef]
  74. Brealey, R.; Myers, S.; Allen, F. Corporate Finance, 8th ed.; McGraw-Hill: New York, NT, USA, 2006. [Google Scholar]
  75. Têtu, A.; Fernandez Chozas, J. A proposed guidance for the economic assessment of wave energy converters at early development stages. Energies 2021, 14, 4699. [Google Scholar] [CrossRef]
  76. Nuclear Energy Agency, International Energy Agency. Projected Costs of Generating Electricity. March 2005. Available online: https://www.oecd-nea.org/upload/docs/application/pdf/2020-12/egc-2020_2020-12-09_18-26-46_781.pdf (accessed on 2 March 2022).
  77. Dalton, G.J.; Alcorn, R.; Lewis, T. Case study feasibility analysis of the Pelamis wave energy convertor in Ireland, Portugal and North America. Renew. Energy 2010, 35, 443–455. [Google Scholar] [CrossRef]
  78. Ramos, V.; Giannini, G.; Calheiros-Cabral, T.; López, M.; Rosa-Santos, P.; Taveira-Pinto, F. Assessing the effectiveness of a novel WEC concept as a co-located solution for offshore wind farms. J. Mar. Sci. Eng. 2022, 10, 267. [Google Scholar] [CrossRef]
  79. Darling, S.B.; You, F.; Veselka, T.; Velosa, A. Assumptions and the levelized cost of energy for photovoltaics. Energy Environ. Sci. 2011, 4, 3133–3139. [Google Scholar] [CrossRef]
  80. Giassi, M.; Castellucci, V.; Göteman, M. Economical layout optimization of wave energy parks clustered in electrical subsystems. Appl. Ocean. Res. 2020, 101, 102274. [Google Scholar] [CrossRef]
  81. Bajaj, S.; Sandhu, K.S. Analysis of sizing parameters of a wind turbine using LCOE technique. Int. J. Energy Environ. Econ. 2017, 25, 57–68. [Google Scholar]
  82. Sergent, P.; Baudry, V.; De Bonviller, A.; Michard, B.; Dugor, J. Numerical assessment of onshore wave energy in France: Wave energy, conversion and cost. J. Mar. Sci. Eng. 2020, 8, 947. [Google Scholar] [CrossRef]
  83. Astariz, S.; Iglesias, G. Co-located wind and wave energy farms: Uniformly distributed arrays. Energy 2016, 113, 497–508. [Google Scholar] [CrossRef] [Green Version]
  84. Frost, C.; Findlay, D.; Macpherson, E.; Sayer, P.; Johanning, L. A model to map levelised cost of energy for wave energy projects. Ocean. Eng. 2018, 149, 438–451. [Google Scholar] [CrossRef]
  85. Thomaz, T.B.; Crooks, D.; Medina-Lopez, E.; van Velzen, L.; Jeffrey, H.; Mendia, J.L.; Arias, R.R.; Minguela, P.R. O&M models for ocean energy converters: Calibrating through Real Sea Data. Energies 2019, 12, 2475. [Google Scholar]
  86. Gray, A.; Dickens, B.; Bruce, T.; Ashton, I.; Johanning, L. Reliability and O&M sensitivity analysis as a consequence of site specific characteristics for wave energy converters. Ocean. Eng. 2017, 141, 493–511. [Google Scholar]
  87. Bertram, D.V.; Tarighaleslami, A.H.; Walmsley, M.R.W.; Atkins, M.J.; Glasgow, G.D.E. A systematic approach for selecting suitable wave energy converters for potential wave energy farm sites. Renew. Sustain. Energy Rev. 2020, 132, 110011. [Google Scholar] [CrossRef]
  88. Pennock, S.; Garcia-Teruel, A.; Noble, D.R.; Roberts, O.; de Andres, A.; Cochrane, C.; Jeffrey, H. Deriving current cost requirements from future targets: Case studies for emerging offshore renewable energy technologies. Energies 2022, 15, 1732. [Google Scholar] [CrossRef]
  89. Lehmann, M.; Karimpour, F.; Goudey, C.A.; Jacobson, P.T.; Alam, M.R. Ocean wave energy in the United States: Current status and future perspectives. Renew. Sustain. Energy Rev. 2017, 74, 1300–1313. [Google Scholar] [CrossRef]
  90. Faraggiana, E.; Chapman, J.; Williams, A.; Masters, I. Genetic based optimisation of the design parameters for an array-on-device orbital motion wave energy converter. Ocean. Eng. 2020, 218, 108251. [Google Scholar] [CrossRef]
  91. Shelley, S.; Boo, S.Y.; Luyties, W. Levelized Cost of Energy for a 200 MW Floating Wind Farm with Variance Analysis. KOSMEE 2018 Fall Conference, 2018; pp. 191–204. Available online: http://www.vloffshore.com/index_htm_files/KOSMEE%202018%20Levelized%20Cost%20of%20Energy%20for%20a%20200%20MW%20Floating%20Wind%20Farm.pdf (accessed on 6 May 2022).
  92. Castro-Santos, L.; Martins, E.; Soares, C.G. Cost assessment methodology for combined wind and wave floating offshore renewable energy systems. Renew. Energy 2016, 97, 866–880. [Google Scholar] [CrossRef]
  93. ECONorthwest. Economic Impact Analysis of Wave Energy: Phase One; Oregon Wave Energy Trust: Portland, OR, USA, 2009; Available online: https://pacificoceanenergy.org/wp-content/uploads/2013/09/Economic-Impact-Analysis-of-Wave-Energy-Phase-One%E2%80%94September-2009.pdf (accessed on 2 July 2022).
  94. Klure, J.; Dragoon, K.; King, J.; Reikard, G.; Ventures, P.E. Wave Energy Utility Integration: Advanced Resource Characterization and Integration Costs and Issues. Oregon Wave Energy Trust, Portland, Oregon, 2013. Available online: https://ir.library.oregonstate.edu/concern/technical_reports/vx021f634 (accessed on 2 July 2022).
  95. Bedard, R.; Hagerman, G.; Siddiqui, O. System Level Design, Performance and Costs for San Francisco California Pelamis Offshore Wave Power Plant; Electric Power Research Institute (EPRI): San Francisco, CA, USA, 2004; Available online: http://www.re-vision.net/documents/System%20Level%20Design,%20Performance%20and%20Costs%20-%20San%20Francisco%20California%20Pelamis%20Offshore%20Wave%20Power%20Plant.pdf (accessed on 2 July 2022).
  96. Dunnett, D.; Wallace, J.S. Electricity generation from wave power in Canada. Renew. Energy 2009, 34, 179–195. [Google Scholar] [CrossRef]
  97. Laura, C.S.; Vicente, D.C. Life-cycle cost analysis of floating offshore wind farms. Renew. Energy 2014, 66, 41–48. [Google Scholar] [CrossRef]
  98. Sandberg, A.B.; Klementsen, E.; Muller, G.; De Andres, A.; Maillet, J. Critical factors influencing viability of wave energy converters in off-grid luxury resorts and small utilities. Sustainability 2016, 8, 1274. [Google Scholar] [CrossRef] [Green Version]
  99. Astariz, S.; Perez-Collazo, C.; Abanades, J.; Iglesias, G. Co-located wave-wind farms: Economic assessment as a function of layout. Renew. Energy 2015, 83, 837–849. [Google Scholar] [CrossRef]
  100. Stansby, P.; Moreno, E.C.; Stallard, T. Large capacity multi-float configurations for the wave energy converter M4 using a time-domain linear diffraction model. Appl. Ocean. Res. 2017, 68, 53–64. [Google Scholar] [CrossRef]
  101. Tan, J.; Wang, X.; Laguna, A.J.; Polinder, H.; Miedema, S. The influence of linear permanent magnet generator sizing on the techno-economic performance of a wave energy converter. In Proceedings of the 2021 13th International Symposium on Linear Drives for Industry Applications (LDIA), Wuhan, China, 1–3 July 2021; pp. 1–6. [Google Scholar]
  102. Thomsen, J.B.; Ferri, F.; Kofoed, J.P.; Black, K. Cost optimization of mooring solutions for large floating wave energy converters. Energies 2018, 11, 159. [Google Scholar] [CrossRef] [Green Version]
  103. Chandrasekaran, S.; Sricharan, V.V.S. Numerical study of bean-float wave energy converter with float number parametrization using WEC-Sim in regular waves with the Levelized Cost of Electricity assessment for Indian sea states. Ocean. Eng. 2021, 237, 109591. [Google Scholar] [CrossRef]
  104. Tan, J.; Polinder, H.; Laguna, A.J.; Miedema, S. The application of the spectral domain modeling to the power take-off sizing of heaving wave energy converters. Appl. Ocean. Res. 2022, 122, 103110. [Google Scholar] [CrossRef]
  105. Quitoras, M.R.D.; Abundo, M.L.S.; Danao, L.A.M. A techno-economic assessment of wave energy resources in the Philippines. Renew. Sustain. Energy Rev. 2018, 88, 68–81. [Google Scholar] [CrossRef]
  106. Stegman, A.; De Andres, A.; Jeffrey, H.; Johanning, L.; Bradley, S. Exploring marine energy potential in the UK using a whole systems modelling approach. Energies 2017, 10, 1251. [Google Scholar] [CrossRef] [Green Version]
  107. Guanche, R.; de Andrés, A.; Simal, P.; Vidal, C.; Losada, I. Uncertainty analysis of wave energy farms financial indicators. Renew. Energy 2014, 68, 570–580. [Google Scholar] [CrossRef]
  108. De Andres, A.; Maillet, J.; Todalshaug, J.H.; Möller, P.; Bould, D.; Jeffrey, H. Techno-economic related metrics for a wave energy converters feasibility assessment. Sustainability 2016, 8, 1109. [Google Scholar] [CrossRef] [Green Version]
  109. Lavidas, G.; Blok, K. Shifting wave energy perceptions: The case for wave energy converter (WEC) feasibility at milder resources. Renew. Energy 2021, 170, 1143–1155. [Google Scholar] [CrossRef]
  110. O’Connor, M.; Lewis, T.; Dalton, G. Operational expenditure costs for wave energy projects and impacts on financial returns. Renew. Energy 2013, 50, 1119–1131. [Google Scholar] [CrossRef] [Green Version]
  111. International Renewable Energy Agency (IRENA). Renewable Power Generation Costs in 2014. 2015. Available online: https://www.irena.org/publications/2015/jan/renewable-power-generation-costs-in-2014 (accessed on 2 July 2022).
  112. U.S. Energy Information Administration. Levelized Costs of New Generation Resources in the Annual Energy Outlook 2022. 2022. Available online: https://www.eia.gov/outlooks/aeo/pdf/electricity_generation.pdf (accessed on 2 July 2022).
  113. Tran, T.T.D.; Smith, A.D. Incorporating performance-based global sensitivity and uncertainty analysis into LCOE calculations for emerging renewable energy technologies. Appl. Energy 2018, 216, 157–171. [Google Scholar] [CrossRef]
  114. Allan, G.; Gilmartin, M.; McGregor, P.; Swales, K. Levelised costs of wave and tidal energy in the UK: Cost competitiveness and the importance of “banded” Renewables Obligation Certificates. Energy Policy 2011, 39, 23–39. [Google Scholar] [CrossRef]
  115. Burgess, C.; Biswas, W.K. Eco-efficiency assessment of wave energy conversion in Western Australia. J. Clean. Prod. 2021, 312, 127814. [Google Scholar] [CrossRef]
  116. European Commission. Offshore Renewable Energy [N/OL]. 2011. Available online: https://energy.ec.europa.eu/topics/renewable-energy/offshore-renewable-energy_en (accessed on 1 August 2022).
  117. Crooks, D.; De Andres, A.; Medina-Lopez, E.; Jeffrey, H. Demonstration of a socio-economic cost of energy analysis of a wave energy converter array. In Proceedings of the 12th European Wave and Tidal Energy Conference, Cork, Ireland, 27 August–1 September 2017; pp. 1–11. [Google Scholar]
  118. Wave Energy Scotland. Wave Energy Scotland Awards £7.5m for Power Take Off Projects [N/online]. Available online: https://www.waveenergyscotland.co.uk/news-events/wave-energy-scotland-awards-75m-for-power-take-off-projects/ (accessed on 9 August 2022).
  119. Wiser, R.; Jenni, K.; Seel, J.; Baker, E.; Hand, M.; Lantz, E.; Smith, A. Forecasting Wind Energy Costs and Cost Drivers: The Views of the World’s Leading Experts. 2016. Berkeley Lab. Available online: https://eta-publications.lbl.gov/sites/default/files/lbnl-1005717.pdf (accessed on 10 August 2022).
  120. Carbon Trust. Accelerating Marine Energy: The Potential for Cost Reduction-Insights from the Carbon Trust Marine Energy Accelerator. 2011. Available online: https://ctprodstorageaccountp.blob.core.windows.net/prod-drupal-files/documents/resource/public/Accelerating%20marine%20energy%20-%20REPORT.pdf (accessed on 10 August 2022).
  121. Castro-Santos, L.; Bento, A.R.; Guedes Soares, C. The economic feasibility of floating offshore wave energy farms in the North of Spain. Energies 2020, 13, 806. [Google Scholar] [CrossRef] [Green Version]
  122. De Oliveira, L.; dos Santos IF, S.; Schmidt, N.L.; Tiago Filho, G.L.; Camacho, R.G.R.; Barros, R.M. Economic feasibility study of ocean wave electricity generation in Brazil. Renew. Energy 2021, 178, 1279–1290. [Google Scholar] [CrossRef]
  123. Esteban, M.D.; López-Gutiérrez, J.-S.; Negro, V.; Laviña, M.; Muñoz-Sánchez, P. A new classification of wave energy converters used for selection of devices. J. Coast. Res. 2018, 85, 1286–1290. [Google Scholar] [CrossRef]
  124. Khan MZ, A.; Khan, H.A.; Aziz, M. Harvesting energy from ocean: Technologies and perspectives. Energies 2022, 15, 3456. [Google Scholar] [CrossRef]
  125. Castro-Santos, L.; Garcia, G.P.; Estanqueiro, A.; Justino, P.A. The levelized cost of energy (LCOE) of wave energy using GIS based analysis: The case study of Portugal. Int. J. Electr. Power Energy Syst. 2015, 65, 21–25. [Google Scholar] [CrossRef] [Green Version]
  126. Oxera Consulting. Discount Rates for Low-Carbon and Renewable Generation Technologies. 2011. Oxford. Available online: https://www.oxera.com/wp-content/uploads/2018/03/Oxera-report-on-low-carbon-discount-rates-3.pdf (accessed on 12 September 2022).
  127. Choupin, O.; Henriksen, M.; Tomlinson, R. Interrelationship between variables for wave direction-dependent WEC/site-configuration pairs using the CapEx method. Energy 2022, 248, 123552. [Google Scholar] [CrossRef]
  128. Guanche, R.; de Andrés, A.; Losada, I.J.; Vidal, C. A global analysis of the operation and maintenance role on the placing of wave energy farms. Energy Convers. Manag. 2015, 106, 440–456. [Google Scholar] [CrossRef]
Figure 1. Performance comparison of the capture width ratio of different WECs.
Energies 16 02144 g001
Figure 2. Performance comparison of the absorbed energy per characteristic mass of WECs.
Energies 16 02144 g002
Figure 3. Performance comparison of the absorbed energy per surface area of WECs.
Energies 16 02144 g003
Figure 4. Performance comparison of the absorbed energy per RMS of PTO force of WECs.
Energies 16 02144 g004
Figure 5. Distribution of the cost centers.
Energies 16 02144 g005
Figure 6. Percentage of the cost center towards total cost of W2Pow technology.
Energies 16 02144 g006
Figure 7. Percentage of the cost center towards total cost of Poseidon technology (Note: Figure does not show discounted cost for the 100-unit Pelamis installation).
Energies 16 02144 g007
Figure 8. Cost center breakdown of the CAPEX in the three locations (Adapted with permission from Ref. [98]. 2016, Sandberg, A.B., et al.).
Energies 16 02144 g008
Figure 9. CAPEX per unit of case study located in the Norwegian Continental Shelf (Adapted with permission from Ref. [61]. 2019, Oliveira-Pinto, S., et al.).
Energies 16 02144 g009
Figure 10. CAPEX per unit of case study simulated in the sea area of USA (Adapted with permission from Ref. [30]. 2018, Chang, G., et al.).
Energies 16 02144 g010
Table 1. Summary of several kinds of WECs.
NameTypeLocation of Application/Design StageReference
AquaBuOYPoint absorber/OBWECPortugal
Galicia, Northwest Spain
[50]
[51]
WavebobPoint absorber/OBWEClaboratory of Ecole Centrale de Nan, France[52]
PelamisAttenuator/OBWECPortugal[50]
DEXAAttenuator/OBWECCoastal Engineering Laboratory at Aalborg University, Denmark[53]
TALOS II Multi-DOF WECMulti-axis series structure WEC/OBWECTALOS II multi-DOF WEC/laboratory in Lancaster University, UK[48]
Wave DragonOvertopping WEC(OWEC)Portugal, Spain (Castro-Santos)[50]
OysterTerminator/
OBWEC
European Marine Energy Centre (EMEC) in Orkney, Scotland[54]
Shoreline OWC PlantFixed structure/OWCZhelang Town, Shanwei City of Guangdong Province, China[55]
U-OWC DevicesBreakwater/OWCharbour of Civitavecch, Italy[56]
Mighty WhaleFloating structure/OWCmouth of Gokasho Bay in Mie Prefecture[57]
Wave DragonFloating/OWECNissum Bredning, Denmark[58]
Sea-wave Slot-cone Generator (SSG)Fixed/OWECHanstholm, Denmark; island of Kvitsøy, Norway[59]
Table 2. Decommissioning cost.
ValueDescriptionReference
EUR 4,080,6900.75% of the initial cost[99]
3% of total costDismantling and elimination of material, cleaning of site costs[41]
0.0017% of initial costRemoval, transport, and recycle[96]
EUR 0.8 million, EUR 0.2 million, EUR 0.4 millionTesting in the Bora Bora, Maldives, and Lanzarote, respectively[98]
1% of CAPEX [53]
EUR 255,000Dismantling the wind and wave device generator[92]
EUR 75,048,681Dismantling the hybrid floating platforms
EUR 496,096Dismantling the mooring and anchoring system
EUR 2,759,920Dismantling the electric system
EUR 1,730,914Dismantling the cleaning area
EUR 80,290,611Total DC, São Pedro de Moel (105.4 MW) by Poseidon
Table 3. Capital expenditure of wave energy.
CategoryValueDescriptionReference
Devices costEUR 2125Gravity foundation [80]
EUR 8400Buoy
EUR 21,120Translator
EUR 8100Stator
EUR 5300Casing
EUR 25,000Labor
EUR 10,000Extra material
Electrical systems costEUR 46/mIntra-array cable
EUR 72.5/mTransmission cable to shore
EUR 2/mCommunication cable
EUR 168/kmSubstation
InstallationEUR 4100WEC
EUR 10,000Substation
EUR 500/kmCables
Decommissioning costEUR 4100WEC
EUR 10,000Substation
EUR 500/kmCables
Structure Cost0.455Normalized value with one float[90]
PTO Cost0.278
Control Cost0.055
Grid Cost0.054
Mooring Cost0.037
Installation Cost0.012
Margin Cost0.110
Structure38.2%Mass-related capital cost[35]
Foundation and mooring19.1%
Installation10.2%
PTO component24.2%Power-related capital cost
Grid connection8.3%
Development costs (EUR/kW)EUR 250/Kw6%/CAPEX[93]
Wave Energy Converter
(Structure and Prime Mover)
EUR 1340/Kw33%/CAPEX
Balance of PlantEUR 1600/Kw38%/CAPEX
Installation and CommissioningEUR 590/Kw13%/CAPEX
DecommissioningEUR 420/Kw10%/CAPEX
WEC and installationEUR 2.5–6.0 million/Mw [33]
Mooring systemEUR 0.265/day
Mooring InstallationEUR 50,000/day
Underwater cable10% of CAPEX
Cable installationEUR 2.07/m
Costs electrical substation EUR ≈ 1.2 million
Table 4. Summary of the OPEX.
CategoryValueReference
Repair of buoyEUR 723/year[80]
Repair of generatorEUR 10,000/year
Site lease and insuranceEUR 5000/year
Annual O&M29% of total OPEX[110]
Overhaul15% of total OPEX
Replacement45% of total OPEX
Insurance11% of total OPEX
OPEX5–15% of the CAPEX[28,35,37,100,107,108,109]
Insurance1% of the total CAPEX[102]
Inspection and maintenance4 vessel-days and 16 person-days
Checking and adjustment of tensionAfter 1, 5, and 10 years
Replacements1.5% of the CAPEX
Table 5. Target of LCOE for wave energy.
Target ValueDescriptionReference
USD 0.05–0.28/kWhThe LCOE of conventional energy generation projects such as coal, natural gas, and nuclear[30]
EUR 0.15/kWh by 2025 and EUR 0.10/kWh by 2030 for tidal streamStrategic Energy Technology (SET) Plan
In EU
[116]
EUR 0.20/kWh by 2025 and EUR 0.15/kWh by 2030 for wave energy
GBP 150 MWh−1Wave Energy by Scotland (WES)[115,117,118]
USD 0.17/kWhOffshore wind[119]
15–20 p/kWh by 2020Wave energy and tidal energy with 0.4 GW of tidal and 0.3 GW of wave capacity[120]
Table 6. Summary of the LCOE.
ValuesDescriptionReference
EUR 513.17/MWhWave DragonNorthwest area of the Galician region[121]
EUR 1710.98/MWhPelamis
EUR 2627.60/MWhAquaBuOY
USD 163.00/MWhPelamis-[122]
USD 138.00/MWhWave dragon
EUR 1.77–1.25/kWhOvertopping system (SSG)r = 10%[82]
EUR 2.17–1.73/kWhOscillating water column (OWC)
EUR0.47–0.40/kWhOscillating flap
EUR 0.37–0.27/kWhOscillating float
EUR 1.52–1.05/kWhOvertopping system (SSG)r = 7.5%
EUR 1.87–1.50/kWhOscillating water column (OWC)
EUR 0.41–0.35/kWhOscillating flap
EUR 0.32–0.23/kWhOscillating float
USD 0.88/kWh11 over the lifetime of 20 years (BFWEC-8)[103]
GBP 174.6/MWh50 years with 40 devices/TALOS
GBP 100/MWh70 years with 40 devices/TALOS
EUR 0.310/kWhBora Bora4 WECs[98]
EUR 0.633/kWhMaldives 1 WECs
EUR 0.282/kWhLanzarote2 WECs
Table 7. Some key assumptions of the proposed WEC configurations.
ItemsBBMALA
Average wave resource20–30 kW/m10–20 kW/m29 kW/m
Number of WECs412
Average capacity factor (DCF)0.40.250.5
Device availability (DAF)90%90%90%
Annual energy production (AEP)3154 MWh493 MWh1971 MWh
Table 8. Original cost data in the testing locations.
ItemsBB (EUR million)MA (EUR million)LA (EUR million)
Device CAPEX2.560.641.28
Moorings and anchor0.520.130.26
On-shore grid connection (fixed)0.50.50.5
Cable cost0.190.480.38
Spare parts0.2340.080.13
Siting and permits0.2340.080.13
GHG investigations0.0060.0020.003
Installation cost1.750.590.98
Management cost0.80.20.4
O&M4.091.022.05
Table 9. Key results in the cases.
ItemsScene 1 (Discount)Scene 2 (Discount)Scene 3 (Half-Discount)
BBMALABBMALABBMALA
CAPEX EUR million19.4657.74111.6419.2403.6755.52633.9713.5120.315
OPEX EUR million141.03135.17070.68587.75821.88643.986250.17562.391125.393
AEP MWh108,751.44316,998.87867,961.03167,674.74010,578.20142,291.348788,500123,250492,750
LCOE EUR/KWh1.4762.5241.2111.4332.4161.1710.3600.6160.296
CAPEX/AEP
EUR/KWh
0.1790.4550.1710.1360.3470.1310.0430.1100.041
OPEX/AEP
EUR/KWh
1.2972.0691.0401.2972.0691.0400.3170.5060.254
Disclaimer/Publisher’s Note: The statements, opinions and data contained in all publications are solely those of the individual author(s) and contributor(s) and not of MDPI and/or the editor(s). MDPI and/or the editor(s) disclaim responsibility for any injury to people or property resulting from any ideas, methods, instructions or products referred to in the content.