Abstract
Due to the emission of carbon dioxide and other greenhouse gases, the global climate is warming. As the world’s biggest emitter of carbon emissions, China faces a more severe challenge in reducing carbon emissions than developed countries. A reasonable prediction of the carbon peak in China will help the government to formulate effective emission reduction paths. This paper analyzes the changes in carbon emissions in China from 2004 to 2020, uses the STIRPAT model and scenario analysis method to predict carbon emissions from 2021 to 2030, and then calculates the carbon efficiency during carbon peaking to select the most effective carbon peak path for China. The results show that China’s carbon emissions increased year by year from 2004 to 2020. Under the baseline scenario, China is unlikely to reach its carbon peak before 2030. Under the regulatory scenarios, China can reach its carbon peak before 2030. The peak values from high to low are seen with the rapid development-weak carbon control scenario, rapid development-intensified carbon control scenario, slow development-weak carbon control scenario and slow development-intensified carbon control scenario, respectively. Correspondingly, China will peak its carbon emissions in 2029, 2028, 2028 and 2028, respectively, according to these scenarios. The carbon efficiency under the rapid development-weak carbon control scenario is the highest, which means that accelerating the growth rate of population, GDP and urbanization while moderately carrying out the transformation of industrial structure and energy structure is an effective way to achieve the goal of “carbon peak by 2030”.
1. Introduction
The negative impact of global warming has become one of the most serious environmental problems facing all countries. The massive emissions of greenhouse gases are the main causes of global warming. Controlling greenhouse gas emissions can not only improve the global climate issue but also promote the sustainable development of economies and society. As a country with a large population and high energy consumption, China emits more than 6 billion tons of carbon dioxide into the atmosphere every year, ranking first in the world. Compared with developed countries in the post-industrialization stage, China is faced with a more arduous task of carbon emission reduction and needs to make more efforts. In order to reduce carbon emissions and tackle global warming, in September 2020, China took the initiative to put forward the carbon emission reduction target of “striving to achieve carbon peak by 2030 and carbon neutrality by 2060” (“dual carbon target”). However, since the outbreak of the COVID-19 pandemic, there has been a lack of research on China’s carbon peaking and its path. Therefore, it is particularly important to find a suitable path for China to reach its carbon peak in the situation of unprecedented changes. At present, scholars have made many predictions for the “dual carbon target”. Some scholars believe that at current growth rates, China cannot reach the carbon peak before 2030 [1,2,3,4]. Li et al. [5] predicted that China can reach the carbon peak in 2030 only when the rate of carbon emission reduction is higher than the economic growth rate, but it is still very difficult at the present stage. Zheng et al. [6] predicted the carbon emission of 100 cities in China, and the results showed that only 44% of the cities could achieve the carbon peak before 2030, while the other cities needed more time. Wang et al. [7] made a scenario prediction of the carbon peak in the megacity of China and believed that the peak could be reached in 2030 only when the carbon emission intensity decline rate was very high. However, a rapid decline in carbon intensity is bound to cause economic losses. Other scholars believe that the carbon peak can be reached in China before 2030 [8,9,10]. Ma et al. [11] predicted China’s carbon emissions in 2030 based on the energy system optimization model and concluded that carbon emissions would peak in 2030, with a peak value of 10–10.8 billion tons. Yu et al. [12] conducted a top-down study on carbon emissions from the perspective of industry in China, and the result showed that China could reach a carbon peak in 2025 at the earliest and 2030 at the latest. Wang et al. [13] simulated the impact of carbon peaking on the economy and society of China in different years and found that carbon peaking in 2030 would have the least impact on China’s economy and the best effect on carbon emission reduction. The discussion on carbon peaking is obviously open. The existing studies on this topic have not reached a consistent conclusion, and the specific peaking time and peaking path need to be further explored. This paper focuses on the following issues: (1) According to the current situation of social estrus, can China reach its carbon peak before 2030? (2) When will China reach its carbon peak under the regulatory scenario? (3) Under which scenario can China achieve its carbon peak successfully and quickly? Choosing a suitable prediction model and evaluation method is the premise of solving the above problems.
For carbon emission prediction, the STIRPAT (Stochastic Impacts by Regression on Population, Affluence, and Technology) model, the LEAP (Long-range Energy Alternatives Planning System) model, the neural network model and scenario analysis have been widely used. Qu et al. [14] used the STIRPAT model to predict carbon emissions in China and the result showed that when economic growth and carbon emission intensity decline maintained a reasonable relative relationship, the goal of carbon peak would be achieved between 2020 and 2045. Zhang et al. and Niu et al. [15,16] also adopted the STIRPAT model to predict carbon peaking at the provincial level and found that the adjustment of model parameters can realize the setting of different peaking scenarios. Using the STIRPAT model can help to identify the factors that will influence carbon peak so that governments can tailor economic growth and emissions reduction accordingly. Deng et al. [17], Deng et al. [18] and Wang et al. [19] used the LEAP model to predict carbon emissions at the provincial level. Song et al. [20] also used the LEAP model to explore the path of carbon emission reduction in Chongqing. Zhou et al. [21] used the LEAP model to test the carbon emission reduction effect of the “3E policy” in Urumqi. Qiu et al. [22] and Gao et al. [23] used a BP neural network model to predict China’s carbon emissions. Hu et al. [24] improved the neural network model to reduce the model error and predicted China’s industrial carbon emissions. Liu et al. [25] used scenario analysis to set up a variety of scenarios to predict China’s carbon emissions. Scenario analysis could predict future carbon emissions from multiple perspectives in a more comprehensive way, making the prediction results more convincing. Scholars often combine models when making scenario predictions. For example, Li et al. [26] and Wang et al. [27] set up a variety of scenarios to predict carbon emissions by combining the extended STIRPAT model and scenario analysis.
In general, the STIRPAT Model studies the impact of each driving factor on carbon emissions from the perspective of population, economic and technological factors on the environment. At the same time, the study of influencing factors is conducive to setting the parameters of scenario simulation. Compared with other prediction models, scenario analysis has the following characteristics: First, it allows more possibilities for future development, and many scenarios will be generated when setting independent variables, so there are also many kinds of prediction results. Second, it focuses on the analysis of the factors that play a key role in the prediction results. Third, the subjective will of decision-makers will also have a certain impact on the results in the scenario prediction process. Fourth, it combines quantitative analysis with qualitative analysis [28]. In light of the above discussion, this paper uses the STIRPAT Model and the scenario analysis method to predict the trend in carbon emissions in China from 2021 to 2030.
Previous studies only analyzed the peak time and the peak value of carbon emissions while ignoring the input-output efficiency of all society. The introduction of carbon efficiency can evaluate the effectiveness of carbon emissions from the perspective of input and output. We can analyze how to promote the improvement in carbon efficiency through the evaluation and provide some theoretical references for China to formulate a carbon peak policy. Scholars most commonly use the DEA (Data Envelopment Analysis) model to analyze efficiency. Liu et al. [29] measured the efficiency of carbon emissions at the provincial level with the DEA model and analyzed regional differences according to provincial carbon efficiency values [30,31]. Fang et al. [32] used the DEA model to evaluate the impact of energy price fluctuations on carbon efficiency. However, scholars have only studied the efficiency of carbon emissions in recent years, not the efficiency of carbon peak measures in the future. Zhou et al. [33], Miao et al. [34] and Feng et al. [35] calculated provincial carbon emission reduction potential using the DEA model, the Zero-sum Gains-DEA model and the frontier DEA model and formulated effective regional carbon emission reduction policies. Feng et al. [36] evaluated the effectiveness of carbon emission control policies of 13 cities in the Beijing-Tianjin-Hebei region using an SBM (Slack-Based Measure) model. The traditional DEA model will be fully effective at the same time when calculating the efficiency value, while the super-efficiency model can make the efficiency value break the limit of 1. Therefore, Jiang et al. [37] and Zhang et al. [38] calculated the efficiency of carbon emission control policies by using the super-efficiency DEA model, which can clearly distinguish the differences in efficiency values in different provinces. Zhou et al. [39] calculated the carbon efficiency of 35 industries in China using the super-efficiency SBM model and analyzed the differences in emission reduction paths of different industries. Based on previous studies, we choose carbon efficiency to evaluate the efficiency of energy input and benefit output in China when carbon levels peak.
Based on the above research results and current research background, the argument on how to achieve China’s carbon peak goal needs to be updated. At the same time, previous studies did not evaluate the carbon efficiency of the predicted scenarios, so the effectiveness of energy input and benefit output under each scenario could not be measured. Based on the above research, this paper takes the achievement of the “double carbon target” in China as the research background, and uses the STIRPAT model, scenario analysis and DEA theory to explore the optimal path toward carbon peak in China as the research theme. Under different scenarios, it discusses whether China’s carbon emissions can reach a peak before 2030, and expounds on the corresponding conditions of the economy, population, urbanization, industrial structure, energy structure and energy intensity when carbon emissions reach their peak. In addition, it uses the super-efficiency DEA method to evaluate the efficiency of energy input and benefit output when China reaches the carbon peak. It also studies the questions of when and under what scenarios China’s carbon emissions will peak under different development scenarios. This study clarifies the corresponding situation of the economy, population, urbanization, industrial structure, energy structure and energy intensity at the time of carbon peak, selects the relatively most effective carbon peak path for China according to the evaluation of carbon efficiency, and proposes corresponding policy development suggestions. The purpose of this paper is to provide some theoretical reference for China to achieve the “dual carbon target”.
2. Methods and Data Sources
2.1. Calculation Method of Carbon Emissions
Carbon emissions are calculated according to IPCC (Intergovernmental Panel on Climate Change) Inventory Guidelines (2006). Combined with the existing research literature, this paper selects the consumption of eight common energy sources—raw coal, coke, crude oil, gasoline, kerosene, diesel, fuel oil and natural gas—to calculate China’s carbon emissions. The calculation formula is as follows:
where represents carbon emissions, and represent energy types, represents energy consumption, represents the energy conversion standard coal coefficient and represents the energy carbon emissions coefficient.
2.2. STIRPAT Model
In 1971, Ehrlich proposed the IPAT equation [40], which was used to study the impact of population, economy and technology on the environment and to reflect the impact of economic and social development on the environment. The equation is . In 1994, Dietz et al. extended the random model STIRPAT model to improve the shortcomings of the IPAT equation [41] and expanded the original equation. The introduction of the index makes up for the defects in the proportional variation in dependent variables in the IPAT equation, so that different factors can reflect their impact on the environment more flexibly. This model has been widely used in the study of carbon emission and its influencing factors and has obtained satisfactory simulation results. Therefore, this paper uses the STIRPAT model to forecast carbon emissions in China.
The basic equation form of the STIRPAT model is , where I represents environmental pressure and carbon emissions, P represents the population, A represents affluence and T represents the technology level. Because the STIRPAT model mainly studies environmental problems from the perspectives of population, technology and affluence, this paper makes a scientific expansion on this basis [14,15,16], and selects six influencing factors. The specific indicators and definitions are shown in Table 1.

Table 1.
Definition of carbon emission influencing factors and indicators.
As shown in Table 1, in the extended STIRPAT model, Pop and Urb are regarded as population factors, PG and IS as affluence factors and EI and ES as technical level factors. The expression is as follows:
In Formula (2), represents the model coefficient, represent the coefficient of each influence factor and represents the model error.
Because of the large gap between the original data, we take the logarithm of both sides of the equation to get Formula (3) to eliminate the influence of heteroscedasticity.
We fit the essential data of China from 2004 to 2020 and get the regression equation according to Formula (3) and then set different scenarios to predict and analyze the carbon emissions in China from 2021 to 2030.
2.3. Parameters Setting of Scenario Prediction
This paper uses the STIRPAT Model and scenario analysis to predict carbon emissions in China from 2021 to 2030 to study the influences of different factors on carbon emissions and explore suitable carbon peaking paths for China.
In order to set different scenarios, we divide the influencing factors into economic development variables and energy conservation and emission reduction variables; set the variables of economic development as rapid development and slow development, and set the variables of energy conservation and emission reduction as weak carbon control and intensified carbon control. The five scenarios are the baseline scenario, rapid development-weak carbon control scenario, rapid development-intensified carbon control scenario, slow development-intensified carbon control scenario and slow development-weak carbon control scenario, respectively.
2.3.1. Parameters Setting of Baseline Scenario
The baseline scenario (BS) is to predict future carbon emissions in China without too many constraints on energy conservation and emission reduction while maintaining the current economic development level. The significance of the BS is to study the trend in carbon emissions when we do not take further measures to save energy and reduce emissions. It is helpful to compare the carbon emissions under the emission reduction scenarios and to find the path to reach the carbon peak as soon as possible. The parameters of each influencing factor in the BS are set as follows.
- (1)
- Population
According to the National Population Development Plan of China, the total population of China was 1.42 billion in 2020 and will reach 1.45 billion in 2030. Meanwhile, considering the impact of the comprehensive implementation of the “two-child policy” in China [50], the average annual population growth rate is set at 5.60‰ from 2021 to 2030.
- (2)
- GDP
The national development plan only announces the development target of GDP, and GDP per capita is equal to the ratio of GDP to the total population. Therefore, this paper uses the GDP growth rate to calculate the change rate of GDP per capita. The “Outline of the 14th Five-Year Plan and Vision 2035 of China” has a qualitative description of economic growth. Authoritative institutions such as the China Energy Research Society and the World Bank also predict the economic development of China in the future. This paper sets the average annual GDP growth rate of 5.50% from 2021 to 2030 based on the national economic development plan and relevant research results [51,52].
- (3)
- Urbanization rate
The “Outline of the 14th Five-Year Plan and Vision 2035 of China” stated that China’s urbanization rate will rise to 65% during the period of the 14th Five-Year Plan. This paper sets the average annual growth rate of urbanization in China at 1.25% from 2021 to 2030 combined with Li’s prediction of China’s urban progress [53].
- (4)
- Industrial structure
The reform and opening up of China have promoted industrial development. The proportion of the added value of the secondary industry to GDP increased year by year, but this development soon caused serious environmental pollution. Since 2010, China has introduced several policies to adjust the industrial structure and carry out supply-side structural reform to reduce the negative impact of economic development on the environment. The “Outline of the 14th Five-Year Plan and Vision 2035 of China” pointed out that China will reduce the cost and burden of manufacturing, promote the structural upgrading of the secondary industry and focus on the development of high-tech service industries. The goal is to increase the proportion of the added value of strategic emerging industries to GDP by more than 17% before 2035. This paper sets the average annual growth rate of the proportion of the added value of the secondary industry to GDP at −1.15% from 2021 to 2030.
- (5)
- Energy intensity
Compared with the 13th Five-Year Plan, the 14th Five-Year Plan requires that energy consumption GDP per unit should be reduced by 13.5% in 2025, and energy consumption should be the same as that of the 13th Five-Year Plan. Combined with the research of Zhao (2022) [54], this paper sets the average annual growth rate of energy intensity at −2.50% from 2021 to 2030.
- (6)
- Energy structure
According to “the Action Plan for Carbon Dioxide Peaking Before 2030”, we need to optimize the energy structure, reduce the use of coal and other fossil fuels, promote the development of new energy sources, and improve energy efficiency. The 14th Five-Year Plan calls for non-fossil energy to account for 20% of total energy consumption by 2025. Therefore, this paper sets the annual growth rate of coal use in total energy consumption in 2021–2030 at −1.65%.
2.3.2. Parameters Setting of Rapid Development-Weak Carbon Control Scenario
The rapid development-weak carbon control scenario (RWS) refers to the prediction of carbon emissions in China by adjusting the industrial structure, energy intensity and energy structure while keeping the rates of change in population, economy and urbanization unchanged to promote carbon peak in China before 2030 by adjusting the industrial structure and energy structure, accelerating the development of science and technology, promoting industrial innovation and upgrading and improving energy efficiency.
The RWS only adjusts the growth rate of industrial structure, energy intensity and energy structure, while the population, economy and urbanization rate are the same as the BS. In order to achieve the carbon peak in China before 2030, combined with the research of Zhao (2022) [54] and Su et al. (2021) [55], this paper sets the average annual growth rate of the proportion of the added value of the secondary industry to GDP at −1.40% from 2021 to 2030, which is 0.25% lower than the BS. This paper sets the average annual growth rate of energy intensity at −2.70%, which is 0.2% lower than the BS and sets the annual mean growth rate of coal consumption in total energy consumption at −1.90%, which is 0.25% lower than the BS.
2.3.3. Parameters Setting of Rapid Development-Intensified Carbon Control Scenario
The rapid development-intensified carbon control scenario (RIS) refers to further adjusting the industrial structure, energy intensity and energy structure based on the RWS to predict China’s carbon emissions while keeping the rates of changes in population, economy and urbanization unchanged to promote carbon peak in China before 2030 by deepening the adjustment of industrial structure and energy structure, promoting the further development of science and technology, promoting industrial innovation and upgrading of energy consumption structure and increasing the amount of new energy consumption.
Under the RIS, the growth rates of industrial structure, energy intensity and energy structure are further adjusted based on the RWS. The change in parameters is the same size as that of the RWS and the BS, while the population, economy and urbanization rates are the same as the BS. Therefore, the annual mean growth rate of the proportion of the added value of the secondary industry to GDP, the annual mean growth rate of energy intensity and the average annual growth rate of coal consumption in total energy consumption from 2021 to 2030 are set at −1.65%, −2.90% and −2.15%, respectively.
2.3.4. Parameters Setting of Slow Development-Intensified Carbon Control Scenario
The slow development-intensified carbon control scenario (SIS) refers to only adjusting the rate of population, economy and urbanization to predict carbon emissions while controlling industrial structure, energy intensity and energy structure to be the same as the RIS. This scenario reflects that the implementation of energy conservation and emission reduction policies in China certainly will have an impact on economic and social development. Given that energy conservation and emission reduction will reduce the input of fossil energy, China’s industry will shift from secondary to tertiary industries. Therefore, in order to reach the carbon peak of China before 2030, the average annual growth rates of the population, economy and urbanization rate should be lowered appropriately.
Under the SIS, the average annual growth rates of industrial structure, energy intensity and energy structure are the same as that of the RIS. Combined with the existing literature [52,54], the economic development variable parameters are set to be 0.15% lower than the baseline scenario, so the average annual population growth rate, GDP growth rate and urbanization rate from 2021 to 2030 are set to be 4.2%, 5.35% and 1.10%, respectively.
2.3.5. Parameters Setting of Slow Development-Weak Carbon Control Scenario
The slow development-weak carbon control scenario (SWS) refers to the prediction of carbon emissions by adjusting the variables of economic development and energy conservation and emission reduction at the same time based on the BS. Under the SWS, the rates of population, economy and urbanization change are the same as those of the SIS, and the rates of industrial structure, energy intensity and energy structure change are the same as that of the RWS.
2.4. Super-Efficiency DEA Model
Carbon efficiency is an index used to evaluate the effectiveness of carbon emission controls. It represents the effectiveness of assessing carbon emissions with given energy input. The most commonly used method of efficiency evaluation is data envelopment analysis. DEA is a method proposed by Charnes et al. [56] in 1978 to measure the production efficiency of decision-making departments. DEA is a nonparametric frontier efficiency analysis method widely used for efficiency evaluation in many fields. The traditional DEA model may have a fully effective situation that the efficiency values are all 1 when measuring the efficiency, which is difficult to compare and rank. Therefore, in order to make the efficiency value break the limit of 1 and clearly distinguish the difference in carbon efficiency value under different scenarios, Andersen (1993) et al. [57] proposed the super-efficiency DEA model, which has better explanatory power. The super-efficiency DEA model is as follows:
In Formula (4), represents the efficiency value of the decision-making unit (DMU), and the value range is not limited to [0–1], the larger the value of , the higher the efficiency of input-output. and represent input variables and output variables. and represent relaxation variables of input and output, which indicate excessive input or insufficient output.
2.5. Data Sources
This paper takes the carbon emissions of China (including 30 provinces and municipalities of China, excluding Tibet, Hong Kong, Macao and Taiwan due to lack of data) as the research object, and covers the period from 2004 to 2020. All data in this study are from the statistical yearbook of the National Bureau of Statistics of China (http://www.stats.gov.cn/, accessed on 1 November 2022.).
3. Empirical Analysis
3.1. The Current Situation of Carbon Emissions
Carbon emissions in China have surpassed those of the United States since 2005 and became the highest in the world [58]. As shown in Table 2, which lists the carbon emissions of the top ten countries in 2020, carbon emissions in China account for the largest proportion, up to 30.93%, nearly one-third of the total global carbon emissions.
Table 2.
Proportion of carbon emissions in major countries in 2020.
China’s annual carbon emissions from energy consumption account for a large proportion of the total carbon emissions. According to the study by Li et al. [59], carbon emissions in China from energy consumption account for more than 70% of the total carbon emissions in the last ten years. Therefore, the carbon emissions studied in this paper are from energy consumption.
According to the calculation method of carbon emissions, carbon emissions in China from 2004 to 2020 are calculated based on the data on energy consumption, and the calculation results are shown in Figure 1.
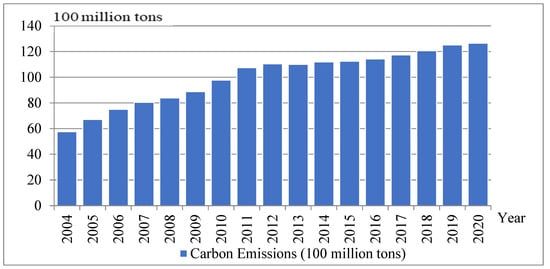
Figure 1.
China’s carbon emissions from 2004 to 2020.
As can be seen from Figure 1, China’s carbon emissions have been increasing year on year since 2004. The growth rate of carbon emissions during 2004–2012 was relatively high, especially in 2010 and 2011, with an annual growth rate of 10.10% and 9.91%, respectively. From 2012 to 2015, carbon emissions were stable, and the growth rate of carbon emissions showed a certain level of stability after 2015. The result is similar to most studies. The growth rate of carbon emissions in China has slowed down since 2012. The main reason is the adoption of the 12th Five-Year Plan for Controlling Greenhouse Gas Emissions in 2011, which brought the growth in carbon emissions in China under control.
3.2. Scenario Prediction and Analysis of Carbon Emissions
Based on the data of China from 2004 to 2020, we use the STIRPAT Model to predict carbon emissions in China from 2021 to 2030 and analyze the results of the prediction. This paper sets up five scenarios: BS, RWS, RIS, SIS and SW.
3.2.1. Influencing Factors of Carbon Emissions
- (1)
- The fitting regression process of the STIRPAT model
The results of fitting regression were analyzed according to the STIRPAT model, and the specific results are shown in Table 3. It is found that the variance inflation factor (VIF) value is mostly greater than 10, which indicated that the model had serious multicollinearity.
Table 3.
Multicollinearity results.
In order to eliminate the influence of multicollinearity, ridge regression was considered for fitting regression, in which the ridge regression parameter K value was set to 0.01, and the ridge regression results are shown in Table 4. It can be seen from the table that the value of R2 is close to 1, and the coefficients of all factors are basically significant, indicating that the regression results of the model have good explanatory power.
Table 4.
Influencing factor coefficient of carbon emissions in China.
- (2)
- Regression analysis of influencing factors
According to the in-depth analysis in Table 4, these influencing factors all have a positive impact on carbon emissions. The contribution degrees from the largest to the smallest are urbanization rate, population, industrial structure, economic development level, energy structure and energy intensity, respectively.
The change in urbanization rate has the greatest impact on carbon emissions, and the regression coefficient of the urbanization rate is 1.263, and the contribution of the urbanization rate to carbon emissions is 36%. With the continuous promotion of urbanization in China, the urbanization rate rose from 40.89% in 2004 to 59.87% in 2020, with the urban population accounting for more than half of the total population. The advantage of urbanization development is that it can improve the level of science and technology and energy utilization efficiency; the disadvantage is that it will increase the demand for urbanization infrastructure and energy consumption. The disadvantages brought by urbanization development are greater than the advantages in the short term. The urbanization process will promote further growth in carbon emissions.
The regression coefficient of population is 0.960, and the contribution degree is 27.36%. The total population of China will increase from 1.287 billion in 2004 to 1.42 billion in 2020, showing a continuous growth state, with an average annual growth of 8.31 million people. The increase in population will increase the demand for energy consumption and thus increase carbon emissions. Meanwhile, the increase in population will also bring about improvements in science and technology, which will slow down the growth rate of carbon emissions in the future.
The regression coefficient of industrial structure is 0.887, and the contribution degree is 25.29%. In 2004, the proportion of added value of secondary industry to GDP in China accounted for 46.67%, which increased to 48.55% from 2004 to 2008, and remained stable from 2009 to 2011. Then, due to the 12th Five-Year Plan, which proposed the implementation of the industrial structure adjustment and upgrading strategy in 2011, the proportion of added value of secondary industry to GDP in China continued to decrease from 2011 to 2020, dropping to 38.40% by 2020. The development of secondary industry needs a large amount of energy consumption and will accompany by a large amount of carbon emissions at the same time. Therefore, the upgrading of industrial structures is of great significance for carbon emission reduction.
GDP per capita is used to reflect the economic development level in China, with a regression coefficient of 0.223 and a contribution rate of 6.36% to carbon emissions. The GDP per capita of China increased from 12,603 Yuan in 2004 to 73,219 Yuan in 2020, with an average annual growth rate of 30.06%, indicating that the economic level of China has grown rapidly in recent decades, and the improvement of economic level will also increase carbon emissions.
Energy structure and energy intensity are both factors related to energy consumption, with a small contribution to carbon emissions. As early as 2006, the 11th Five-Year Plan put forward the policy of “energy conservation and emission reduction”. Since then, the government has introduced various energy conservation and emission reduction policies successively. The implementation of the policies has reduced the consumption of fossil energy and improved the efficiency of energy utilization. The energy structure and energy intensity have decreased year by year after 2011, thus inhibiting a certain amount of carbon emissions.
3.2.2. Scenario Prediction and Analysis
According to the parameters setting of five scenarios, the carbon emissions in China during 2021–2030 were predicted, and then the carbon peak was analyzed. Based on the basic data of China from 2004 to 2020, the model error analysis of carbon emission prediction was carried out to reflect the prediction ability of the model. As shown in Figure 2, the error between the predicted value and the real value in the future periods (Fp) is always within 5%, indicating that the model has good prediction ability and can be used to predict carbon emissions in China.
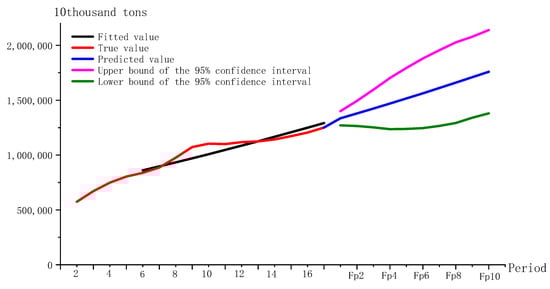
Figure 2.
Error analysis of carbon emission prediction models.
According to the prediction results, the trend in carbon emissions in China from 2021 to 2030 under five scenarios is shown in Figure 3. Under the BS, carbon emissions in China will increase year by year, rising from 12.639 billion tons in 2021 to 14.540 billion tons in 2030, with an average annual growth rate of 1.67%. While the average annual growth rate of carbon emissions from 2015 to 2020 will be 2.51%, which is significantly higher than the predicted annual growth rate. In comparison, although carbon emissions in China did not reach the peak before 2030 under the BS, the growth trend in carbon emissions is gradually slowing down, indicating that the current development plan plays a certain role in energy conservation and emission reduction. Therefore, in order to achieve the goal of “carbon peaking by 2030” as soon as possible, the government needs to further strengthen the improvement and implementation of relevant policies for energy conservation and emission reduction.
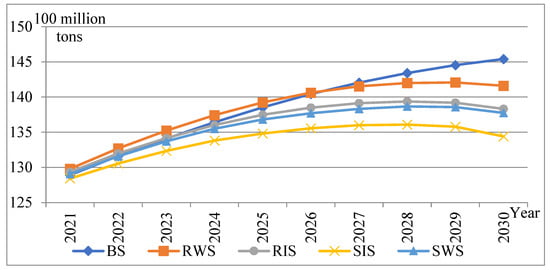
Figure 3.
Predicted carbon emissions in China in 2021–2030.
Under the RWS, carbon emissions in China from 2021 to 2030 will peak in 2029 with a peak of 14.207 billion tons, an increase of 1.568 billion tons compared with 2020, and the average annual growth rate of carbon emissions from 2021 to 2029 will be 1.55%. Under this scenario, China’s total carbon emissions in 2029 are 246 million tons less than that in the BS, indicating that the implementation of weak low-carbon policies has a certain effect on the reduction of total carbon emissions.
Under the RIS, China will reach the peak of carbon emissions in 2028, with a peak value of 13.938 billion tons, 269 million tons lower than the peak value under the RWS, and the average annual growth rate of carbon emissions from 2021 to 2028 will be 1.47%. Compared with the BS and the RWS, both the growth rate and amount of carbon emissions have decreased, which indicates that a strict low-carbon policy can reduce carbon emissions and its annual growth rate effectively.
Under the SIS, China will reach carbon peak in 2028 with a peak value of 13.608 billion tons, 329 million tons lower than that under the RIS. The average annual growth rate of carbon emissions from 2021 to 2028 will be 1.10%, lower than the three scenarios above. This shows that adjusting the variables of economic development and energy saving and emission reduction not only can promote the realization of the carbon peak goal earlier in theory, but also can reduce the total carbon emissions and growth rate to a greater extent.
Under the SWS, China will reach carbon peak in 2028 with a peak value of 13.866 billion tons, 258 million tons higher than the peak under the SIS, and 341 million tons lower than the peak under the RWS. This indicates that under the same economic and social development conditions, the implementation of more stringent emission reduction policies can reduce carbon emissions effectively. When implementing the same emission reduction policy, the lower the level of economic and social development, the lower the amount of carbon emissions produced. The average annual growth rate of carbon emissions from 2021 to 2028 will be 1.39%, with the growth rate and amount decreasing compared with the BS, RWS and RIS, but increasing compared with the SIS.
To sum up, under the BS, that is, under the current level of economic and social development and the implementation of relevant policies, China cannot reach the carbon peak before 2030, and the carbon emissions will be 14.540 billion tons in 2030. By adjusting the growth rate of economic development variables and energy conservation and emission reduction variables, respectively, carbon emissions in China from 2021 to 2030 are predicted as follows: under the four regulatory scenarios, China can reach the carbon peak before 2030. The four scenarios are ranked from the largest to the smallest according to the peak value, which are RWS, RIS, SWS and SIS, respectively. The corresponding dates the peak is reached are 2029, 2028, 2028 and 2028, respectively, and the corresponding peak values are 14.207 million tons, 13.938 million tons, 13.866 million tons and 13.612 million tons respectively. This indicates that under the current economic and social development speed level, China should slow down the growth rate of economic development variables, while implementing strict energy conservation and emission reduction policies to reduce carbon emissions and its growth rate effectively.
3.3. Calculation and Analysis of Carbon Efficiency
This paper regards population and energy consumption as input variables, GDP as a desired output, and carbon emissions as an undesirable output. According to the input and output, we measure the carbon efficiency of the peak year of carbon emissions under the regulatory scenarios. Based on the indexes of influencing factors and the predicted value of carbon emissions under four regulatory scenarios, the carbon efficiency of carbon peaking was measured by the super-efficiency DEA model. The values of carbon efficiency are shown in Table 5.
Table 5.
Carbon efficiency values under carbon peaking.
According to the analysis in Table 5, China has the highest carbon efficiency value of 0.4844 under the scenario of high development and low carbon. Although the absolute value of efficiency is not high, it has reached the relative optimal value compared with the other three regulatory scenarios. Under the four regulatory scenarios, carbon efficiency values from high to low under the carbon peak are ranked from high to low as RWS, RIS, SWS and SIS, respectively.
From the perspective of economic and social development, the carbon efficiency value under the rapid development mode is always higher than that under the slow development mode, indicating that rapid growth in population, GDP and urbanization rates can improve the carbon efficiency without adopting energy conservation and emission reduction policies and measures. From the perspective of energy conservation and emission reduction, the value of carbon efficiency under weak carbon control mode is always higher than that under intensified carbon control mode. The reason is that China is in a period of rapid industrialization. At present, the improvement in China’s economic development level and comprehensive strength mainly relies on secondary industry, so excessive industrial structure transformation cannot be carried out blindly to reduce carbon emissions. At the same time, the energy consumption structure of China is mainly coal, and a fundamental transformation cannot be achieved in the short term. Therefore, it is more conducive to the long-term development of China’s carbon emission reduction to adopt appropriate energy-saving policies and measures without considering the changes in population, GDP and urbanization rate.
Under the SIS, the carbon efficiency value at the carbon peak is the lowest, (0.4664). This indicates that when economic and social development growth is slow, the government should adopt strict carbon emission reduction measures to promote the rapid transformation of industrial structure and energy consumption structure. Although this can greatly reduce carbon emissions, this kind of development mode is not good for future long-term development in China.
According to the carbon emission peak under each scenario, it is found that a smaller peak value does not necessarily correspond with higher carbon efficiency. On the contrary, the value of carbon efficiency is directly proportional to the peak of carbon emissions, which means that the RWS is a relatively effective path for China to reach the carbon peak before 2030, while the SIS is the least desirable path for reaching a carbon peak.
4. Discussion
As a large country in terms of population and energy consumption, China has the highest carbon dioxide emissions in the world, and the massive emissions of carbon dioxide and other greenhouse gases are one of the main causes of global warming. Therefore, the prediction and path selection of carbon peak are of positive significance for curbing global warming and restoring the balance of the natural ecosystem.
This paper uses the super-efficiency DEA model to select the carbon peaking path for the first time. On the basis of scenario prediction and analysis of carbon peaking using the STIRPAT model, the effectiveness of resource input and benefit output were considered. Combined with the carbon efficiency index calculated by the super-efficiency DEA model, we evaluated the carbon emission reduction potential under different forecast scenarios and selected the relatively most effective carbon emission peak path.
However, in this paper, the factors of emergency are not taken into account, which has some limitations. For example, the COVID-19 pandemic, which began in Wuhan, China, has caused a large number of deaths worldwide. In response to the rapid spread of SARS-CoV-2 in their populations, countries have imposed spatial restrictions on movement and social distancing [60]. In addition, pandemic containment measures reduce the use of transportation vehicles to a certain extent, so carbon emissions in transportation and carbon emissions produced by transportation vehicles are reduced to a certain extent. The number of vehicles in use will also have a positive impact on the price, efficiency and market value of these companies [61]. If the impact of pandemic containment on carbon emissions from transportation and transportation production is taken into account in the prediction of carbon emissions in subsequent studies, China’s carbon emissions and carbon peaking path can be predicted more accurately, which can provide a theoretical basis for policies and technological development to curb global warming.
5. Conclusions and Policy Implication
5.1. Conclusions
This paper analyzes the carbon emissions from 2004 to 2020 in China and predicts the carbon emissions using a combined STIRPAT Model and scenario analysis method to analyze the peak scenario from 2021 to 2030 in China. Then, it uses the super-efficiency DEA model to measure the carbon efficiency when reaching the carbon peak under different scenarios, which fills the research gap of the combination of carbon efficiency and carbon peak prediction. Finally, it selects a relatively effective carbon peak path through comparative analysis. The main empirical conclusions show that:
- (1)
- Through the analysis of China’s carbon emissions from 2004 to 2020, it is found that carbon emissions are increasing year by year. Based on this scenario, combined with the STIRPAT model, carbon dioxide emissions from 2021 to 2030 are predicted. It can be concluded that under the baseline scenario, China’s carbon emissions will show nonlinear growth year by year, and the carbon peak before 2030 will not be achieved.
- (2)
- Combining the STIRPAT Model with scenario analysis, we set up four regulatory scenarios to predict carbon emissions from 2021 to 2030. It was found that under the four regulatory scenarios, the carbon peak values from high to low are RWS, RIS, SWS and SIS, respectively. The corresponding times that carbon peak is reached are 2029, 2028, 2028 and 2028, respectively, and the corresponding peak values are 14.207 million tons, 13.938 million tons, 13.866 million tons and 13.612 million tons, respectively. This shows that under the current level of economic and social development, appropriately slowing down the growth rate of economic development variables while implementing strict energy-saving and emission reduction policies can effectively reduce the total amount and growth rate of carbon dioxide emission in China.
- (3)
- The super-efficiency DEA model is used to calculate the carbon efficiency of China when carbon emissions reach their peak, which reflects the effectiveness of input and output. Under RWS, China’s carbon efficiency has the highest value at 0.4844, while under SIS, it is the lowest. That means that RWS is the relatively most efficient path for China to achieve the “carbon peak by 2030”. China needs to properly regulate its industrial structure, energy intensity and energy structure while keeping the growth rate of population, economy and urbanization level unchanged.
5.2. Policy Implication
Based on the selection of the carbon peak path and the above conclusions, we put forward targeted suggestions for China to achieve the carbon peak.
- (1)
- Promote economy, population and urbanization growing steadily
According to the carbon emission prediction results, under the baseline scenario, China cannot reach the carbon peak before 2030; while under the regulatory scenarios, China can reach the carbon peak before 2030. This shows that China needs to strengthen the implementation of carbon reduction policies to achieve the carbon peak before 2030. According to the measurement results of carbon efficiency, this parameter has the highest efficiency value under the RWS model, which means that the RWS model is the relatively most effective path to realizing carbon peak before 2030. Therefore, we should follow the economy, population and urbanization development requirements from the 14th Five-Year Plan and strive to get closer to the RWS. We should accelerate high-quality economic development, seek a balance between economic development and carbon emissions, stabilize population growth and promote urbanization.
- (2)
- Accelerate the transformation and upgrading of the industrial structure
Under the condition of maintaining the current development level of the economy, population and urbanization, we should appropriately enhance the speed of industrial upgrading and improve the energy efficiency of traditional enterprises to enhance carbon efficiency. The government should actively guide funds to invest in new green enterprises, and integrate the secondary industry with artificial intelligence and modern big data technology. It should promote the digital development of new industries, and take the lead in promoting the development of tertiary industries with low energy consumption. China should speed up the upgrading of traditional enterprises with high energy consumption and low output, and significantly reduce the proportion of traditional enterprises. It should introduce more developed advanced technology and equipment actively, and accelerate the development of advanced manufacturing and high-tech industries.
- (3)
- Build a new energy utilization system
In terms of energy, we should reduce the use of fossil fuels and other non-renewable energy sources while increasing the use of clean and renewable energy sources. The regions with relatively fast economic and technological development should give full play to their advantages. We should develop new energy technologies actively to lead the development of backward areas in western China and promote the improvement of energy utilization efficiency and carbon efficiency. We should establish a healthy new energy consumption market, and promote the research and development of new energy products and market expansion. At the same time, the national government should encourage resource sharing among regions and promote technology sharing between technologically advanced and backward provinces. That can improve energy efficiency, enhance industrial upgrading of energy-consuming enterprises, improve the secondary utilization rate of carbon dioxide, and, finally, achieve a nationwide carbon peak.
Author Contributions
Conception, X.W. and X.M.; methodology, X.L. and X.W.; model validation, X.L.; data resources, X.L. and X.M.; data analysis, X.L. and X.W.; writing—original draft preparation, X.L. and X.W.; writing—review and editing, X.L., X.W. and X.M.; supervision, X.W. and X.M. All authors have read and agreed to the published version of the manuscript.
Funding
This research was supported by the National Natural Science Foundation of China (51874003, 51474007), Academic Funding Projects for Top Talents in Disciplines and Majors of An-hui (gxbizD2021051).
Data Availability Statement
Not applicable.
Acknowledgments
The authors are very grateful to the reviewers for carefully reading the manuscript and providing valuable suggestions.
Conflicts of Interest
The authors declare no conflict of interest.
References
- Li, A.J.; Zhang, A.Z.; Zhou, Y.X.; Yao, X. Decomposition analysis of factors affecting carbon dioxide emissions across provinces in China. J. Clean. Prod. 2017, 141, 1428–1444. [Google Scholar] [CrossRef]
- Chai, Q.M.; Xu, H.Q. Modeling an emissions peak in China around 2030: Synergies or trade-offs between economy, energy and climate security. Adv. Clim. Chang. Res. 2014, 5, 169–180. [Google Scholar] [CrossRef]
- He, J.K. An analysis of China’s CO2 emission peaking target and pathways. Adv. Clim. Chang. Res. 2014, 5, 155–161. [Google Scholar] [CrossRef]
- Zhou, N.; Fridley, D.; Khanna, N.Z.; Ke, J.; McNeil, M.; Levine, M. China’s energy and emissions outlook to 2050: Perspectives from bottom-up energy end-use model. Energy Policy. 2013, 53, 51–62. [Google Scholar] [CrossRef]
- Li, F.; Xu, Z.; Ma, H. Can China achieve its CO2 emissions peak by 2030? Ecol. Indic. 2018, 84, 337–344. [Google Scholar] [CrossRef]
- Zheng, H.T.; Hu, J.; Wang, T. When Will 100 Chinese Cities Reach Peak Carbon? China Popul. Resour. Environ. 2016, 26, 48–54. [Google Scholar] [CrossRef]
- Wang, Y.; Xu, Z.Y. Influencing factors and combined scenario prediction of carbon emission peaks in megacities in China: Based on Threshold-STIRPAT Model. Acta Sci. Circumstantiae 2019, 39, 4284–4292. [Google Scholar]
- Tavakoli, A. A journey among top ten emitter country, decomposition of “Kaya Identity”. Sustain. Cities Soc. 2018, 38, 254–264. [Google Scholar] [CrossRef]
- Mi, Z.; Wei, Y.-M.; Wang, B.; Meng, J.; Liu, Z.; Shan, Y.; Liu, J.; Guan, D. Socioeconomic impact assessment of China’s CO2 emissions peak prior to 2030. J. Clean. Prod. 2017, 142, 2227–2236. [Google Scholar] [CrossRef]
- Lin, B.Q.; Yao, X.; Liu, X.Y. China’s energy strategy adjustment under energy conservation and carbon emission constraints. Soc. Sci. China 2010, 31, 91–110. [Google Scholar] [CrossRef]
- Ma, D.; Chen, W.Y. Analysis of China’s 2030 Carbon Emission Peak Level and Peak Path. China Popul. Resour. Environ. 2016, 26 (Suppl. S1), 1–4. [Google Scholar]
- Yu, B.; Zhao, G.; An, R.; Chen, J.; Tan, J.; Li, X. Research on China’s CO2 Emission Pathway under Carbon Neutral Target. J. Beijing Inst. of Technol. (Soc. Sci. Ed.) 2021, 23, 17–24. [Google Scholar] [CrossRef]
- Wang, D.; He, W.; Nie, R. Scene prediction of carbon emission peak and emission reduction potential estimation in Chinese industry. China Popul. Resour. Environ. 2017, 27, 131–140. [Google Scholar] [CrossRef]
- Qu, S.N.; Guo, C.X. Forecast of China’s carbon emissions based on STIRPAT model. China Popul. Resour. Environ. 2010, 20, 10–15. [Google Scholar] [CrossRef]
- Zhang, Z.; Ren, Y.M.; Dong, H. Research on carbon emission peaking and low-carbon development of cities: A case of Shanghai. Environ. Eng. 2020, 38, 12–18. [Google Scholar] [CrossRef]
- Niu, L.; Zhang, L.X.; Xi, F.M.; Wang, J.Y. Influencing factors and scenario forecasting of carbon emissions in Liaoning Province, China. Chin. J. Appl. Ecol. 2023, 34, 499–509. [Google Scholar] [CrossRef]
- Deng, X.L.; Sun, H. Forecast of the Northwest Five Provinces’ Carbon Emissions Based on STIRPAT Model. Ecol. Econ. 2016, 32, 36–41. [Google Scholar] [CrossRef]
- Deng, M.X.; Li, W. Scenario analysis of the supply-side structural reform influences on industrial carbon emissions based on LEAP model in Yunnan province. China Environ. Sci. 2017, 37, 786–794. [Google Scholar] [CrossRef]
- Wang, C.C.; Wang, Y.; Zhu, X.D. Peak volume and time of energy-related CO2 emissions in Jiangsu Province, China based on long-range energy alternatives planning system model. Chin. J. Appl. Ecol. 2019, 30, 3535–3543. [Google Scholar] [CrossRef]
- Song, P.; Zhang, H.; Mao, X. Research on Chongqing’s carbon emission reduction path towards the goal of carbon peak. China Environ. Sci. 2022, 42, 1446–1455. [Google Scholar] [CrossRef]
- Zhou, J.; Mao, X.; Hu, T.; Zeng, A.; Xing, Y.; Corsetti, G. Implications of the 11th and 12th Five-Year Plans for energy conservation and CO2 and air pollutants reduction: A case study from the city of Urumqi, China. J. Clean. Prod. 2016, 112, 1767–1777. [Google Scholar] [CrossRef]
- Qiu, G.F.; Cai, Z.M. Research on Carbon Emission Prediction in Shaanxi Province Based on Rough Set and Neural Network Method. Ecol. Econ. 2019, 35, 25–30. [Google Scholar]
- Gao, J.; Wang, J.W.; Li, L.N. A combined model of Richards model and BP neural network to predict transportation carbon emission. J. Chang’an Univ. (Nat. Sci. Ed.) 2013, 33, 99–104. [Google Scholar] [CrossRef]
- Gao, J.; Wang, J.W.; Li, L.N. Research on the prediction and control factors of peaking industrial carbon emissions in China: An empirical analysis based on BP-LSTM neural network mode. Guizhou Soc. Sci. 2021, 09, 135–146. [Google Scholar] [CrossRef]
- Liu, Q.; Lei, Q.; Xu, H.; Yuan, J. China’s energy revolution strategy into 2030. Resour. Conserv. Recycl. 2018, 128, 78–89. [Google Scholar] [CrossRef]
- Li, X.M.; Zhang, Q. Factors Affecting Carbon Emission from Energy Consumption in Tianjin. Arid Zone Res. 2019, 36, 997–1004. [Google Scholar] [CrossRef]
- Wang, L.B.; Zhang, Y. Factors Decomposition and Scenario Prediction of Energy-Related CO2 Emissions in China. Electric Power Construction 2021, 42, 1–9. [Google Scholar] [CrossRef]
- Feng ZH AN, G.; Hong-Yun, M.A.; Jing-Hua SH, A. A prediction of China’s 2020 copper demand based on scenario analysis. Nat. Resour. Econ. China 2012, 14, 30–35. [Google Scholar] [CrossRef]
- Liu, Y.W.; Hu, Z.Y. Research on Regional Difference about Carbon Emission Efficiency in China—Based on Three Stage DEA Model and Super Efficiency DEA Model. J. Shanxi Univ. Financ. Econ. 2015, 37, 23–34. [Google Scholar]
- Wang, Y.; Jia, W.; Bi, Y. Provincial decomposition of China’s 2030 carbon dioxide emission peak target from the perspective of efficiency: Research on the zero sum gains DEA model. Acta Sci. Circumstantiae 2017, 37, 4399–4408. [Google Scholar] [CrossRef]
- Li, J.K.; Ma, J.J.; Wei, W. Study on Regional Differences of Energy Carbon Emission Efficiency in Eight Economic Areas of China. J. Quant. Technol. Econ. 2020, 37, 109–129. [Google Scholar] [CrossRef]
- Fang, J.C.; Tong, Y.; Lu, Z. Fiscal decentralization, energy price fluctuations and carbon emission efficiency. Chongqing Soc. Sci. 2021, 7, 5–17. [Google Scholar] [CrossRef]
- Zhou, P.; Sun, Z.R.; Zhou, D.Q. Optimal path for controlling CO2 emissions in China: A perspective of efficiency analysis. Energy Econ. 2014, 45, 99–110. [Google Scholar] [CrossRef]
- Miao, Z.; Geng, Y.; Sheng, J. Efficient allocation of CO2 emissions in China: A zero sum gains data envelopment model. J. Clean. Prod. 2016, 112 Pt 5, 4144–4150. [Google Scholar] [CrossRef]
- Feng, C.; Huang, J.B. Carbon Emission Efficiency, Reduction Potential and Its Implementing Path in China. J. Shanxi Univ. Financ. Econ. 2016, 38, 1–12. [Google Scholar] [CrossRef]
- Feng, D.; Li, J. Research of the carbon dioxide emission efficiency and reduction potential of cities in the Beijing-Tianjin-Hebei Region. Resour. Sci. 2017, 39, 978–986. [Google Scholar] [CrossRef]
- Jiang, W.Y.; Zeng, Z.X.; Zhang, Z.Y. China’s Industrial and Agricultural Carbon Emission Efficiency and Reduction Potential Considering the Water-Land-Energy-Carbon Nexus. Chin. J. Environ. Manag. 2020, 12, 120–129. [Google Scholar] [CrossRef]
- Zhang, N.; Zhao, Y. Can China Achieve Peak Carbon Emissions and Carbon Neutrality: An Analysis Based on Efficiency and Emission Reduction Cost at the City Level. J. Lanzhou Univ. (Soc. Sci.) 2021, 49, 13–22. [Google Scholar] [CrossRef]
- Zhou, D.; Wu, Z.W. Potentialities and paths of Chinese industrial carbon emission reduction. China Environ. Sci. 2019, 39, 1306–1314. [Google Scholar] [CrossRef]
- Ehrlich, P.R.; Holdren, J.P. Impact of Population Growth: Complacency concerning this component of man’s predicament is unjustified and counterproductive. Science 1971, 171, 1212–1217. [Google Scholar] [CrossRef]
- Dietz, T.; Rosa, E.A. Rethinking the environmental impacts of population, Affluence and technology. Human Ecol. Rev. 1994, 1, 277–300. Available online: https://www.jstor.org/stable/24706840 (accessed on 6 November 2022.).
- Tang, S.; Fu, J.W.; Wu, J.L. Analysis of influencing factors of carbon emission in typical Chinese cities. Stat. Decis. 2021, 37, 59–63. [Google Scholar] [CrossRef]
- Liu, Y.X.; Deng, X.R. An Empirical Study on the Influencing Factors of Carbon Emission in China: Based on Fixed Effect Panel Quantile Regression Model. J. Shanxi Univ. (Phil. Soc. Sci. Ed.) 2021, 44, 86–96. [Google Scholar] [CrossRef]
- Zhang, Q.; Zhang, Y.; Pan, B. Analysis of factors affecting China’s economic growth and carbon emissions during the 40 years of reform and opening. J. Arid Land Resour. Environ. 2019, 33, 9–13. [Google Scholar] [CrossRef]
- Meng, Z.; Wang, H.; Wang, B. Empirical analysis of carbon emission accounting and influencing factors of energy consumption in China. Int. J. Environ. Res. Public Health 2018, 15, 2467. [Google Scholar] [CrossRef]
- Li, W.; Sun, W.; Li, G.; Jin, B.; Wu, W.; Cui, P.; Zhao, G. Transmission mechanism between energy prices and carbon emissions using geographically weighted regression. Energy Policy 2018, 115, 434–442. [Google Scholar] [CrossRef]
- Xuan, D.; Ma, X.; Shang, Y. Can China’s policy of carbon emission trading promote carbon emission reduction? J. Clean. Prod. 2020, 270, 122383. [Google Scholar] [CrossRef]
- Zhang, W.; Yang, Y. Impact analysis of energy-related carbon emission in Chongqing based on logarithmic mean division index. Environ. Prog. Sustain. Energy 2022, 41, e13724. [Google Scholar] [CrossRef]
- Wei, L.; Feng, X.; Jia, G. Construction and application analysis of carbon emission influence factor model of energy consumption in mining industry. Adv. Civil Eng. 2021, 2021, 2879392. [Google Scholar] [CrossRef]
- Zhang, F.; Deng, X.; Xie, L.; Xu, N. China’s energy-related carbon emissions projections for the shared socioeconomic pathways. Resour. Conserv. Recycl. 2021, 168, 105456. [Google Scholar] [CrossRef]
- Liu, C.; Xie, W.; Lao, T.; Yao, Y.-T.; Zhang, J. Application of a novel grey forecasting model with time power term to predict China’s GDP. Grey Syst. Theory Appl. 2020, 11, 343–357. [Google Scholar] [CrossRef]
- Liu, W.; Jiang, W.; Tang, Z.; Han, M. Pathways to peak carbon emissions in China by 2030: An analysis in relation to the economic growth rate. Sci. China Earth Sci. 2022, 65, 1057–1072. [Google Scholar] [CrossRef]
- Li, W.; Zhang, S.; Lu, C. Exploration of China’s net CO2 emissions evolutionary pathways by 2060 in the context of carbon neutrality. Sci. Total Environ. 2022, 831, 154909. [Google Scholar] [CrossRef] [PubMed]
- Zhao, H.; Hu, J.; Hao, F.; Zhang, H. Determinants of Carbon Dioxide Emissions and Their Peaking Prospect: Evidence From China. Front. Environ. Sci. 2022, 10, 695. [Google Scholar] [CrossRef]
- Su, Y.; Liu, X.; Ji, J.; Ma, X. Role of economic structural change in the peaking of China’s CO2 emissions: An input–output optimization model. Sci. Total Environ. 2021, 761, 143306. [Google Scholar] [CrossRef]
- Charnes, A.; Cooper, W.W.; Rhodes, E. Measuring the efficiency of decision making units. Eur. J. Oper. Res. 1978, 2, 429–444. [Google Scholar] [CrossRef]
- Andersen, P.; Petersen, N.C. A Procedure for Ranking Efficient Units in Data Envelopment Analysis. Manag. Sci. 1993, 39, 1261–1294. [Google Scholar] [CrossRef]
- Zhang, J.Y.; Song, M.; Liu, B.E. Current Situation of Carbon Dioxide Emission and Suggestions for Emission Reduction in China. Nat. Res. Econ. China 2022, 35, 38–44. [Google Scholar] [CrossRef]
- Li, J.F.; Guo, J.F.; Gao, S.J.; Gu, A.L. Current Status, Issues and Challenges of The National Carbon Emission Accounting Work. Development Res. 2020, 9–14. [Google Scholar] [CrossRef]
- Sadowski, A.; Galar, Z.; Walasek, R.; Zimon, G.; Engelseth, P. Big data insight on global mobility during the Covid-19 pandemic lockdown. J. Big Data 2021, 8, 78. [Google Scholar] [CrossRef]
- Salehi, M.; Fahimifard, S.H.; Zimon, G.; Bujak, A.; Sadowski, A. The Effect of CO2 Gas Emissions on the Market Value, Price and Shares Returns. Energies 2022, 15, 9221. [Google Scholar] [CrossRef]


Disclaimer/Publisher’s Note: The statements, opinions and data contained in all publications are solely those of the individual author(s) and contributor(s) and not of MDPI and/or the editor(s). MDPI and/or the editor(s) disclaim responsibility for any injury to people or property resulting from any ideas, methods, instructions or products referred to in the content. |
© 2023 by the authors. Licensee MDPI, Basel, Switzerland. This article is an open access article distributed under the terms and conditions of the Creative Commons Attribution (CC BY) license (https://creativecommons.org/licenses/by/4.0/).