Article

Optimization of CO2 Huff-n-Puff in Unconventional Reservoirs with a Focus on Pore Confinement Effects, Fluid Types, and Completion Parameters

The Jasper Department of Chemical Engineering, The University of Texas at Tyler, Tyler, TX 75799, USA
*
Author to whom correspondence should be addressed.
Energies 2023, 16(5), 2311; https://doi.org/10.3390/en16052311
Submission received: 19 January 2023 / Revised: 24 February 2023 / Accepted: 25 February 2023 / Published: 28 February 2023

Abstract

:
The cyclic injection of CO2, referred to as the huff-n-puff (HnP) method, is an attractive option to improve oil recovery from unconventional reservoirs. This study evaluates the optimization of the CO2 HnP method and provides insight into the aspects of CO2 sequestration for unconventional reservoirs. Furthermore, this study also examines the impact of nanopore confinement, fluid composition, injection solvent, diffusivity parameters, and fracture properties on the long-term recovery factor. The results from over 500 independent simulations showed that the optimal recovery is obtained for the puff-to-huff ratio of around 2.73 with a soak period of fewer than 2.7 days. After numerous HnP cycles, an optimized CO2 HnP process resulted in about 970-to-1067-ton CO2 storage per fracture and over 32% recovery, compared to 22% recovery for natural depletion over the 30 years. The optimized CO2 HnP process also showed higher effectiveness compared to the N2 HnP scenario. Additionally, for reservoirs with significant pore confinement (pore size ≤ 10 nm), the oil recovery improved by over 3% compared to the unconfined bulk phase properties. We also observed over 300% improvement in recovery factor for a fluid with a significant fraction of light hydrocarbons (C1–C6), compared to just a 50% improvement in recovery for a fluid with a substantial fraction of heavy hydrocarbons (C7+). Finally, the results also showed that fracture properties are much more important for CO2 HnP than natural depletion. This study provides critical insights to optimize and improve CO2 HnP operations for different fluid phases and fracture properties encountered in unconventional reservoirs.

1. Introduction

The global oil demand is expected to grow from 97 million barrels per day in 2021 to 120 million barrels per day by 2050, according to estimates from the US EIA [1]. This increase in global energy demand will be mainly supported by developing unconventional reservoirs, made possible due to technological advancements in horizontal drilling and hydraulic fracturing. Horizontal wells and hydraulic fractures increase the effective permeability of the tight reservoirs, resulting in improved productivity from previously uneconomic formations. However, unconventional reservoirs suffer from rapid production decline despite technological improvements. The primary recovery only accounts for less than 10% of oil in place [2,3]. Approximately 90% of reserves remain in the reservoirs by the end of primary depletion [4], making them good candidates for enhanced oil recovery (EOR). For instance, an estimated 1.6–9 billion barrels of oil can be recovered from the Bakken reservoir with a 1% improvement in the oil recovery factor [5]. Water flooding is generally the preferred choice for enhanced oil recovery after the primary depletion of conventional reservoirs. However, water flooding is not the best option for unconventional reservoirs due to the low injectivity caused by ultra-low permeability. Water flooding in unconventional reservoirs may also lead to clay swelling, further degrading the formation permeability. In addition, poor sweep efficiency in induced fracture networks makes waterflooding unsuitable for unconventional reservoirs [6,7]. EOR through CO2 injection, first commercially used in 1972 in West Texas, is more suitable for low permeability reservoirs due to its various advantages over other EOR techniques. Although the injection of other gases, such as nitrogen (N2), and lean and intermediate-weight hydrocarbons, is just as effective as EOR solvents in some cases, CO2 injection is desirable as it can also be used as one of the facets of a multi-pronged greenhouse gas reduction strategy. Although more than 70% of the current CO2 EOR projects in the United States use naturally occurring underground sources of CO2, captured anthropogenic sources can be permanently stored or sequestered in depleted underground formations. Some projects, such as Petra Nova and the Century plant, have successfully utilized captured CO2 produced in power generation and industrial fertilizer production for EOR in West Texas [8,9]. The carbon captured from the Century plant allowed Occidental Petroleum to economically develop approximately 500 million barrels of oil in 2016 [10]. After oil production, a large percentage of the injected CO2 remains securely trapped within the dead-end pores/channels and adsorbed to the rock surfaces. The CO2 produced with the oil is economically separated back out, recompressed, and combined with CO2 from other sources for further re-injection into the reservoir. The initial trapping and the closed-loop system result in 90–95% sequestration of the injected CO2 in deep geologic formations [8,9,10].
There are two kinds of CO2 EOR, miscible or immiscible. The miscible CO2 EOR results in better residual oil recovery efficiency than the immiscible one due to the improvement in the overall mobility of the residual oil by viscosity reduction and oil swelling. However, a miscible EOR is only possible when all the conditions required for the miscibility of oil and CO2 are satisfied. The primary condition required for miscibility is that the pressure has to be greater than the minimum miscibility pressure (MMP) of the CO2 and oil. CO2 injection processes are usually multiple contact miscibility. Achieving first-contact miscibility is often impossible, especially in light and medium oil reservoirs [11]. There are many approaches to implementing CO2 EOR, including continuous, intermittent/cyclic (HnP injection), and water-alternating injection strategies. In the continuous injection process (Figure 1a), a CO2 injector is used to pump pressured CO2 continuously to produce the residual oil from a connected producer well. For the CO2 HnP strategy (Figure 1b), the producer well is temporarily converted into an injector well after a certain period of primary production, where CO2 is injected until the desired downhole pressure is achieved. After the injection period, the well is shut-in for some time so that the injected gas soaks into the formation. Finally, the well is reopened for production.
Numerous studies have concluded that the HnP method suits unconventional reservoirs with low permeability and many natural fractures more than the continuous gas injection method. The injected fluid (CO2) also reopens the natural fractures around the wellbore, enhancing the formation’s permeability. The success of the CO2 HnP process depends on several factors, such as the injection rate and injection time of CO2, the soaking time, and the number of cycles performed. Song and Yang [12] performed the numerical and experimental evaluation of the CO2 huff and puff process in the Bakken Formation. They concluded that miscibility and soaking time were the key parameters to optimize CO2 HnP. They highlighted that the main mechanics underlying the CO2 HnP method were oil swelling, interfacial tension (IFT) decrease, viscosity reduction, and solution gas drive. Alharthy et al. [13] showed that long soaking periods reduced cumulative oil recovery, and fracture spacing affected the efficiency of the soaking time. Kanfar et al. [14] performed an optimization study for the injection time and length alongside the soaking time to improve productivity. Their work also recommended fine gridding for simulating hydraulic fractures to prevent convergence and dispersion problems. Chen et al. [15] showed that reservoir heterogeneity significantly impacts oil recovery during CO2 HnP. Enab and Emami-Meybodi [16] evaluated the HnP performance in ultra-tight reservoirs with different fluid types and injection gases. Their study showed that the CO2 HnP provides the highest recovery for retrograde condensate fluid type, whereas C2H6 was more suitable for black oil and volatile oil systems. They also evaluated other phenomena like diffusion, adsorption, and hysteresis. Min et al. [17] evaluated the critical parameters of the CO2 HnP affecting the recovery accuracy and recovery process in preserved liquid-rich shale core samples. They concluded that the residence time (summation of soaking and production time) controls the recovery. Their work also recommended that, for higher recovery, the injection pressure needs to be at or above MMP. Although the CO2 HnP has been shown to be effective in improving productivity after natural depletion, its implementation remains challenging due to the numerous complexities related to the rock properties, fluid flow, and phase behavior in unconventional shale reservoirs. One such complexity is introduced due to multiple complex hydrocarbon-bearing nanopores. The nanopores restrict the movement of the fluid particles, resulting in phase behavior that is different from that of unconfined fluid. Pressure, volume, and temperature (PVT) conditions affect how the fluid behaves in the hydrocarbon phase, and each PVT condition results in a distinct behavior. Numerous authors have extensively studied the impact of nanopore confinement on hydrocarbons in unconventional shale reservoirs [18,19]. Their studies have shown that nanopore confinement should be carefully accounted for in numerical and modeling studies as it can significantly impact hydrocarbon recovery and reserves estimation.
The nanopores also have a significant impact on CO2 EOR [2,11,20]. The change in phase behavior results in a substantial change in the interaction between the injected CO2 and in situ hydrocarbons. Mohammad et al. [11] confirmed this finding by experimentally calculating the MMP with the vanishing interfacial tension method (VIT) in a tight reservoir with nanopores of different sizes. Furthermore, Li et al. [20] performed an experimental investigation of the CO2 HnP method using shale core samples from the Eagle Ford formation and studied the oil recovery. Their study revealed that oil recovery increased when conditions for miscibility were changed from immiscible to miscible due to the presence of nanopores. The MMP required for miscibility decreased when the number of nanopores increased. Later work by Yu et al. [7] showed the importance of molecular diffusion during CO2 EOR. They observed a recovery of up to 9.4% in the Bakken field over 30 years. Zhang and Zhang [21] studied the effects of nanopores on CO2 EOR processes. Their study indicated that nanopore confinement significantly reduces key parameters, such as the gas–oil interfacial tension and CO2 minimum miscibility pressure. This reduction cumulatively led to an increase in recovery.
Numerous simulation, experimental, and pilot-scale studies have been conducted on miscible CO2 HnP in unconventional reservoirs. However, there have been few studies considering the effect of nanopores on the CO2 HnP process [15,22]. Furthermore, to the best of our knowledge, the effect of pore confinement on different fluid samples has not received much attention. Thus, there is a further need for combined studies that evaluate the effect of nanopore confinement and fluid property. This study performs a rigorous compositional simulation to understand these impacts on the production performance of a CO2 HnP process. The remainder of the paper is organized as follows. Section 2 describes the base case model, including the study region. We start with arbitrarily selected critical HnP decision parameters (injection, soaking, and production time) to demonstrate the importance of optimized operating conditions on the production performance of a well subjected to CO2 HnP. Section 3 presents the optimization of the base case model by simulating multiple plausible realizations of the CO2 HnP process. Section 4 presents the effect of different uncertain parameters on the HnP process. A brief insight into the aspects of CO2 storage during the HnP process is presented in Section 5. Finally, Section 6 provides the main conclusions of this study. This study provides improved insight into the influence of key parameters on CO2 HnP in unconventional shale reservoirs with nanopores and other underlying uncertainties.

2. Base Case Model

This study uses a modified version of a previously history-matched model set in the Eagle Ford shale [23]. A compositional unconventional reservoir simulator CMG-GEM was used for the simulation. The Eagle Ford is stratigraphically positioned above the Buda Limestone and below the Austin Chalk [24]. The landing zone for the well in this study is near the base of the lower Eagle Ford, above the top of Buda limestone. Around 24 months of historical production data available for a horizontal well (well H1, Figure 2) drilled in Brazos County for the history match.
Most of the well and fracture properties, such as the number of fracture stages (and fractures), well spacing, well length, and monthly oil production history, were known before the simulation. However, the geological properties, such as the permeability, porosity, and fracture conductivity, were unknown and estimated from the history match. A model with all the reported 131 fractures was used for the history match. We used over 20,000 grid blocks to create the base case model, including the logarithmically refined grids (LGR) close to the fractures. The LGR reduces the total number of grid blocks needed for simulation by only using small grid blocks close to the fracture, which are needed to capture the drastic change in fluid saturations and pressures near the hydraulic fractures. Furthermore, we used black oil PVT properties provided by the operator during the history match to reduce the computational time. However, it is critical to emphasize that after the history match, the simulations in this study use a compositional model. The drainage was assumed to occur at constant bottom-hole pressure of 1,000 psi. The relative permeability curves are generated from modified Brooks–Corey correlations with typical Eagle Ford values from the literature [18,26,27,28,29], as shown in Figure 3.
The same relative permeability curve was applied to both the fracture and the matrix as a simplification. As history matching is an inverse problem, multiple plausible iterations of the unknown parameters are possible. Further details on history matching can be found in Khanal and Weijermars [23].
Although the history match assumed a black oil PVT model, this study uses a compositional model, which was needed to account for the compositional changes during CO2 EOR combined with the pore confinement effect. We also use a fracture half-length of 625 ft so that it touches the neighboring horizontal wells. The parameters used for this study are listed in Table 1. Table 2 shows the extended PVT properties of the representative reservoir fluid for the Eagle Ford liquid fluids considered for the base case [28,29]. The heavy fraction (C7+) of the original fluid has a molecular weight, mole fraction, and standard gravity of 216 g/mole, 41.49%, and 0.82, respectively. The C7+ fraction is further split into additional pseudo-components and tuned by changing the binary interaction coefficients to match the reported saturation pressure, GOR, and °API of 2260 psi, 500 scf/STB, and 37.7 °API, respectively.
In order to further reduce the computational time, we only simulated a single fracture, with symmetrical no-flow boundaries at 25 ft in either direction. The vertical no-flow boundary is located at 625 ft, symmetrical to the neighboring wells (Figure 4). We again used the logarithmic grid refinement, where the grid is more refined around the region of interest, i.e., around fractures. It should be noted that differences in grid sizing may result in slightly different results; however, the difference is usually minimal [16].
For the base case, we also do not include the effect of diffusion of CO2 into the oil during the HnP process. As the diffusivity of CO2 in oil is an uncertain parameter, we evaluate this later to understand its impact on the recovery factor. The reservoir was produced with natural depletion for the first two years, after which CO2 HnP cycles were initiated. For both production schemes, we use an appropriate minimum BHP of 1000 psia, similar to several other studies [30,31,32]. The injection, soaking, and production duration were chosen as 60 days, 7 days, and 120 days, respectively, which is close to the values used in the work of Kurtoglu [33], who used 60 days of injection, 10 days of soaking, and 120 days of the production period. It is worth noting that different studies in literature study the HnP performance for very different injection, soaking, and production periods. For example, Wang et al. [34] used an injection period of 10 years, followed by 5 years of soaking and 5 years of production time. In contrast, Shoaib and Hoffman [22] used a uniform three-month duration for each injection, soaking, and production period. The duration for each step considered in this study will be optimized later by using sensitivity analysis. The CO2 injection was controlled by ensuring that the injector BHP was greater than the reservoir fluid’s minimum miscibility pressure (MMP). The MMP for the base case fluid sample was calculated as 3375 psia using the cell-to-cell method [35].
Figure 5 shows the oil rate and cumulative oil for natural depletion (ND) and the HnP scheme. The HnP scheme is implemented after two years of natural depletion for 10,957 days, or about 30 years. As only one symmetric element is simulated, the total production rates and rates must be multiplied by the total number of fractures. This well’s initial production (IP) was over 900 bbl/day, making it a highly productive well, as the mean IP for the Eagle Ford shale is around 500 bbl/day. However, the well declined to over 80% of the initial rates after three years of production, necessitating EOR techniques. As shown in Figure 5, the HnP method results in significantly lower production than natural depletion. The recovery factor for natural depletion is 21.9% compared to 18.0% for the HnP method. The cumulative oil for the ND and HnP were 3987 bbl/fracture and 3277 bbl/fracture, respectively. This result is consistent with the results from other studies [14]. Although the CO2 injection improves the flow properties of the in situ oil, the injection and soaking period prevents the well from producing for a significant period. The combined injection and soaking period accounts for over ten years, during which the well cannot produce any hydrocarbons.
If the well produces for a more extended period, accounting for the loss in production time, the HnP method should yield improved production compared to the natural depletion. However, the NPV of the HnP method will be significantly lower than the natural depletion due to the deferred production.
Figure 6 shows the average reservoir pressure for both production scenarios. As the gas injection rate in HnP is controlled by the well constraint of a maximum BHP of 3375 psia, the average reservoir pressure bounces around 3000 psia. This reduces production as the miscibility is not reached throughout the reservoir. Furthermore, the production time after injection is insufficient to reach the minimum BHP of 1000 psia set for the reservoir. Therefore, the production can be improved by optimizing the injection pressure to keep the reservoir pressure above the estimated MMP, the soaking time to improve the mobility of the residual oil, and the injection time so that the drawdown is close to the minimum BHP.

3. Optimization of the HnP Process

The base case results show that optimizing the injection, soaking, and production period of the HnP process is critical. The valid objective function for a field case depends on numerous constraints, such as availability of solvent (CO2), compression costs, safety/operational constraints, and economic parameters (e.g., NPV). An objective function that captures all of these variables requires numerous assumptions outside this study’s scope. Furthermore, as most of the other variables will be similar across each run, our objective function is to maximize the recovery factor.
To optimize the recovery (%), we change the injection (huff) and production (puff) time between 30 and 360 days. We use this range to evaluate a wide range of production scenarios. Furthermore, the soaking period is varied between 0 days and 28 days. The well constraint is changed to a maximum BHP of 4872 psia, which is the initial pressure of the reservoir to keep the average reservoir pressure above the MMP. We ran over 500 simulations with different injection combinations, soaking, and production times to generate multiple scenarios with multiple recovery factors (Figure 7). The highest recovery of 32.0% was obtained for 30 days of a huff, 2.8 days of soak, and 85 days of puff time, corresponding to about 87 HnP cycles, as shown in Figure 8a. This recovery was higher than the ND recovery by 10.4%. This increase is equivalent to 1893 bbl/fracture (248 MStb/well) over the 30-year interval. In contrast, the lowest recovery of 12.9% was observed for 360 days of huff, 28 days of soak, and 30 days of puff time. The well stays non-producing for a significant amount of time for the least optimal case, which significantly hinders the overall production over 30 years. Such extremely suboptimal operating conditions lead to reduced drawdown and a loss of 9% recovery compared to ND, which amounts to 1635 bbl/fracture (214 MStb/well) over the 30 years of operation. Although the extreme suboptimal case presented in Figure 8b is unlikely, this result illustrates the importance of careful huff-soak-puff time needed to optimize the gas injection process.
Next, we performed a variance-based sensitivity analysis using the Sobol method to identify the parameters that significantly impact the % recovery factor. Figure 9a shows that both huff (injection) and puff (production) have significant total effects (main and interaction), whereas the soaking period has negligible impact on the objective function. Further evaluation of the 500 independent simulations also illustrated that for the optimal cases (cases with %Recovery > 30), the soak time is less than or close to 7 days. As the effect of soak time is negligible compared to the huff and puff time, we screened the 450 runs that had a % recovery greater than that of natural depletion (21.9%) to further evaluate the relationship between the huff and puff times to the % recovery. A quadratic fit with an adjusted R2 of 0.78 was observed when the ratio of puff and huff time was plotted against the recovery (%), as shown in Figure 9b. The global maximum for the ratio (huff/puff) for the maximum % recovery for the selected range of inputs was observed to be 2.73. We will use the optimal case for sensitivity analysis and evaluation of uncertain parameters for the remainder of the paper.

4. Effect of Different Parameters in the HnP Process

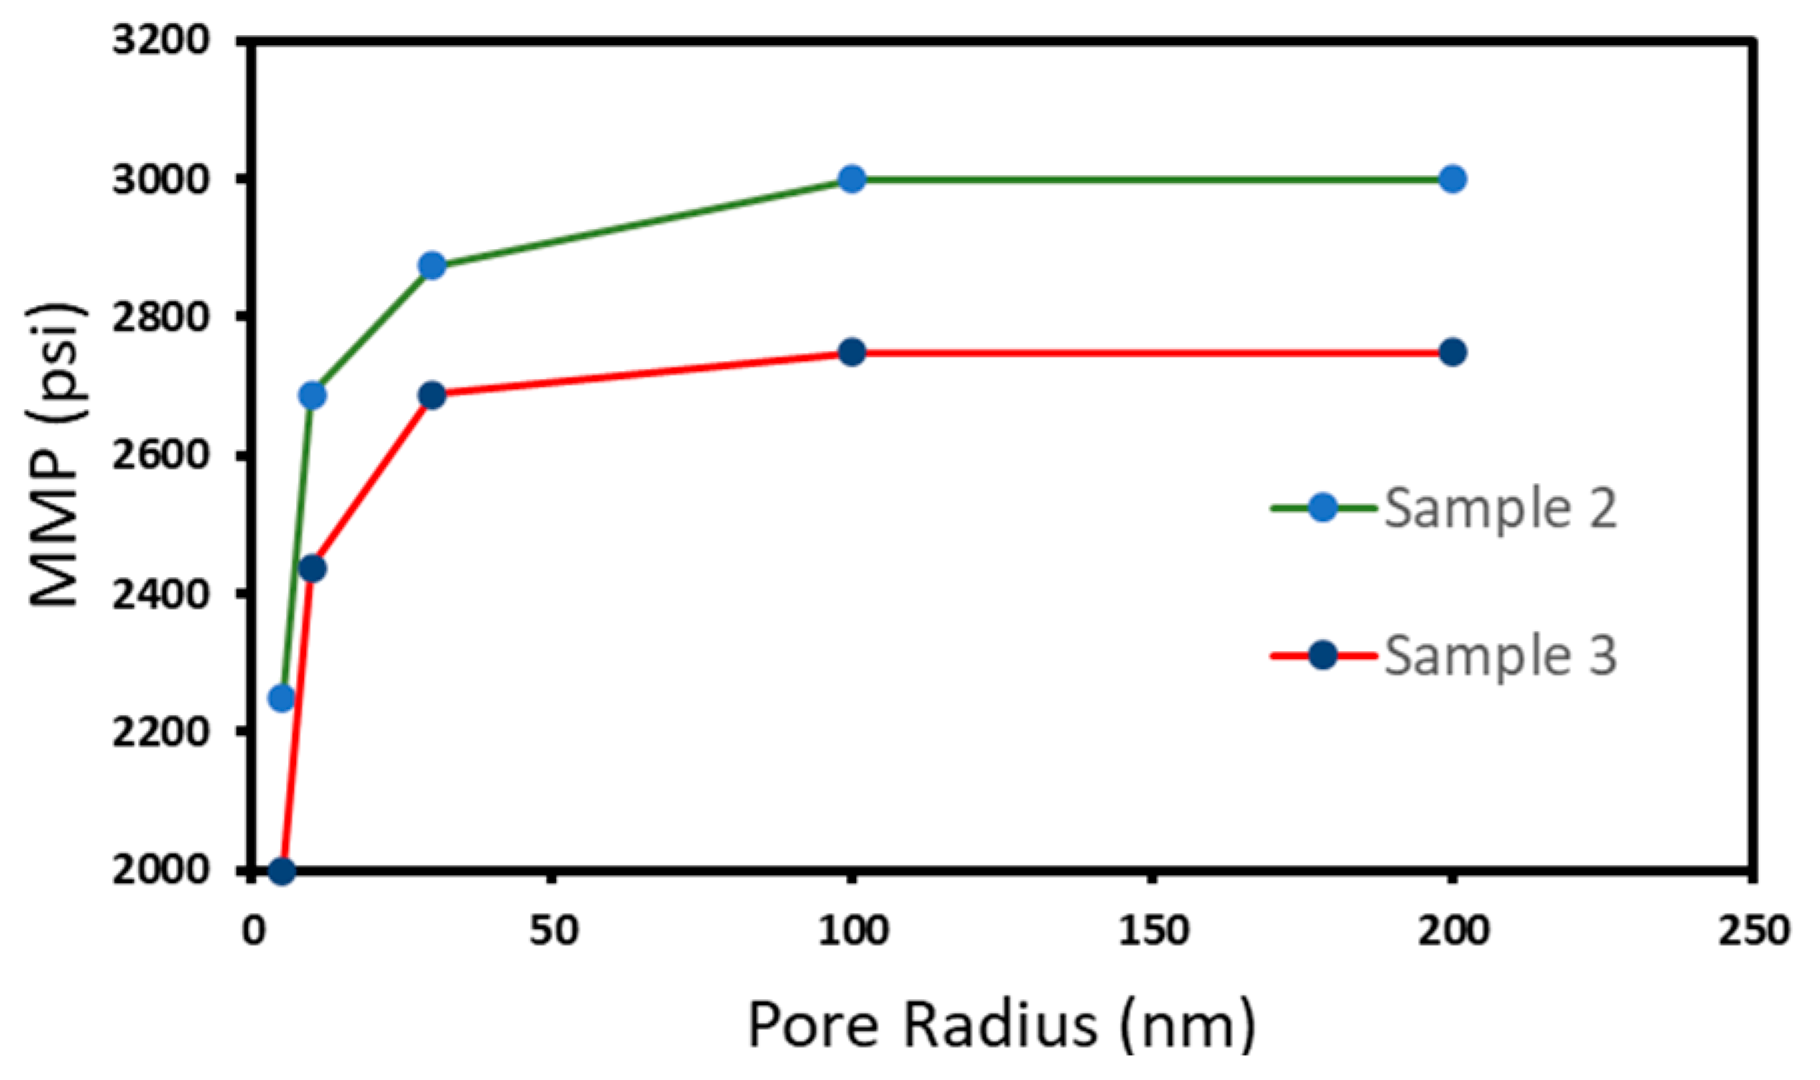
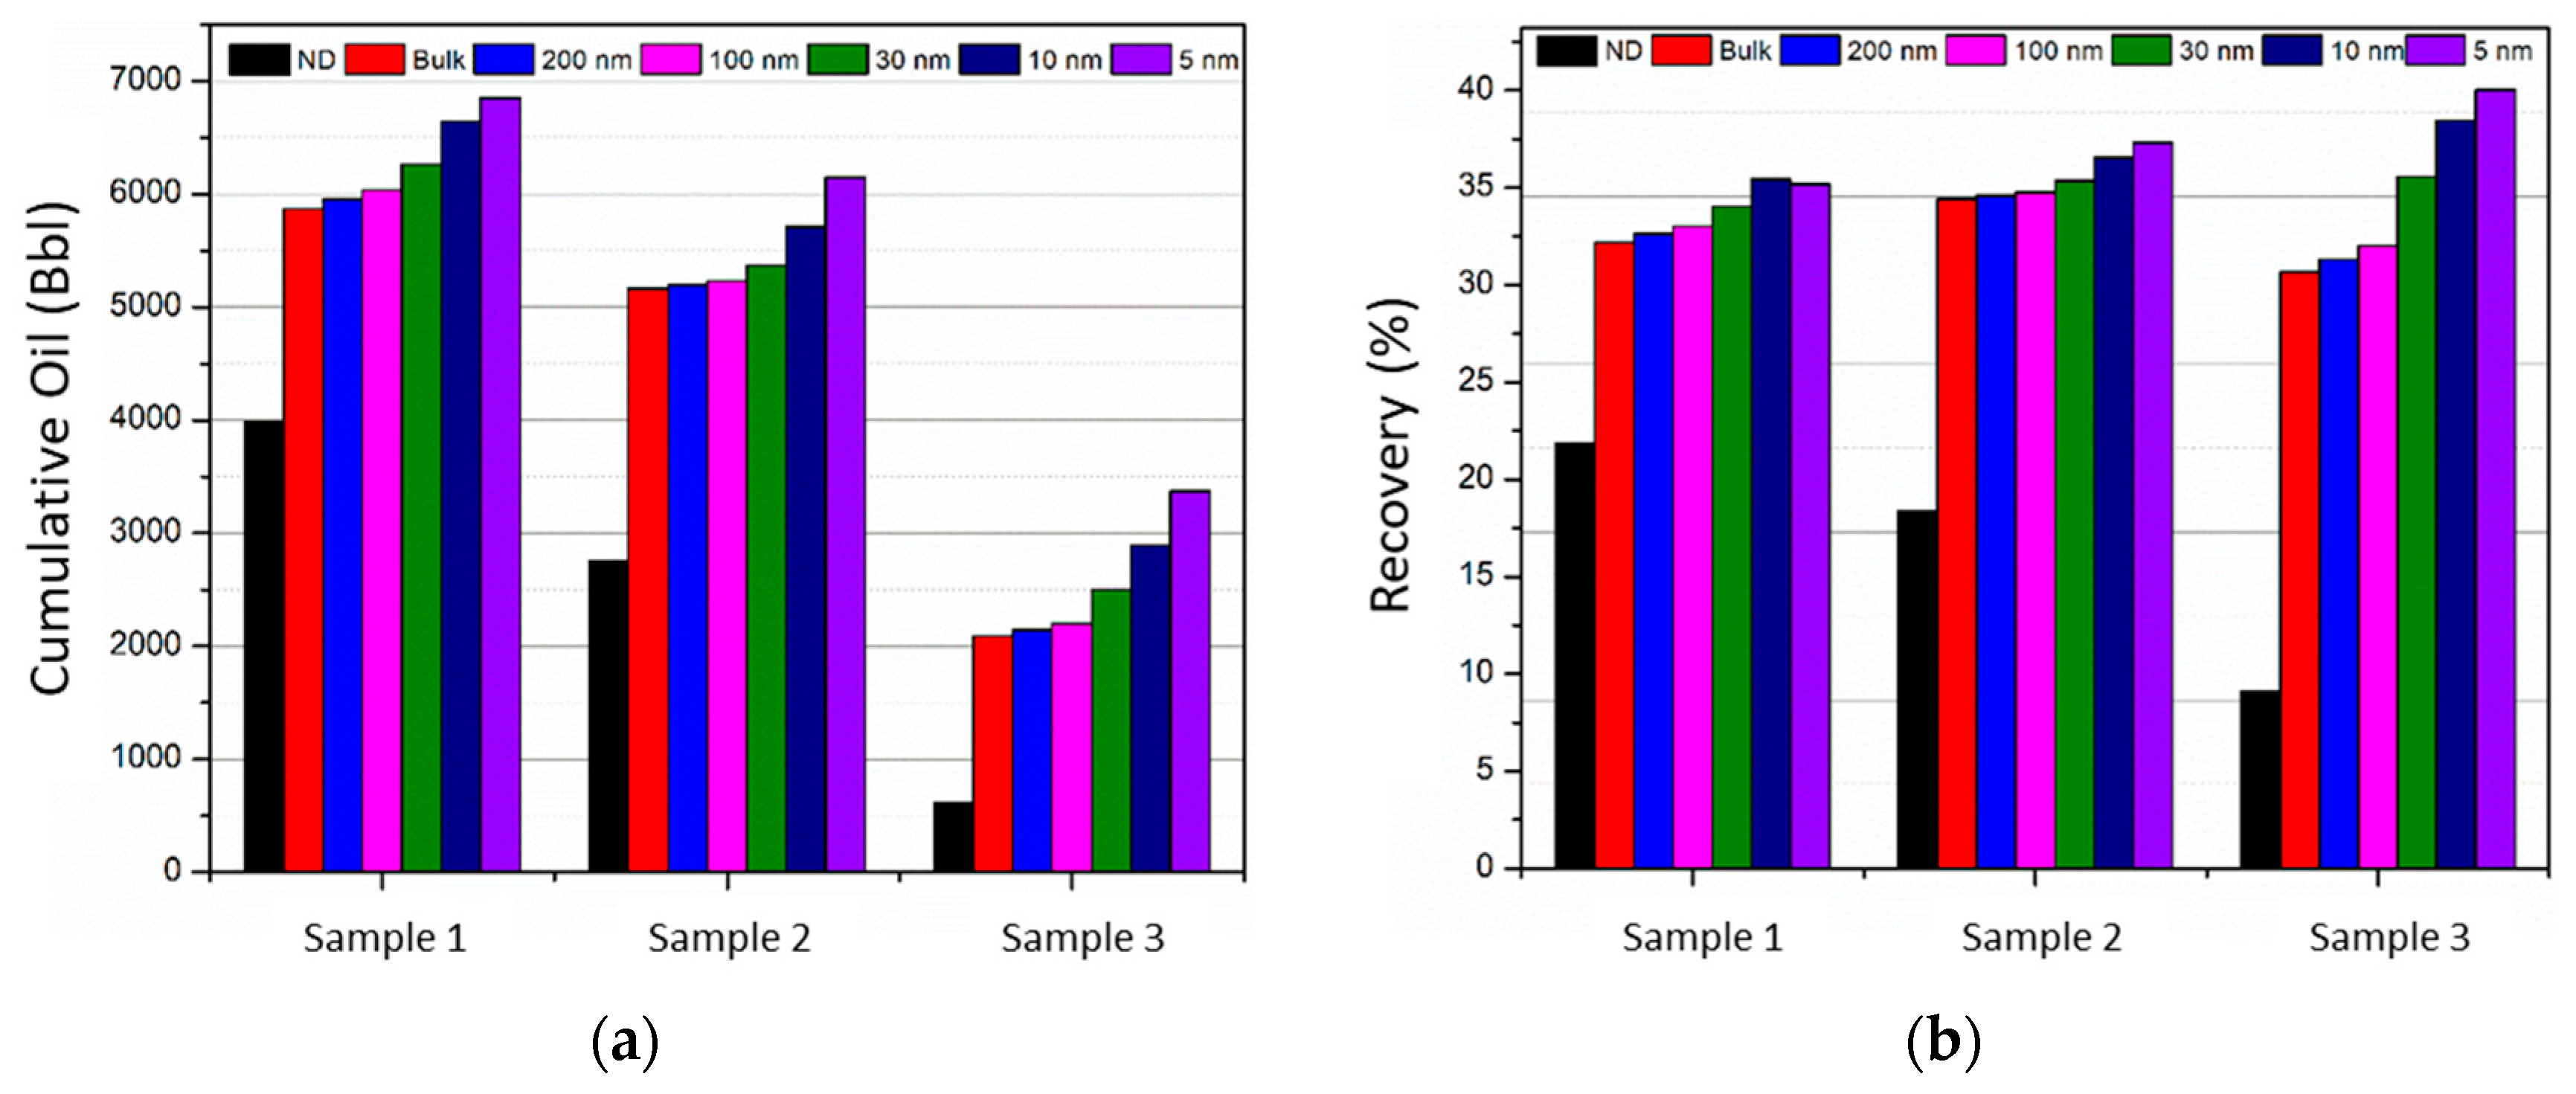
4.1. Effect of Pore Confinement

In conventional reservoirs, pore throat sizes are large, the effect of capillary pressure and other forces (like Van der Waals, adsorption) on phase behavior is negligible [36], and PVT properties are close to lab PVT cell measurements. However, phase property deviates from the measured PVT cell measurement in reservoirs with a significant fraction of nanopores. The phase property deviation due to the presence of nanopores has been verified and estimated by using different methods such as adsorption–desorption experiments, differential scanning calorimetry experiments, diffusion experiments, nanochannel chip experiments, molecular dynamics simulation, equation of state, and numerous other techniques [37,38]. Although the different methods have their own strengths and weaknesses, this study uses the modification of critical properties for the equation of state models due to its relative ease of implementation into a compositional reservoir simulation model. Therefore, we will use the previously developed correlations based on the rigorous molecular dynamics simulation to calculate the critical properties needed for the equation of state models [18]. The critical temperature and pressure shift correlation used in this study are:
L n ( Δ T n ) = 3.007 L n ( r p ) + 0.869
Δ P n = 2.63 r p
where  Δ T n  is normalized deviated temperature,  Δ P n  is normalized deviated pressure, and rp is the pore radius. The confined critical properties can then be calculated from Equations (3) and (4) as follows:
T c c = T c ( 1 2.38 . r p 3.007 )
P c c = P c ( 1 2.63 / r p )
where Tcc, and Pcc are the pore-confined critical temperature and critical pressure calculated from the respective critical temperature (Tc) and pressure (Pc). For the large pore radius (rp) value, the confined critical properties equal the bulk critical properties. We use the Peng–Robinson (PR) EOS [39] to calculate the phase properties using the correlations Equations (3) and (4). The substance-specific constants that account for the attractive and repulsive forces are directly calculated from the critical properties and acentric factor [40].
In order to evaluate the effect of nanopore confinement, we changed the critical properties of the fluid sample in the base case after tuning the PVT parameter to match the reported saturation pressure, GOR, and °API. The rationale is that these measurements are taken for bulk samples and do not represent the fluid behavior in the confined state. Therefore, the critical property was shifted by assuming pore sizes ranging from 5 nm to 200 nm. The actual phase behavior would be between the two extreme pore sizes and require an accurate pore-size distribution, which is not considered here. Figure 10 shows the base case fluid sample’s pressure–temperature (PT) phase diagram obtained from the rigorous multi-component flash calculation based on Peng–Robinson EOS using the modified Tc and Pc. As the reservoir temperature is 250 °F, the reservoir behaves like black oil regardless of the assumed pore sizes. Figure 10 also shows that the critical properties of the fluid mixture are significantly depressed because of nanopore confinement. However, the effect of nanopore confinement on Tc was negligible for fluids confined in pore sizes greater than 10 nm. The impact of pore confinement was much more significant on combined fluid Pc, which was reduced by over 53% (for 5 nm). In summary, the combined fluids Tc and Pc change due to pore confinement, which is clearly observed in Figure 10 for Pc but is not very apparent for Tc due to a relatively minor change.
Next, we evaluate the effect of pore confinement on the MMP of the base case fluid. The miscible CO2 injection results in up to three times higher oil recovery than immiscible injection [41]. The MMP of a reservoir depends on several factors, including the phase properties of the in situ fluid. Since the nanopore confinement effect affects the critical properties of reservoir fluids, the MMP for CO2 miscibility is also impacted. This effect causes tight reservoirs such as shale to have a lower MMP when compared to conventional reservoirs like sandstone. In order to evaluate the impact of nanopore confinement on MMP, we calculated the MMP using cell-to-cell simulation, which is shown in Figure 11 [35]. We used oil properties that are shifted due to the confinement effect, as shown in Figure 10.
We evaluate the optimized base case’s recovery factor for each pore size. Figure 12 shows that the oil recovery factor increases due to the pore confinement effect. For the reservoir with pore sizes of 5 nm and 10 nm, there are 8.0% and 8.5% increases in recovery compared to the unconfined optimized base case model (from 32.0% for the base case recovery, Figure 12). Thus, proper characterization of reservoirs is critical to account for the presence of nanopores which leads to pore confinement.

4.2. Effect of Fluid Composition

The fluid composition has one of the most significant impacts on production from unconventional reservoirs. Accurate characterization of the reservoir fluids is essential for successful EOR operations, including the CO2 HnP. The selection of injection pressure, the number of HnP cycles, the time for huff-soak-puff cycles, and other decision parameters may also depend on the reservoir fluid properties. For a compositional simulation, the fluid composition data for the reservoir fluid needs to be appropriately tuned to match the experimental data obtained from various laboratory experiments, such as constant composition expansion, differential liberation, separator test, and others. We use two additional oil samples from the Eagle Ford shale with different fluid compositions in addition to the base case oil (Sample 1). The fluid composition and reported properties for Samples 2 and 3 are given in Table 3. The individual hydrocarbons heavier than C7+ are lumped together to define several pseudo-components. The fluid properties were tuned to match the reported saturation pressure and API for each sample, as presented in Table 3.
The PT diagram for Samples 2 and 3 is shown in Figure 13, including the effect of pore confinement. Moreover, the MMP for Sample 2 and Sample 3 fluid are presented in Figure 14.
Examination of Figure 10 and Figure 13 reveals that the pore confinement effect significantly suppresses the critical properties (Pc and Tc). However, as observed in Sample 1, the critical pressure shift (Pc) is much more significant than the critical temperature shift (Tc). Therefore, we further evaluated the critical property shift for smaller-sized pores (3 nm) and observed a similar trend. Table 4 summarizes the critical property deviation for all the fluid samples considered in this study, including the 3 nm case, which is not used for simulations.
We used the optimized HnP model to simulate recovery for both fluid samples (2 and 3). Figure 15 compares the cumulative oil and recovery factor for different fluids after 30 years of simulation. As expected, the fluid sample with a higher fraction of heavy hydrocarbons results in the highest per fracture cumulative oil recovery of 5870 bbl, compared to 3987 bbl from natural depletion over the 30-year period when the bulk phase fluid behavior is considered. As the phase behavior deviates from the pore confinement, the cumulative oil increases for each case.
The recovery factor plot shows that for fluid Sample 3, which has significantly lower fractions of C7+ hydrocarbons, the increase in recovery factor due to the HnP process is noticeably higher than that for Samples 1 and 2, which have a higher amount of C7+ hydrocarbons. The recovery factor for Sample 3 jumps from 9.1% using natural depletion to 30.7% (~300% increase) using the HnP process when bulk PVT properties are used over 30 years of production. However, for the base case (Sample 1), the recovery factor only increases from 21.9% to 32.2% (~50% increase) for the same scenario (Figure 15a,b). For Sample 2, which has a moderate amount of C7+ components, the recovery factor increases from 18.4% for natural depletion to 34.4% (~100% increase) for the HnP process.

4.3. Effect of Injection Solvent

Due to the poor injectivity condition for water flooding—requiring high injection pressure in ultra-low permeability conditions—HnP scenarios using gas-based solvents are recognized to be the preferred method in several studies. N2 and CO2 are the most common gas used during HnP injection [42,43]. Considering these two gases, CO2 has a higher sweep efficiency and lower minimum miscibility pressure, thus making it the better choice for HnP scenarios [44,45]. However, employing CO2 in HnP scenarios can come with obstacles due to high production costs and considerable corrosion on the wellbore and pipeline. N2 HnP injection can become an economical alternative due to its cost-effectiveness and non-corrosive nature [43]. For CO2 injection, maintaining the reservoir pressure above the minimum miscibility pressure of CO2 is essential, ensuring higher oil recovery due to CO2 swelling and viscosity reduction at miscible conditions [44,45].
After six injection cycles, Li et al. [31] observed a cumulative oil recovery factor of 61.49% for CO2 HnP and 34.85% for N2 HnP. Moreover, compared to N2 injection, CO2 has better injectivity in ultra-low permeability shale cores. Higher oil recovery potential for CO2 HnP (33 to 85%) was observed in the work of Gamadi et al. [6] when compared to N2 HnP oil recovery (10 to 50%). However, it should be noted that the results cannot be fully comparable due to inconsistent experimental parameters in terms of core samples and injection factors used for CO2 and N2 HnP.
Figure 16 features the recovery (%) for N2 and CO2 HnP scenarios, after 87 huff-n-cycles, at different pore confinement for the three fluid samples considered in this study. As shown in Figure 16, CO2 HnP is more effective than N2 for all fluid types and pore confinement scenarios. For both HnP scenarios, the recovery percentage increases as the pore size decreases for all the fluid samples. Moreover, for the N2 HnP scenario, Sample 1 (base case fluid) and Sample 2 fluid (higher fraction of heavy hydrocarbon fluid) correspond to a higher recovery percentage, compared to Sample 3 fluid, with the only exception being for 5 nm pore confinement. Furthermore, a contrasting trend can be observed while comparing the recovery for Sample 1 and Sample 2 fluid. While CO2 HnP recovery is higher in the case of Sample 2 fluid compared to Sample 1 fluid, for all pore confinement, N2 HnP recovery is higher in the case of Sample 1 fluid.

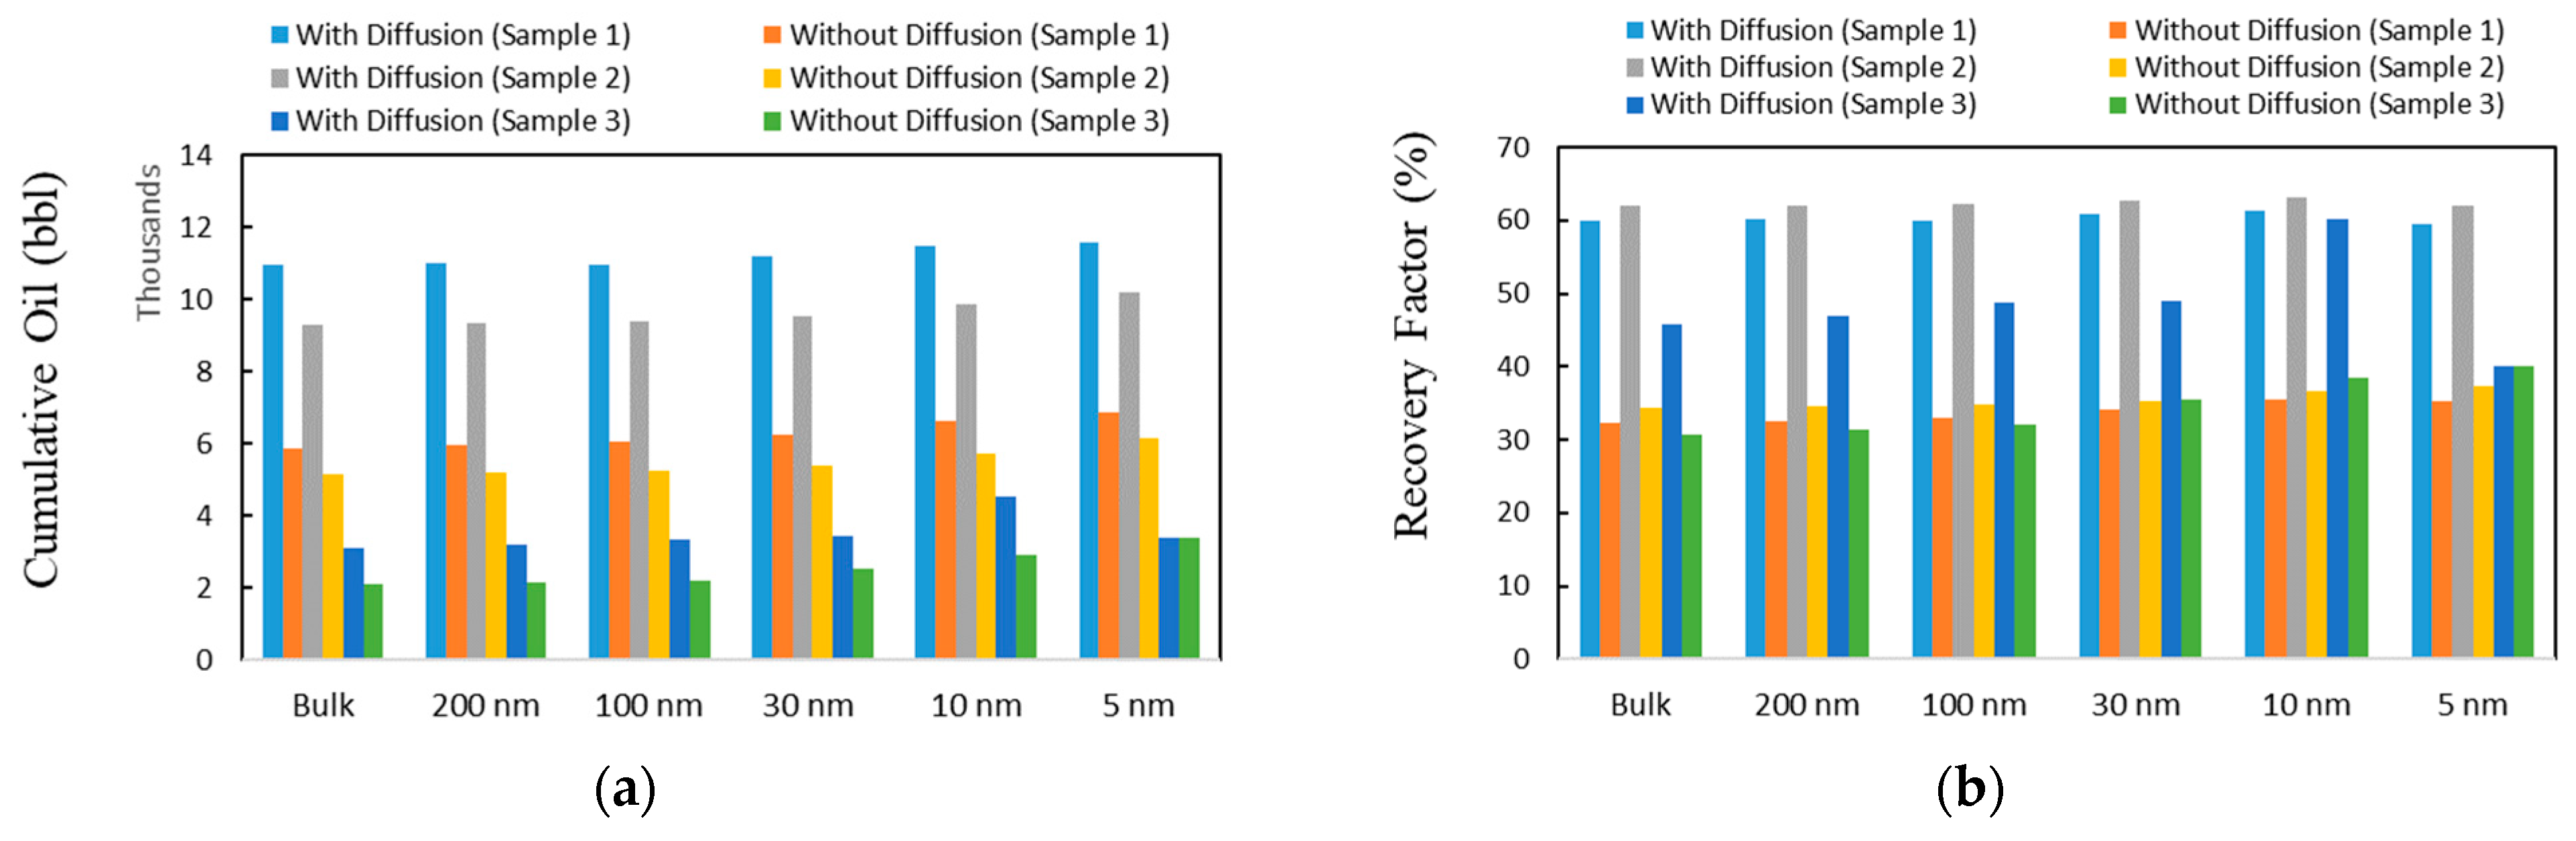
4.4. Effect of Diffusivity

Oil–gas diffusion is another parameter of consideration in HnP EOR. Injected gas molecules diffuse into in situ oil due to the concentration gradient, causing the oil to swell, thus facilitating oil moving out of nanopores into different micro- and macro-fractures [30,46]. It should be noted that the diffusion efficiency in any porous media is also dictated by matrix tortuosity, which varies on the reservoir’s geographic formation and is higher in tight reservoirs. For a porous medium, Equation (5) can explain the displacement of one fluid by another in miscibility conditions [46].
Dispersion   Coefficient = D c F Φ + 0.5 vd p σ
where the bulk-diffusion coefficient (cm2/s) is Dc and matrix tortuosity is  F Φ . The average displacement velocity dictated by the matrix permeability is represented as v (cm/sec). Moreover, dp represents the particle diameter-controlling pore-throat size (cm), and the media heterogeneity is expressed by  σ . The second term ( 0.5 vd p σ ) in Equation (5) represents the advection or mechanical mixing and is considered the dominating factor in conventional rocks at high porosity and permeability conditions. However, in tight rock formations at reduced permeability and pore-throat size, the advection factor can decrease by six to nine orders of magnitude, making the first term ( D c F Φ ) in Equation (5), or the diffusive phenomenon, the dominant factor in controlling the dispersion [46].
The mechanism and effects of CO2 diffusion during the HnP process need a substantial study to accurately predict the effectiveness of the CO2 HnP. Despite observing a significant effect of molecular diffusion on incremental oil recovery during CO2 solvent-soaking experiments using the Bakken core, Alharthy et al. [19] found negligible molecular diffusion effect on the incremental oil recovery in a history-matched field scale model, whereas Sun et al. [47] stated that CO2 diffusivity is the primary contributing factor in optimizing cumulative oil production for the CO2 HnP process. Their work considered a diffusion coefficient range of 0.01 cm2/s to 0.001 cm2/s for optimization scenarios. Using a similar range, the effect of CO2 diffusivity in oil production was also verified by the work of Yu et al. [48]. In addition, using a CO2 diffusion coefficient range of 0.0001 to 0.01 cm2/s for a CO2 HnP sensitivity study, Yu et al. [49] concluded that CO2 molecular diffusion has lower effects than parameters like CO2 injection rate, injection time, soaking time, and the number of HnP cycles. The different ranges used in the literature necessitates finding accurate CO2 diffusivity values for different reservoir formations.
This study uses a diffusivity coefficient of 0.0001 cm2/s and a tortuosity factor of 1 to compare the diffusion and no diffusion scenario effects for fluid samples at different pore confinement, as shown in Figure 17. It should be noted that tortuosity can vary based on the rock formation and must be accounted for in order to accurately estimate diffusivity effects during production. As seen in Figure 17, the production scenario and corresponding recovery can increase when diffusivity is considered, which is in agreement with the work of Yu et al. [49]. The cumulative oil production is highest for both diffusive and non-diffusive cases for Sample 1 fluid and lowest for Sample 3 fluid for all pore confinement scenarios.

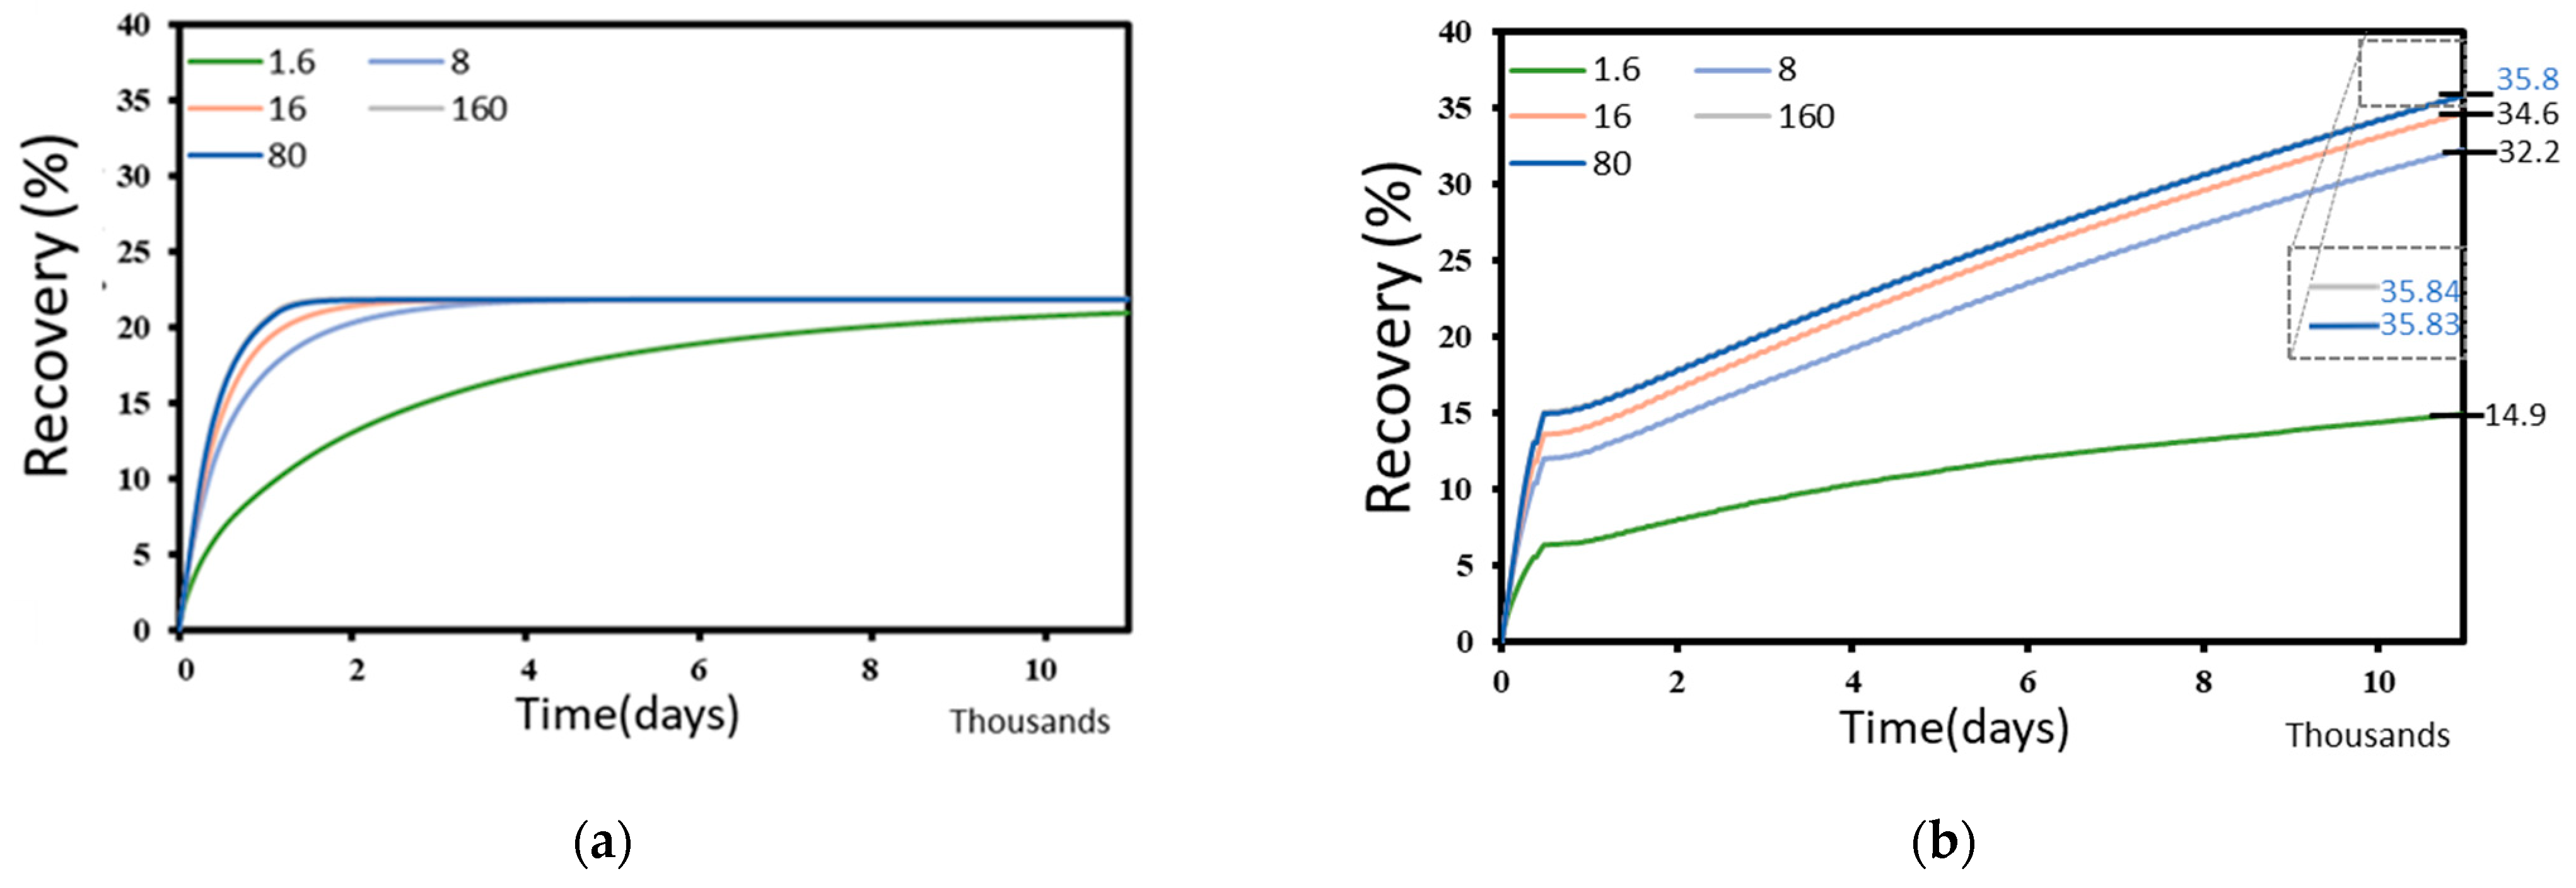
4.5. Effect of Fracture Conductivity

For an unconventional reservoir, hydraulic fracturing is one of the most important operations needed for the commercial recovery of hydrocarbons [50,51,52]. The hydraulic fractures increase the fluid flow path needed for the hydrocarbons to move from the pores to the wellbore. In addition, the fractures also provide a pathway for injected solvent (CO2) to come in contact with the residual oil, leading to improved recovery from the reservoir. The fracture properties, such as the fracture half-length and fracture conductivity, are uncertain parameters determined from the history-matching process. Fracture conductivity determines the flow capacity of the induced fractures and is determined from the product of fracture width and fracture permeability. Both fracture conductivity and fracture half-length can vary significantly from the designed parameter due to several factors such as proppant properties, injection rate and volume of the proppant, proppant embedment/crushing, stress-induced compaction, fracture hits, and numerous other uncertainties [53]. Dimensionless fracture conductivity (FCD) is useful to account for the impact of fracture half-length and fracture conductivity for a reservoir with a particular permeability. The FCD is defined as the ratio of the product of the fracture permeability and fracture width over the product of the formation permeability and fracture half-length. The value of FCD is also critical in determining whether the hydraulic fracture has finite or infinite conductivity. There is no pressure drop in the fractures during production for infinitely conductive fractures. Therefore, further increases in conductivity, which require additional material and operational costs, will not positively impact productivity. For an infinitely conductive fracture, different threshold values for FCD are greater than 30 [54,55]. In some studies, a value of FCD greater than 50 is defined as the threshold for an infinitely conductive fracture [55]. We perform sensitivity analysis by varying the fracture permeability from 60 mD to 6000 mD, keeping all other parameters constant, which covers a wide range of FCD.
Figure 18 shows the recovery factor for different FCD ranging from 1.6 to 160 for natural depletion and optimized HnP EOR. For natural depletion (Figure 18a), the enhanced FCD results in faster recovery initially, but the final recovery % does not appreciably change between each case. The recovery % for FCD of 1.6 and 160 is 20.9% and 21.9%, respectively. However, Figure 18b shows that the fracture properties significantly impact the recovery factor from HnP EOR. For the FCD of 1.6, the recovery % is lower than the natural depletion at 14.9%. However, the recovery % improves significantly when the FCD increases to 80 (35.8%). The recovery% does not increase when the FCD is doubled to 160 (Figure 18b, inset). This shows that we can significantly improve recovery from a HnP EOR by improving the fracture conductivity (and FCD). However, it also shows a risk of lower recovery due to deterioration of fracture parameters due to proppant crushing, embedment, fracture closure, and other processes. This result also directly translates to other parameters needed for calculating FCD, such as reservoir permeability and fracture half-length.

5. CO2 Storage during HnP

Considered to be one of the key issues in global warming, CO2 emissions into the atmosphere are increasingly the focus in different studies [56,57,58]. Among the CO2-based EOR processes, the CO2 HnP process has better potential to reduce climate change [59]. A significant portion of the CO2 used for enhanced hydrocarbon extraction from reservoirs can become trapped, aiding in CO2 sequestration [60]. Due to the CO2 adsorption ability of organic matter, unconventional organic-rich reservoirs possess good CO2 sequestration potential, despite most of the current CO2 storage sites being conventional reservoirs [60,61,62]. After conducting a CO2 storage assessment study during a, enhanced recovery operation, Liu et al. [63] concluded that more than 90% of injected CO2 is instantaneously trapped through gas adsorption upon entering the reservoir.
The trapped CO2 during the HnP process can be stored in four ways: (i) free CO2 gas phase storage in available reservoir space where oil is produced, (ii) CO2 dissolving as a solution gas into the remaining oil, (iii) CO2 dissolving into the brine left in the reservoir, and (iv) CO2 reacting with minerals presents in the reservoir and forming carbonaceous minerals like calcium carbonate, magnesium carbonate, ferrous carbonate, etc. [57]. Despite the potential high CO2-storage capabilities during the CO2 HnP scenario, the EOR process is usually optimized to minimize the amount of CO2 injection and maximum oil recovery due to the high-cost nature of the procedure. Thus, to co-optimize both the oil recovery and the CO2 storage, different objective functions along with weight factors are assigned to the CO2 storage factor and oil recovery factor, based on the primary goal of the EOR-storage project, in several studies [57,63]. A mathematical approach adopted in the work of Zhou et al. [57] stated that free gas phase in available reservoir space and CO2 dissolution into remaining heavy oil are the primary CO2 storage aspects in the HnP process. It should be noted that CO2 storage optimization is outside the scope of this study. Therefore, the stored CO2 amount in this study does not reflect an optimized CO2 storage scenario during HnP.
Figure 19 presents the CO2 storage percentage after 87 CO2 HnP cycles for fluid samples at different pore confinement. About 970 to 1067 ton CO2 is stored per fracture during the HnP period considered in this study, corresponding to a total of 125,130 to 137,643 tons of CO2 stored over the entire region. As seen in Figure 19, Sample 1 and Sample 2 fluid types have slightly higher CO2 storage potential at smaller pore size, whereas the pore confinement effect on CO2 storage is insignificant for Sample 3 fluid. Furthermore, it can be concluded that fluid type and pore confinement do not significantly affect CO2 storage, as the difference in storage percentage is relatively small. We did not model any adsorption effect in the current study, which may further enhance the amount of CO2 stored in the reservoir.

6. Discussion

This study optimized the CO2 HnP process in maximizing the recovery factor for unconventional reservoirs, focusing on different fluid types, pore confinement effects, and other crucial completion parameters. By using variance-based sensitivity analysis, huff and puff time were identified as the significant parameters impacting the recovery parameters, whereas soaking time had minimal effect.
This study used critical property shift to evaluate the effect of pore confinement in phase behavior of hydrocarbons confined in nanopores. However, it should be noted that factors like high capillary pressure and component adsorption/desorption can also impact the phase behavior of hydrocarbons in nanopores. In addition, other fluid properties, including density, viscosity, and others, also deviate from the bulk properties, which can significantly affect the phase behavior of hydrocarbons confined in nanopores. These deviations are not explicitly modeled in this study, which may further affect the fluid phase behavior. However, critical property shift is also a commonly accepted method of modeling pore-confinement in nanopores, which is grounded in experimental and simulated data [19,38,64]. Jin et al. [38] compared the effect of using just the phase property shift and both capillary pressure and phase property shift. They observed that the maximum relative error between the methods compared to the experimental data was less than 5%, which means both approaches are appropriate for studying the effect of pore proximity on phase behavior and fluid properties. Furthermore, Teklu et al. [64] also observed that these effects are synergistic, resulting in bubble point depression due to both capillary pressure and critical property shift. The correlations used in this study (Equations (1)–(4)) are based on robust grand-canonical Monte Carlo (GCMC) and molecular dynamics simulations (MDSs) [65], which are easier to implement with critical property shifts in a compositional simulation.
We observed a significant reduction in the critical fluid mixture properties caused due to nanopore confinement (Table 4). However, the change due to pore confinement was mostly observable for critical pressure shift (Pc) and comparatively small for critical temperature shift (Tc). Although 3 nm pore size was not considered in this study, a similar Pc and Tc trend was also observable for 3 nm. Apart from critical pressure and temperature shift, the effect of factors like high capillary pressure and component adsorption/desorption will be considered in our future study for more in-depth analysis.
Another possible line of future work may include a detailed investigation of the effect of diffusivity and tortuosity factors in HnP production scenarios. Although the tortuosity factor changes based on the reservoir formation, accounting for tortuosity will yield accurate predictions for the HnP process. Furthermore, CO2 sequestration aspects are also worth investigating during the HnP optimization process.

7. Conclusions

This study presents a numerical study to optimize the CO2 HnP model in the Eagle Ford shale and understand the impact of nanopore confinement on the recovery factor. Based on the results of this study, the following conclusions can be obtained:
(1)
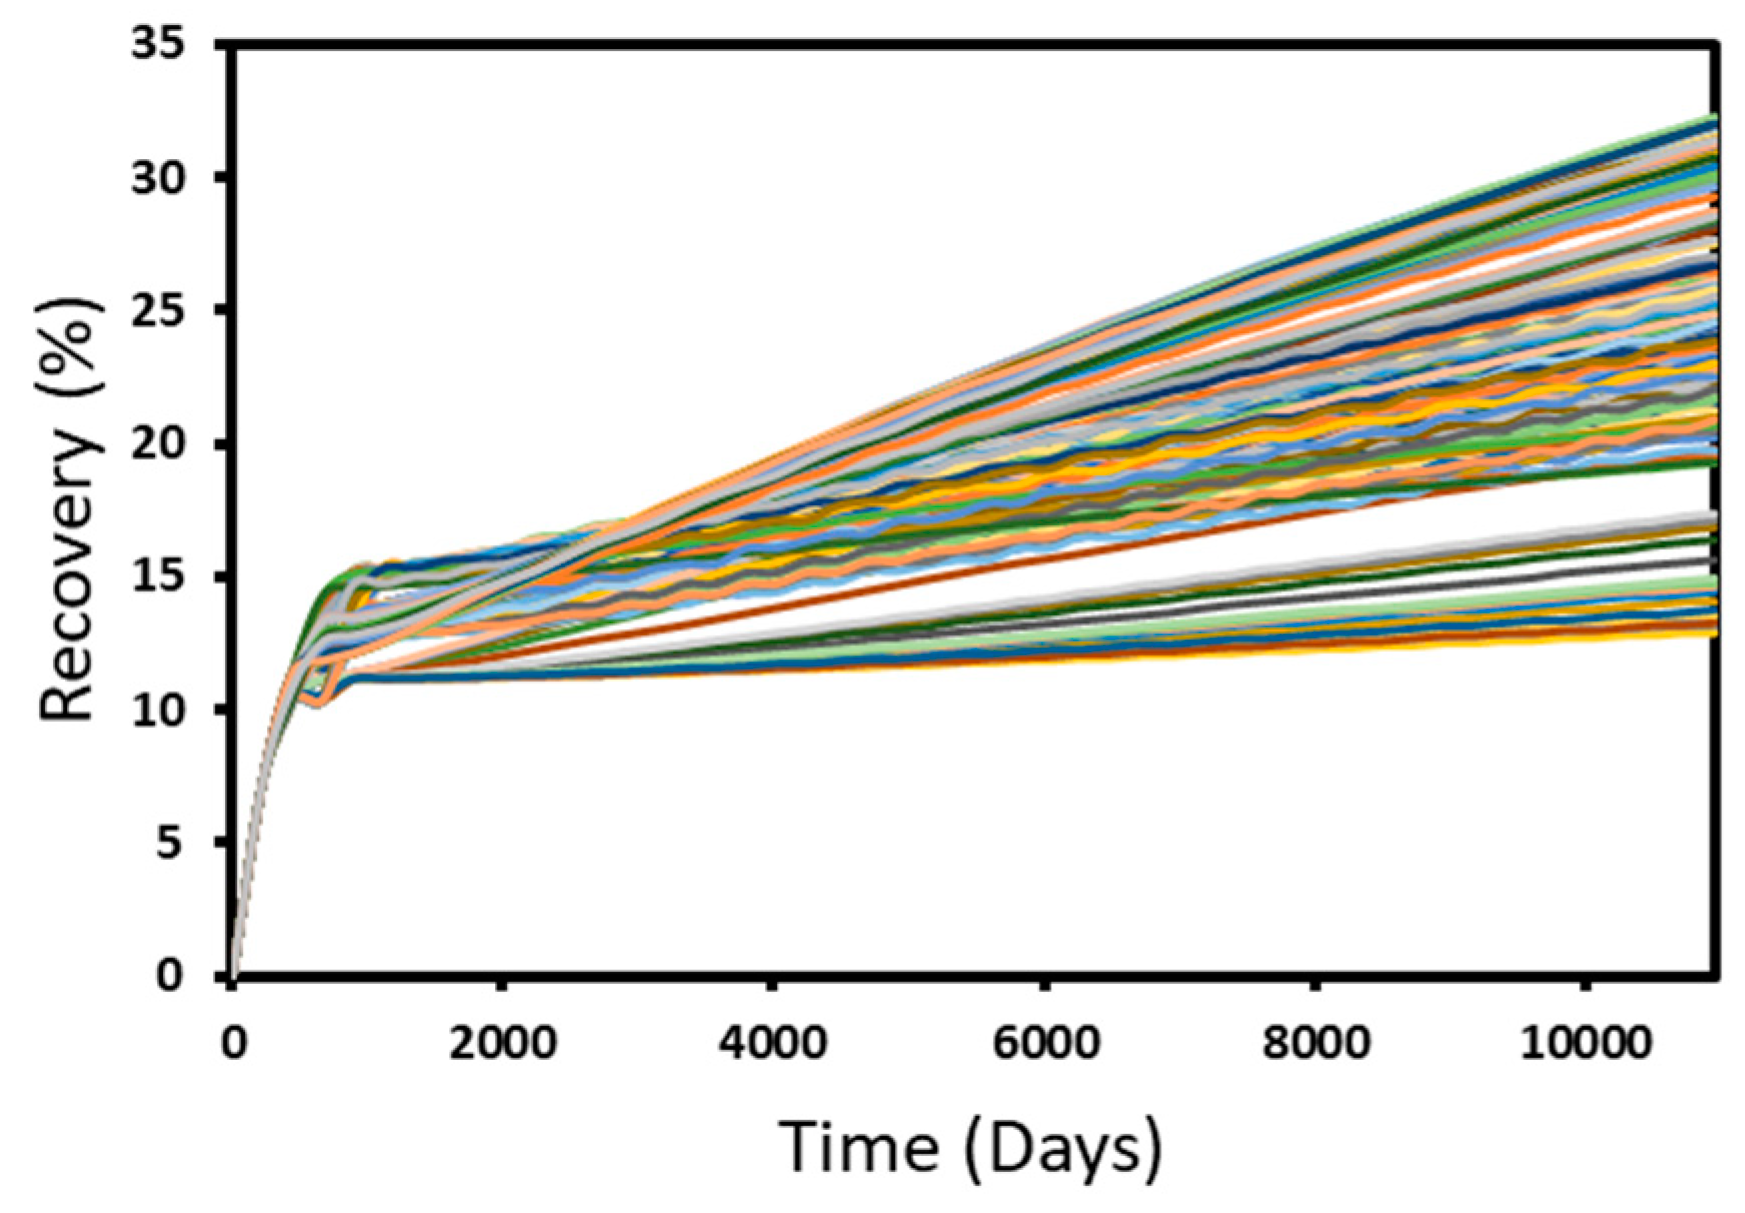
As the well loses productive time during the injection and soaking period, the recovery factor may be lower than natural depletion if the injection, soaking, and production period are not optimized. For example, compared to 21.9% recovery for natural depletion, a non-optimal HnP cycle had only 18% recovery, which is counterproductive to the desired goal of improving recovery (Figure 5).
(2)
The optimized CO2 HnP process resulted in 32.03% recovery over 30 years, significantly higher than 21.9% from natural depletion (Figure 8).
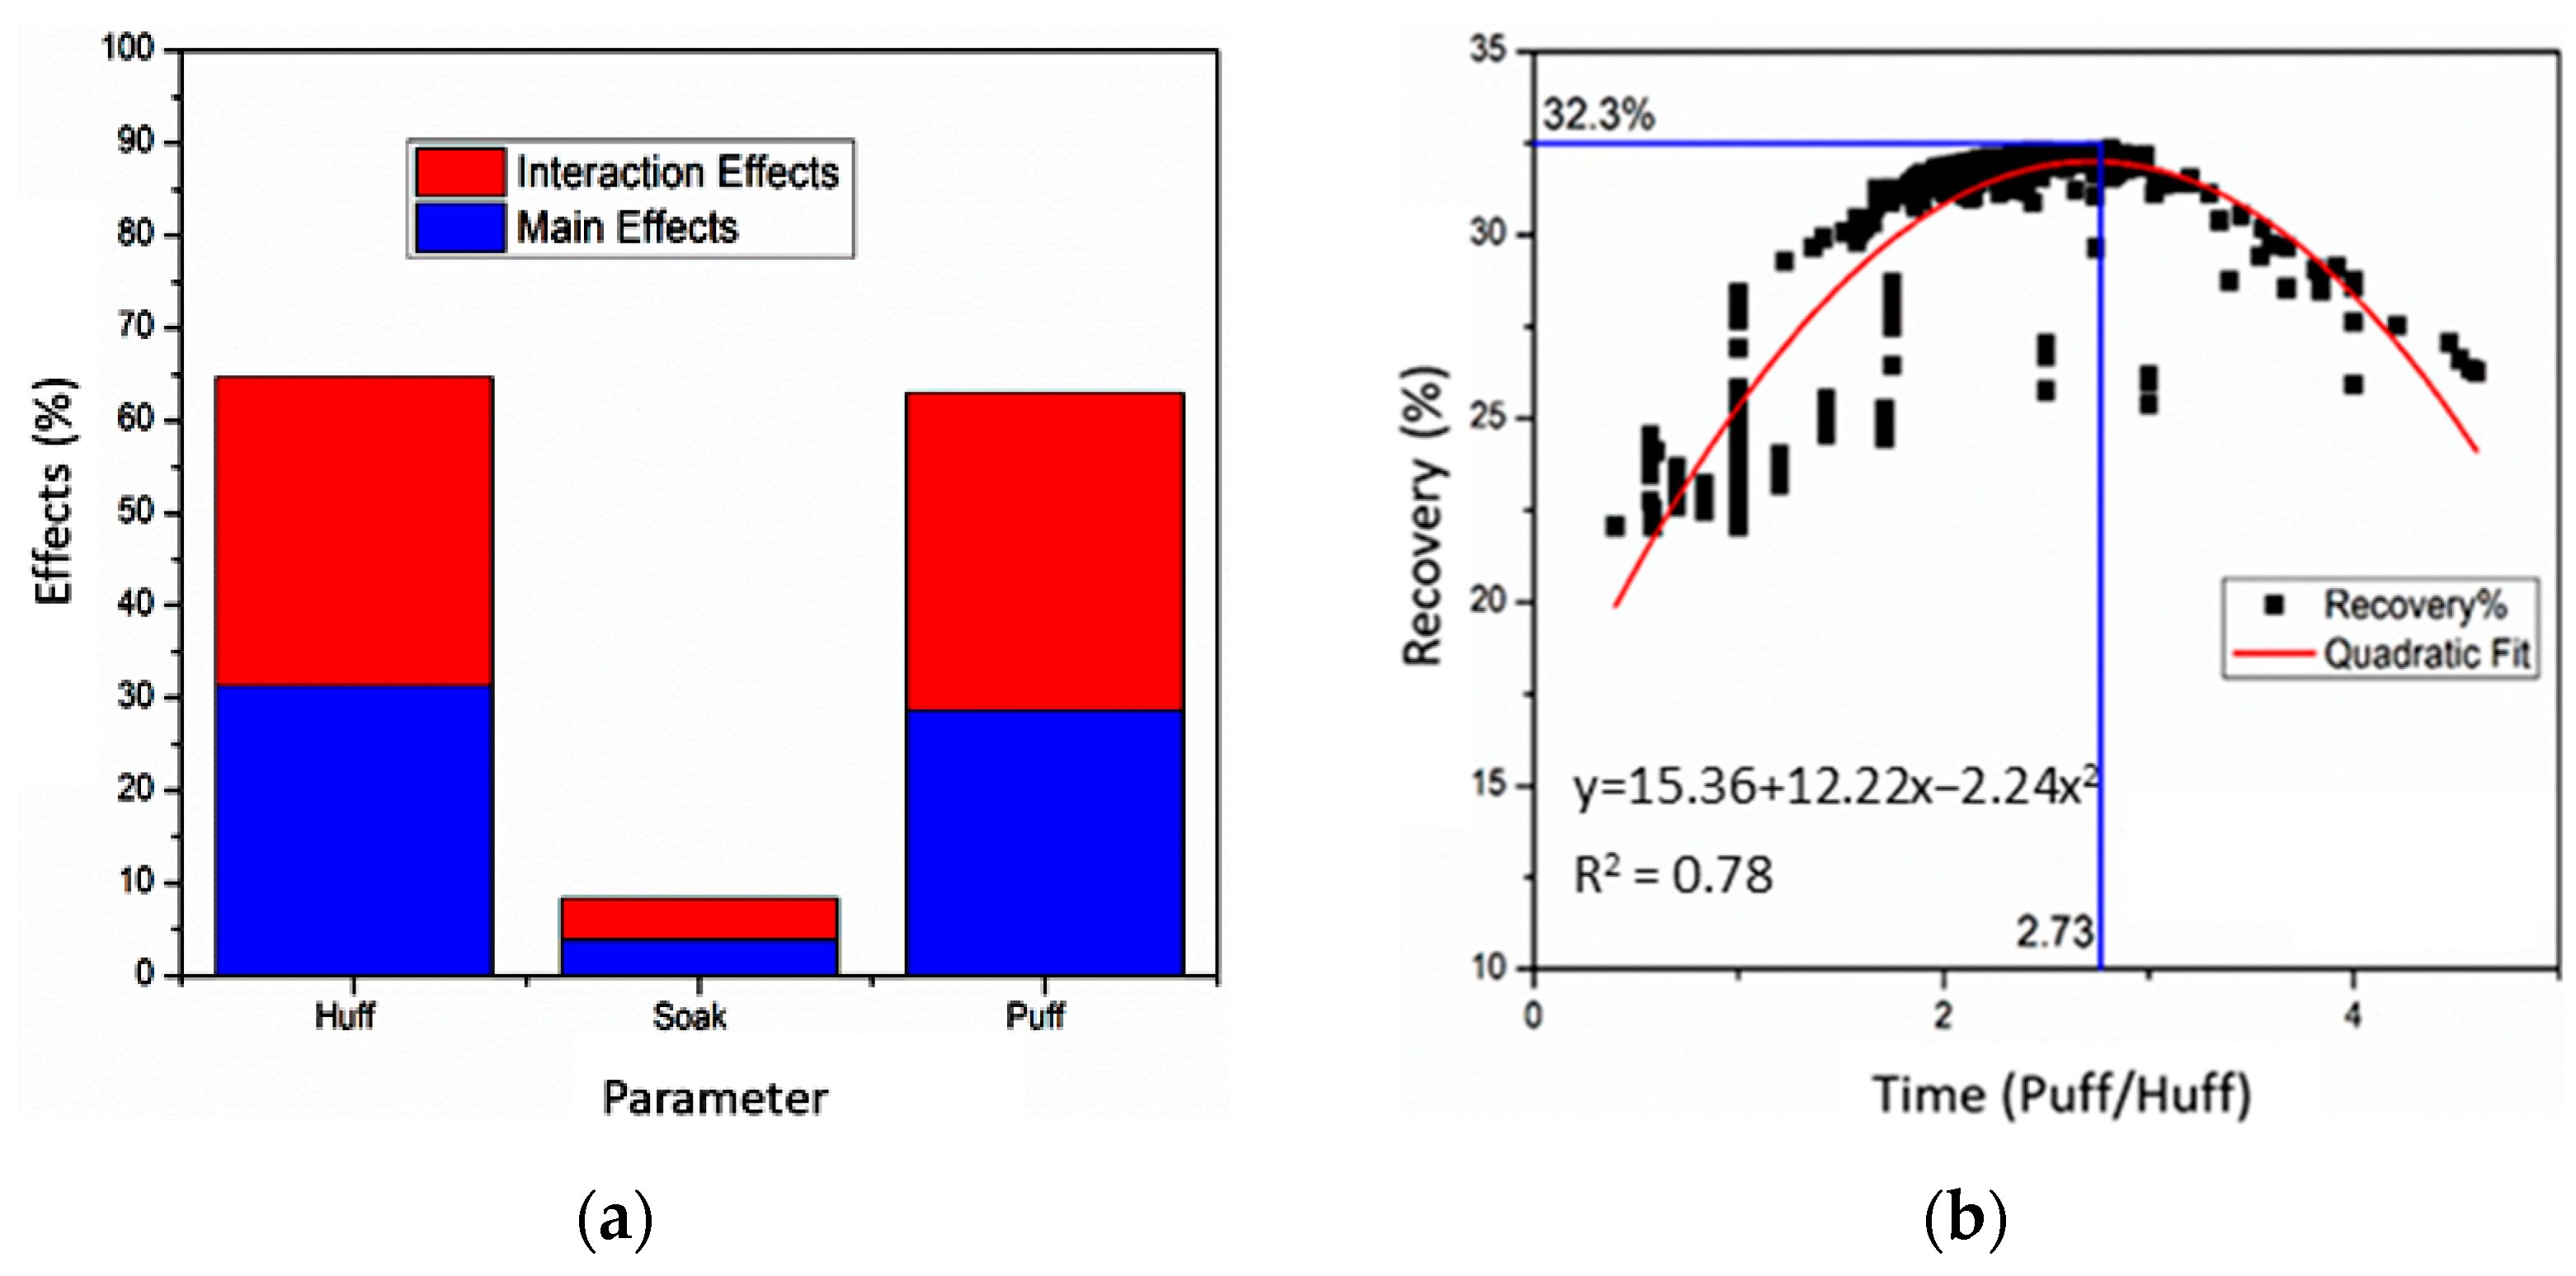
(3)
The injection and production time are the two most important parameters to optimize a CO2 HnP process. However, the soaking period had the least impact on the overall recovery. The ratio of around 2.7 for puff (production) and huff (injection) with a soaking period of fewer than 2.7 days resulted in the most optimal recovery for the base case fluid and reservoir conditions (Figure 9).
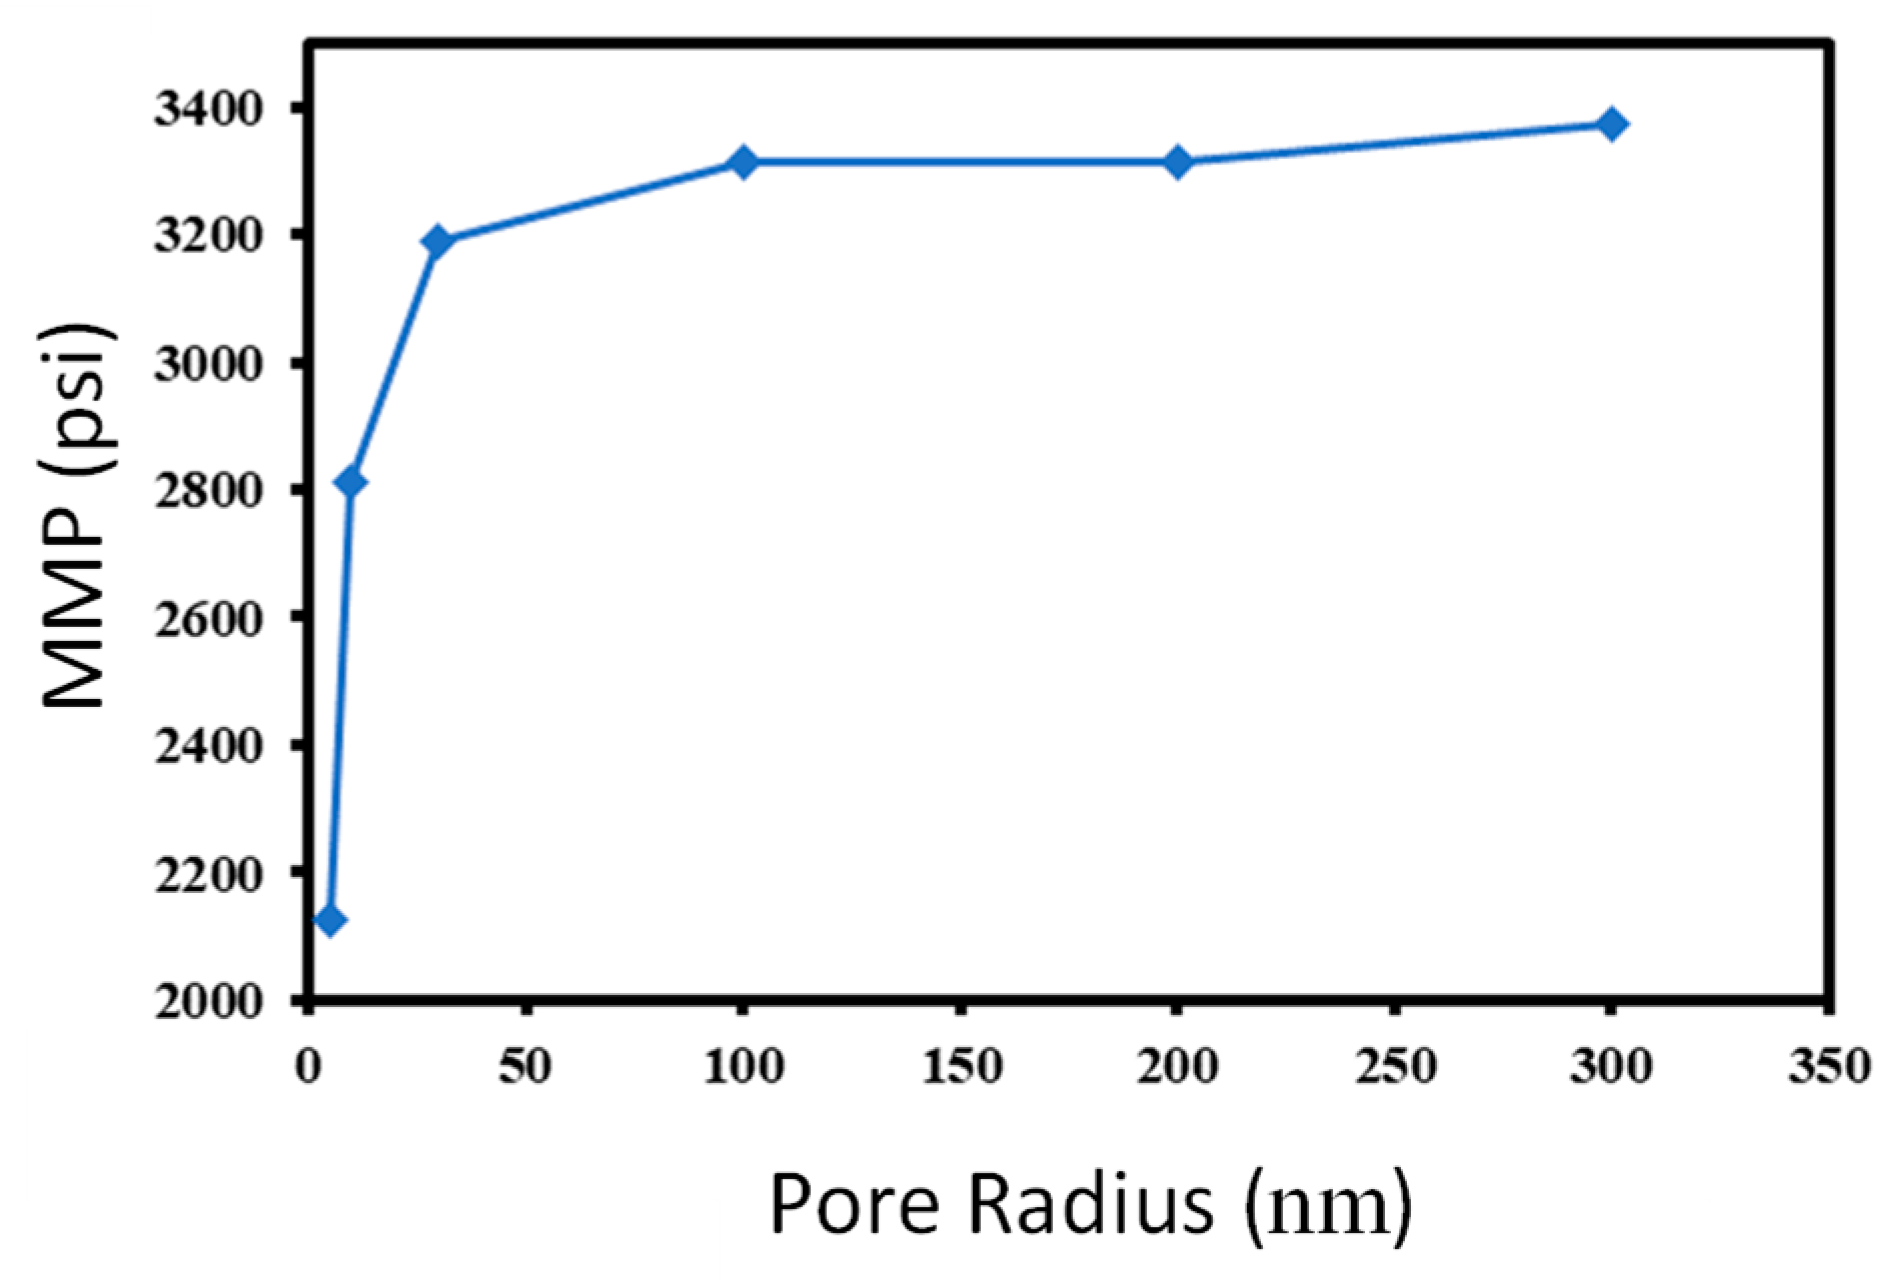
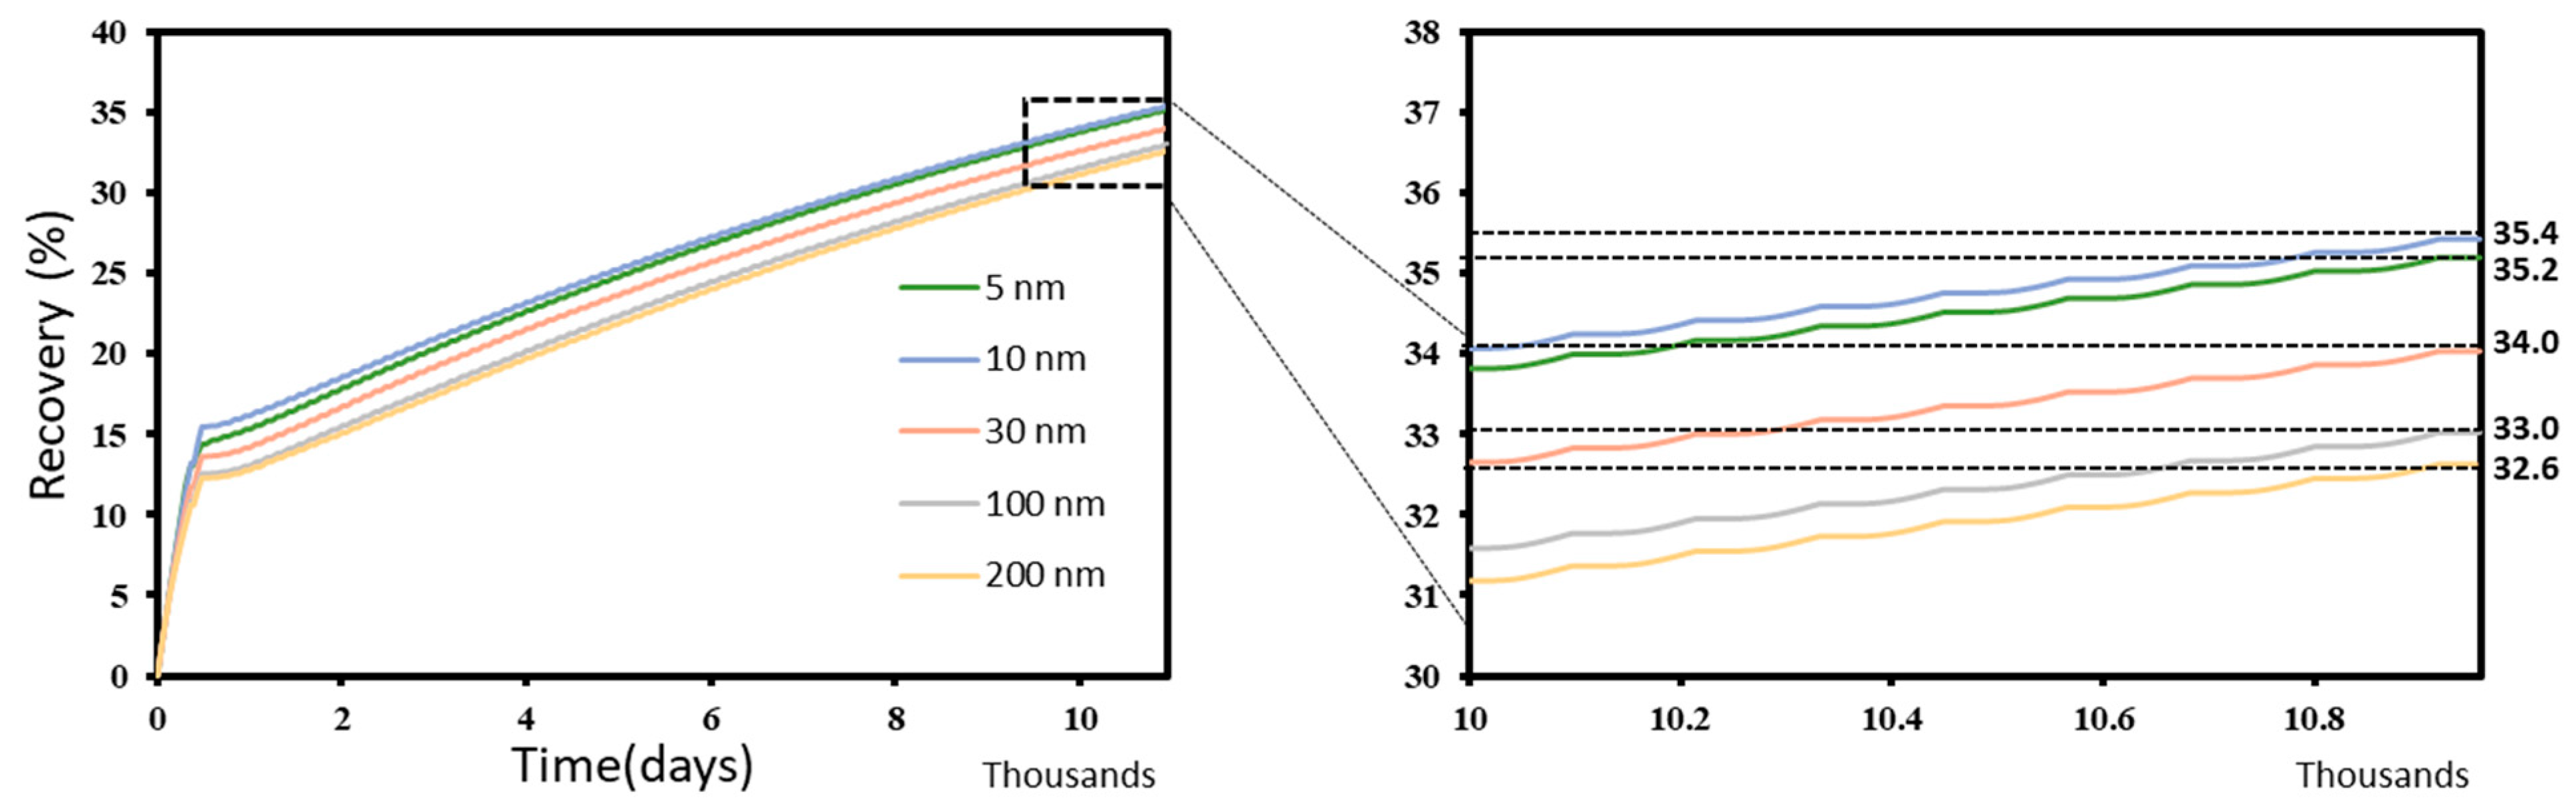
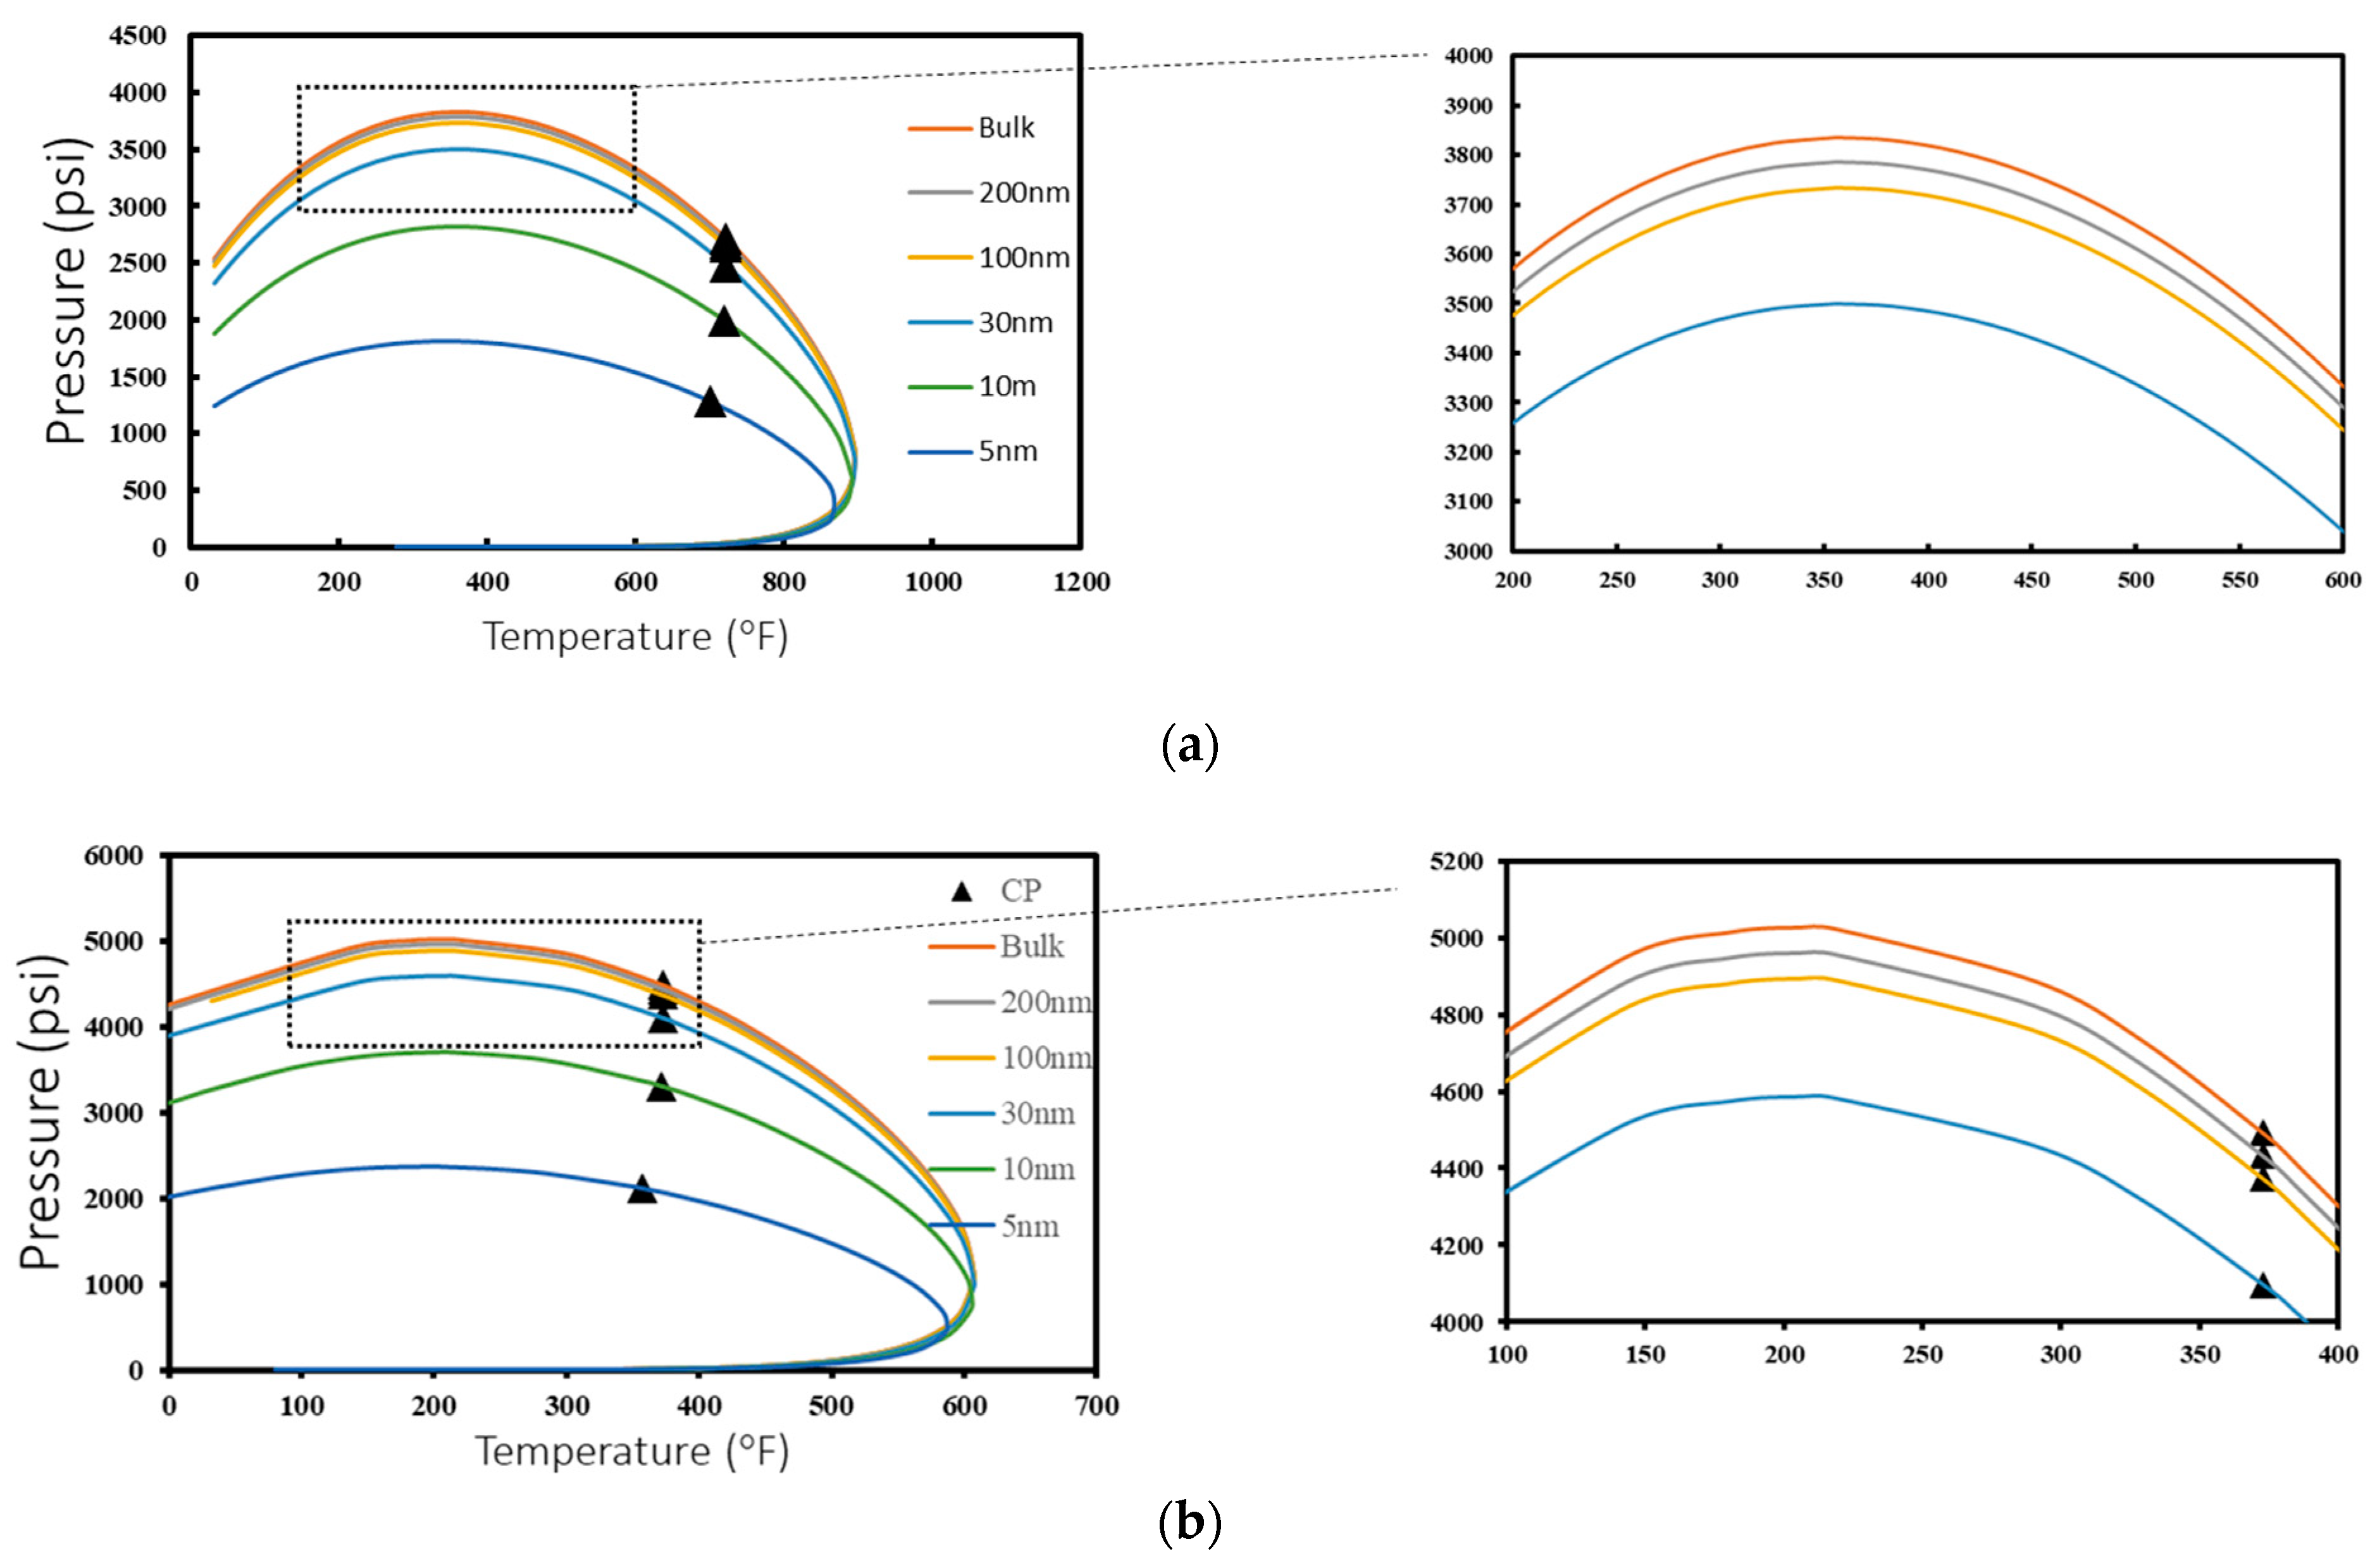
(4)
The confinement effect of nanopores enhances recovery compared to cases with bulk-phase PVT properties. Significant pore confinement (pore sizes ≤ 10 nm) results in around 3.4% additional recovery compared to the case without pore confinement. Hence, reservoir simulators need to include probable pore-size distribution to account for any uncertainty due to the change in PVT properties (Figure 12).
(5)
CO2 EOR results in significantly improved recovery for a reservoir with a significant fraction of light hydrocarbons, with an over 300% increase in recovery compared to around 50% increase in recovery for a sample with a significant fraction of heavy hydrocarbons (C7+) (Figure 15).
(6)
CO2 showed higher effectiveness as an injection solvent than N2 during the HnP process, as CO2 HnP had a higher recovery % than N2 for all the fluid samples at different pore confinement considered in this study (Figure 16).
(7)
Including diffusion resulted in a 40–60% recovery compared to a 30 to 40% recovery when no diffusion was considered. However, it was noteworthy that a lack of accurate diffusivity data can cause inaccuracy in prediction and must be accounted for in calculations (Figure 17).
(8)
The increase in dimensionless fracture conductivity (FCD) can significantly improve the recovery from the CO2 HnP process (Figure 18). However, if the FCD is suboptimal due to fracture deterioration, the recovery can be lower than what is observed from natural depletion.
(9)
Although higher oil recovery is the primary optimization factor considered in this study, the considerable amount of CO2 stored (970 to 1067 ton CO2 per fracture) shows that CO2 HnP could be an effective strategy for managing anthropogenic CO2. Therefore, selecting both CO2 storage and oil recovery as optimization parameters, and prioritizing CO2 storage over oil production could be used if carbon sequestration is the main goal of the project.

Author Contributions

Conceptualization, A.K.; methodology, A.K.; software, A.K. and M.F.S.; validation, A.K. and M.F.S.; investigation, A.K. and M.F.S.; resources, A.K.; data curation, A.K. and M.F.S.; writing—original draft preparation, A.K. and M.F.S.; writing—review and editing, A.K. and M.F.S.; visualization, A.K. and M.F.S.; supervision, A.K.; project administration, A.K.; funding acquisition, A.K. All authors have read and agreed to the published version of the manuscript.

Funding

Acknowledgement is made to the donors of the American Chemical Society Petroleum Research Fund (ACS PRF # 62679-UNI9) for partial support of this research.

Data Availability Statement

Relevant data are included in the manuscript.

Acknowledgments

Acknowledgement is made to the donors of the American Chemical Society Petroleum Research Fund for partial support of this research.

Conflicts of Interest

The authors declare no conflict of interest.

Abbreviations

BHPBottomhole Pressure
EOREnhanced Oil Recovery
GORGas–Oil Ratio
HnPHuff-n-Puff
LGRLogarithmically Refined Grids
MMPMinimum Miscibility Pressure
NDNatural Depletion
NPVNet Present Value
PVTPressure, Volume, and Temperature
VITVanishing Interfacial Tension

References

  1. Raimi, D.; Campbell, E.; Newell, R.G.; Prest, B.; Villanueva, S.; Wingenroth, J. Global Energy Outlook 2022: Turning Points and Tension in the Energy Transition; Resources for the Future: Washington, DC, USA, 2022. [Google Scholar]
  2. Zheng, Z.; Di, Y.; Wu, Y.S. Nanopore confinement effect on the phase behavior of CO2/Hydrocarbons in tight oil reservoirs considering capillary pressure, fluid-wall interaction, and molecule adsorption. Geofluids 2021, 2021, 2435930. [Google Scholar] [CrossRef]
  3. Jha, H.S.; Lee, W.J. Problems With Application of Material Balance Time to Transient Flow Data in Diagnostic Plots. In Proceedings of the 5th Unconventional Resources Technology Conference, London, UK, 15–18 October 2017; American Association of Petroleum Geologists: Tulsa, OK, USA, 2017. [Google Scholar]
  4. Shabib-Asl, A.; Plaksina, T.; Moradi, B. Evaluation of nanopore confinement during CO2 huff and puff process in liquid-rich shale formations. Comput. Geosci. 2020, 24, 1163–1178. [Google Scholar] [CrossRef]
  5. Hawthorne, S.B.; Gorecki, C.D.; Sorensen, J.A.; Steadman, E.N.; Harju, J.A.; Melzer, S. Hydrocarbon mobilization mechanisms from upper, middle, and lower Bakken reservoir rocks exposed to CO2. In Proceedings of the SPE Unconventional Resources Conference Canada 2013, Calgary, AB, Canada, 5–7 November 2013; Volume 2, pp. 920–928. [Google Scholar] [CrossRef]
  6. Gamadi, T.D.; Sheng, J.J.; Soliman, M.Y.; Menouar, H.; Watson, M.C.; Emadibaladehi, H. An experimental study of cyclic CO2 injection to improve shale oil recovery. SPE-DOE Improv. Oil Recover. Symp. Proc. 2014, 3, 1554–1562. [Google Scholar] [CrossRef]
  7. Yu, W.; Lashgari, H.R.; Wu, K.; Sepehrnoori, K. CO2 injection for enhanced oil recovery in Bakken tight oil reservoirs. Fuel 2015, 159, 354–363. [Google Scholar] [CrossRef]
  8. Birol, F.; Cozzi, L.; Bromhead, A.; Gould, T.; Baroni, M. World Energy Outlook 2014; IEA: Paris, French, 2014; p. 726. [Google Scholar]
  9. Langston, M.V.; Hoadley, S.F.; Young, D.N. Definitive Co2 Flooding Response in the Sacroc Unit. In Proceedings of the SPE Enhanced Oil Recovery Symposium, Tulsa, Oklahoma, 16–21 April 1988; pp. 27–34. [Google Scholar] [CrossRef]
  10. Carbon Capture and Sequestration Technologies @ MIT. Century Plant Fact Sheet: Commercial EOR Using Anthropogenic Carbon Dioxide. 2019. Available online: https://sequestration.mit.edu/tools/projects/century_plant.html (accessed on 10 December 2022).
  11. Mohammad, R.S.; Zhang, S.; Haq, E.; Zhao, X.; Lu, S. Carbon Dioxide Minimum Miscibility Pressure with Nanopore Confinement in Tight Oil Reservoirs. In Proceedings of the IOP Conference Series: Earth and Environmental Science 2018, Banda Aceh, Indonesia, 26–27 September 2018. [Google Scholar] [CrossRef]
  12. Song, C.; Yang, D. Experimental and numerical evaluation of CO2 huff-n-puff processes in Bakken formation. Fuel 2017, 190, 145–162. [Google Scholar] [CrossRef]
  13. Alharthy, N.; Teklu, T.; Kazemi, H.; Graves, R.; Hawthorne, S.; Braunberger, J.; Kurtoglu, B. Enhanced oil recovery in liquid-rich shale reservoirs: Laboratory to field. Proc.-SPE Annu. Tech. Conf. Exhib. 2015, 2015, 4450–4478. [Google Scholar] [CrossRef]
  14. Kanfar, M.S.; Clarkson, C.R. Factors affecting huff-n-puff efficiency in hydraulically-fractured tight reservoirs. In Proceedings of the SPE Unconventional Resources Conference, Calgary, AB, Canada, 15–16 February 2017; pp. 636–652. [Google Scholar] [CrossRef]
  15. Chen, C.; Balhoff, M.; Mohanty, K.K. Effect of reservoir heterogeneity on primary recovery and CO2 huff “n” puff recovery in shale-oil reservoirs. SPE Reserv. Eval. Eng. 2014, 17, 404–413. [Google Scholar] [CrossRef]
  16. Enab, K.; Emami-Meybodi, H. Effects of diffusion, adsorption, and hysteresis on huff-n-puff performance in ultratight reservoirs with different fluid types and injection gases. Energies 2021, 14, 7379. [Google Scholar] [CrossRef]
  17. Min, B.; Mamoudou, S.; Dang, S.; Tinni, A.; Sondergeld, C.; Rai, C. Comprehensive experimental study of huff-n-puff enhanced oil recovey in eagle ford: Key parameters and recovery mechanism. In Proceedings of the SPE Improved Oil Recovery Conference, Virtual, 31 August–4 September 2020. [Google Scholar] [CrossRef]
  18. Khanal, A.; Khoshghadam, M.; Jha, H.S.; Lee, W.J. Understanding the effect of nanopores on flow behavior and production performance of liquid-rich shale reservoirs. In Proceedings of the 9th Unconventional Resources Technology Conference, Houston, TX, USA, 26–28 July 2021; American Association of Petroleum Geologists: Tulsa, OK, USA, 2021. [Google Scholar]
  19. Alharthy, N.S.; Teklu, T.W.; Nguyen, T.N.; Kazemi, H.; Graves, R.M. Nanopore compositional modeling in unconventional shale reservoirs. SPE Reserv. Eval. Eng. 2016, 19, 415–428. [Google Scholar] [CrossRef]
  20. Li, L.; Sheng, J.J.; Su, Y.; Zhan, S. Further Investigation of Effects of Injection Pressure and Imbibition Water on CO2 Huff-n-Puff Performance in Liquid-Rich Shale Reservoirs. Energy Fuels 2018, 32, 5789–5798. [Google Scholar] [CrossRef]
  21. Zhang, Y.; Yu, W.; Sepehrnoori, K.; Di, Y. Investigation of nanopore confinement on fluid flow in tight reservoirs. J. Pet. Sci. Eng. 2017, 150, 265–271. [Google Scholar] [CrossRef]
  22. Shoaib, S.; Hoffman, B.T. CO2 Flooding the Elm Coulee Field. In Proceedings of the SPE Rocky Mountain Petroleum Technology Conference, Denver, CO, USA, 14–16 April 2009. [Google Scholar]
  23. Khanal, A.; Weijermars, R. Visualization of drained rock volume (DRV) in hydraulically fractured reservoirs with and without natural fractures using complex analysis methods (CAMs). Pet. Sci. 2019, 16, 550–577. [Google Scholar] [CrossRef] [Green Version]
  24. Boling, K.S.; Dworkin, S.I. Origin of organic matter in the Eagle Ford Formation. Interpretation 2015, 3, SH27–SH39. [Google Scholar] [CrossRef]
  25. Khanal, A.; Weijermars, R. Pressure depletion and drained rock volume near hydraulically fractured parent and child wells. J. Pet. Sci. Eng. 2019, 172, 607–626. [Google Scholar] [CrossRef]
  26. Khanal, A.; Khoshghadam, M.; Lee, W.J.; Nikolaou, M. New forecasting method for liquid rich shale gas condensate reservoirs with data driven approach using principal component analysis. J. Nat. Gas Sci. Eng. 2017, 38, 621–637. [Google Scholar] [CrossRef]
  27. Khoshghadam, M.; Khanal, A.; Lee, W.J. Numerical study of production mechanisms and gas-oil ratio behavior of liquid-rich shale oil reservoirs. In Proceedings of the SPE Annual Technical Conference and Exhibition, Houston, TX, USA, 28–30 September 2015; Volume 2015. [Google Scholar]
  28. Khanal, A.; Khoshghadam, M.; Makinde, I.; Lee, W.J. Modeling production decline in liquid rich shale (LRS) gas condensate reservoirs. In Proceedings of the Society of Petroleum Engineers—SPE/CSUR Unconventional Resources Conference, Calgary, AB, Canada, 20–22 October 2015. [Google Scholar]
  29. Khanal, A.; Khoshghadam, M.; Lee, W.J. Effect of well spacing on productivity of Liquid Rich Shale (LRS) reservoirs with multiphase flow: A simulation study. In Proceedings of the Society of Petroleum Engineers—SPE Liquids-Rich Basins Conference—North America, Midland, TX, USA, 2–3 September 2015. [Google Scholar]
  30. Li, L.; Su, Y.; Sheng, J.J.; Hao, Y.; Wang, W.; Lv, Y.; Zhao, Q.; Wang, H. Experimental and Numerical Study on CO2 Sweep Volume during CO2 Huff-n-Puff Enhanced Oil Recovery Process in Shale Oil Reservoirs. Energy Fuels 2019, 33, 4017–4032. [Google Scholar] [CrossRef]
  31. Lee, J.H.; Lee, K.S. Investigation of asphaltene-derived formation damage and nano-confinement on the performance of CO2 huff-n-puff in shale oil reservoirs. J. Pet. Sci. Eng. 2019, 182, 106304. [Google Scholar] [CrossRef]
  32. Carlsen, M.L.; Mydland, S.; Dahouk, M.M.; Whitson, C.H.; Yusra, I.; Thuesen, M.; Ambrose, R.; Nohavitza, J. Compositional Tracking of a Huff-n-Puff Project in the Eagle Ford: A Second Take. In Proceedings of the SPE/AAPG/SEG Unconventional Resources Technology Conference, Virtual, 20–22 July 2020. [Google Scholar] [CrossRef]
  33. Kurtoglu, B. Integrated Reservoir Characterization and Modeling in Support of Enhanced Oil Recovery for Bakken; Colorado School of Mines: Golden, CO, USA, 2013. [Google Scholar]
  34. Wang, X.; Luo, P.; Er, V.; Huang, S. Assessment of CO2 flooding potential for bakken formation, Saskatchewan. In Proceedings of the Canadian Unconventional Resources and International Petroleum Conference, Calgary, AB, Canada, 19–21 October 2010; Volume 3, pp. 2003–2016. [Google Scholar] [CrossRef]
  35. Teklu, T.W.; Ghedan, S.G.; Graves, R.M.; Yin, X. Minimum miscibility pressure determination: Modified multiple mixing cell method. In Proceedings of the SPE EOR Conference at Oil and Gas West Asia 2012, Muscat, Oman, 16–18 April 2012; Volume 2, pp. 707–719. [Google Scholar] [CrossRef]
  36. Salahshoor, S.; Fahes, M.; Teodoriu, C. A review on the effect of confinement on phase behavior in tight formations. J. Nat. Gas Sci. Eng. 2018, 51, 89–103. [Google Scholar] [CrossRef]
  37. Dong, X.; Liu, H.; Hou, J.; Wu, K.; Chen, Z. Phase Equilibria of Confined Fluids in Nanopores of Tight and Shale Rocks Considering the Effect of Capillary Pressure and Adsorption Film. Ind. Eng. Chem. Res. 2016, 55, 798–811. [Google Scholar] [CrossRef]
  38. Jin, L.; Ma, Y.; Jamili, A. Investigating the effect of pore proximity on phase behavior and fluid properties in shale formations. In Proceedings of the SPE Annual Technical Conference and Exhibition 2013, New Orleans, LA, USA, 30 September–2 October 2013; Volume 2, pp. 1422–1437. [Google Scholar] [CrossRef]
  39. Wu, D.; Chen, S. A modified Peng-Robinson equation of state. Chem. Eng. Commun. 1997, 156, 215–225. [Google Scholar] [CrossRef]
  40. Yang, G.; Li, X. Modified Peng-Robinson equation of state for CO2/hydrocarbon systems within nanopores. J. Nat. Gas Sci. Eng. 2020, 84, 103700. [Google Scholar] [CrossRef]
  41. Lake, L.W. Enhanced Oil Recovery, 1st ed.; Prentice Hall: Hoboken, NJ, USA, 1996; ISBN 0132816016. [Google Scholar]
  42. Junin, R.; Milad, M.; Sidek, A.; Imqam, A.; Tarhuni, M. Huff-n-puff technology for enhanced oil recovery in shale/tight oil reservoirs: Progress, gaps, and perspectives. Energy Fuels 2021, 35, 17279–17333. [Google Scholar] [CrossRef]
  43. Li, L.; Su, Y.; Hao, Y.; Zhan, S.; Lv, Y.; Zhao, Q.; Wang, H. A comparative study of CO2 and N2 huff-n-puff EOR performance in shale oil production. J. Pet. Sci. Eng. 2019, 181, 106174. [Google Scholar] [CrossRef]
  44. Wan, T.; Mu, Z. The use of numerical simulation to investigate the enhanced Eagle Ford shale gas condensate well recovery using cyclic CO2 injection method with nano-pore effect. Fuel 2018, 233, 123–132. [Google Scholar] [CrossRef]
  45. Wang, L.; Tian, Y.; Yu, X.; Wang, C.; Yao, B.; Wang, S.; Winterfeld, P.H.; Wang, X.; Yang, Z.; Wang, Y.; et al. Advances in improved/enhanced oil recovery technologies for tight and shale reservoirs. Fuel 2017, 210, 425–445. [Google Scholar] [CrossRef]
  46. Mukherjee, S.; Dang, S.T.; Rai, C.S.; Sondergeld, C.H. Measurement of oil-gas diffusivity at reservoir conditions for huff-n-puff EOR in shales. In Proceedings of the SPE Improved Oil Recovery Conference 2020, Virtual, 31 August–4 September 2020. [Google Scholar] [CrossRef]
  47. Sun, R.; Yu, W.; Xu, F.; Pu, H.; Miao, J. Compositional simulation of CO2 Huff-n-Puff process in Middle Bakken tight oil reservoirs with hydraulic fractures. Fuel 2019, 236, 1446–1457. [Google Scholar] [CrossRef]
  48. Yu, W.; Zhang, Y.; Varavei, A.; Sepehrnoori, K.; Zhang, T.; Wu, K.; Miao, J. Compositional simulation of CO2 huff’n’ puff in eagle ford tight oil reservoirs with CO2 molecular diffusion, nanopore confinement, and complex natural fractures. SPE Reserv. Eval. Eng. 2019, 22, 492–508. [Google Scholar] [CrossRef]
  49. Yu, W.; Lashgari, H.R.; Sepehrnoori, K. Simulation study of CO2 huff-n-puff process in Bakken tight oil reservoirs. In Proceedings of the SPE Western North American and Rocky Mountain Joint Meeting 2014, Denver, CO, USA, 17–18 April 2014; Volume 2, pp. 881–896. [Google Scholar]
  50. Alzahabi, A.; Kamel, A.; Harouaka, A.; Trindade, A.A. A Model for Estimating Optimal Spacing of the Wolfcamp in the Delaware Basin. In Proceedings of the 8th Unconventional Resources Technology Conference, Virtual, 20–22 July 2020; American Association of Petroleum Geologists: Tulsa, OK, USA, 2020. [Google Scholar]
  51. Alzahabi, A.; Trindade, A.A.; Kamel, A.; Harouaka, A. Optimizing initial oil production of horizontal Wolfcamp wells utilizing data analytics. J. Pet. Explor. Prod. Technol. 2020, 10, 2357–2371. [Google Scholar] [CrossRef]
  52. Alzahabi, A.; Alexandre Trindade, A.A.; Kamel, A.A.; Harouaka, A.; Baustian, W.; Campbell, C. Optimal Drawdown for Woodford and Mayes in the Anadarko Basin Using Data Analytics. SPE Prod. Oper. 2021, 36, 572–582. [Google Scholar] [CrossRef]
  53. Ma, Y.Z.; Holditch, S. Unconventional Oil and Gas Resources Handbook; Gulf Professional Publishing: Houston, TX, USA, 2015; ISBN 9780128022382. [Google Scholar]
  54. Belyadi, H.; Fathi, E.; Belyadi, F. Hydraulic Fracturing in Unconventional Reservoirs; Gulf Professional Publishing: Houston, TX, USA, 2019; ISBN 9780128498712. [Google Scholar]
  55. Cinco-Ley, H.; Samaniego, F. Transient Pressure Analysis for Fractured Wells. JPT J. Pet. Technol. 1981, 33, 1749–1766. [Google Scholar] [CrossRef]
  56. Shahriar, M.F.; Khanal, A. The current techno-economic, environmental, policy status and perspectives of sustainable aviation fuel (SAF). Fuel 2022, 325, 124905. [Google Scholar] [CrossRef]
  57. Zhou, X.; Li, X.; Shen, D.; Shi, L.; Zhang, Z.; Sun, X.; Jiang, Q. CO2 huff-n-puff process to enhance heavy oil recovery and CO2 storage: An integration study. Energy 2022, 239, 122003. [Google Scholar] [CrossRef]
  58. Khanal, A.; Shahriar, M.F. Physics-Based Proxy Modeling of CO2 Sequestration in Deep Saline Aquifers. Energies 2022, 15, 4350. [Google Scholar] [CrossRef]
  59. Seinfeld, J.H.; Pandis, S.N. Atmospheric Chemistry and Physics; John Wiley & Sons: New York, NY, USA, 2006; Volume 5, ISBN 0195093623. [Google Scholar]
  60. Jin, L.; Hawthorne, S.; Sorensen, J.; Pekot, L.; Kurz, B.; Smith, S.; Heebink, L.; Herdegen, V.; Bosshart, N.; Torres, J.; et al. Advancing CO2 enhanced oil recovery and storage in unconventional oil play—Experimental studies on Bakken shales. Appl. Energy 2017, 208, 171–183. [Google Scholar] [CrossRef]
  61. Li, X.; Elsworth, D. Geomechanics of CO2 enhanced shale gas recovery. J. Nat. Gas Sci. Eng. 2014, 26, 1607–1619. [Google Scholar] [CrossRef]
  62. Aljamaan, H.; Holmes, R.; Vishal, V.; Haghpanah, R.; Wilcox, J.; Kovscek, A.R. CO2 Storage and Flow Capacity Measurements on Idealized Shales from Dynamic Breakthrough Experiments. Energy Fuels 2017, 31, 1193–1207. [Google Scholar] [CrossRef]
  63. Liu, F.; Ellett, K.; Xiao, Y.; Rupp, J.A. Assessing the feasibility of CO2 storage in the New Albany Shale (Devonian-Mississippian) with potential enhanced gas recovery using reservoir simulation. Int. J. Greenh. Gas Control 2013, 17, 111–126. [Google Scholar] [CrossRef]
  64. Teklu, T.W.; Alharthy, N.; Kazemi, H.; Yin, X.; Graves, R.M.; AlSumaiti, A.M. Phase Behavior and Minimum Miscibility Pressure in Nanopores. SPE Reserv. Eval. Eng. 2014, 17, 396–403. [Google Scholar] [CrossRef]
  65. Pitakbunkate, T.; Balbuena, P.B.; Moridis, G.J.; Blasingame, T.A. Effect of confinement on pressure/volume/temperature properties of hydrocarbons in shale reservoirs. SPE J. 2016, 21, 621–634. [Google Scholar] [CrossRef]
Figure 1. CO2 EOR strategies. (a) Continuous injection process; (b) CO2 HnP strategy. The red and green arrows, respectively, represent gas injection and oil production.
Energies 16 02311 g001
Figure 2. Map view of the base case (H1) and neighboring wells in the study area. The well is located in the lower Eagle Ford above the top Buda limestone [25].
Energies 16 02311 g002
Figure 3. The end-point relative permeability for (a) Kr vs. Sw; (b) Kr vs. Sl [25].
Energies 16 02311 g003
Figure 4. Symmetric fracture element used for simulation.
Energies 16 02311 g004
Figure 5. (a) Oil rate; (b) cumulative oil production and recovery percentage over time. ND: Natural depletion; HnP: huff-n-puff.
Energies 16 02311 g005
Figure 6. Average pressure over time. ND: Natural depletion; HnP: huff-n-puff.
Energies 16 02311 g006
Figure 7. Recovery percentage over time for all simulations.
Energies 16 02311 g007
Figure 8. Average pressure and recovery percentage over time for (a) optimized HnP scenario; (b) suboptimal case.
Energies 16 02311 g008
Figure 9. (a) Effects between primary parameters; (b) quadratic fit model of recovery vs. HnP.
Energies 16 02311 g009
Figure 10. Base case fluid pressure change with respect to temperature for different pore sizes (CP: critical point).
Energies 16 02311 g010
Figure 11. Base case fluid minimum miscibility pressure change with respect to pore radius.
Energies 16 02311 g011
Figure 12. Recovery percentage over time for different pore confinements.
Energies 16 02311 g012
Figure 13. Pressure changes with respect to temperature for different pore sizes for (a) Sample 2, (b) Sample 3.
Energies 16 02311 g013
Figure 14. Minimum miscibility pressure change for Sample 2 and Sample 3 fluid with respect to pore radius.
Energies 16 02311 g014
Figure 15. (a) Cumulative oil (bbl) and (b) recovery (%) for different pore confinement.
Energies 16 02311 g015
Figure 16. Comparison of recovery (%) for N2 and CO2 HnP scenarios for fluid samples at different pore confinement.
Energies 16 02311 g016
Figure 17. Effect of diffusion in (a) cumulative oil production and (b) recovery (%) in CO2 HnP scenario for fluid samples at different pore confinement.
Energies 16 02311 g017
Figure 18. Recovery percentage over time with respect to different fracture conductivity for (a) natural depletion and (b) HnP scenario.
Energies 16 02311 g018
Figure 19. Percentage of CO2 stored during CO2 HnP scenarios for fluid samples at different pore confinement.
Energies 16 02311 g019
Table 1. Reservoir parameters used for this study.
ParametersValuesUnits
Well Length6550ft
Initial Reservoir Pressure4891psia
Reservoir Temperature220°F
Total Compressibility3 × 10−6psi−1
Permeability600nD
Fracture Half-length625ft
Number of Fractures131
Fracture Spacing50ft
Fracture Stages22
Fracture Width0.01ft
Fracture Permeability300mD
Fracture Height60ft
Fluid PropertiesTable 2
Net Pay60Ft
Porosity4.5%
Initial Oil Saturation0.85
Table 2. Extended PVT properties of the representative base case reservoir fluid.
ComponentMole. FracPc (atm)Tc (K)Acentric FactorMol. WtVc (L/mol)S.GParachor
CH438.5245.4190.60.00816.00.0990.377
C2H64.9348.2305.40.09830.10.1480.356108
C3H82.7541.9369.80.15244.10.2030.507150.3
IC40.6336408.10.17658.10.2630.563181.5
NC41.0937.5425.20.19358.10.2550.584189.9
IC50.5033.4460.40.22772.20.3060.625225
NC50.5333.3469.60.25172.20.3040.631231.5
FC60.7532.46507.50.275860.3440.69250.1
C07–C1126.9828.71545.10.307103.90.4090.711300.6
C12–C167.3318.19684.70.553192.70.7400.788529.3
C17–C236.5613.94767.30.733274.71.0140.832709.9
C24–C293.4311.15838.20.941367.01.2910.867877.7
C300.4410.05872.51.036419.21.4340.884956.0
C31+5.567.419811.288612.21.8820.9331141.5
Table 3. Properties of Sample 2 and Sample 3 fluid ((a): composition; (b): tuning parameters).
(a)
Sample 2Sample 3
ComponentMole Frac.ComponentMole Frac.
CH449.9CH467.44
C2H66.4C2H68.27
C3H83.6C3H84.63
IC40.8IC41.07
NC41.4NC41.82
IC50.6IC50.83
NC50.7NC50.89
FC61.0FC61.27
C7+35.5C7+13.79
(b)
PropertiesSample 2Sample 3
Sat. Pressure (psi)32654754
GOR, scf/STB10004000
° API4044.5
C7+ Mol. Wt.195164
C7+ Mol%34.8813.78
Std. Gravity C7+0.810.79
Table 4. The deviation in critical properties due to the pore confinement effect.
Sample 1Sample 2Sample 3
Pore Size (nm)Pc (bar)   Δ Tc (°F)   Δ Pc (bar)   Δ Tc (°F)   Δ Pc (bar)   Δ Tc (°F)   Δ
323088.0751−13.432688.0618−14.354088.0300−19.6
590152.8842−2.89128152.8699−3.09212152.8357−4.21
10140526.48670.00199626.4719−0.38330626.4371−0.51
3017418.88670.0024738.8721−0.0140978.8373−0.02
10018582.68670.0026402.67210.0043732.63730.00
20018831.38670.0026761.37210.0044321.33730.00
Bulk *19080.08670.0027120.07210.0044920.03730.00
* Bulk properties calculated with original fluid properties.
Disclaimer/Publisher’s Note: The statements, opinions and data contained in all publications are solely those of the individual author(s) and contributor(s) and not of MDPI and/or the editor(s). MDPI and/or the editor(s) disclaim responsibility for any injury to people or property resulting from any ideas, methods, instructions or products referred to in the content.

