Article

Effects of the Wavelength for the Sinusoidal Cylinder and Reynolds Number for Three-Dimensional Mixed Convection

1
Research Institute of Medium & Small Shipbuilding, Busan 46757, Republic of Korea
2
School of Mechanical Engineering, Pusan National University, Busan 46241, Republic of Korea
3
College of Mechatronics Engineering, Changwon National University, Changwon 51140, Republic of Korea
*
Authors to whom correspondence should be addressed.
Energies 2023, 16(6), 2550; https://doi.org/10.3390/en16062550
Submission received: 13 February 2023 / Revised: 24 February 2023 / Accepted: 6 March 2023 / Published: 8 March 2023
(This article belongs to the Section J1: Heat and Mass Transfer)

Abstract

:
A numerical study estimated the mixed convection around a sinusoidal cylinder inside a rectangular cavity. The key parameters for sinusoidal circular cylinders were the wavelength and Reynolds number (Re = 100, 500, and 1000) with a fixed Prandtl number of 0.7. The flow regimes were greatly affected by these parameters. The unsteadiness of the flow pattern was also affected by λ and Re. The results were analyzed by the thermal structure, vortical structure, and Nusselt number. Furthermore, the orthogonal enstrophy was used to quantify the three-dimensional flow characteristics, and the frequency of the surface-averaged Nusselt number for the heated bottom wall was used to analyze the unsteady characteristics. The heat transfer performance was enhanced by 6.6% at Re = 100 for λ = 3 compared to the circular cylinder. In addition, the heat transfer performance was enhanced by 6.6% and 2.6% at Re = 500 for λ = 2 and Re = 1000 for λ = 1, respectively, compared to the circular cylinder.

1. Introduction

The convective heat transfer concerned with mixed convection, which is a combination of natural and forced convections, on engineering phenomena have been examined. Convective heat transfer has attracted interest in many sciences, including geology, oceanography, climatology, and astrophysics. Regarding the practical application, a shear-driven flow, commonly known as a lid-driven flow, in a rectangular channel is one of the important configurations which has been become a critically acclaimed area of research due to its applications in nuclear reactors cooled during emergency shutdown, heat exchangers placed in a low-velocity environment, and thermal-hydraulics of nuclear reactors. The particular case of a thermal system comprising a rectangular enclosure with an inner cylinder is found in shell and tube heat exchangers, storage water tanks, and electronic chip cooling systems. For this reason, many studies have examined the complex physical phenomena associated with forced and natural convections.
Previous studies on natural convection in a cavity without a cylinder investigated the deviation of flow patterns to Rayleigh number (Ra) [1,2,3]. Ozoe et al. [1] considered three different 3D configurations: infinite horizontal plates and channels with a cubical enclosure. They reported that the steady convective mode was 2D in 2000 ≤ Ra ≤ 8000. Busse and Clever [2] examined the effect of Ra on natural convection in a channel in 103Ra ≤ 105. They reported that the knot instability caused a transition to spoke-pattern convection at higher Ra. Hartlep et al. [3] studied a very intensive investigation on the effect of Ra on the thermal convection between two parallel plates at Ra between 103 and 107. They reported that the turbulent convection at a high Ra was governed by the properties of the thermal boundary layers.
Previous studies on 3D natural convection around a cylinder [4,5] observed the characteristics of 3D and an unsteady flow in a cavity at a relatively high Ra. In addition, the unsteadiness of the flow pattern and the heat transfer performance was influenced by the presence of a circular cylinder. Choi et al. [4] examined 3D natural convection around a cylinder inside a channel in 103Ra ≤ 106. They reported that the 2D simulation results are unsuitable for 3D simulation results of the natural convection around a cylinder inside a channel. Seo et al. [5] examined 3D natural convective heat transfer containing elliptical and circular cylinders in the Rayleigh number range of 104Ra ≤ 106. They reported that the rate of heat transfer was affected by the radius of the cylinders.
Previous studies on mixed convection investigated 2D mixed convection without a blockage [6,7,8,9] or containing blockages of various shapes [10,11,12,13,14,15,16]. Oztop et al. [10] investigated mixed convection around a circular blockage inside a cavity in 105Gr ≤ 107. They found the heat transfer rate was affected by the inner blockage. Islam et al. [11] studied the mixed convection around a square cylinder inside a cavity in the Richardson number range of 0.01 ≤ Ri ≤ 100. Liao and Lin [12] studied mixed and natural convective heat transfer around a rotating cylinder for different Rayleigh numbers within the range of 104–106. The heat transfer characteristics were affected by the axis ratio and inclination angle of the elliptical body. Gangawane [13] studied the mixed convection around a heated triangular block inside a cavity for different Reynolds numbers (Re = 1, 10, 50, 100, 500, and 1000), Prandtl numbers (Pr = 1, 50, and 100), and Grashof numbers (Gr = 0, 102, 103, 104, and 105). They reported that the heat transfer performance increased with increasing Reynolds number. Additionally, the critical (Recr) and stagnant (Restag) Reynolds numbers (Re) for heat transfer were identified. Gupta et al. [14] investigated the mixed convection within a ventilated cavity in the presence of a heat-conducting circular cylinder in 0 ≤ Ri ≤ 5. They reported that the heat transfer rate was greatly affected by the cylinder size. Billah et al. [15] examined the mixed convection around a heated circular hollow cylinder in 0 ≤ Ri ≤ 5. They found that the heat transfer performance strongly depended on the cylinder diameter and solid–fluid thermal conductivity ratio.
Most studies on mixed convection were conducted in 2D simulations due to the limitation of the computational resources required for 3D simulations. On the other hand, 2D simulations assumed that the domain extends to the infinite in the spanwise direction. According to the results of the previous study on 3D natural convection, the unsteady characteristics and the 3D flow were generated at a relatively high Ra. In addition, there was a difference in the results of 2D and 3D simulations on natural convection from a cylinder. On the other hand, there have been relatively few studies on 3D mixed convection [17,18,19,20]. Iwatsu and Hyun [17] and Quertatani et al. [18] examined 3D mixed convection in a cavity without a blockage. They found that three-dimensionalities of the thermal fields were observed at a relatively high Re. Cho et al. [19,20] conducted a 3D simulation to study the effects of Re and cylinder shape on the mixed convection for different the Reynolds numbers (Re = 100, 500, and 1000). They reported that the flow pattern and heat transfer performance were affected strongly by Re and the gap between the enclosure and cylinder.
However, there are very few studies which investigate the interactive effects of three-dimensionality and unsteadiness present in an enclosure with a three-dimensional shape of an inner body on mixed convective flow and heat transfer performances. Thus, we focused on the effect of λ for the sinusoidal cylinder in a rectangular cavity. The distributions of temperature, vortical structures, orthogonal enstrophy, and surface-averaged Nusselt numbers were analyzed to determine the effects of the wavelength (λ) of the sinusoidal cylinder and Re.

2. Numerical Simulation

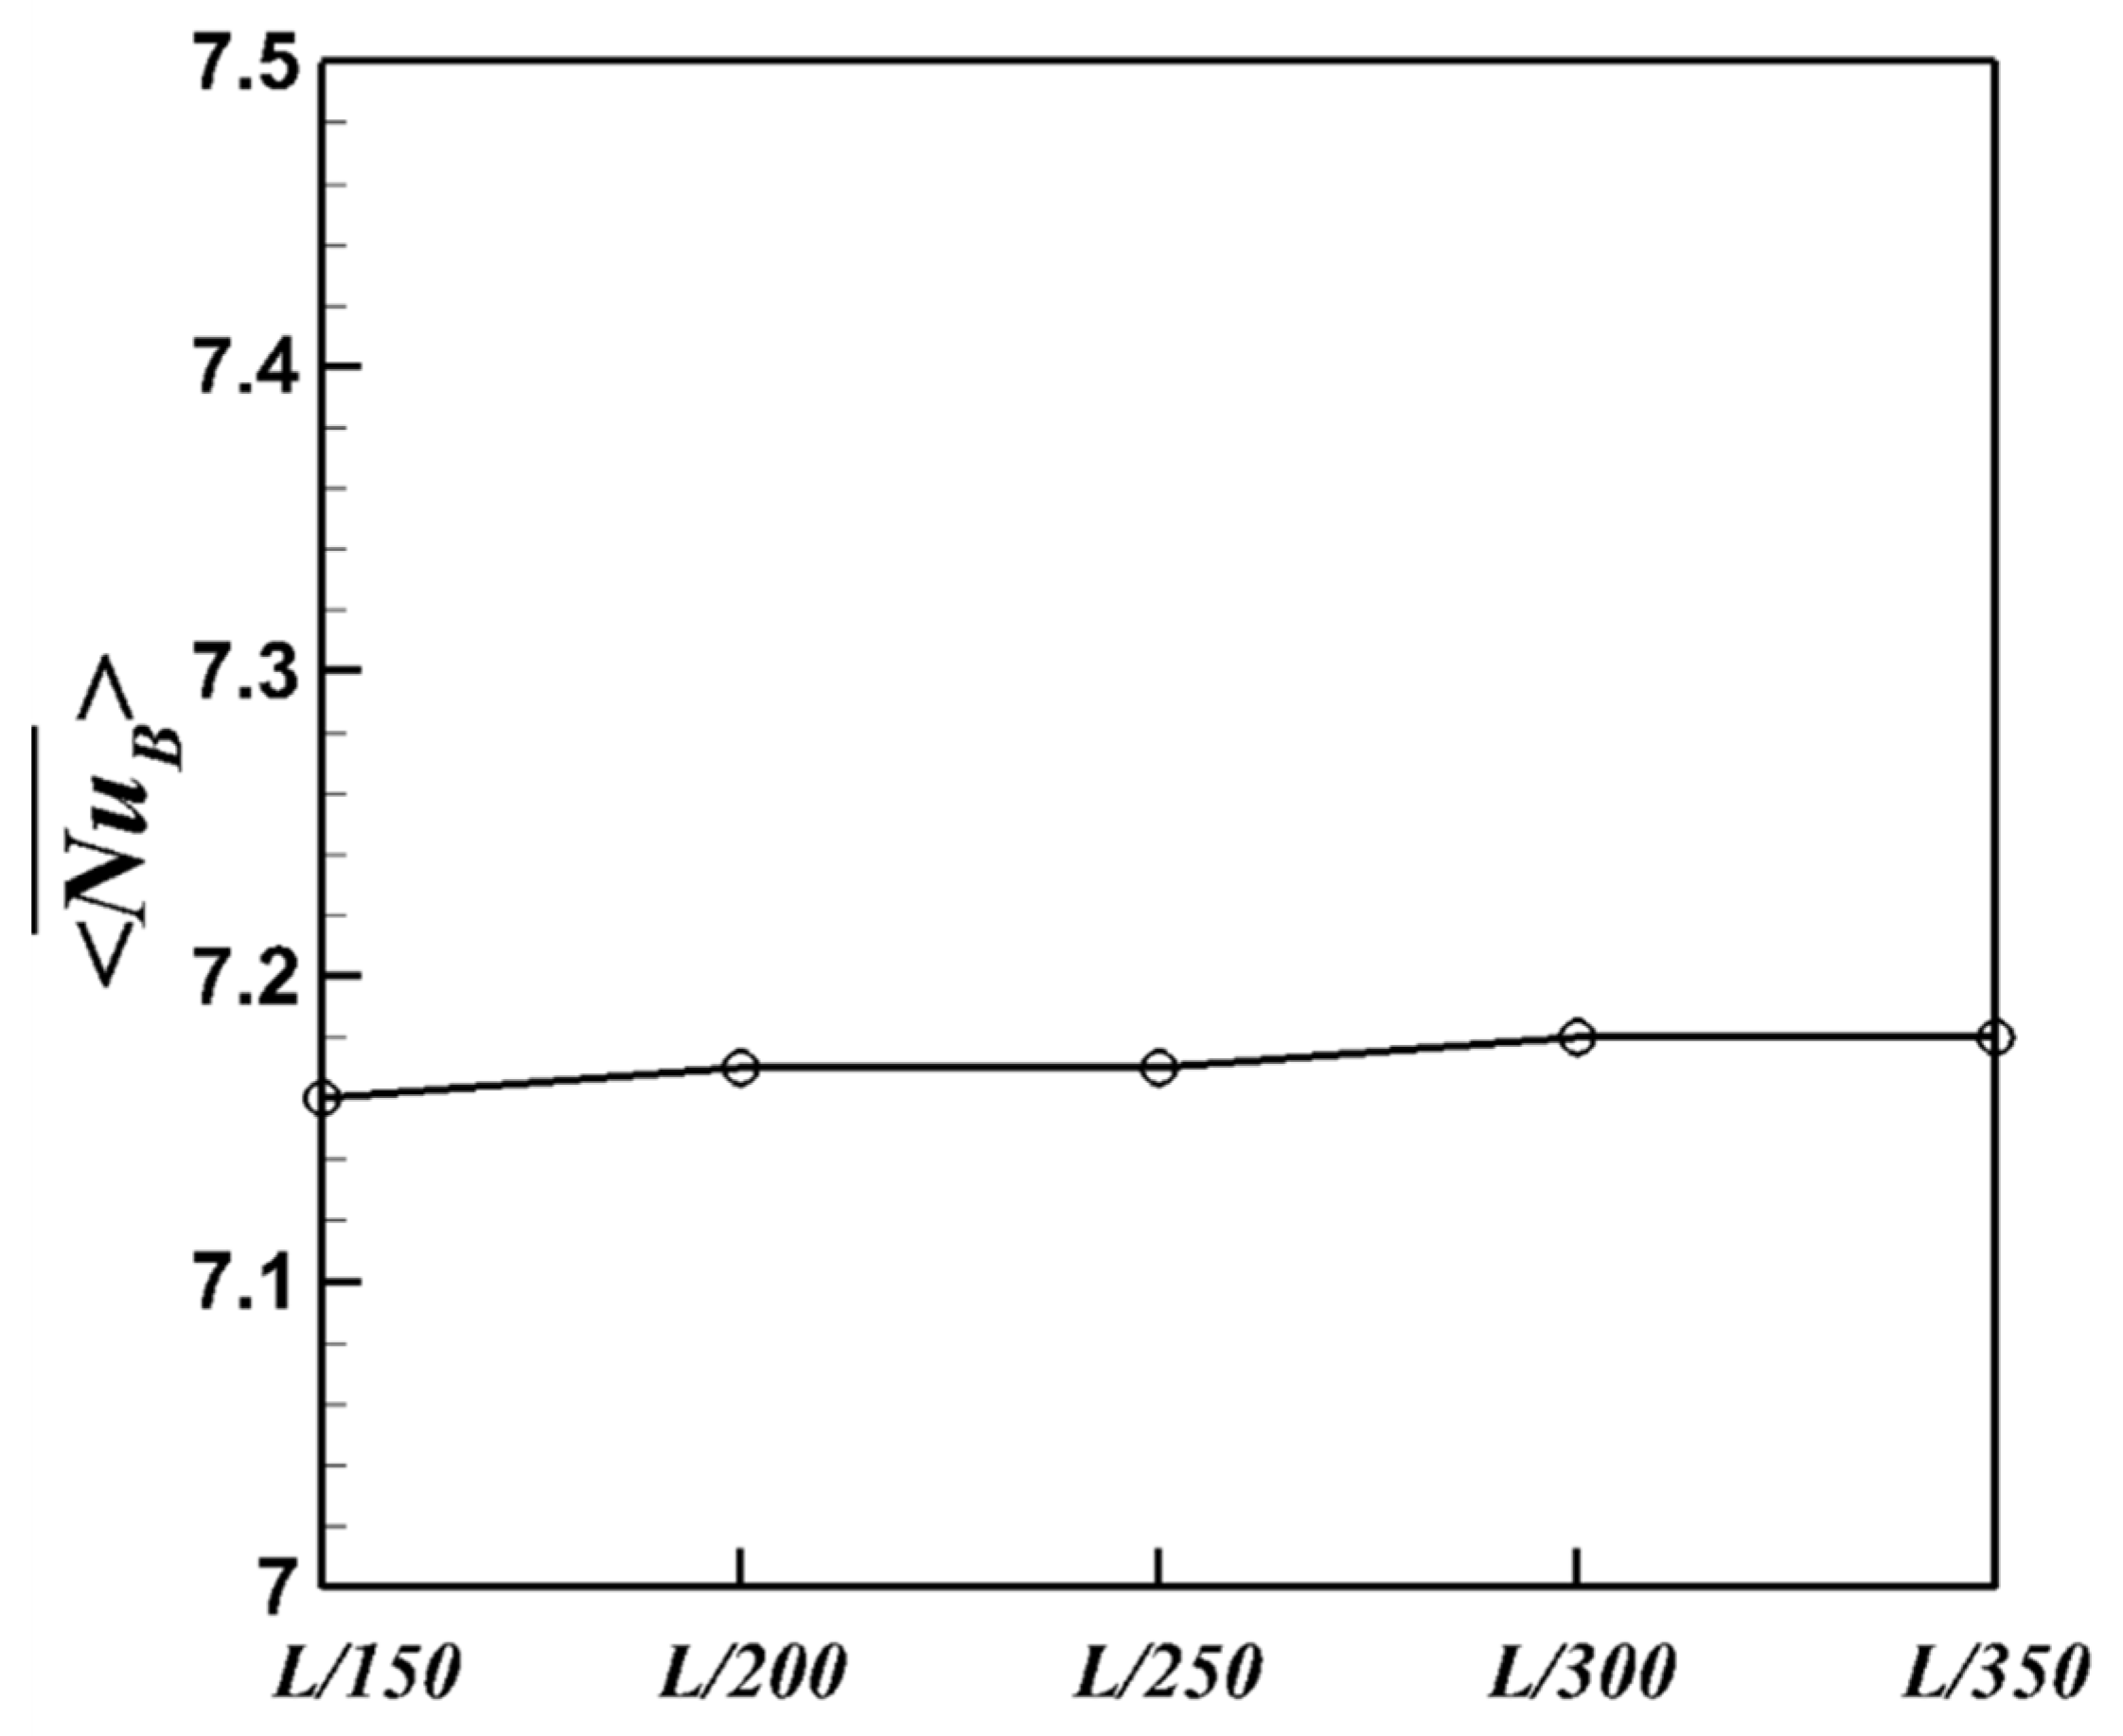
2.1. Numerical Methods

The non-dimensional forms of governing equations can be expressed as follows:
u q = 0
u t + u u = p + 1 R e 2 u + G r R e 2 θ δ i 2 + f
θ t + u θ = 1 R e P r 2 θ + h
The dimensionless variables shown above are defined as follows:
t = α L 2 t * ,   x i = x i * L ,   u i = L α u i * , P = L 2 ρ α 2 P * ,   θ = T T c T h T c
In these equations, L, ρ, T, and α are the dimensional lengths of enclosure, density, dimensional temperature, and thermal expansion coefficient, respectively. The superscript * in Equation (4) indicates the dimensional variables. xi is the dimensionless Cartesian coordinate, ui is the corresponding dimensionless velocity component, t is the dimensionless time, P is the dimensionless pressure, and θ is the dimensionless temperature. Gravitational acceleration acts in the negative y-direction, and the Boussinesq approximation is used to model the variation in the fluid density in the buoyancy term due to the change in the fluid temperature.
The terms q, f, and h in Equations (1)–(3) are related to the immersed boundary method (IBM), further details of which can be found in [21,22,23]. The temporal and spatial discretization was achieved using the semi-implicit scheme of Equations (1)–(3). The four-step fractional step method proposed by Choi and Moin was used to simulate the passing of time for the flow fields [24]. Once the velocity and temperature fields are obtained, the local and surface-averaged Nusselt numbers are calculated as follows:
N u = θ n w a l l ,   N u = 1 W 0 W N u   d s
where n is the normal direction with respect to the walls, and W is the surface area of the walls. In addition, the time-averaged local Nusselt number,  N u ¯ , and the time- and surface-averaged Nusselt number  N u ¯  are calculated as follows:
N u ¯ = 1 t 0 t N u   d t , N u ¯ = 1 t 0 t N u   d t
The volume-averaged orthogonal enstrophy  ξ x , y ¯  is used to quantify the three-dimensional characteristics of the vortical structure that forms inside the long rectangular enclosure, which was calculated as follows:
ξ x , y ¯ = 1 V V w x 2 d V + V w y 2 d V
where  w x 2 = w y v z 2 ,   w y 2 = u z w x 2 , and V is the volume of the fluid in the enclosure.

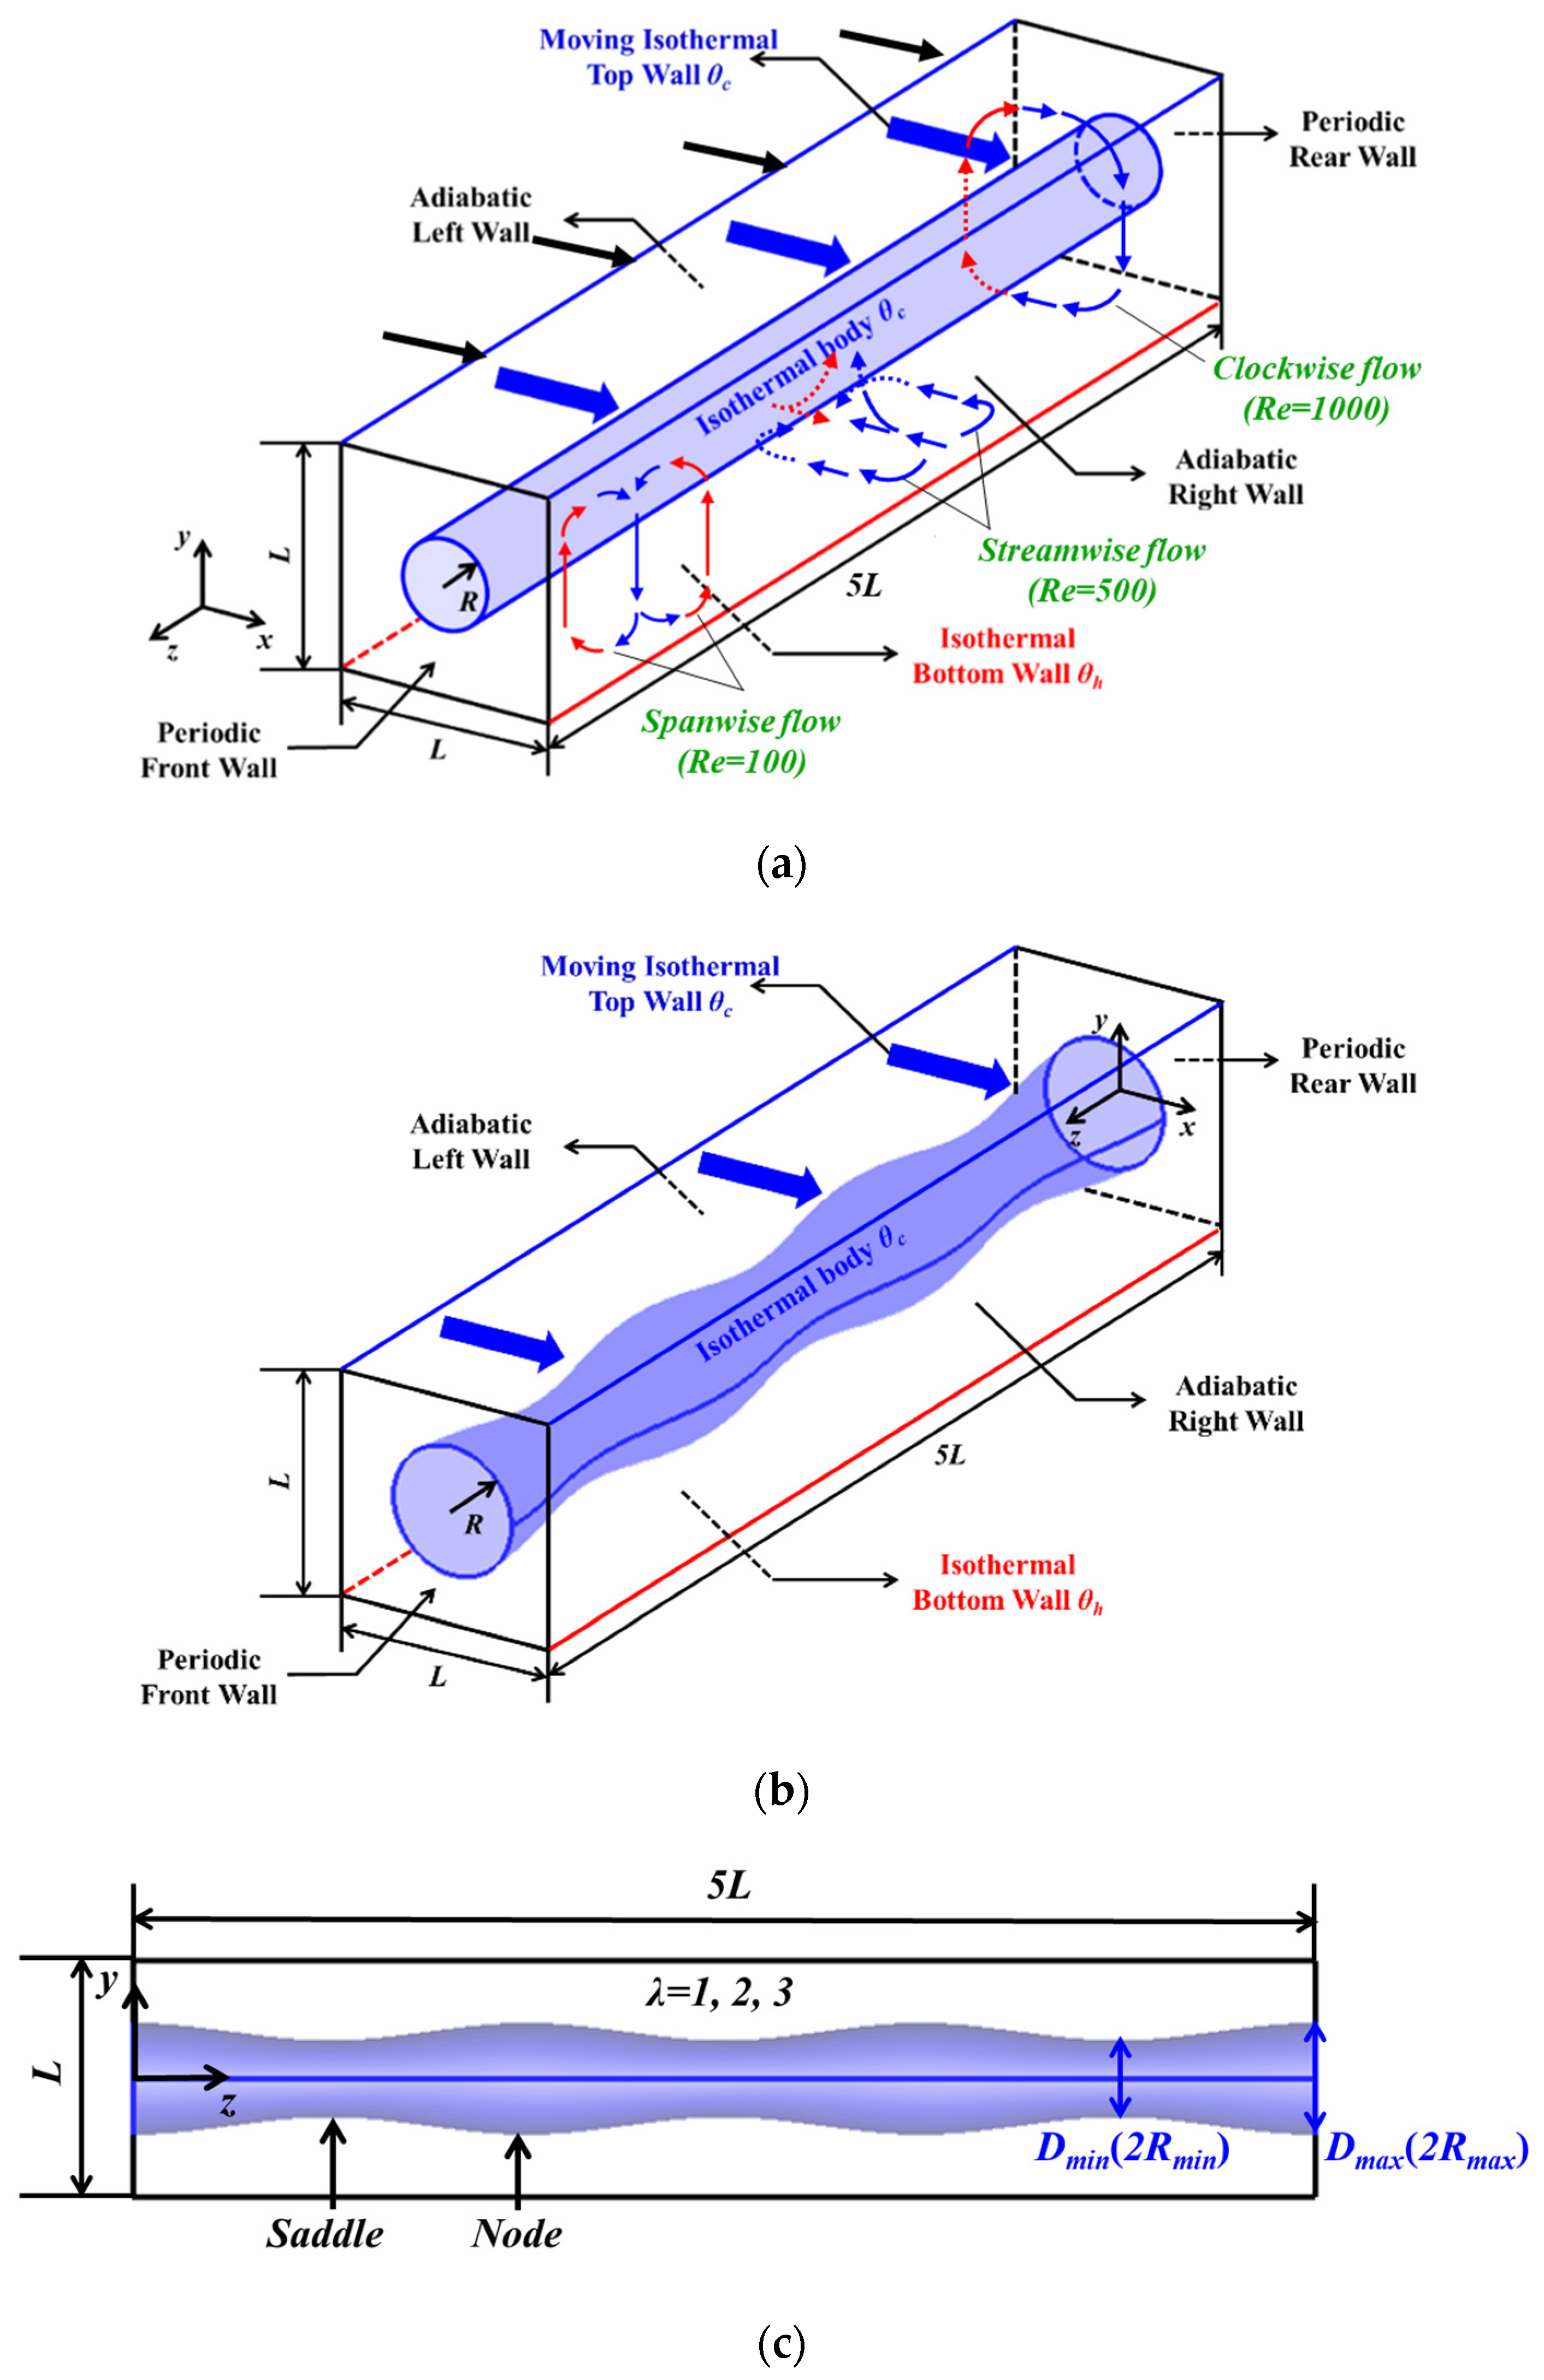
2.2. Problem Description

Figure 1 presents the physical domain which had cavity with a height-to-width-to-length ratio of 1:1:5 using the wavelength obtained to capture the flow pattern induced by the flow transition. The physical domain consisted of a cavity with an inner sinusoidal cylinder. The surface areas of the sinusoidal circular cylinder in all cases are the same as those of the circular cylinder (0.2 L). The mean radius of the sinusoidal cylinder was defined as R = (Rmax + Rmin)/2, where Rmax and Rmin were the minimum and maximum local radii, respectively. Rmax and Rmin were called the node and saddle, respectively, as shown in Figure 1.
The wavelengths ( λ ) of the cylinder were  L z / λ = 5 L   λ = 1 2.5 L   λ = 2 , and  1.667 L   λ = 3  in the spanwise direction. The amplitude of the curve surface  δ  was defined as  δ = 0.091 R m a x + R m i n . Consequently, Rmax and Rmin were defined as  R m a x = R m e a n + δ  and  R m i n = R m e a n δ  for the sinusoidal cylinder.
Non-dimensional temperatures were imposed on the cold top wall (θc = 0), the hot bottom wall (θh = 1), and the cold surfaces (θc = 0) of the isothermal cylinder. The side walls of the enclosure were adiabatic. The periodic boundary conditions were applied in the spanwise direction (z). The top wall moved to the right with a constant velocity (u = 1). No-slip and impermeability conditions were used for all walls except the top wall.
Figure 2 shows the results of  N u B ¯  for various numbers of grids. The difference in  N u B ¯  between the L/250 and L/300 grids was less than 0.1%. Based on the grid dependency test, the grid size of L/250 was adopted in all the simulations. A time interval to obtain a Courant–Friedrichs–Lewy (CFL) number smaller than 0.15 was selected in this study for the temporal integration in the time-marching procedure.
The numerical method was used to validate the available results in this study [19]. This method was validated using a mixed convection phenomenon with the results of 2- and 3D mixed convection [16,18]. Khanafer and Aithal [16] carried out two-dimensional numerical simulations and investigated the mixed convection flow and heat transfer in the enclosure with an inner cylinder. The present results in terms of the surface-averaged Nusselt number on the top wall of the cavity at Re = 100 are promising with those obtained by Khanafer and Aithal [16], as can be seen in Table 1. Furthermore, in order to validate the present methodology in three-dimensional domain, the results of the present numerical methodology were also compared with the results of Ouertatani et al. [18] at Re = 100 and several Grashof numbers, which show excellent agreement, as depicted in Table 1 N u ¯  values were compared with those from a previous study [19] and showed good agreement. Thus, the analysis of mixed convection around a cylinder inside an enclosure could be conducted with reasonable accuracy.

3. Results

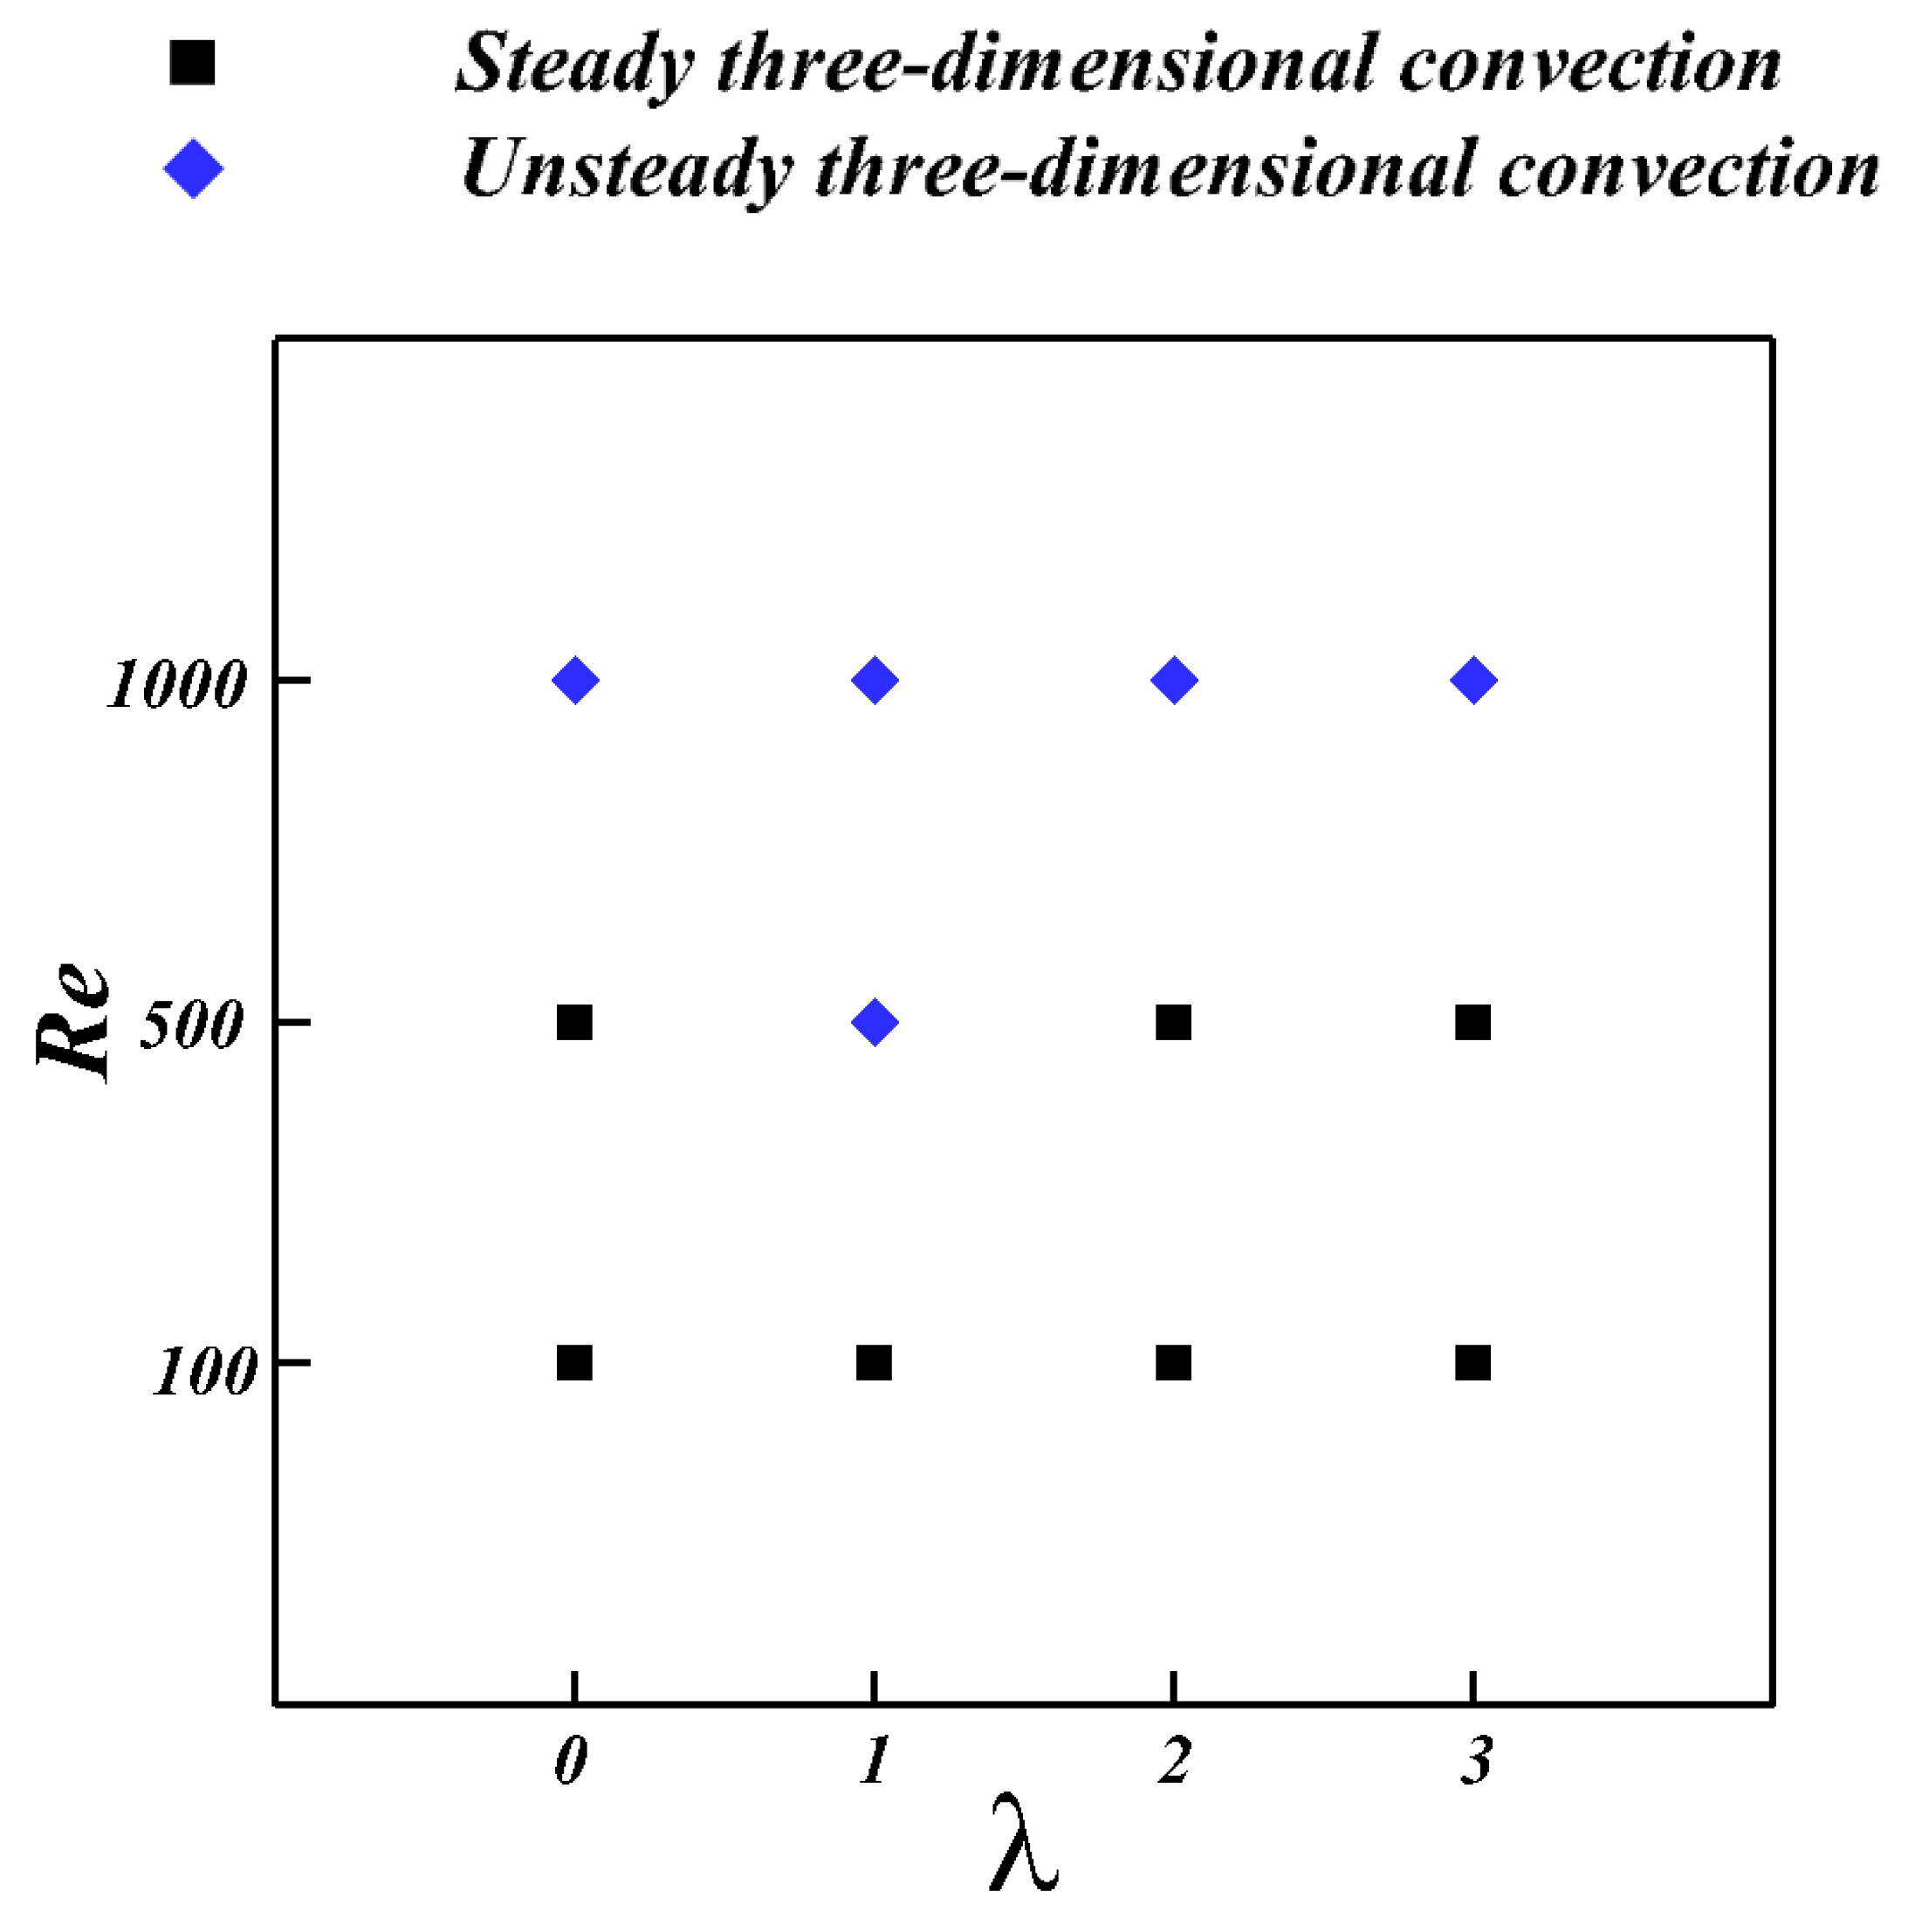
3.1. Bifurcation Map

Figure 3 presents the bifurcation map. The thermal field was categorized into two regimes according to the wavelength and Reynolds number: steady three-dimensional convection (S3C) and unsteady three-dimensional convection (U3C). For Re = 100, the structures reached the S3C regime in all the cases because the natural convection effect was dominant at Re = 100, which resulted in convective flow in the z-direction. For Re = 500, the thermal field reached two different regimes. The thermal structure reached the S3C and U3C regimes. At λ = 0, 2, and 3, the flow regimes reached the S3C regime, whereas the flow regime reached the U3C regime at λ = 1. This is because the mutual interaction intensified in the space between the enclosure and the saddle at λ = 1. When λ was increased to 2, the mutual interaction was dispersed as the saddle increased. As a result, the thermal structure reached the U3C regime at λ = 1. For Re = 1000, the regimes reached U3C in all cases because as Re increased, the convective flow by the forced convection was strengthened, and the instability increased.
For Re = 100, natural convection was dominant in the enclosure. Consequently, convective flow in the z-direction was generated in the cavity. As a result, the flow regime reached the S3C. At Re = 500, the dominant effect of forced convection was relatively higher in the enclosure than at Re = 100. As a result, the flow regimes reached S3C and U3C. For Re = 1000, the forced convection effect was dominant in the enclosure, resulting in the flow regime reaching U3C.

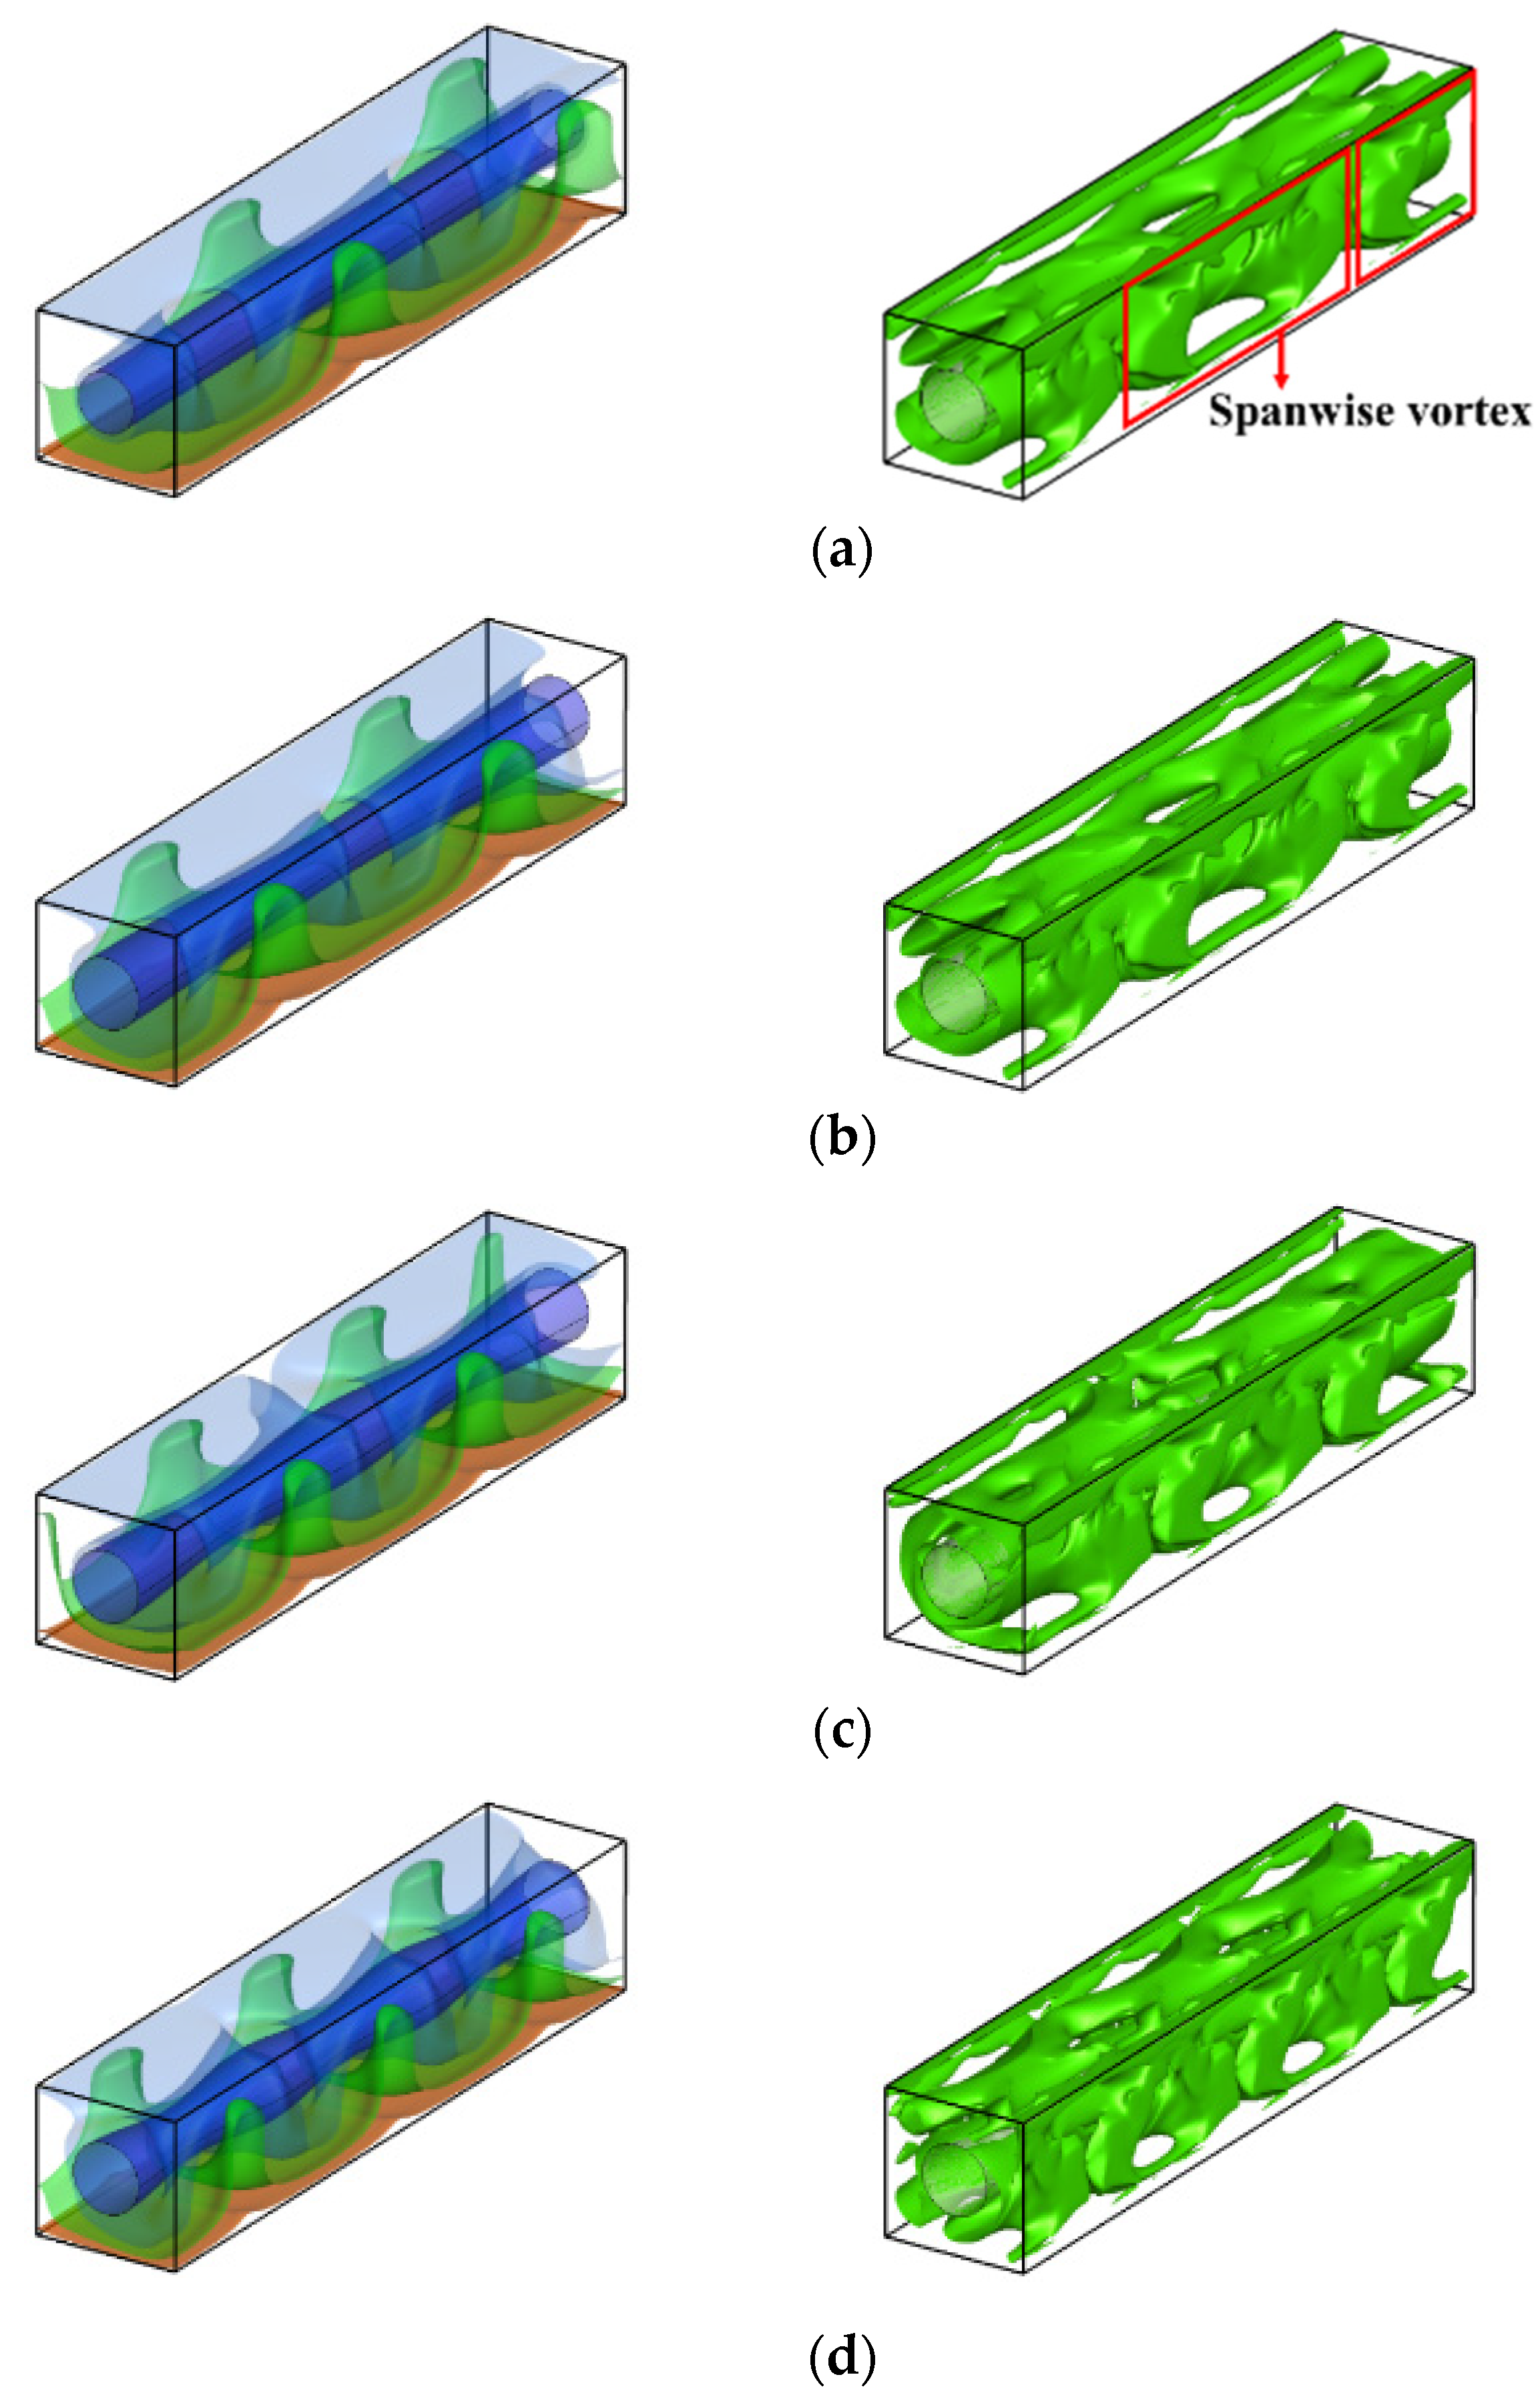
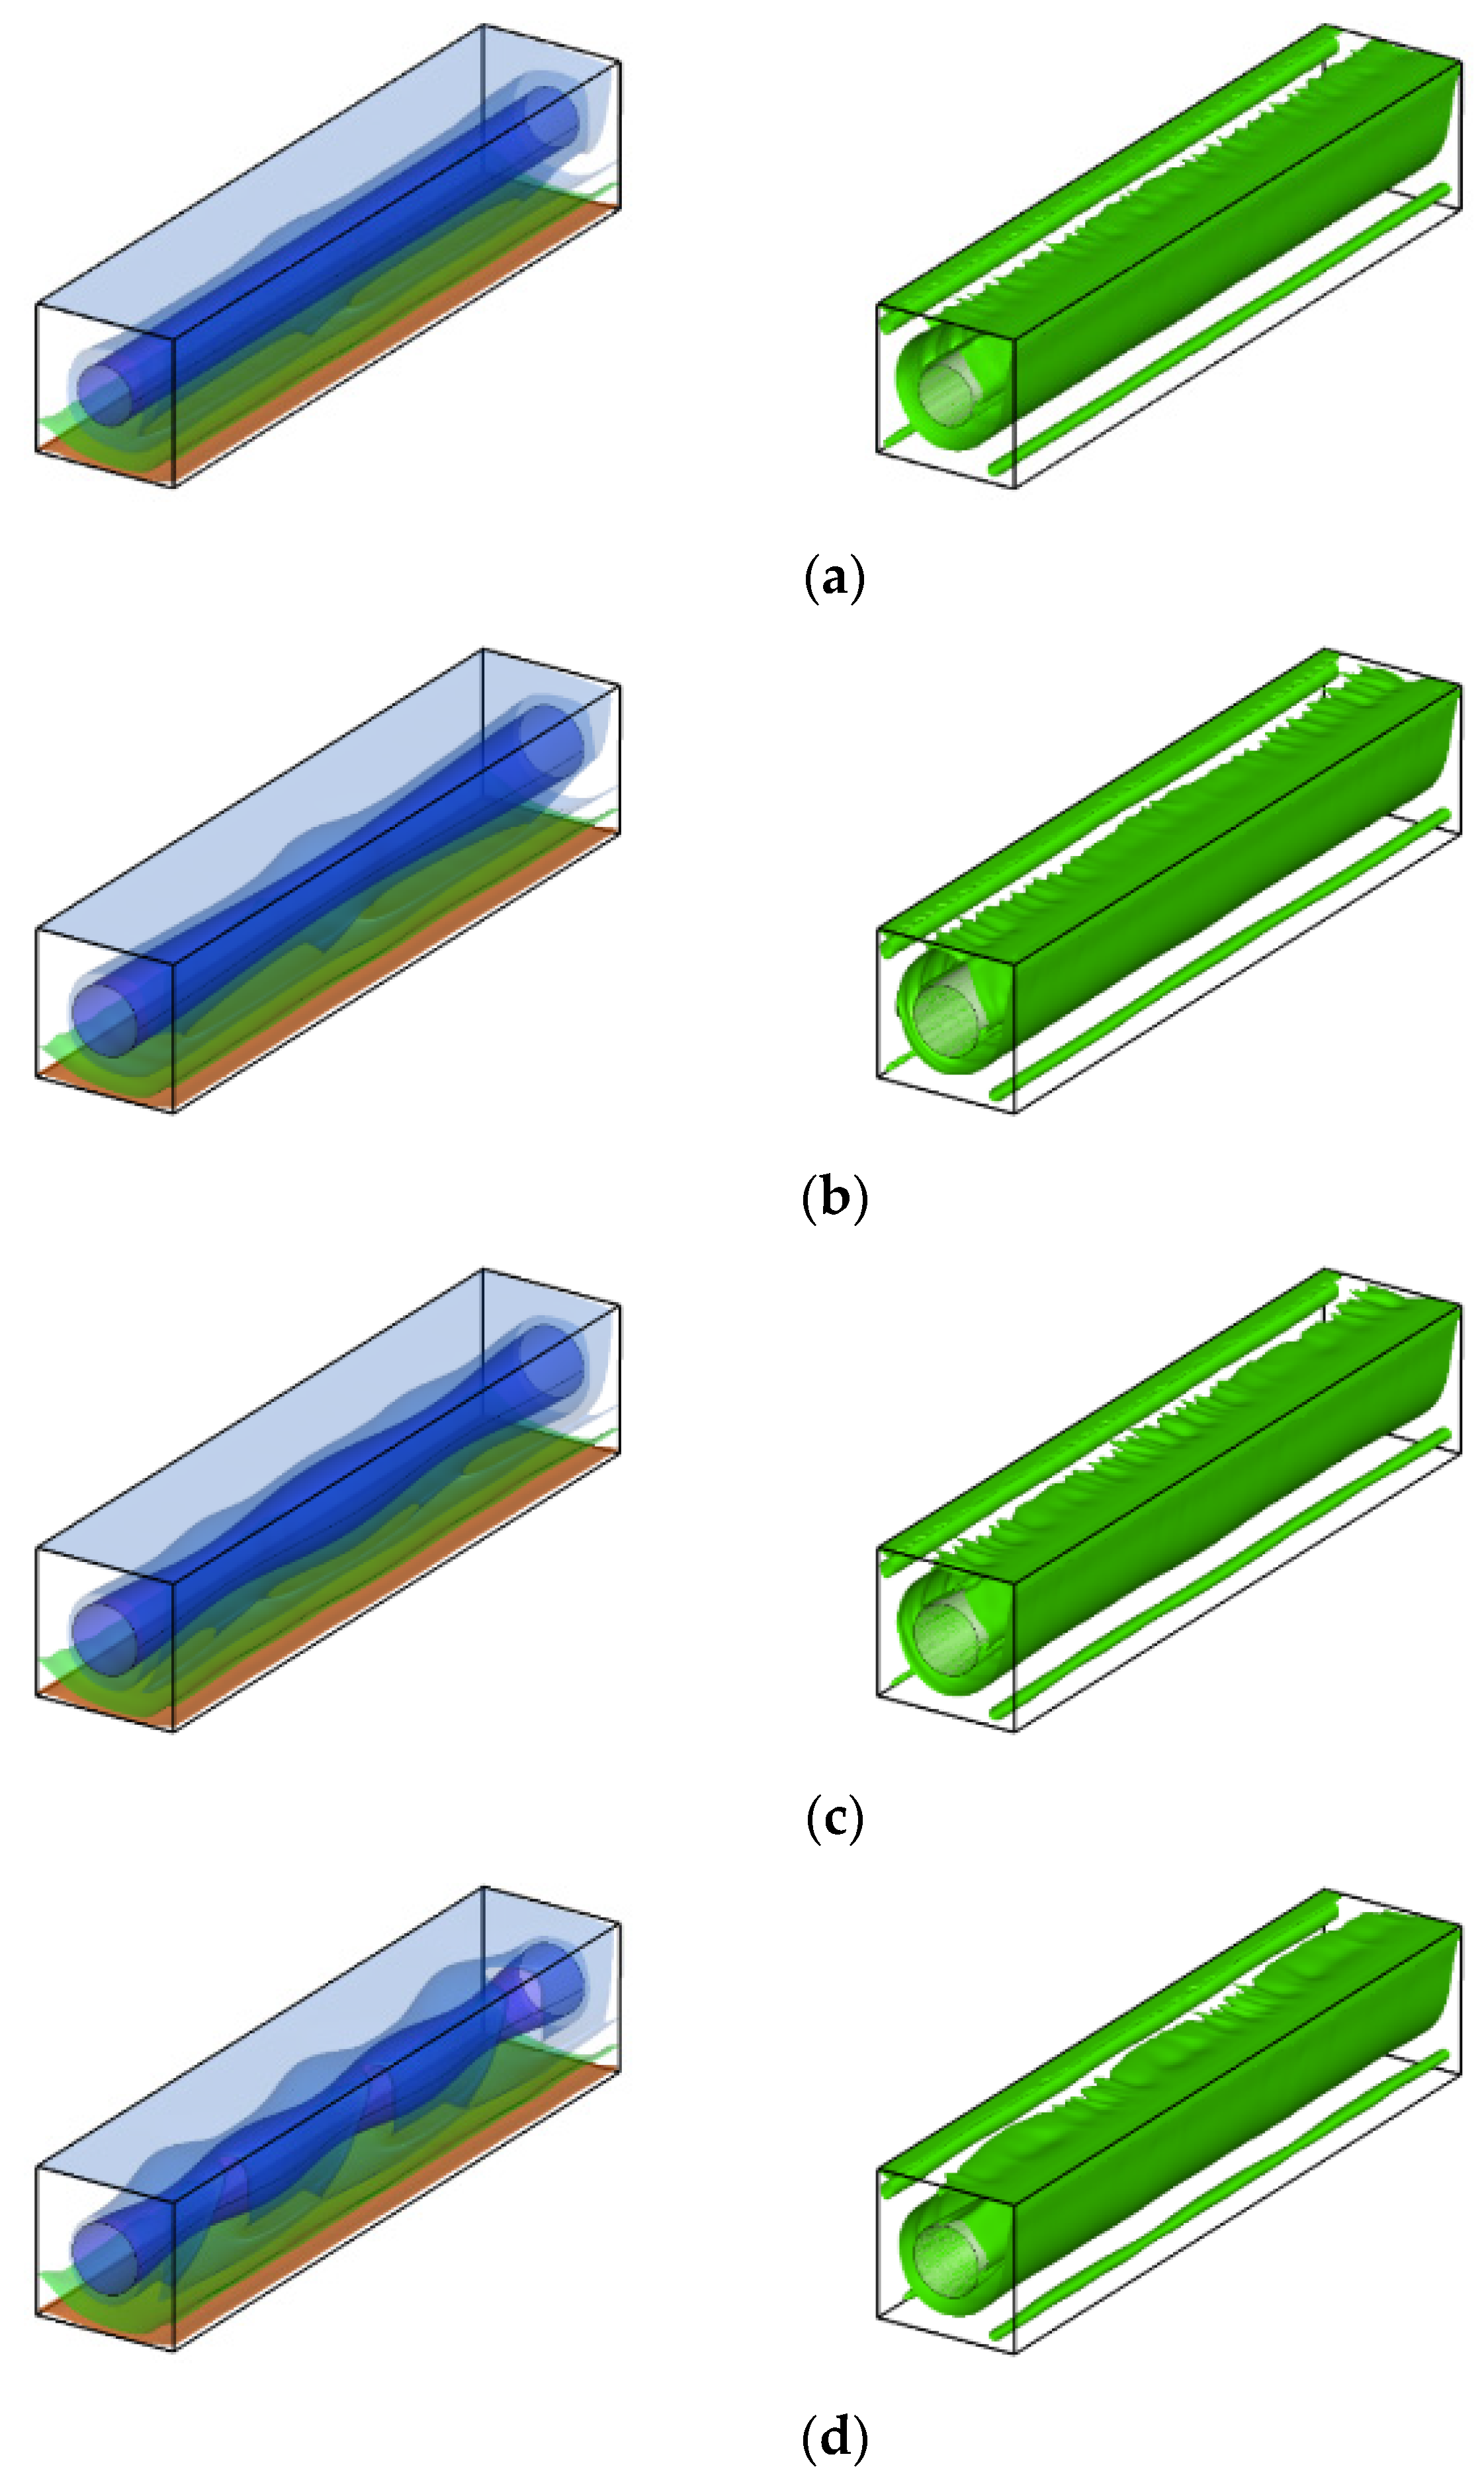
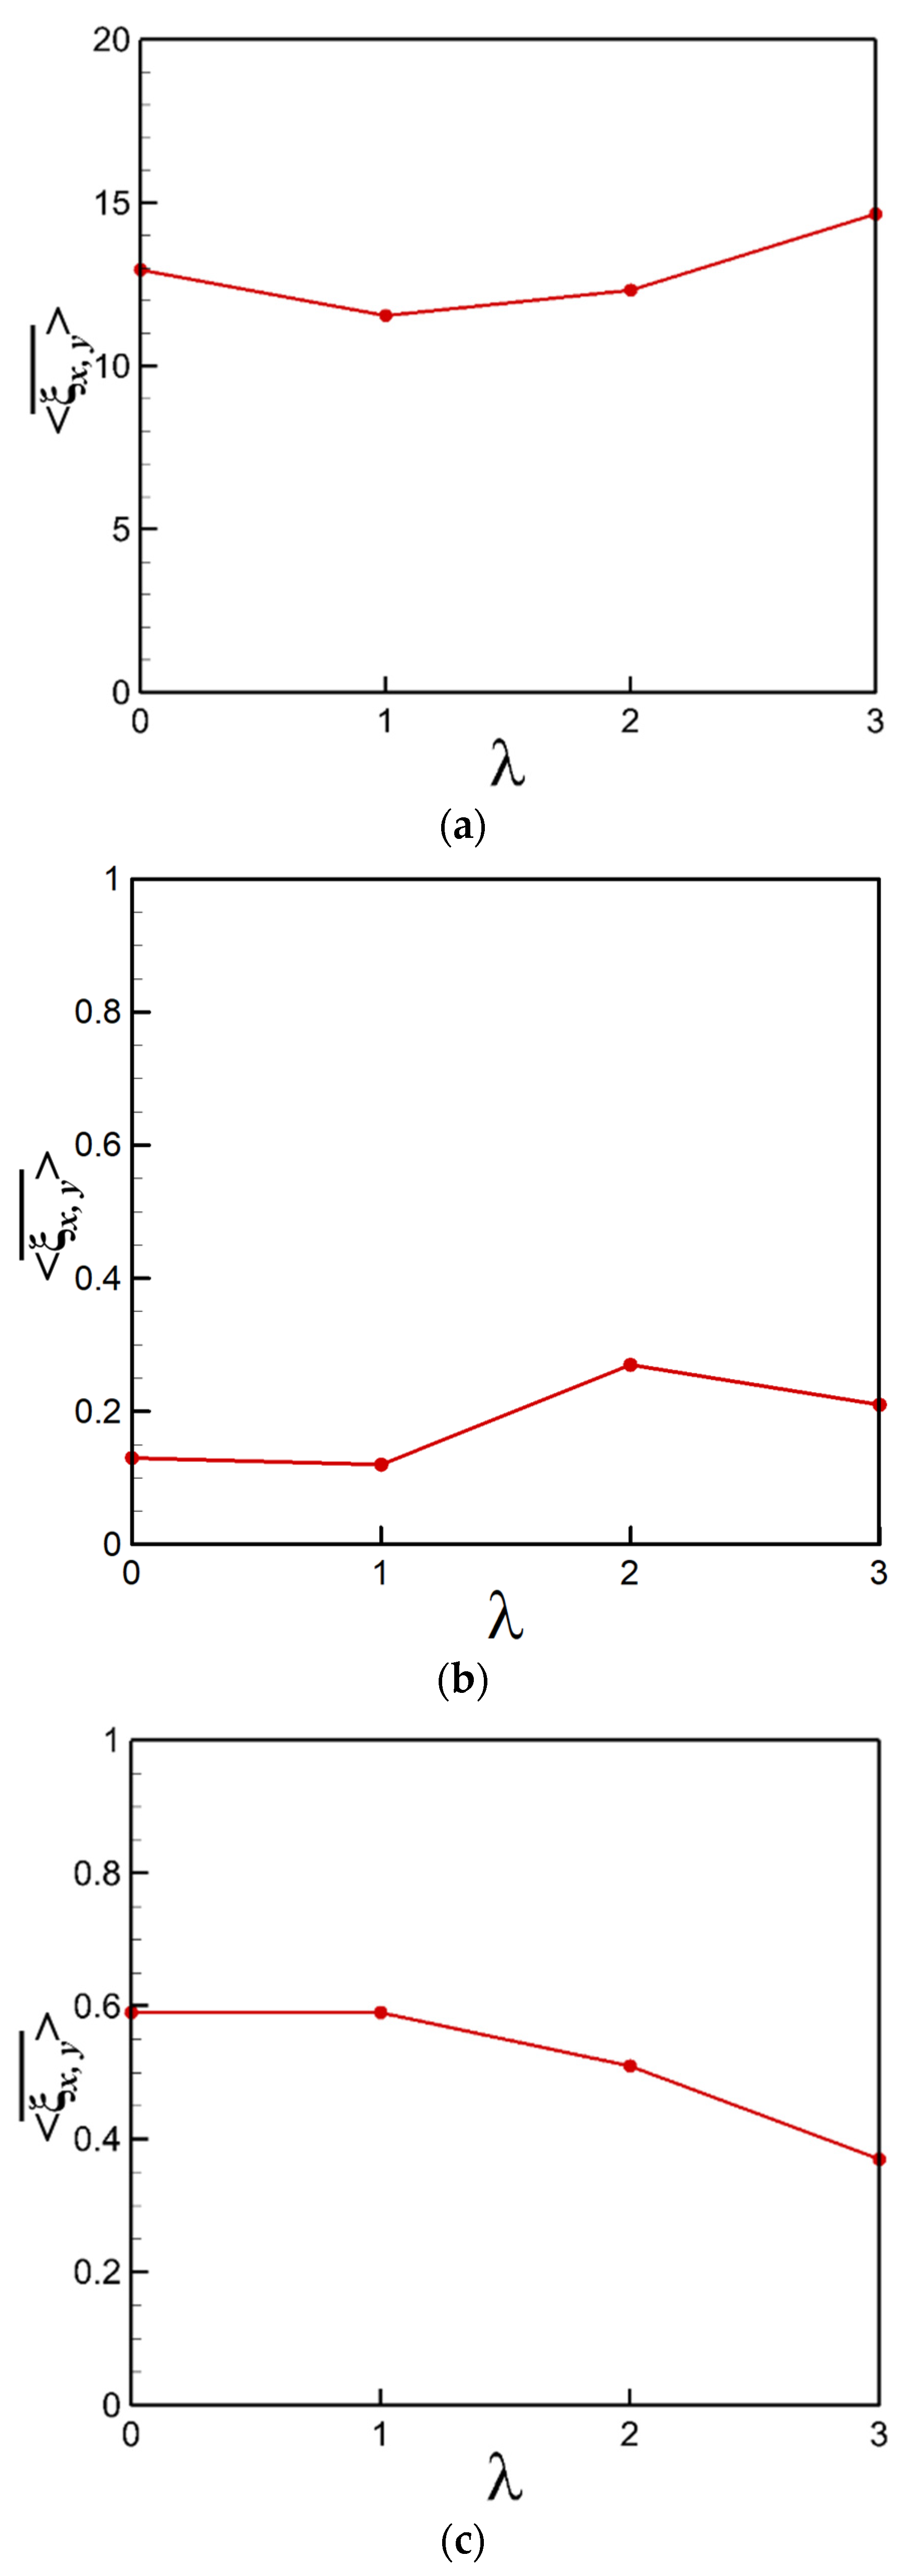
3.2. Thermal and Flow Structures

For Re = 100, the effect of natural convection had a dominant effect on the enclosure, resulting in spanwise flow and vortices along the right wall. The strength of the forced convection effect also increased when Re was increased to 500 compared to the cases at Re = 100, and the interaction between the natural and force convections was strengthened. As a result, streamwise flow and vortices were generated in the bottom wall. Forced convection had a dominant effect on the enclosure at Re = 1000, resulting in clockwise flow around the sinusoidal cylinder.
Figure 4 presents the temperature distribution and vortical structure for different wavelengths at Re = 100. The values for temperature were θ = 0.1, 0.5, and 0.9, and the value for the second eigenvalue of the vortical structure was λ2 = −0.1. The iso-surface of λ2 = −0.1 was adopted in the visualization of the vertical structures in order to clearly decipher the vertical structures distributed in the enclosure. The effect of natural convection was dominant at a relatively low Reynolds number of Re = 100. Thus, the ascending plumes were formed near the bottom wall. Especially, the strength of ascending plumes at the lower left region of the cylinder was larger than that of the lower right area of the cylinder. This is because the clockwise convective flow occurred around the sinusoidal cylinder and weakened the ascending plumes. For λ = 0 and 1, four ascending plumes were formed at the left and right sides of the enclosure. For λ = 2, three ascending plumes were formed at the left region of the enclosure. More ascending plumes were formed at the enclosure when λ was increased to λ = 3. The space between the enclosure and the saddle was wider than the space between the enclosure and the node, which resulted in more ascending plumes at the saddle. In addition, the descending flow was generated at the node. This is because the intensity of the ascending plumes was larger than that of the descending flow at the saddle.
In Figure 4a,b, for λ = 0 and 1, two spanwise vortices were observed at the right side of the enclosure. For λ = 2, the period of the spanwise vortices was regular compared to λ = 1. This is because the upwelling plumes were generated at the saddle. Consequently, the kinetic energy of the convective flow in the saddle was transferred to the velocity in the z-direction, resulting in the regular period of vortices. For λ = 3, the period of the spanwise vortices was shorter than λ = 2. This is because the kinetic energy of convective flow in the space between the saddle and enclosure was transferred to the velocity in the z-direction, resulting in more spanwise vortices in the space between the saddle and the enclosure.
Figure 5 in the left column presents the distribution of temperature obtained at Re = 500. The strength of the ascending plume on the left and right areas of the enclosure decreased because the relative strength of the buoyancy force decreased at Re = 500. In addition, a relatively strong ascending plume was formed at the left side of the enclosure compared to the right side because of the clockwise convective flow by the moving top wall. For λ = 0 and 1, the ascending plumes were observed at the left side of the enclosure. The plume was a regular pattern at λ = 0, whereas the plume was an irregular pattern at λ = 1. This is because, for λ = 1, the thermal and flow fields reached U3C. For λ = 2, two sharp and two blunt ascending plumes were observed at the left side of the enclosure. Three sharp and three blunt ascending plumes were observed periodically near the left wall at λ = 3. This is because the clockwise convective flow was restricted by the confined space between the enclosure and cylinder at the node.
Figure 5 in the right column presents the vortical structures obtained at Re = 500. For λ = 0 and 1, the spanwise vortices at Re = 100 disappeared on the cavity, as shown in Figure 5a,b. This is because the effect of the forced convection increased compared to the case for Re = 100. For λ = 2, the counter-clockwise vortices and the streamwise vortices were observed near the bottom wall. The shapes of the vortex near the top wall became complex compared to λ = 1 because the variation in the upper space between the node and the saddle destabilized the convective flow caused by the moving top wall. As a result, the unstable kinetic energy of this convective flow was transferred to the velocity in the z-direction, resulting in the complex shape of the vortices near the top wall. As the period between the saddle and node decreased, kinetic energy transfer was restricted by small variations in the lower space between the node and the saddle. Hence, more streamwise vortices were formed near the bottom wall at λ = 3.
Figure 6 in the left column presents the distribution of temperature obtained at Re = 1000. The ascending plumes at Re = 500 disappeared due to the dominant effect of forced convection. The right column of Figure 5 presents the vortical structures obtained at Re = 1000. When Re was increased to 1000, the angular momentum of clockwise convective flow was intensified by the dominant effect of the forced convection. Thus, the streamwise vortices observed at Re = 500 disappeared near the bottom wall, and the shape of the vortices became simpler than at Re = 500. This is because the spanwise and streamwise vortices were restricted by the high kinetic energy in the clockwise convective flow.
Figure 7 shows the distribution of  ξ x , y ¯  for different wavelengths. For Re = 100,  ξ x , y ¯  decreased when λ was increased from 0 to 1. This is because the angular momentum of clockwise convective flow was strengthened at the saddle, restricting the velocity in the z-direction.  ξ x , y ¯  increased when λ was increased from 1 to 3. This is because a more spanwise flow was formed near the bottom wall with an increasing saddle. For Re = 500,  ξ x , y ¯  decreased slightly when λ was increased from 0 to 1. This is because, at λ = 1, the momentum of clockwise convective flow was intensified at the saddle, restricting the streamwise vortex at the lower region of the cavity.  ξ x , y ¯  increased when λ was increased from 1 to 2 because of the streamwise vortex generated near the bottom wall.  ξ x , y ¯  decreased when λ was increased from 2 to 3. The momentum of the convective flow at the saddle decreased as the period between the saddle and node decreased because the increased saddle dispersed the convective flow. Therefore, the kinetic energy of the streamwise vortices and three-dimensionality decreased. For Re = 1000,  ξ x , y ¯  decreased with increasing λ. This is because the momentum of the convective flow was decreased by the increased flow passage at the space between the saddle and enclosure.

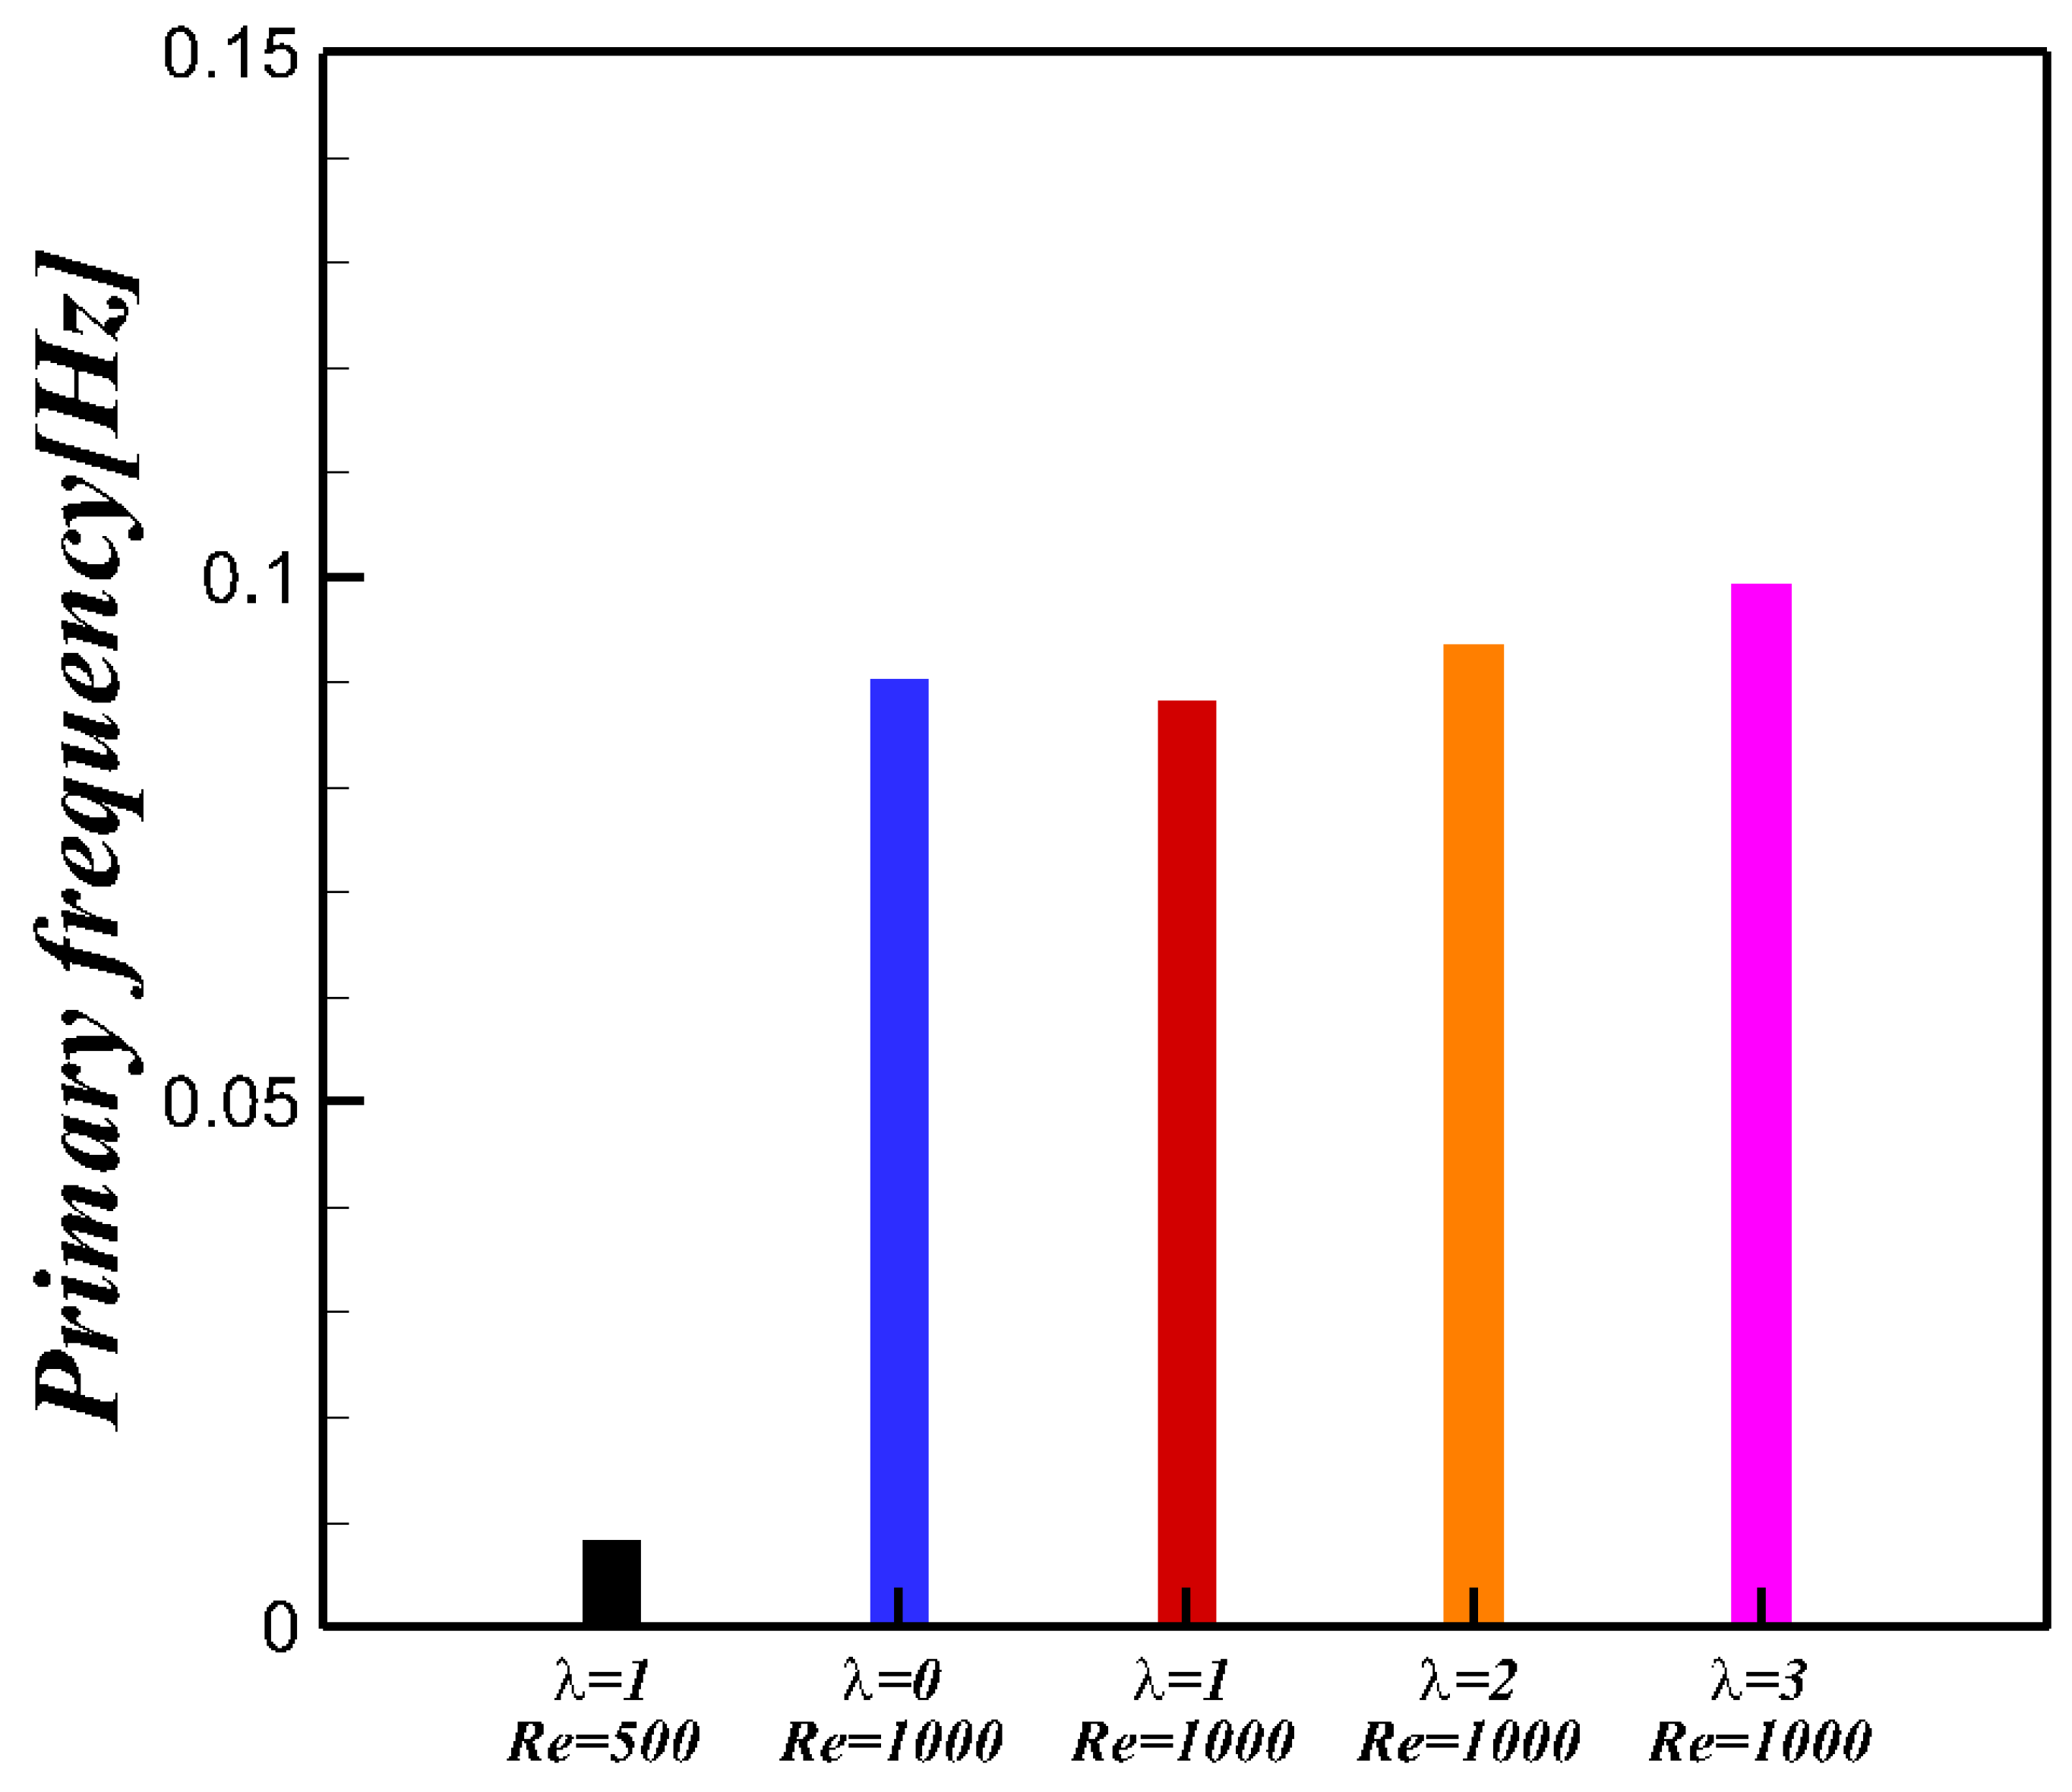
3.3. Unsteady Characteristics

Figure 8 presents the primary frequency distribution of <NuB> for different values of λ. The cases for Re = 100 were the S3C regime, and the primary frequency was zero. When λ = 1 at Re = 500, the saddle caused the instability of flow because of the restricted occurrence of the ascending and descending plumes at the saddle. As a result, the flow regime reached the U3C regime, resulting in a dominant frequency of approximately 0.0083. When Re was increased to 1000, the flow regime reached an unsteady state regardless of λ. Furthermore, the primary frequency of Re = 1000 became larger than Re = 500 because, for Re = 1000, the angular momentum of the clockwise convective flow was intensified compared to Re = 500. This intensified momentum increased the instability of flow. In addition, the primary frequency of <NuB> increased when λ was increased from 1 to 3. This is because the strength of the clockwise convective flow decreased due to the increased flow passage at the space between the enclosure and the saddle.

3.4. Nusselt Number

Figure 9 shows the distribution of  N u B ¯  for different values of λ. As Re increased, the effect of forced convection increased, resulting in an increase in  N u B ¯ . For Re = 100,  N u B ¯  was similar when λ was increased from 0 to 1.  N u B ¯  increased with increasing λ from 1 to 3. This is because the space on the right and left parts of the cavity became wider as λ increased at the saddle. Consequently, wider space was generated by the convective flow from the buoyancy force. As a result,  N u B ¯  had a maximum value at λ = 3, and  N u B ¯  increased by 6.6% compared to the minimum value of  N u B ¯ .
For Re = 500,  N u B ¯  was almost the same when λ was increased from 0 to 1. When λ was increased from 1 to 3,  N u B ¯  increased then decreased. This is because the streamwise vortex was formed on the lower part of the cavity at λ = 2, and the streamwise convective flow was distributed more by the increased number of the saddle at λ = 3. As a result, the largest value of  N u B ¯  was observed at λ = 2, and  N u B ¯  increased by 2.6% compared to the minimum value of  N u B ¯ .
When Re increased to 1000,  N u B ¯  increased when λ was increased from 0 to 1.  N u B ¯  decreased with increasing λ when λ was increased from 1 to 3. This is because the momentum of the clockwise convective flow decreased because of the increased flow passage between the enclosure and the saddle. As a result, the largest value of  N u B ¯  was observed at λ = 1, resulting in a 3.2% increase in  N u B ¯  compared to the minimum value of  N u B ¯ .

4. Conclusions

This paper numerically investigated 3D mixed convection containing a sinusoidal cylinder in a cavity at different wavelengths and Reynolds numbers for a sinusoidal circular cylinder. The fluid was pulled towards the right top corner, and it circulated around the inner cylinder in a clockwise direction. In addition, the effects of the wavelength were compared with those in the circular cylinder.
The transition of flow regimes was analyzed at different wavelengths and Re. The flow regimes were categorized into two regimes according to the wavelength and Reynolds number: steady three-dimensional convection and unsteady three-dimensional convection. The instability of flow was greatly influenced by Re. In particular, the effects of 3D convection on the thermal fields were more concentrated on this space according to the wavelength owing to the sufficient space on the occurrence of the upwelling plumes.
The flow instability was analyzed by examining the primary frequency <NuB> according to the wavelength of the sinusoidal cylinder. The primary frequency of <NuB> was affected by the wavelength and Re.
For the heat transfer performance,  N u B ¯  at Re = 100 at λ = 3 was 6.6% larger compared to the circular cylinder. At Re = 500 and 1000, the largest value of  N u B ¯  was observed at λ = 2 and 1, respectively. As a result,  N u B ¯  increased by 6.6% and 2.6%, respectively, compared to the circular cylinder.

Author Contributions

Methodology, investigation, writing, S.I.; methodology, software, H.W.C.; validation, K.K.; Supervision, M.Y.H.; Supervision, Y.G.P. All authors have read and agreed to the published version of the manuscript.

Funding

This research was supported by the Ministry of Trade, Industry & Energy (MOTIE) of Korea (P147700052).

Data Availability Statement

Not applicable.

Acknowledgments

This research was supported by the Ministry of Trade, Industry & Energy (MOTIE) of Korea (S2641260).

Conflicts of Interest

The authors declare no conflict of interest.

Nomenclature

Symbols
fiMomentum forcing
gAcceleration of gravity
LCharacteristics length
nNormal direction to the wall
NuLocal Nusselt number
<Nu>Surface-averaged Nusselt number
  N u ¯ Time-averaged Nusselt number
< N u ¯ >Time- and surface-averaged Nusselt number
PDimensionless pressure
PrPrandtl number, ν/α
qMass source and sink
ReReynolds number, UrefL/ν
S3CSteady three-dimensional convection
tDimensionless time
uiDimensionless velocity
U3CUnsteady three-dimensional convection
WSurface area of walls
xiDimensionless Cartesian coordinates
Greek symbols
αThermal diffusivity
βThermal expansion coefficient
δi2Kronecker delta
ρDensity
νKinematic viscosity
θDimensionless temperature
Superscripts/Subscripts
*Dimensional value
BBottom wall
cCold
CylCylinder
EnEnclosure
hHot

References

  1. Ozoe, H.; Yamamoto, K.; Churchill, S.W.; Sayama, H. Three-dimensional, numerical analysis of laminar natural convection in a confined fluid heat from below. J. Heat Transf. 1976, 98, 202–207. [Google Scholar] [CrossRef]
  2. Busse, F.H.; Clever, R.M. Instabilities of convection rolls in a fluid of moderate Prandtl number. J. Fluid Mech. 1979, 91, 319–335. [Google Scholar] [CrossRef]
  3. Hartlep, T.; Tilgner, A.; Busse, F.H. Transition to turbulent convection in a fluid layer heated from below at moderate aspect ratio. J. Fluid Mech. 2005, 554, 309–322. [Google Scholar] [CrossRef]
  4. Choi, C.; Ha, M.Y.; Yoon, H.S. Characteristics of Rayleigh-Bénard convection in a rectangular channel with an inner hot circular cylinder. J. Heat Transf. 2015, 137, 112501. [Google Scholar] [CrossRef]
  5. Seo, Y.M.; Ha, M.Y.; Park, Y.G. A numerical study on the three-dimensional natural convection with a cylinder in a long rectangular enclosure. Part I: Size effect of a circular cylinder or an elliptical cylinder. Int. J. Heat Mass Transf. 2019, 134, 420–436. [Google Scholar] [CrossRef]
  6. Iwatsu, R.; Hyun, J.M.; Kuwahara, K. Mixed convection in a driven cavity with a stable vertical temperature gradient. Int. J. Heat Mass Transf. 1993, 36, 1601–1608. [Google Scholar] [CrossRef]
  7. Sivakumar, V.; Sivasankaran, S.; Prakash, P.; Lee, J. Effect of heating location and size on mixed convection in lid-driven cavities. Comput. Math. Appl. 2010, 59, 3053–3065. [Google Scholar] [CrossRef] [Green Version]
  8. Sharif, M.A.R. Laminar mixed convection in shallow inclined driven cavities with hot moving lid on top and cooled from bottom. Appl. Therm. Eng. 2007, 27, 1036–1042. [Google Scholar] [CrossRef]
  9. Shi, X.; Khodadadi, J.M. Laminar Fluid Flow and Heat Transfer in a Lid-Driven Cavity Due to a Thin Fin. J. Heat Transf. 2002, 124, 1056–1063. [Google Scholar] [CrossRef]
  10. Oztop, H.F.; Zhao, Z.; Yu, B. Fluid flow due to combined convection in lid-driven enclosure having a circular body. Int. J. Heat Fluid Flow 2009, 30, 886–901. [Google Scholar] [CrossRef]
  11. Islam, A.W.; Sharif, M.A.R.; Carlson, E.R. Mixed convection in a lid driven square cavity with an isothermally heated square blockage inside. Int. J. Heat Mass Transf. 2012, 55, 5244–5255. [Google Scholar] [CrossRef]
  12. Liao, C.C.; Lin, C.A. Influences of a confined elliptic cylinder at different aspect ratio and inclinations on the laminar natural and mixed convection flows. Int. J. Heat Mass Transf. 2012, 55, 6638–6650. [Google Scholar] [CrossRef]
  13. Gangawane, K.M. Computational analysis of mixed convection heat transfer characteristics in lid-driven cavity containing triangular block with constant heat flux: Effect of Prandtl and Grashof numbers. Int. J. Heat Mass Transf. 2017, 105, 34–57. [Google Scholar] [CrossRef]
  14. Gupta, S.K.; Chatterjee, D.; Mondal, B. Invetigation of mixed convection in a ventilated cavity in the presence of a heat conducting circular cylinder. Numer. Heat Tranf. Part A Appl. 2015, 67, 52–74. [Google Scholar] [CrossRef]
  15. Billah, M.M.; Rahman, M.M.; Sharif, U.M.; Rahim, N.A.; Saidur, R.; Hasanuzzaman, M. Numerical analysis of fluid flow due to mixed convection in a lid-driven cavity having a heated circular hollow cylinder. Int. Commun. Heat Mass Transf. 2011, 38, 1093–1103. [Google Scholar] [CrossRef]
  16. Khanafer, K.; Aithal, S.M. Laminar mixed convection flow and heat transfer characteristics in a lid driven cavity with a circular cylinder. Int. J. Heat Mass Transf. 2013, 66, 200–209. [Google Scholar] [CrossRef]
  17. Iwatsu, R.; Hyun, J.M. Three-dimensional drive-cavity flows with a vertical temperature gradient. Int. J. Heat Mass Transf. 1995, 38, 3319–3328. [Google Scholar] [CrossRef]
  18. Ouertatani, N.; Cheikh, N.B.; Beya, B.B.; Lili, T.; Campo, A. Mixed convection in a double lid-drive cubic cavity. Int. J. Therm. Sci. 2009, 48, 1265–1272. [Google Scholar] [CrossRef]
  19. Cho, H.W.; Park, Y.G.; Seo, Y.M.; Ha, M.Y. Three-Dimensional Mixed Convection in a Rectangular Enclosure Containing a Circular Cylinder. Heat Transf. Eng. 2022, 43, 879–895. [Google Scholar] [CrossRef]
  20. Cho, H.W.; Seo, Y.M.; Park, Y.G.; Pandey, S.; Ha, M.Y. Estimation of heat transfer performance on mixed convection in an enclosure with an inner cylinder using an artificial neural network. Case Stud. Therm. Eng. 2021, 28, 101595. [Google Scholar] [CrossRef]
  21. Kim, J.; Kim, D.; Choi, H. An immersed-boundary finite volume method for simulations of flow in complex geometries. J. Comput. Phys. 2001, 171, 132–150. [Google Scholar] [CrossRef]
  22. Kim, J.; Choi, H. An immersed-boundary finite-volume method for simulation of heat transfer in complex geometries. KSME Int. J. 2004, 18, 1026–1035. [Google Scholar] [CrossRef]
  23. Choi, C. A Numerical Study of the Effect of a Circular Cylinder on Natural Convection in Rectangular Channel Heated from Bottom Wall. Ph.D. Thesis, Pusan National University, Busan, Republic of Korea, 2014; pp. 1–171. [Google Scholar]
  24. Choi, H.; Moin, P. Effects of the computational time step on numerical solutions of turbulent flow. J. Comput. Phys. 1994, 113, 1–4. [Google Scholar] [CrossRef]
Figure 1. Computational domain, coordinate system, and boundary. (a) iso-view of circular cylinder; (b) iso-view of sinusoidal circular cylinde; (c) side view of sinusoidal circular cylinder.
Energies 16 02550 g001
Figure 2. Time- and surface-averaged Nusselt number on bottom wall for different grid sizes at Re = 1000 and Gr = 105.
Energies 16 02550 g002
Figure 3. Bifurcation map as a function of λ and Re.
Energies 16 02550 g003
Figure 4. Distribution of temperature with θ = 0.1, 0.5, and 0.9 and vortical structure with λ2 = −0.1 as function of λ at Re = 100. (a) λ = 0; (b) λ = 1; (c) λ = 2; (d) λ = 3.
Energies 16 02550 g004
Figure 5. Distribution of temperature with θ = 0.1, 0.5, and 0.9 and vortical structure with λ2 = −0.1 as function of λ at Re = 500. (a) λ = 0; (b) λ = 1; (c) λ = 2; (d) λ = 3.
Energies 16 02550 g005aEnergies 16 02550 g005b
Figure 6. Distribution of temperature with θ = 0.1, 0.5, and 0.9 and vortical structure with λ2 = −0.1 as function of λ at Re = 1000. (a) λ = 0; (b) λ = 1; (c) λ = 2; (d) λ = 3.
Energies 16 02550 g006
Figure 7. Distribution of the volume-averaged orthogonal enstrophy as a function of the wavelength. (a) Re = 100; (b) Re = 500; (c) Re = 1000.
Energies 16 02550 g007
Figure 8. Primary frequency distribution of the surface-averaged Nusselt number for the heated bottom wall.
Energies 16 02550 g008
Figure 9. Distribution of time- and surface-averaged Nusselt number for the heated bottom wall as a function of wavelength.
Energies 16 02550 g009
Table 1. Comparison of present surface-averaged Nusselt numbers on the top wall of the cavity at Re = 100 with those reported by Khanafer and Aithal [16] and Ouertatani et al. [18].
Grashof
Number
NumeanError (%)
[16]Present
101.8381.8141.29
1041.7051.6761.71
1051.2041.2574.39
Grashof
Number
NumeanError (%)
[18]Present
1022.922.951.0
1043.503.530.9
1065.045.000.8
Disclaimer/Publisher’s Note: The statements, opinions and data contained in all publications are solely those of the individual author(s) and contributor(s) and not of MDPI and/or the editor(s). MDPI and/or the editor(s) disclaim responsibility for any injury to people or property resulting from any ideas, methods, instructions or products referred to in the content.

