


An Experimental Study on SO2 Emission and Ash Deposition Characteristics of High Alkali Red Mud under Large Proportional Co-Combustion Conditions in Fluidized Bed

 ,
,
Abstract
:1. Introduction
2. Experimental Section
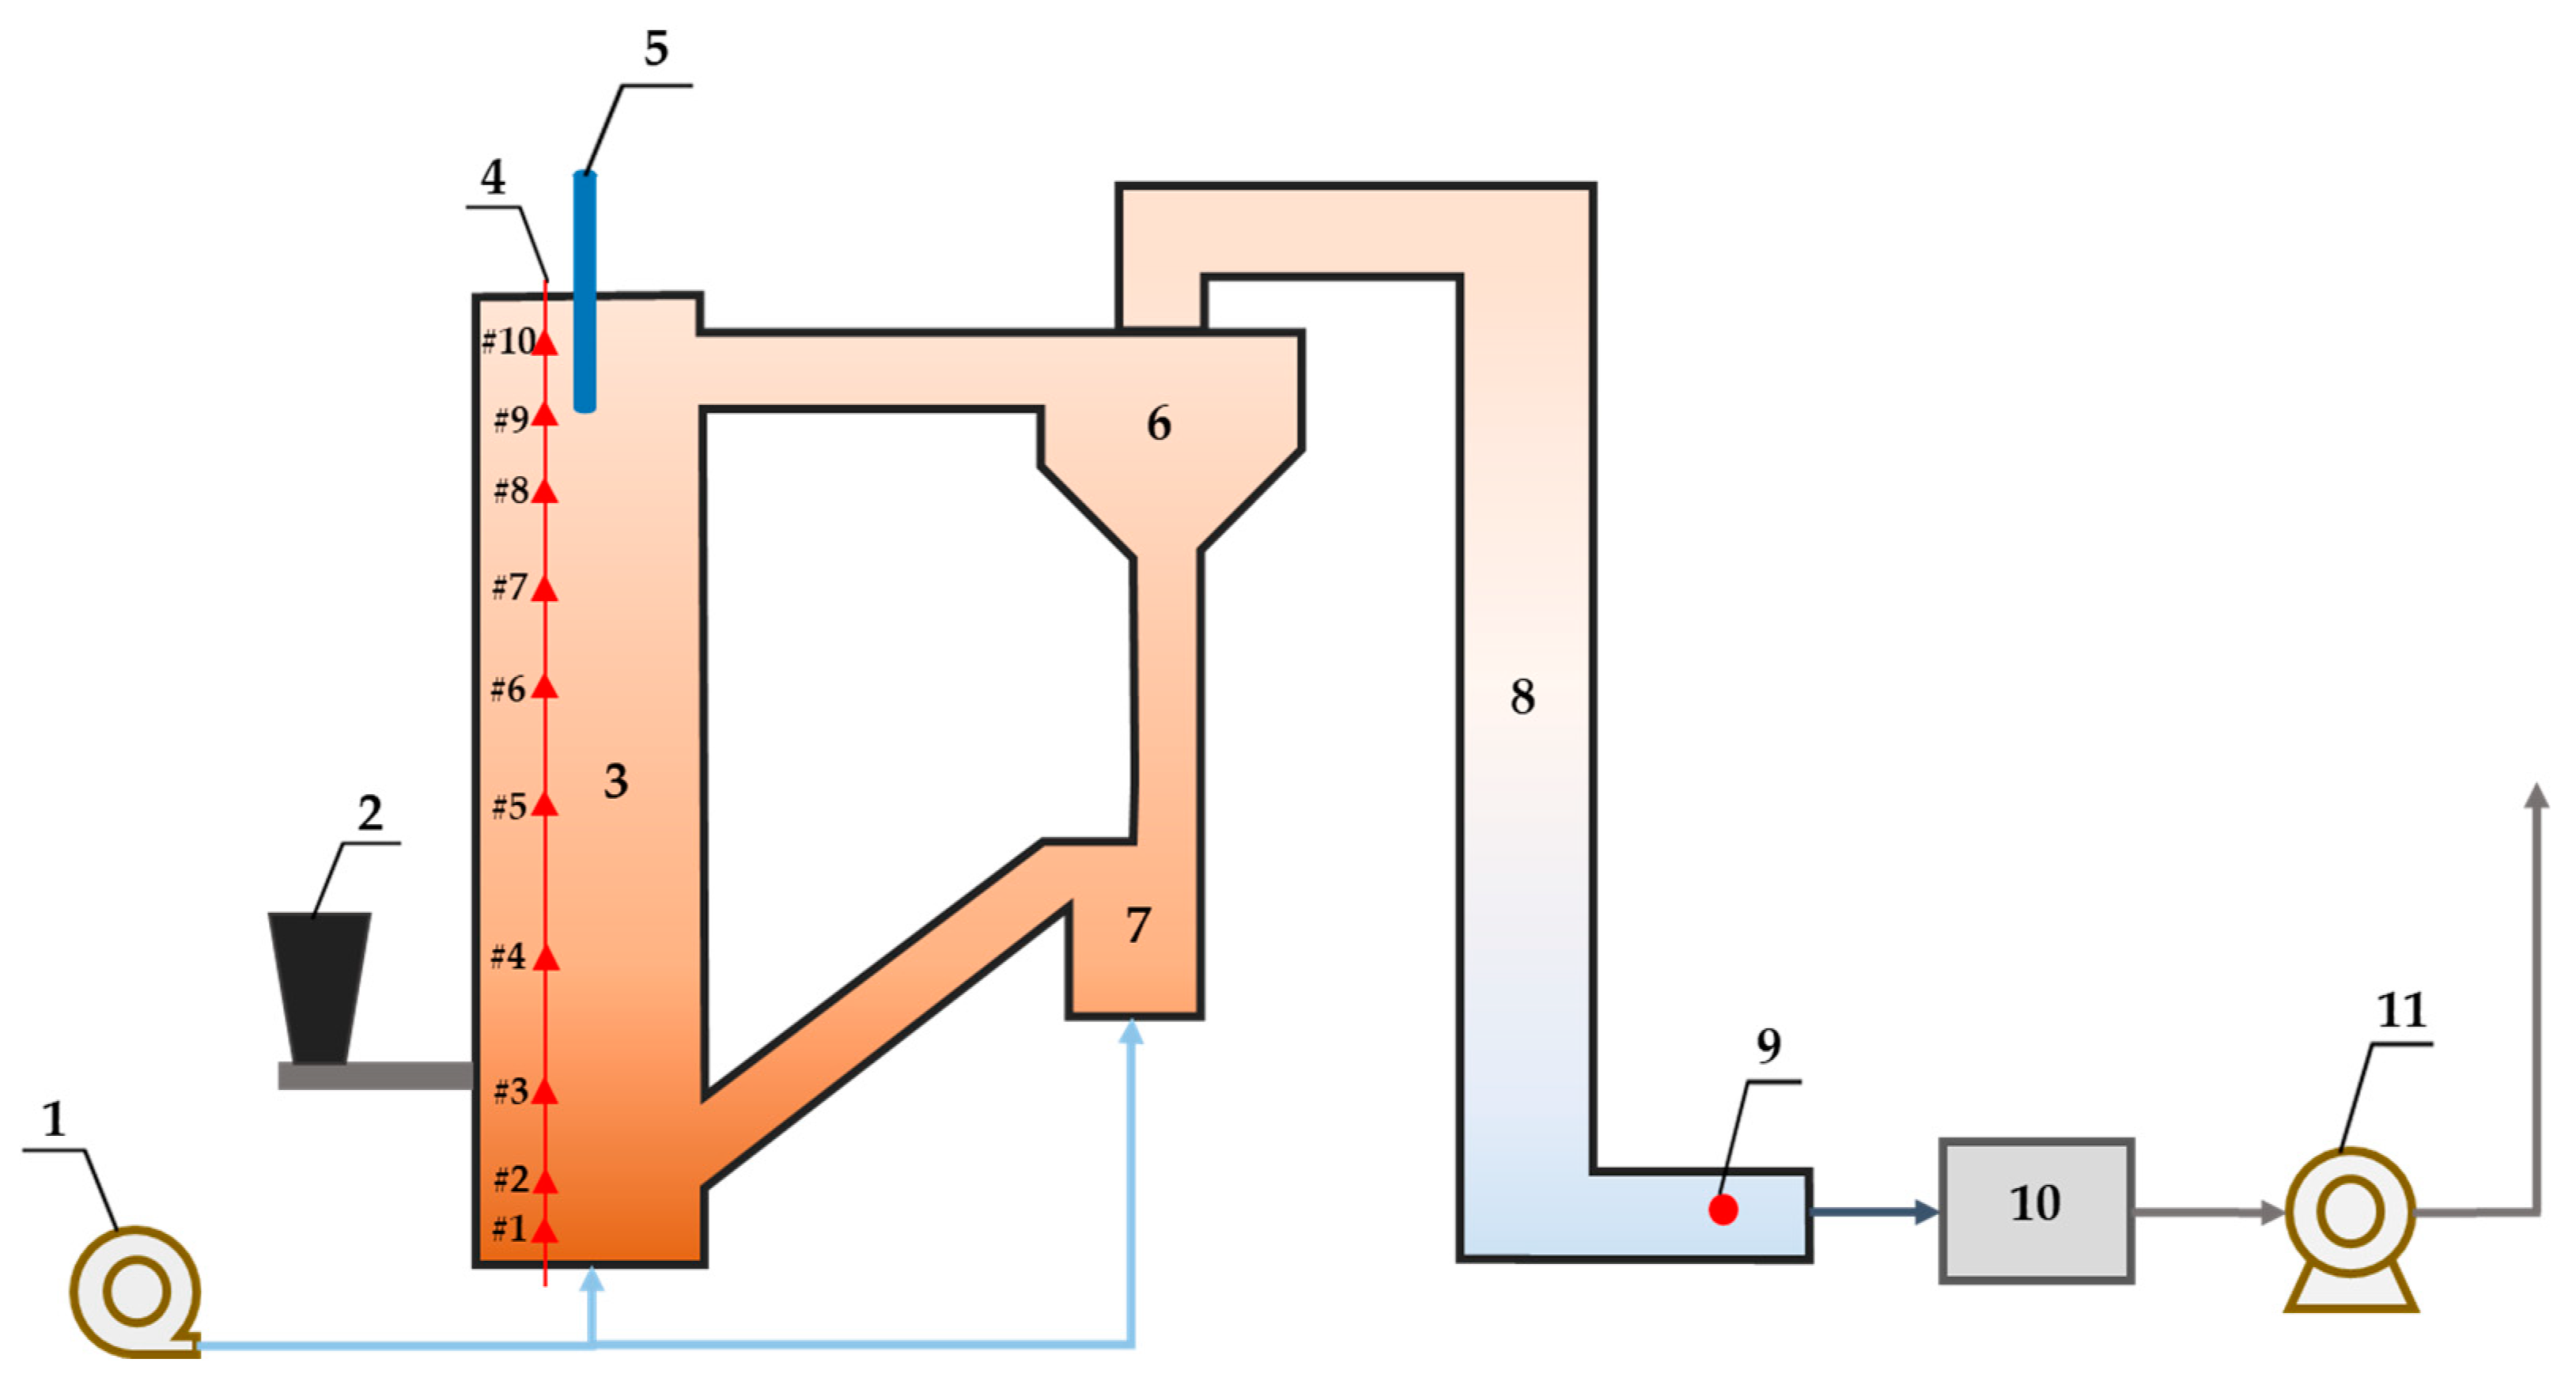
2.1. Introduction of Experimental Equipment
2.2. Material Characteristics
2.3. Experiment and Working Condition Arrangement
3. Results and Analysis
3.1. Combustion Characteristic
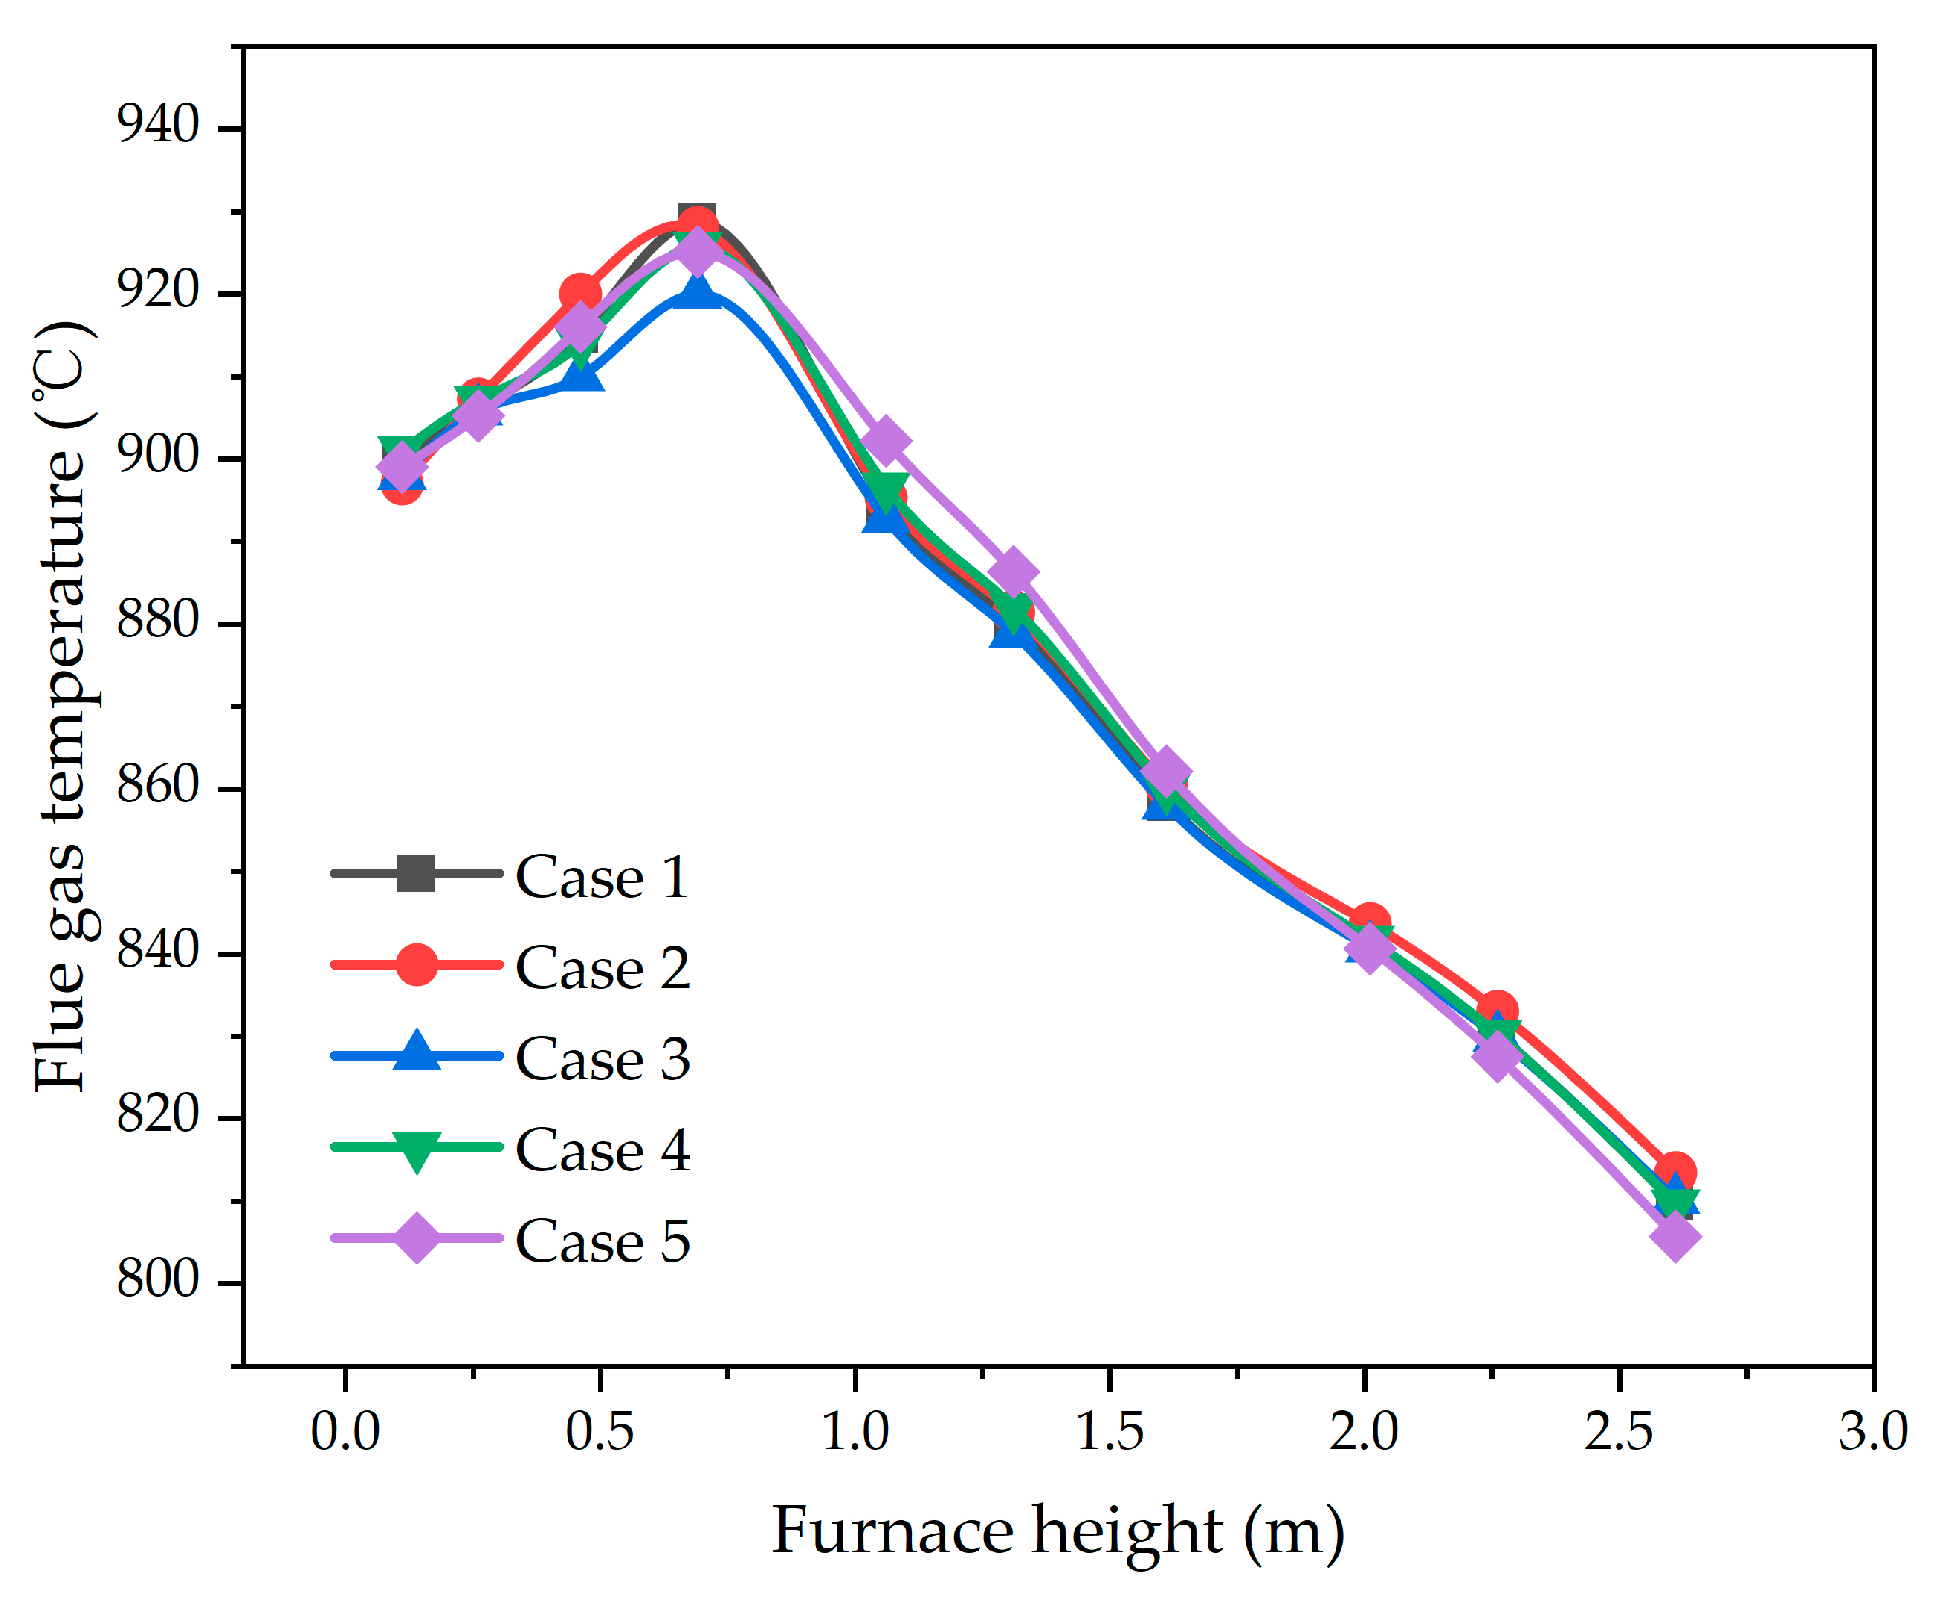
3.1.1. Furnace Temperature Distribution Characteristics
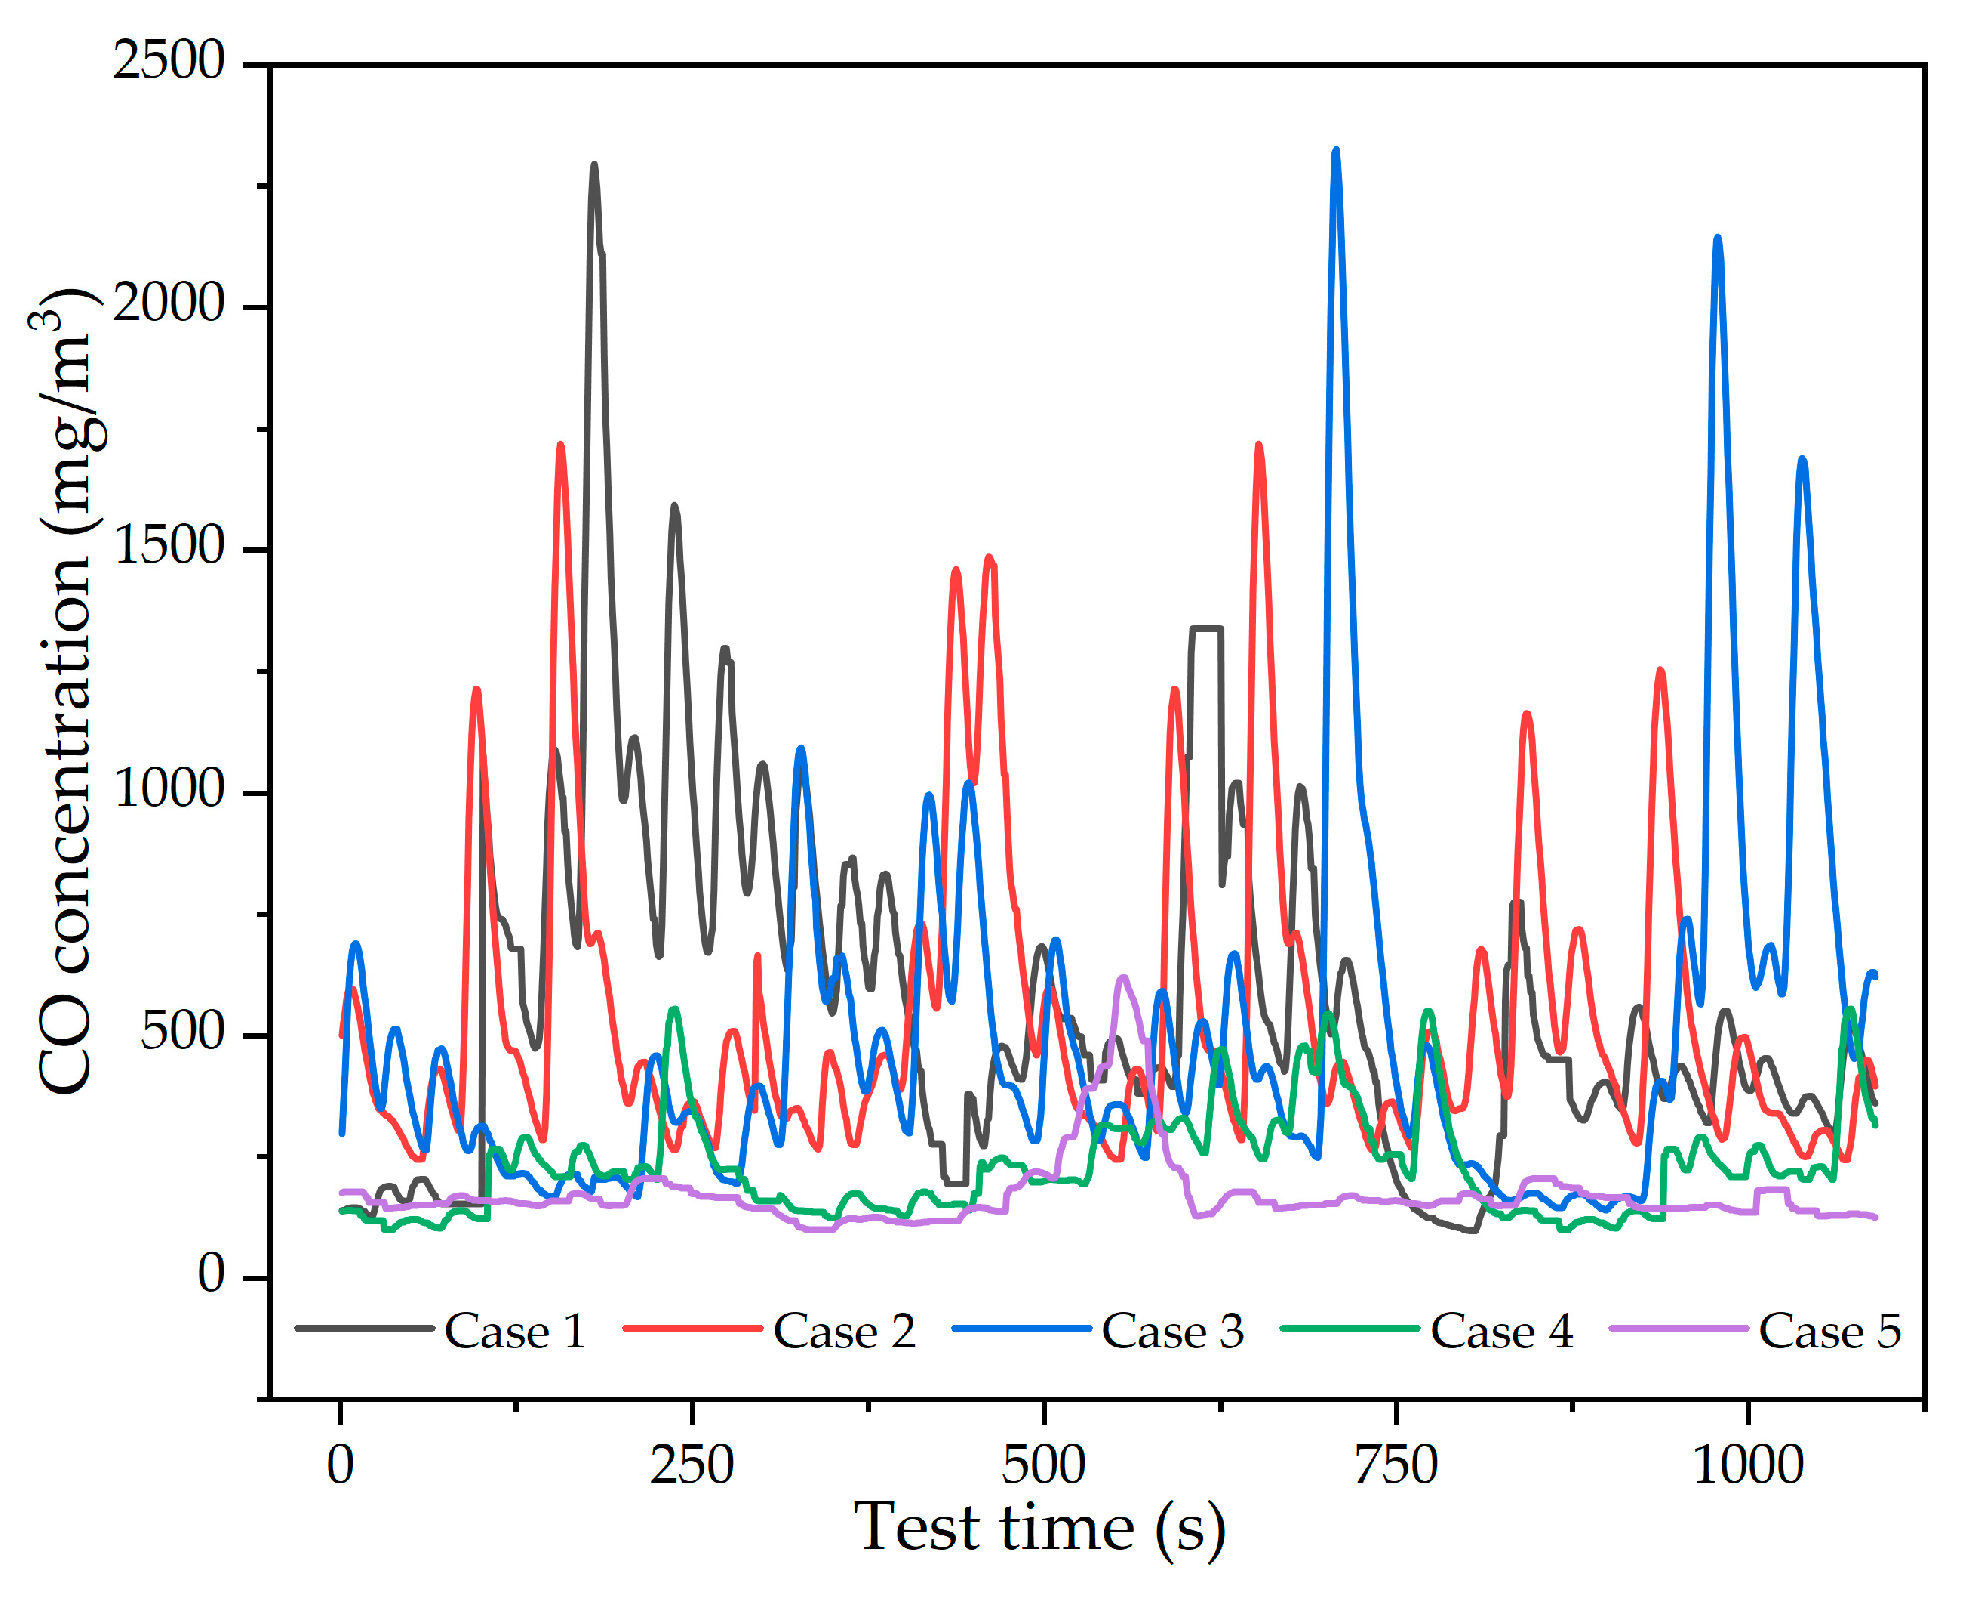
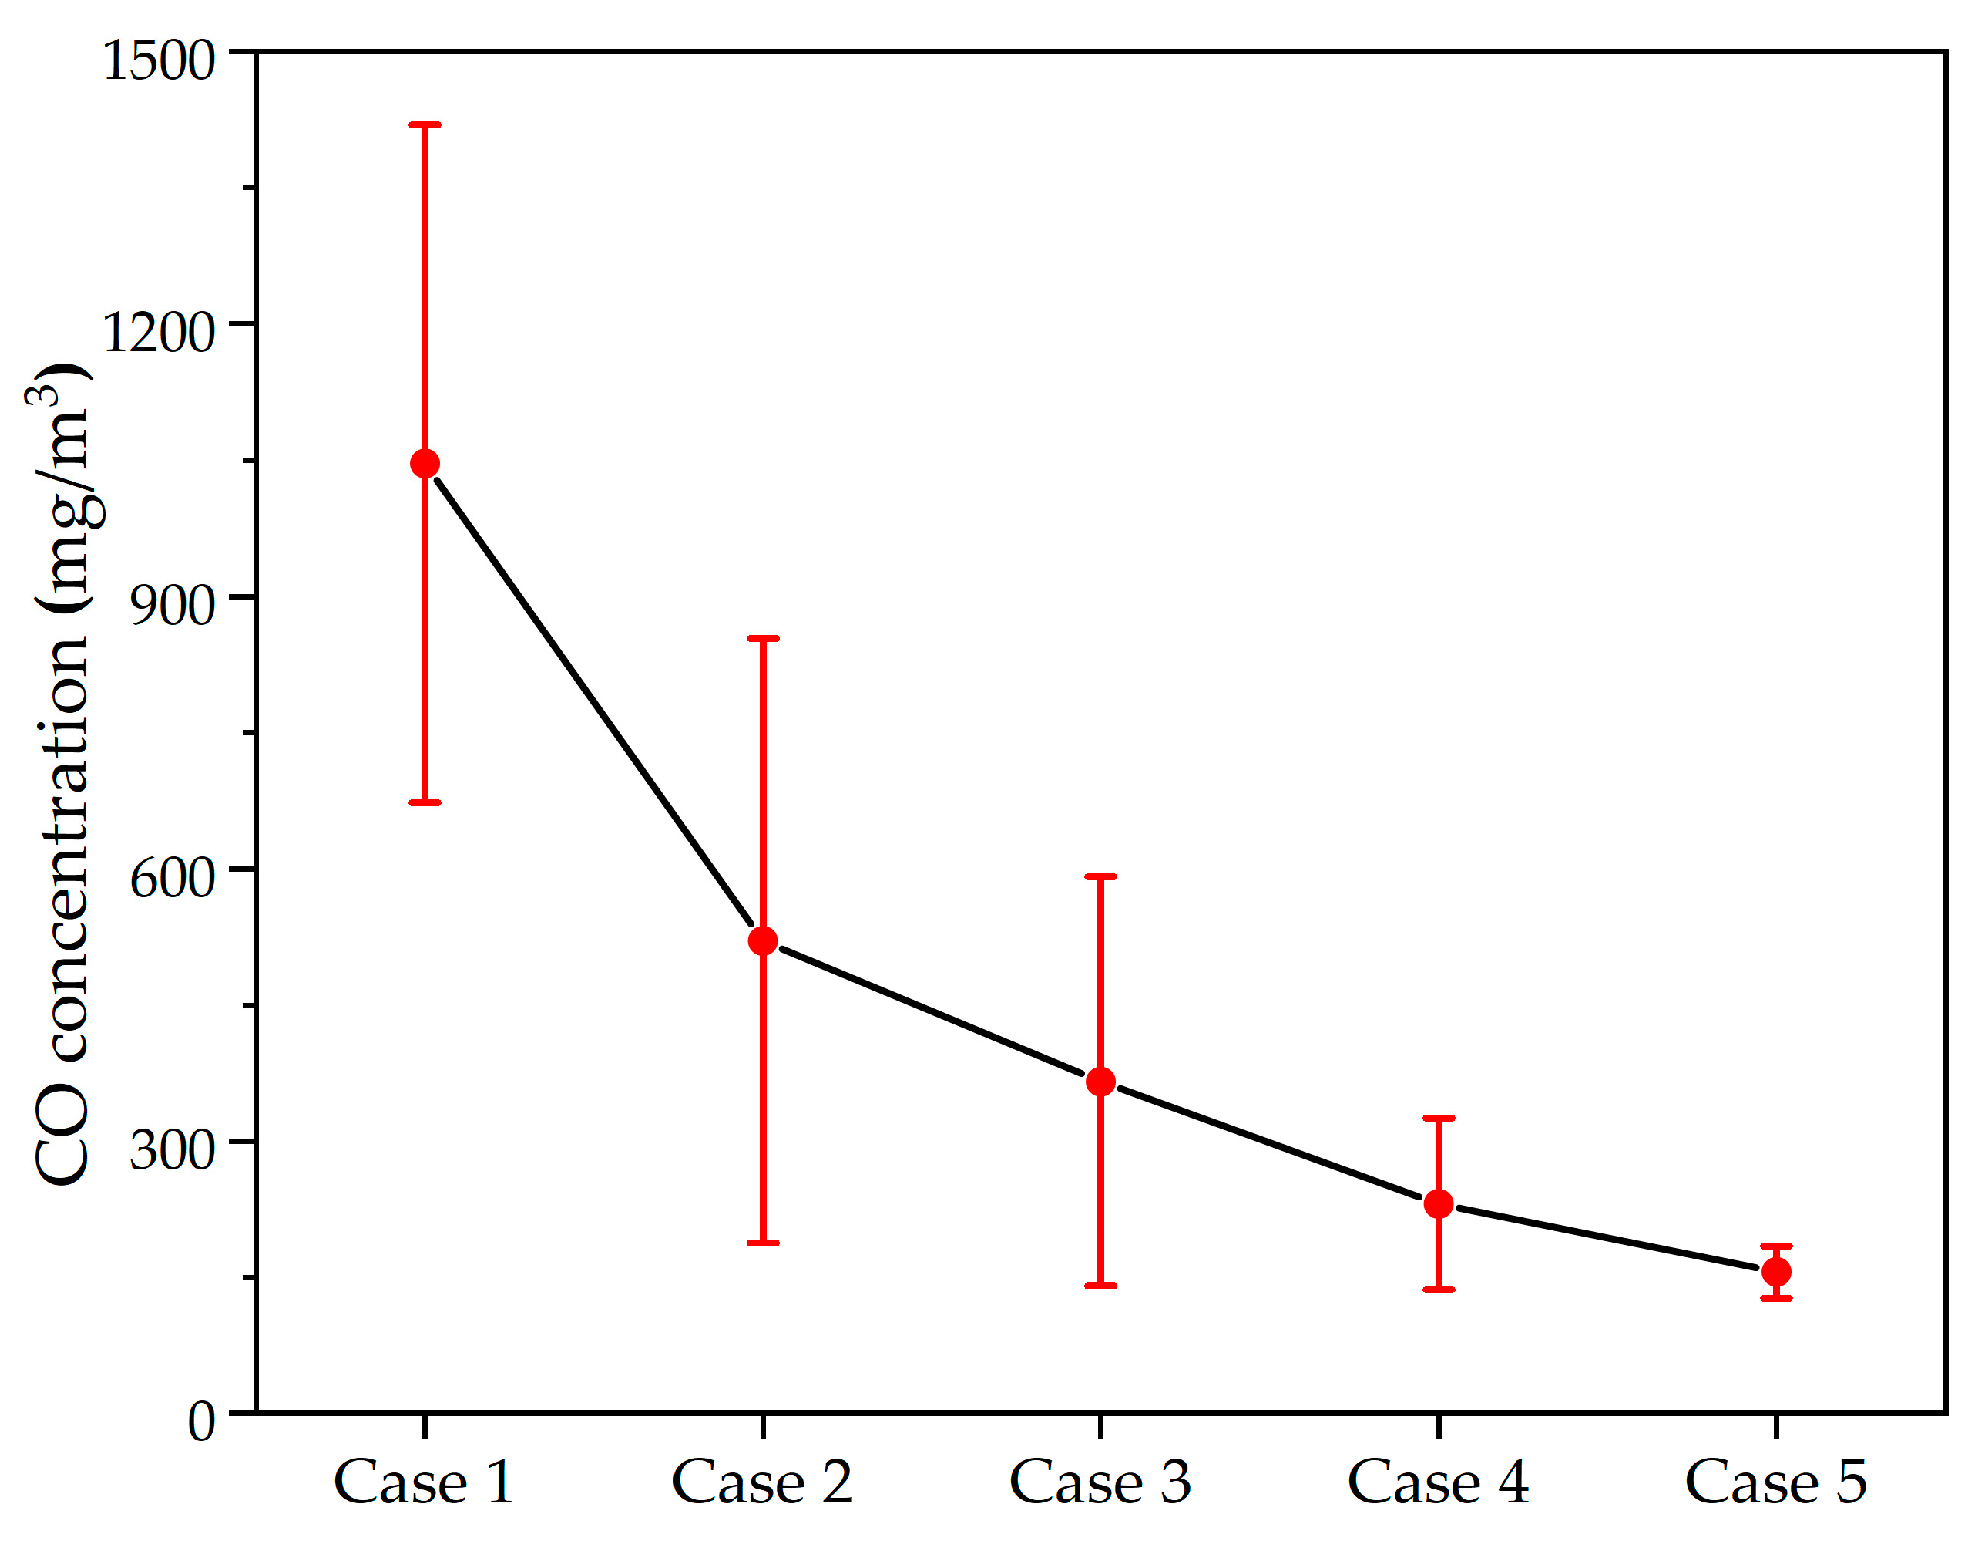
3.1.2. CO Emission
3.2. Pollutant Emission
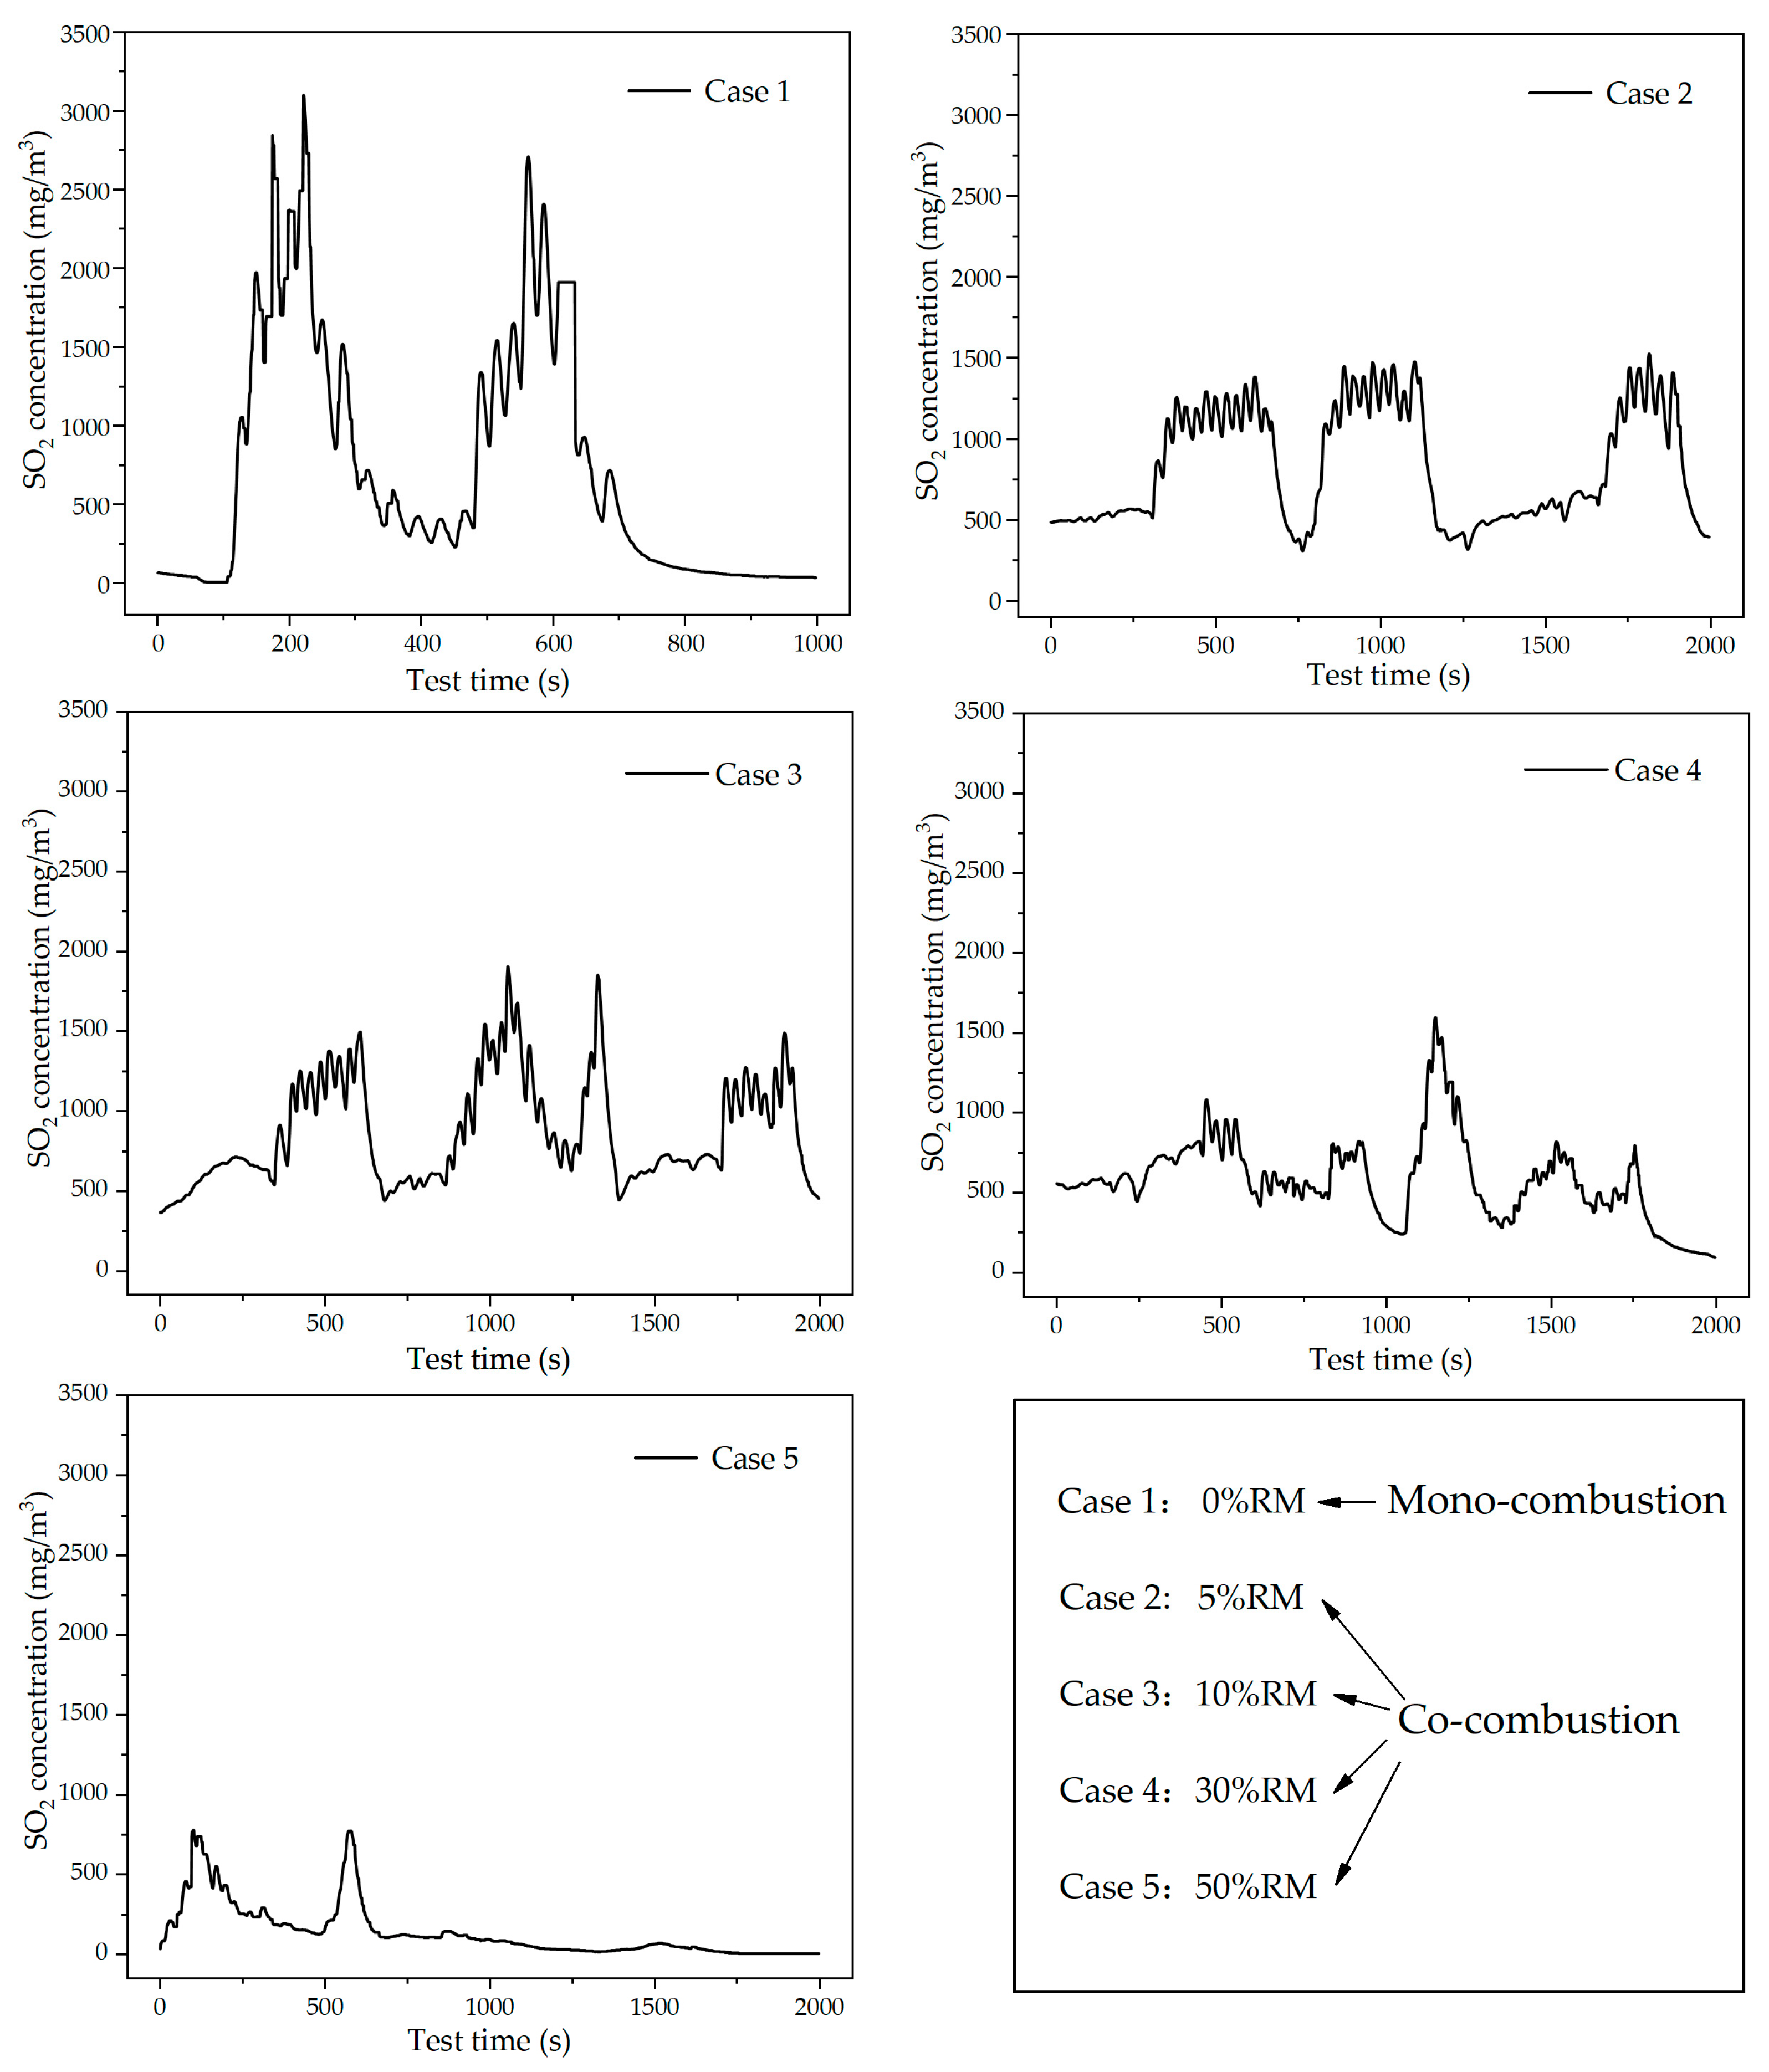
3.2.1. SO2 Emission
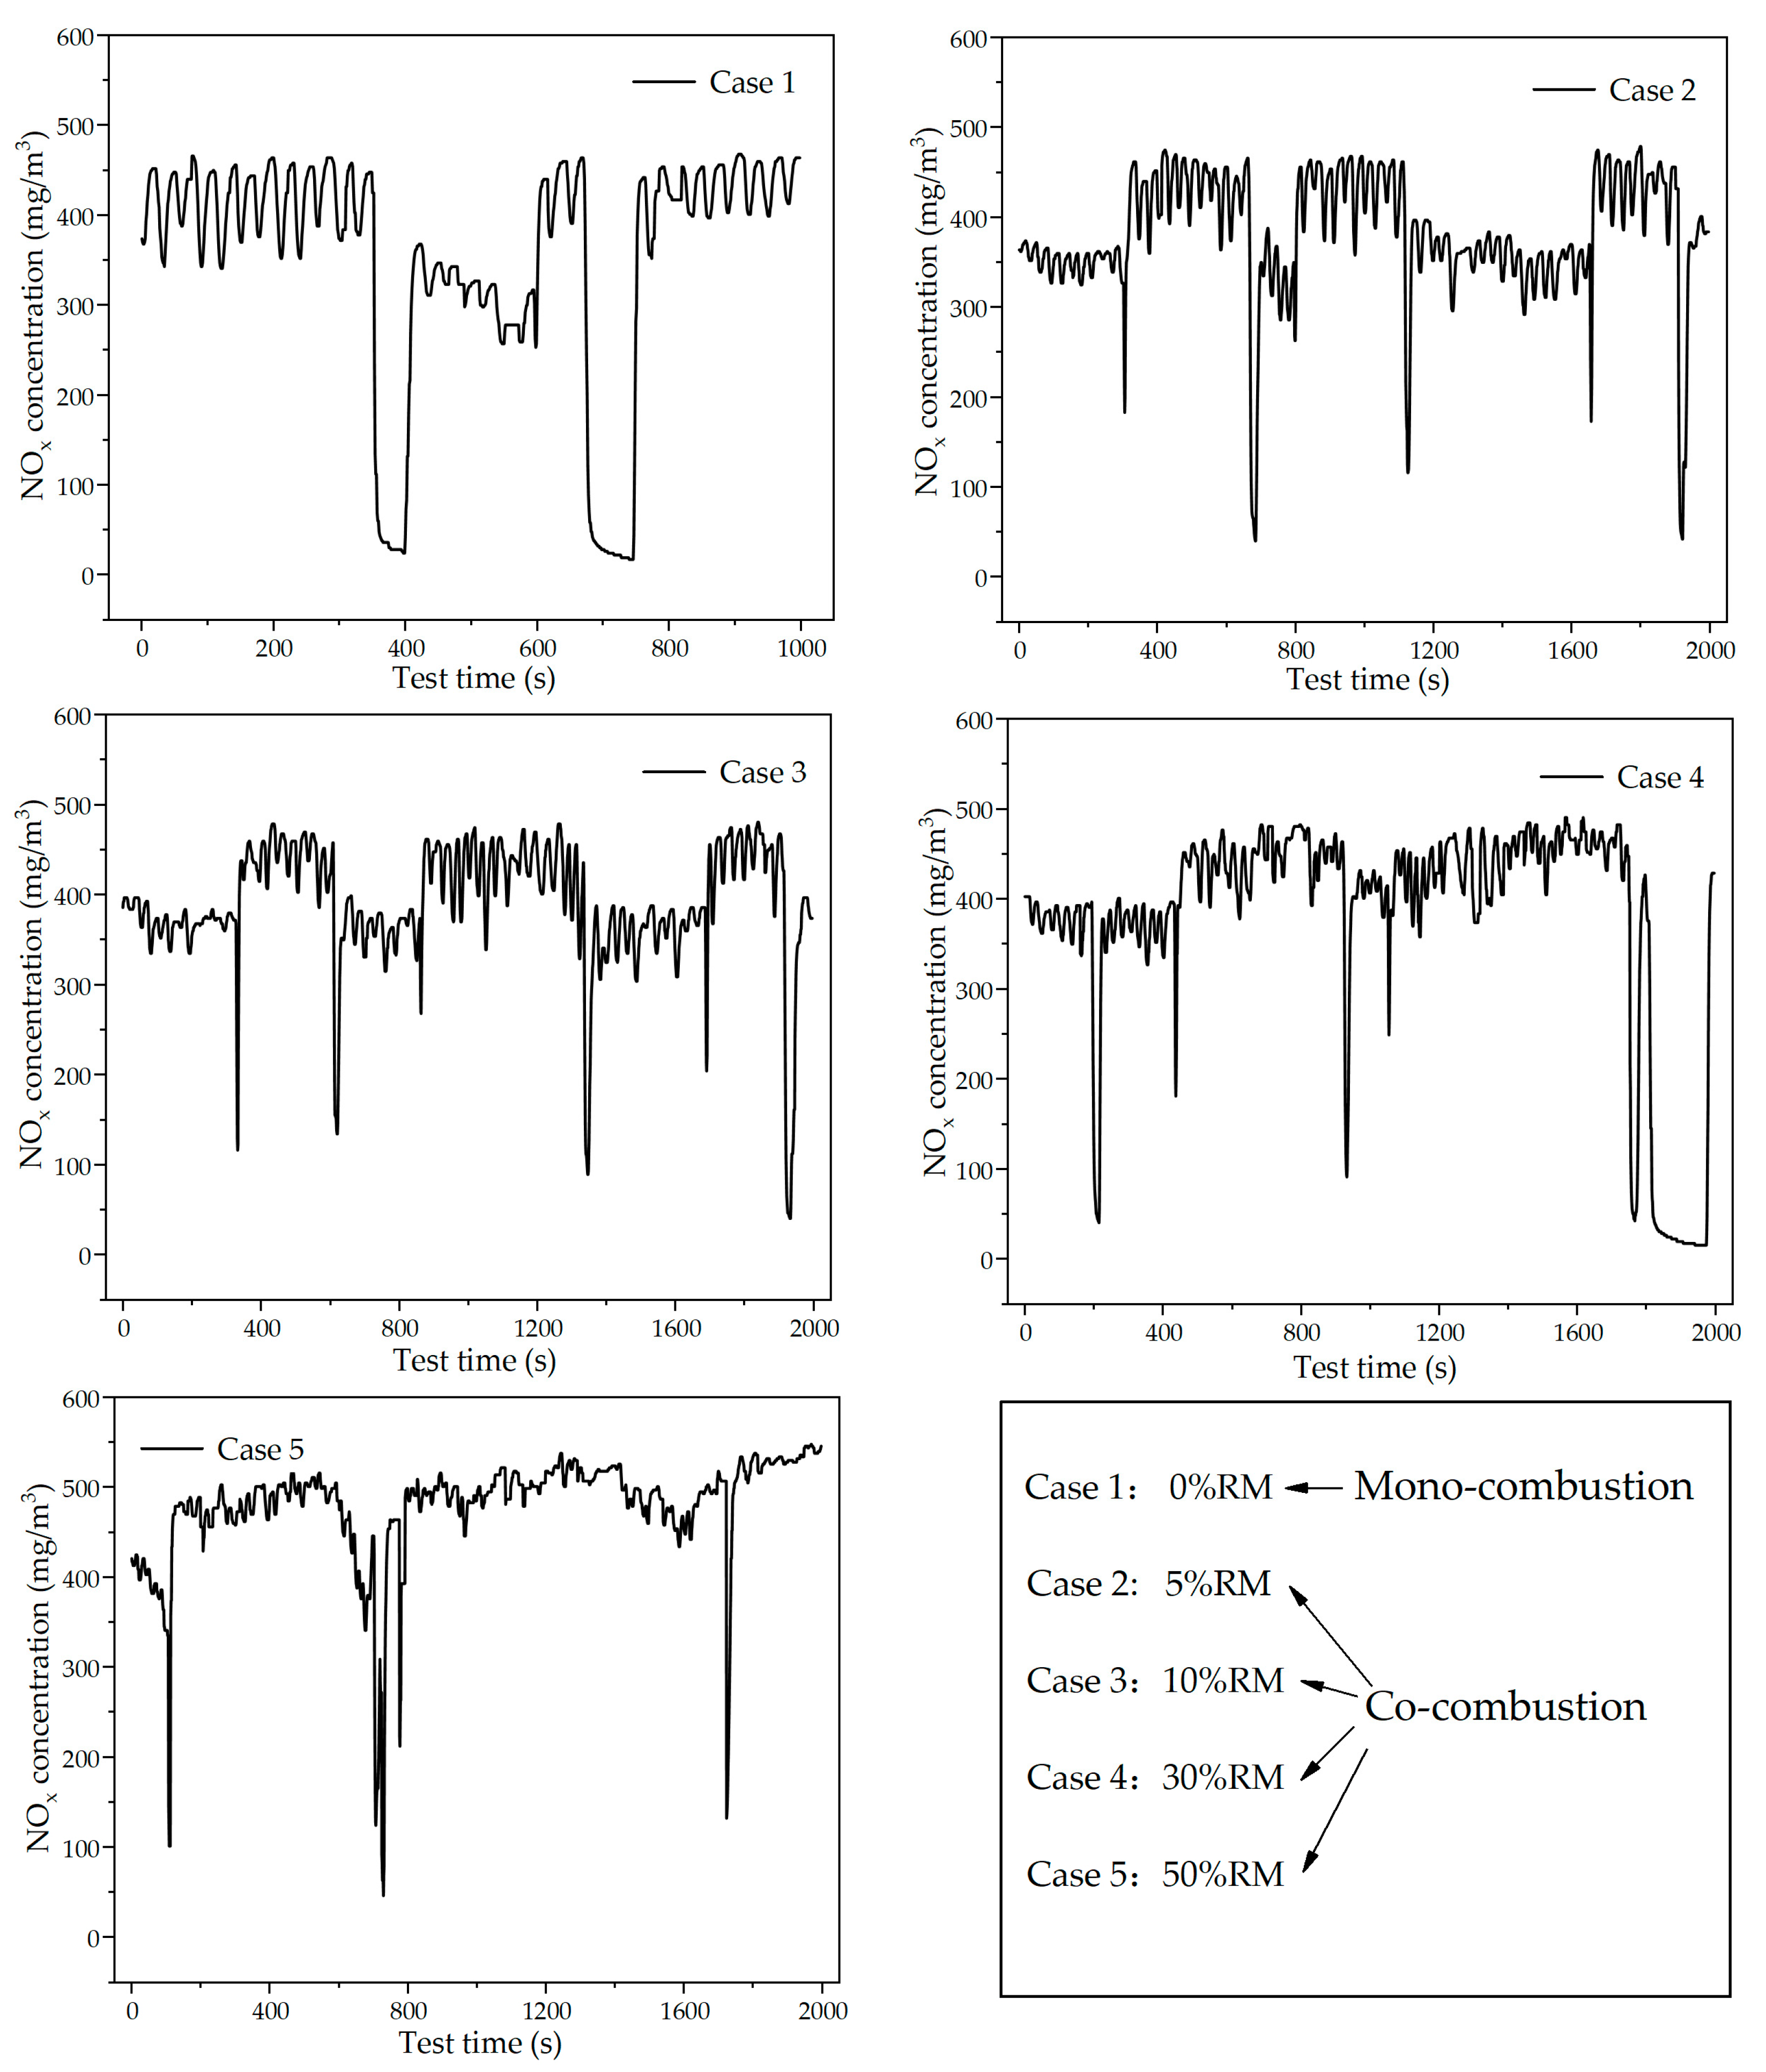
3.2.2. NOx Emission
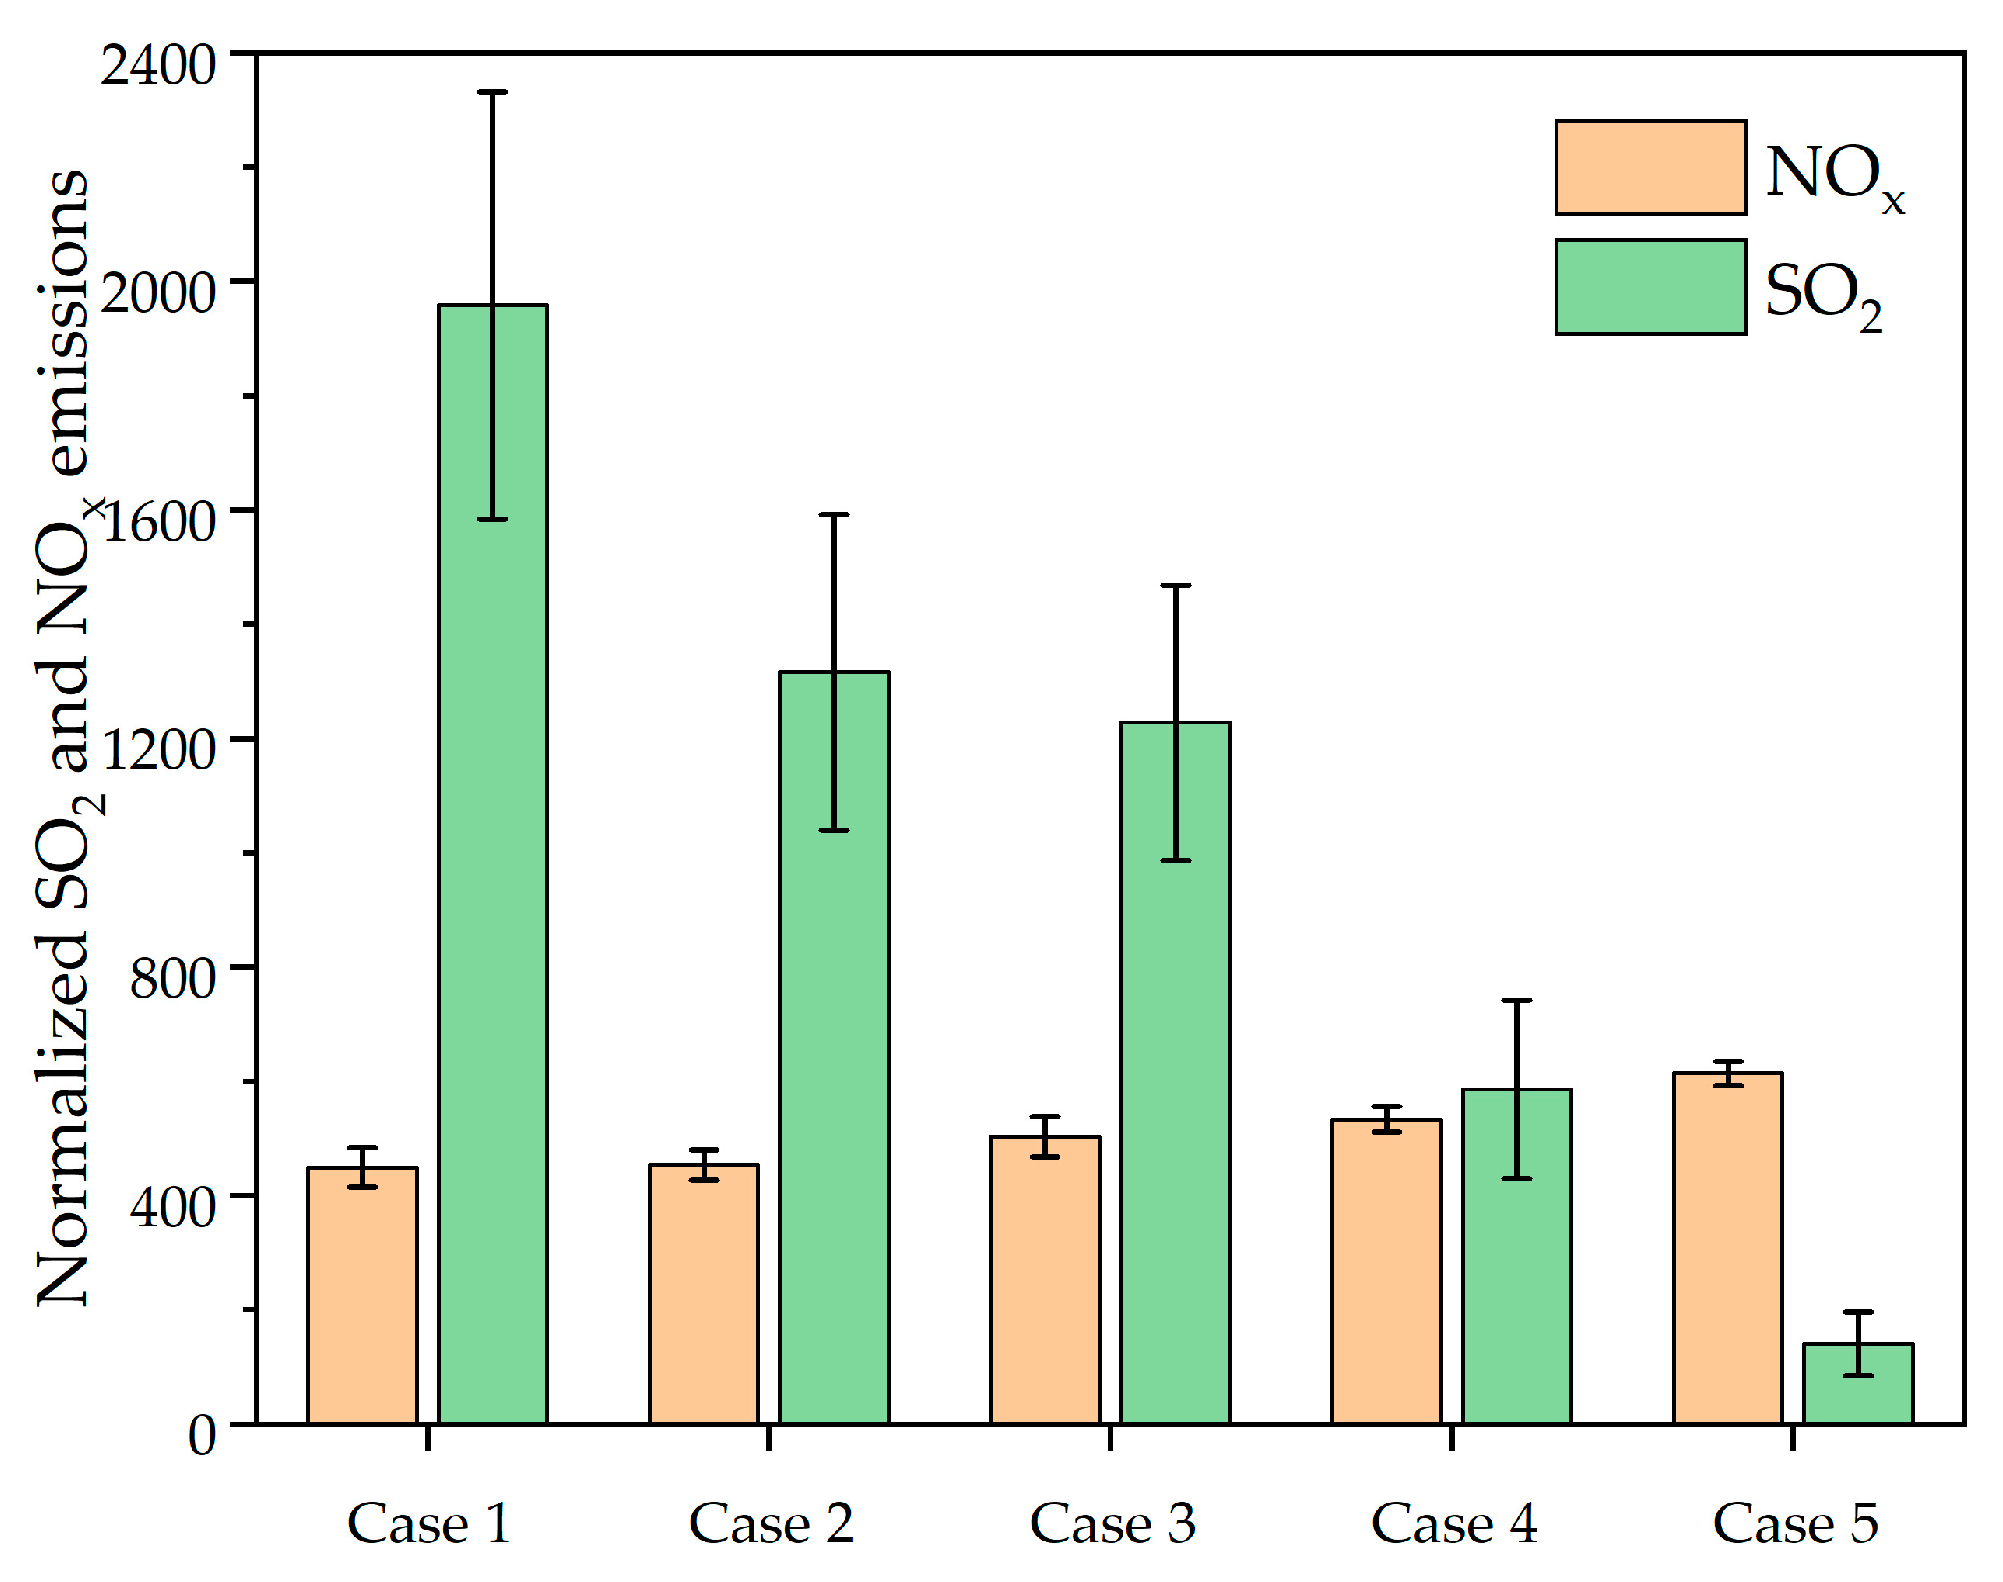
3.2.3. Co-Emission Characteristics of SO2 and NOx
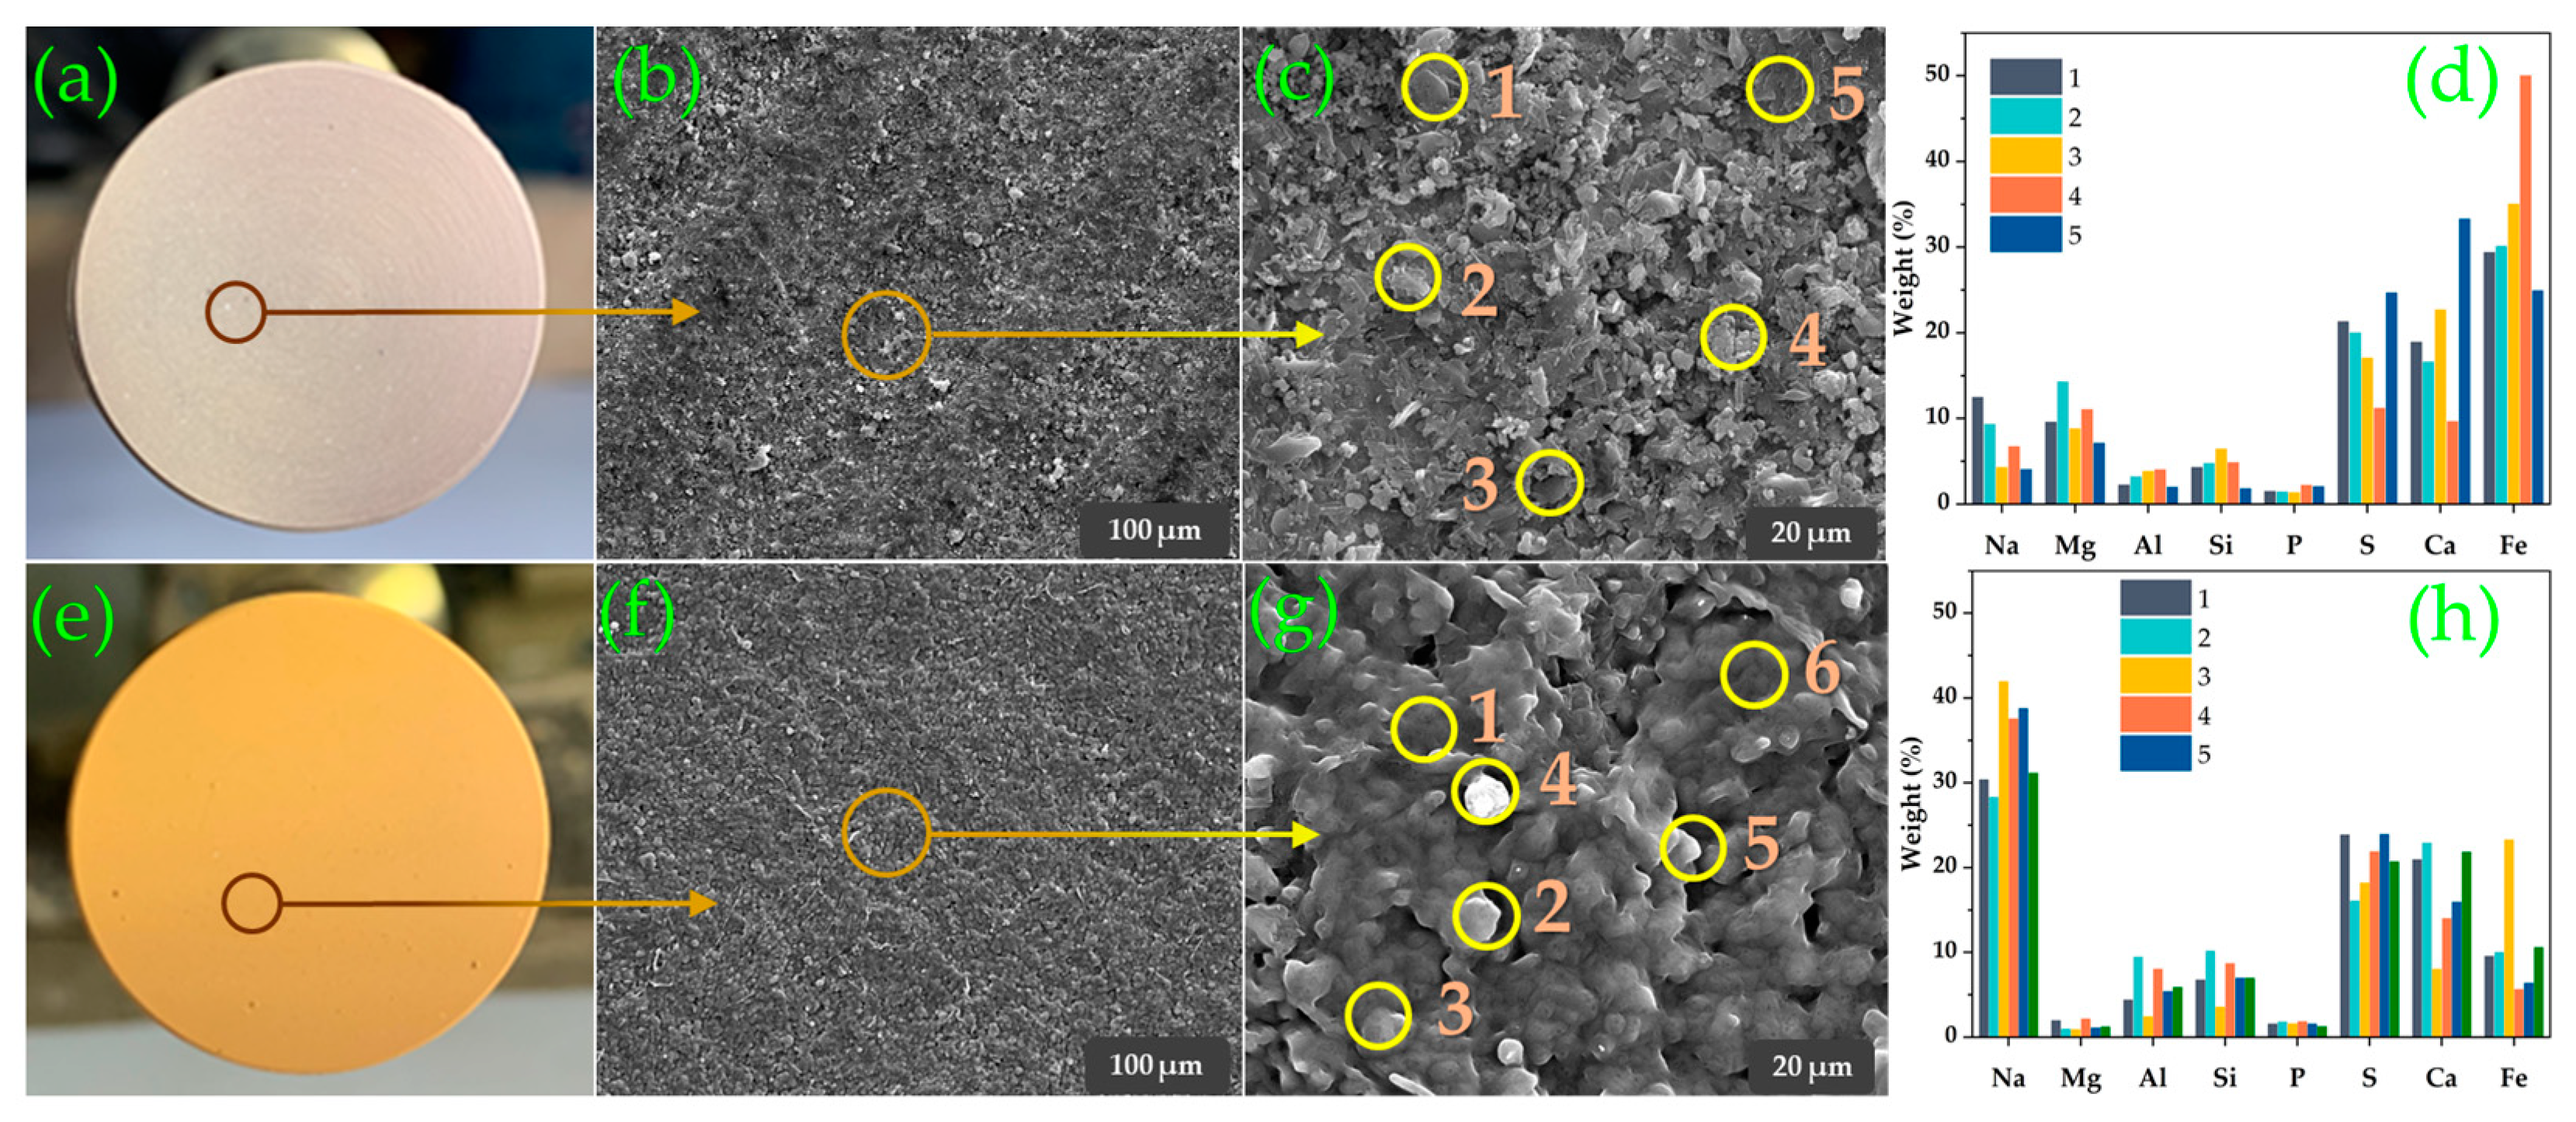
3.3. Ash Deposition and Sintering Characteristics
3.3.1. Deposition and Sintering Characteristics of the Probe
- (1)
- Top cover
- (2)
- Side
3.3.2. Bottom Ash
4. Conclusions
- With the increase in the RM blending ratio, the desulfurization efficiency kept increasing. When the proportion reached 50%, the dynamic emission of SO2 decreased significantly, and the overall desulfurization efficiency was 94%. After a period of circulating combustion, the SO2 emission dropped to a very low value, and the maximum desulfurization efficiency exceeded 99.5%. Clearly, the RM in-situ desulfurization had a certain lag.
- The RM co-combustion had little effect on the bed temperature. Due to the smaller particle size of RM, RM co-combustion was beneficial for improving the combustion efficiency and stabilizing the CO emissions at a low level. As the RM co-combustion proportion increased, the NOx emission would slightly increase. However, the NOx inhibition effect was able to be improved by properly increasing the feeding rate.
- The ash deposition and sintering were exhibited under large proportional co-combustion conditions. However, the sintering degree was obviously weaker than that of high alkali fuels such as Zhundong coal, which provided support for the application of long-term safe and stable operation. Meanwhile, the content of alkali metal sulfate in the ash increased significantly after RM co-combustion, which confirmed that RM had the clear effect of FGD.
Author Contributions
Funding
Data Availability Statement
Acknowledgments
Conflicts of Interest
References
- Milacic, R.; Zuliani, T.; Scancar, J. Environmental impact of toxic elements in red mud studied by fractionation and speciation procedures. Sci. Total Environ. 2012, 426, 359–365. [Google Scholar] [CrossRef]
- Yang, D.Z.; Wang, R.H.; Feng, X.Z.; Chu, Z.T.; Li, J.; Wei, W.F.; Zheng, R.J.; Zhang, J.; Chen, H. Transferring waste red mud into ferric oxide decorated ANA-type zeolite for multiple heavy metals polluted soil remediation. J. Hazard. Mater. 2022, 424, 127244. [Google Scholar] [CrossRef]
- Wang, M.F.; Liu, X.M. Applications of red mud as an environmental remediation material: A review. J. Hazard. Mater. 2021, 208, 124420. [Google Scholar] [CrossRef]
- Wang, Y.; Cheng, Y.S.; Yu, M.G.; Li, Y.; Cao, J.L.; Zheng, L.G.; Yi, H.W. Methane explosion suppression characteristics based on the NaHCO3/red-mud composite powders with core-shell structure. J. Hazard. Mater. 2017, 335, 84–91. [Google Scholar] [CrossRef]
- Akinci, A.; Akbulut, H.; Yilmaz, F. The effect of the red mud on polymer crystallization and the interaction between the polymer-filler. Polym.-Plast. Technol. Mater. 2007, 46, 31–36. [Google Scholar] [CrossRef]
- Ren, H.; Tang, Y.; Shi, W.; Chen, F.; Xu, Y. Red mud modified with graphene oxide for enhanced visible-light-driven photocatalytic performance towards the degradation of antibiotics. New J. Chem. 2019, 43, 19172–19179. [Google Scholar] [CrossRef]
- Singh, S.; De, M. Thermally exfoliated graphene oxide for hydrogen storage. Mater. Chem. Phys. 2019, 239, 122102. [Google Scholar] [CrossRef]
- Singh, S.; De, M. Improved hydrogen uptake of metal modified reduced and exfoliated graphene oxide. J. Mater. Res. 2022, 36, 3109–3120. [Google Scholar] [CrossRef]
- Ahmed, M.; Batalha, N.; Qiu, T.F.; Hasan, M.D.; Atanda, L.; Amiralian, N.; Wang, L.Z.; Pneg, H.; Konarova, M. Red-mud based porous nanocatalysts for valorisation of municipal solid waste. J. Hazard. Mater. 2020, 396, 122711. [Google Scholar] [CrossRef]
- Zhang, H.F.; Chen, L.; Liu, X.Y.; Ge, H.J.; Song, T.; Shen, L.H. Characteristics of cyanobacteria pyrolysis and gasification during chemical looping process with red mud oxygen carrier. J. Fuel Chem. Technol. 2021, 49, 1802–1811. [Google Scholar] [CrossRef]
- Liu, H.; Han, K.; Niu, S.; Lu, C.; Liu, M.; Li, H. Experimental Study and Mechanism Analysis of Modified Limestone by Red Mud for Improving Desulfurization. In Proceedings of the International Symposium on Coal Combustion, Harbin, China, 17–21 July 2011. [Google Scholar]
- Tao, L.; Wu, H.; Wang, J.; Li, B.; Wang, X.; Ning, P. Removal of SO2 from flue gas using Bayer red mud: Influence factors and mechanism. J. Cent. South Univ. 2019, 26, 467–478. [Google Scholar] [CrossRef]
- Liu, Y.; Li, B.; Lei, X.L.; Liu, S.; Zhu, H.X.; Ding, E.M.; Ning, P. Novel method for high-performance simultaneous removal of NOx and SO2 by coupling yellow phosphorus emulsion with red mud. Chem. Eng. J. 2022, 428, 131991. [Google Scholar] [CrossRef]
- Wang, X.; Zhang, Y.; Lv, F.; An, Q.; Lu, R.; Hu, P. Removal of alkali in the red mud by SO2and simulated flue gas under mild conditions. Environ. Prog. Sustain. 2014, 34, 81–87. [Google Scholar] [CrossRef]
- Blaszczuk, A.; Nowak, W. Heat transfer behavior inside a furnace chamber of large-scale supercritical CFB reactor. Heat Mass Transf. 2015, 87, 464–480. [Google Scholar] [CrossRef]
- Yan, J.; Lu, X.; Zhan, C.; Li, Q.; Wang, J.; Liu, S.; Zheng, X.; Fan, X. An Experimental Study on the Characteristics of NOx Distributions at the SNCR Inlets of a Large-Scale CFB Boiler. Energies 2021, 14, 1267. [Google Scholar] [CrossRef]
- Blaszczuk, A.; Nowak, W. Bed-to-wall heat transfer coefficient in a supercritical CFB boiler at different bed particle sizes. Int. J. Heat Mass Transf. 2014, 79, 736–749. [Google Scholar] [CrossRef]
- Ke, X.; Zhu, S.; Huang, Z.; Zhang, M.; Lyu, J.; Yang, H.; Zhou, T. Issues in deep peak regulation for circulating fluidized bed combustion: Variation of NOx emissions with boiler load. Environ. Pollut. 2023, 318, 120912. [Google Scholar] [CrossRef]
- Blaszczuk, A.; Leszczynski, J.; Nowak, W. Simulation model of the mass balance in a supercritical circulating fluidized bed combustor. Powder Technol. 2014, 246, 317–326. [Google Scholar] [CrossRef]
- Li, Y.; Kang, K.; Wang, W. Quality Improvement and Cost Evaluation of Pellet Fuel Produced from Pruned Fruit Tree Branches. Energies 2022, 15, 113. [Google Scholar] [CrossRef]
- Barišić, V.; Hupa, M. On changes in bed-material particles from a 550 MWth CFB boiler burning coal, bark and peat. Fuel 2007, 86, 464–468. [Google Scholar] [CrossRef]
- Yan, J.; Lu, X.; Sun, R.; Zheng, X. An experimental study on the feasibility of in-situ desulfurization performance in a CFB combustor co-burning red mud and coal. Fuel Process. Technol. 2021, 223, 106985. [Google Scholar] [CrossRef]
- Liu, Z.; Li, J.; Zhu, M.; Lu, X.; Zhang, Z.; Zhang, D. Effect of oil shale semi-coke on deposit mineralogy and morphology in the flue path of a CFB burning Zhundong lignite. Front. Energy 2021, 15, 26–37. [Google Scholar] [CrossRef]
- Li, J.; Zhu, M.; Zhang, Z.; Zhang, D. Effect of Ashing Temperature on the Physicochemical Properties of Zhundong Lignite Ashes Prepared in a Muffle Furnace. In Proceedings of the International Symposium on Coal Combustion, Beijing, China, 19–22 July 2015. [Google Scholar]
- Wang, F.; Liu, H.; Zuo, G.; Guan, J. Experimental Investigation on Slagging Grade of Zhundong Coal Based on 10 MW Combustion Test Bed. In Proceedings of the International Symposium on Coal Combustion, Beijing, China, 19–22 July 2015. [Google Scholar]
- Liu, Z.; Li, J.; Zhu, M.; Cheng, F.; Lu, X.; Zhang, Z.; Zhang, D. An experimental investigation into the effect of flue gas recirculation on ash deposition and Na migration behaviour in circulating fluidized bed during combustion of high sodium Zhundong lignite. Fuel Process. Technol. 2020, 199, 106300. [Google Scholar] [CrossRef]
- Yan, J.; Zheng, X.; Lu, X.; Liu, Z.; Fan, X. Enhanced combustion behavior and NOx reduction performance in a CFB combustor by combining flue gas recirculation with air-staging: Effect of injection position. J. Energy Inst. 2021, 96, 294–309. [Google Scholar] [CrossRef]
- Czakiert, T.; Krzywanski, J.; Zylka, A.; Nowak, W. Chemical Looping Combustion: A Brief Overview. Energies 2022, 15, 1563. [Google Scholar] [CrossRef]
- Sun, Q.; Zhu, A.; Yang, X.; Niu, J.; Xu, Y. Formation of NOx from N2 and O2 in catalyst-pellet filled dielectric barrier discharges at atmospheric pressure. Chem. Commun. 2003, 12, 1418–1419. [Google Scholar] [CrossRef]
- Krzywanski, J.; Czakiert, T.; Nowak, W.; Shimizu, T.; Zylka, A.; Idziak, K. Gaseous emissions from advanced CLC and oxyfuel fluidized bed combustion of coal and biomass in a complex geometry facility: A comprehensive model. Energy 2022, 251, 123896. [Google Scholar] [CrossRef]
- Krzywanski, J.; Ashraf, W.M.; Czakiert, T.; Sosnowski, M.; Grabowska, K.; Zylka, A.; Kulakowska, A.; Skrobek, D.; Mistal, S.; Gao, Y. CO2 Capture by Virgin Ivy Plants Growing Up on the External Covers of Houses as a Rapid Complementary Route to Achieve Global GHG Reduction Targets. Energies 2022, 15, 1683. [Google Scholar] [CrossRef]
- Diego, L.; Londonot, C.; Wang, X.; Gibbs, B. Influence of operating parameters on NOx and N2O axial profiles in a circulating fluidized bed combustor. Fuel Energy ABS 1996, 37, 369. [Google Scholar]
- Liu, Z.; Li, L.; Wang, Q.; Lu, X.; Zhang, Y.; Zhu, M.; Zhang, Z.; Zhang, D. An experimental investigation into mineral transformation, particle agglomeration and ash deposition during combustion of Zhundong lignite in a laboratory-scale circulating fluidized bed. Fuel 2019, 243, 458–468. [Google Scholar] [CrossRef]


| References | Methods (Properties) | Condition | Desulfurization Performance |
|---|---|---|---|
| [8] | Modified limestone | Ca/metal ratio = 15:1 900 °C | 15.31% higher than CaO |
| [9] | Wet desulphurization | Liquid–solid ratio = 20:1 25 °C | 98.61% |
| [10] | Wet desulphurization | Liquid–solid ratio = 50:1 50 °C | 100% |
| [11] | Wet desulphurization | Liquid–solid ratio = 3:1 60 °C | 92.5% |
| Number | #1 | #2 | #3 | #4 | #5 | #6 | #7 | #8 | #9 | #10 |
|---|---|---|---|---|---|---|---|---|---|---|
| Height (m) | 0.11 | 0.26 | 0.46 | 0.69 | 1.06 | 1.31 | 1.61 | 2.01 | 2.26 | 2.61 |
| Item | Range | Precision (Based on Measured Values) |
|---|---|---|
| O2 | 0–21% | 0.2% |
| CO | 0–10,000 ppm | 5% |
| SO2 | 0–5000 ppm | 5% |
| NO | 0–1000 ppm | 5% |
| NO2 | 0–5000 ppm | 5% |
| Item | Industrial Analysis (wt.%, as Received Basis) | ||||||||
| Composition | Moisture | Volatile | Fixed carbon | Ash | |||||
| Value | 6.55 | 30.37 | 58.55 | 4.53 | |||||
| Item | Elemental Analysis (wt.%, as Received Basis) | ||||||||
| Composition | N | C | H | S | O | ||||
| Value | 0.94 | 76.57 | 4.618 | 0.249 | 17.623 | ||||
| Item | Ash Chemistry (wt.%) | ||||||||
| Composition | SiO2 | Al2O3 | Fe2O3 | CaO | MgO | TiO2 | P2O5 | K2O | Na2O |
| Value | 8.09 | 5.06 | 18.60 | 39.20 | 4.84 | 0.97 | 0.23 | 0.21 | 1.44 |
| Composition | CaO | Fe2O3 | Al2O3 | Na2O | TiO2 | MgO | K2O |
|---|---|---|---|---|---|---|---|
| Value (wt.%) | 31.37 | 17.33 | 16.43 | 8.48 | 5.15 | 0.50 | 0.32 |
| Parameters | Case 1 | Case 2 | Case 3 | Case 4 | Case 5 |
|---|---|---|---|---|---|
| Bed temperature (°C. #4) | 900 ± 10 | 897 ± 10 | 898 ± 10 | 901 ± 10 | 899 ± 10 |
| Furnace outlet temperature (°C. #10) | 810 ± 10 | 813 ± 10 | 810 ± 10 | 809 ± 10 | 806 ± 10 |
| RM co-combustion ratio | 0% | 5% | 10% | 30% | 50% |
| Superficial fluidization velocity (m·s−1, 20 °C) | 0.59 | 0.59 | 0.59 | 0.59 | 0.59 |
| Excess air coefficient | 1.46 | 1.46 | 1.57 | 1.65 | 1.78 |
Disclaimer/Publisher’s Note: The statements, opinions and data contained in all publications are solely those of the individual author(s) and contributor(s) and not of MDPI and/or the editor(s). MDPI and/or the editor(s) disclaim responsibility for any injury to people or property resulting from any ideas, methods, instructions or products referred to in the content. |
© 2023 by the authors. Licensee MDPI, Basel, Switzerland. This article is an open access article distributed under the terms and conditions of the Creative Commons Attribution (CC BY) license (https://creativecommons.org/licenses/by/4.0/).
Share and Cite
Yu, X.; Yan, J.; Sun, R.; Mei, L.; Li, Y.; Wang, S.; Wang, F.; Gu, Y. An Experimental Study on SO2 Emission and Ash Deposition Characteristics of High Alkali Red Mud under Large Proportional Co-Combustion Conditions in Fluidized Bed. Energies 2023, 16, 2584. https://doi.org/10.3390/en16062584
Yu X, Yan J, Sun R, Mei L, Li Y, Wang S, Wang F, Gu Y. An Experimental Study on SO2 Emission and Ash Deposition Characteristics of High Alkali Red Mud under Large Proportional Co-Combustion Conditions in Fluidized Bed. Energies. 2023; 16(6):2584. https://doi.org/10.3390/en16062584
Chicago/Turabian StyleYu, Xiaoliang, Jin Yan, Rongyue Sun, Lin Mei, Yanmin Li, Shuyuan Wang, Fan Wang, and Yicheng Gu. 2023. "An Experimental Study on SO2 Emission and Ash Deposition Characteristics of High Alkali Red Mud under Large Proportional Co-Combustion Conditions in Fluidized Bed" Energies 16, no. 6: 2584. https://doi.org/10.3390/en16062584
APA StyleYu, X., Yan, J., Sun, R., Mei, L., Li, Y., Wang, S., Wang, F., & Gu, Y. (2023). An Experimental Study on SO2 Emission and Ash Deposition Characteristics of High Alkali Red Mud under Large Proportional Co-Combustion Conditions in Fluidized Bed. Energies, 16(6), 2584. https://doi.org/10.3390/en16062584