Review

Challenges of Accurate Measurement of Distorted Current and Voltage in the Power Grid by Conventional Instrument Transformers

Institute of Mechatronics and Information Systems, Lodz University of Technology, 90-537 Lodz, Poland
*
Author to whom correspondence should be addressed.
Energies 2023, 16(6), 2648; https://doi.org/10.3390/en16062648
Submission received: 21 February 2023 / Revised: 8 March 2023 / Accepted: 8 March 2023 / Published: 11 March 2023

Abstract

:
Power grids are a combined system where the electrical energy produced by the power plants is transmitted to consumers. This forms a specific interdependence where the recipients have a significant impact on the power quality. Therefore, the nonlinear loads connected by households and industrial customers cause current and voltage distortion in the power networks. This creates the need for accurate measurement of nonsinusoidal voltage and current composed not only from the fundamental component but also containing higher harmonics, interharmonics, and subharmonics. In order to ensure high transformation accuracy of distorted current and voltage, the inductive instrument transformers have to be tested in these conditions. Many papers describe their behavior during the transformation of sinusoidal current or voltage. Nowadays, the scientific field in this scope is focused on the evaluation of their exploitation properties for distorted signals. The common problem of inductive instrument transformers is the self-generation of low-order higher harmonics to the secondary current or voltage. In the case of the inductive VTs, an additional problem results from the resonance caused by the parasitic capacitance of the primary winding. The proposed solutions to compensate for the values of current or voltage errors and phase displacement of inductive instrument transformers are also analyzed.

1. Introduction

Power grids are a combined system where the electrical energy produced by the power plants is transmitted to consumers. This forms a specific kind of system with interconnected vessels, where the recipients have a significant impact on the power quality. Therefore, an increasing number of nonlinear loads connected by households and industrial customers cause current and voltage distortion in power networks. This creates the need for the transformation of nonsinusoidal voltage and current composed not only from the fundamental component but also containing higher harmonics, interharmonics, and subharmonics [1,2,3,4,5]. Many papers describe their behavior during the transformation of only sinusoidal current or voltage [6,7,8,9]. A new concept is to evaluate the long-period accuracy and influence of the ambient temperature [10,11]. Nowadays, the scientific field in this scope is focused on determining exploitation properties for distorted signals [3,12,13,14,15]. The transformation accuracy of the inductive CT and VT is strongly dependent on the value and the power factor of the load of the secondary winding. Another aspect that has a significant influence on the wideband accuracy of inductive CTs is the self-generation of low-order higher harmonics to its secondary current [4,16,17,18]. This phenomenon is caused by the nonlinearity of the magnetic core’s magnetization characteristic. It causes additional distortion in the inductive CT’s secondary current, even for transformations of the sinusoidal current. Considering inductive VTs, the main factor influencing their wideband accuracy is resonance [3,19,20,21,22]. However, self-generation may also be present during the operation of inductive VTs [1,3,18,19]. Previously, over 15 years ago, the wide frequency operation of inductive ITs was limited by the insufficient magnetic permeability of higher frequency components of the current or voltage [14,23,24,25,26]. This was caused by the poor quality SiFe magnetic material. In modern constructions of inductive CTs, cold-rolled SiFe or permalloy tape NiFe is used, as well as composed magnetic cores from electrotechnical steel SiFe and nanocrystalline tape FeCuNbSiB [25,27,28,29]. To improve the wide frequency transformation characteristic of inductive ITs, compensation techniques are used [30,31,32,33,34]. This requires active components for the control of the secondary current or voltage and generates low-order higher harmonics in counterphase to the self-produced ones as a result of the presence of the magnetic core. The required compensation RMS values and phase angles of the self-generated higher harmonics by the inductive CT/VT are measured for the transformation of the sinusoidal current/voltage with various loads of the secondary winding. This approach has one significant disadvantage, the matrix of the measured results is large and requires a high number of test points. This problem increases if the influence of the low-order higher harmonics needs to be evaluated [17].

2. Nonlinear Behavior of Inductive CTs

The metrological properties of inductive CTs remain unaffected by the leakage inductance and resistance of the primary winding during steady-state operation. This is because the primary winding can be considered a current source. The dissipative field of the primary winding only plays a role during transient conditions or in transformers with a large air gap in the core. By ignoring the primary winding’s inductance and resistance, the equivalent circuit comprises solely the elements of the secondary circuit and the magnetizing branch. Figure 1 illustrates this circuit while also considering a particular hk harmonic of the distorted primary current.
Transformation errors in inductive CTs are predominantly caused by the excitation current of the magnetic core. This is because the non-linear magnetization characteristics of the core result in transformation accuracy being influenced by the magnetic flux density, as well as the RMS values of primary current harmonics and the load of the secondary winding. Inductive CTs without error compensation, in particular, secondary winding turns correction, are characterized by negative current error values. In order to comply with the requirements of the specific accuracy class, a common practice is to reduce the number of turns of the secondary winding. The turns ratio of the inductive CT is then not equal to the rated current ratio. As a result, the RMS value of the secondary current is increased. Moreover, the magnetization characteristic of the magnetic core obtained in the non-load state of the inductive CT is different from the equivalent magnetization characteristic of the inductive CT determined for various loads of the secondary winding. An example of three magnetization curves is presented in Figure 2.
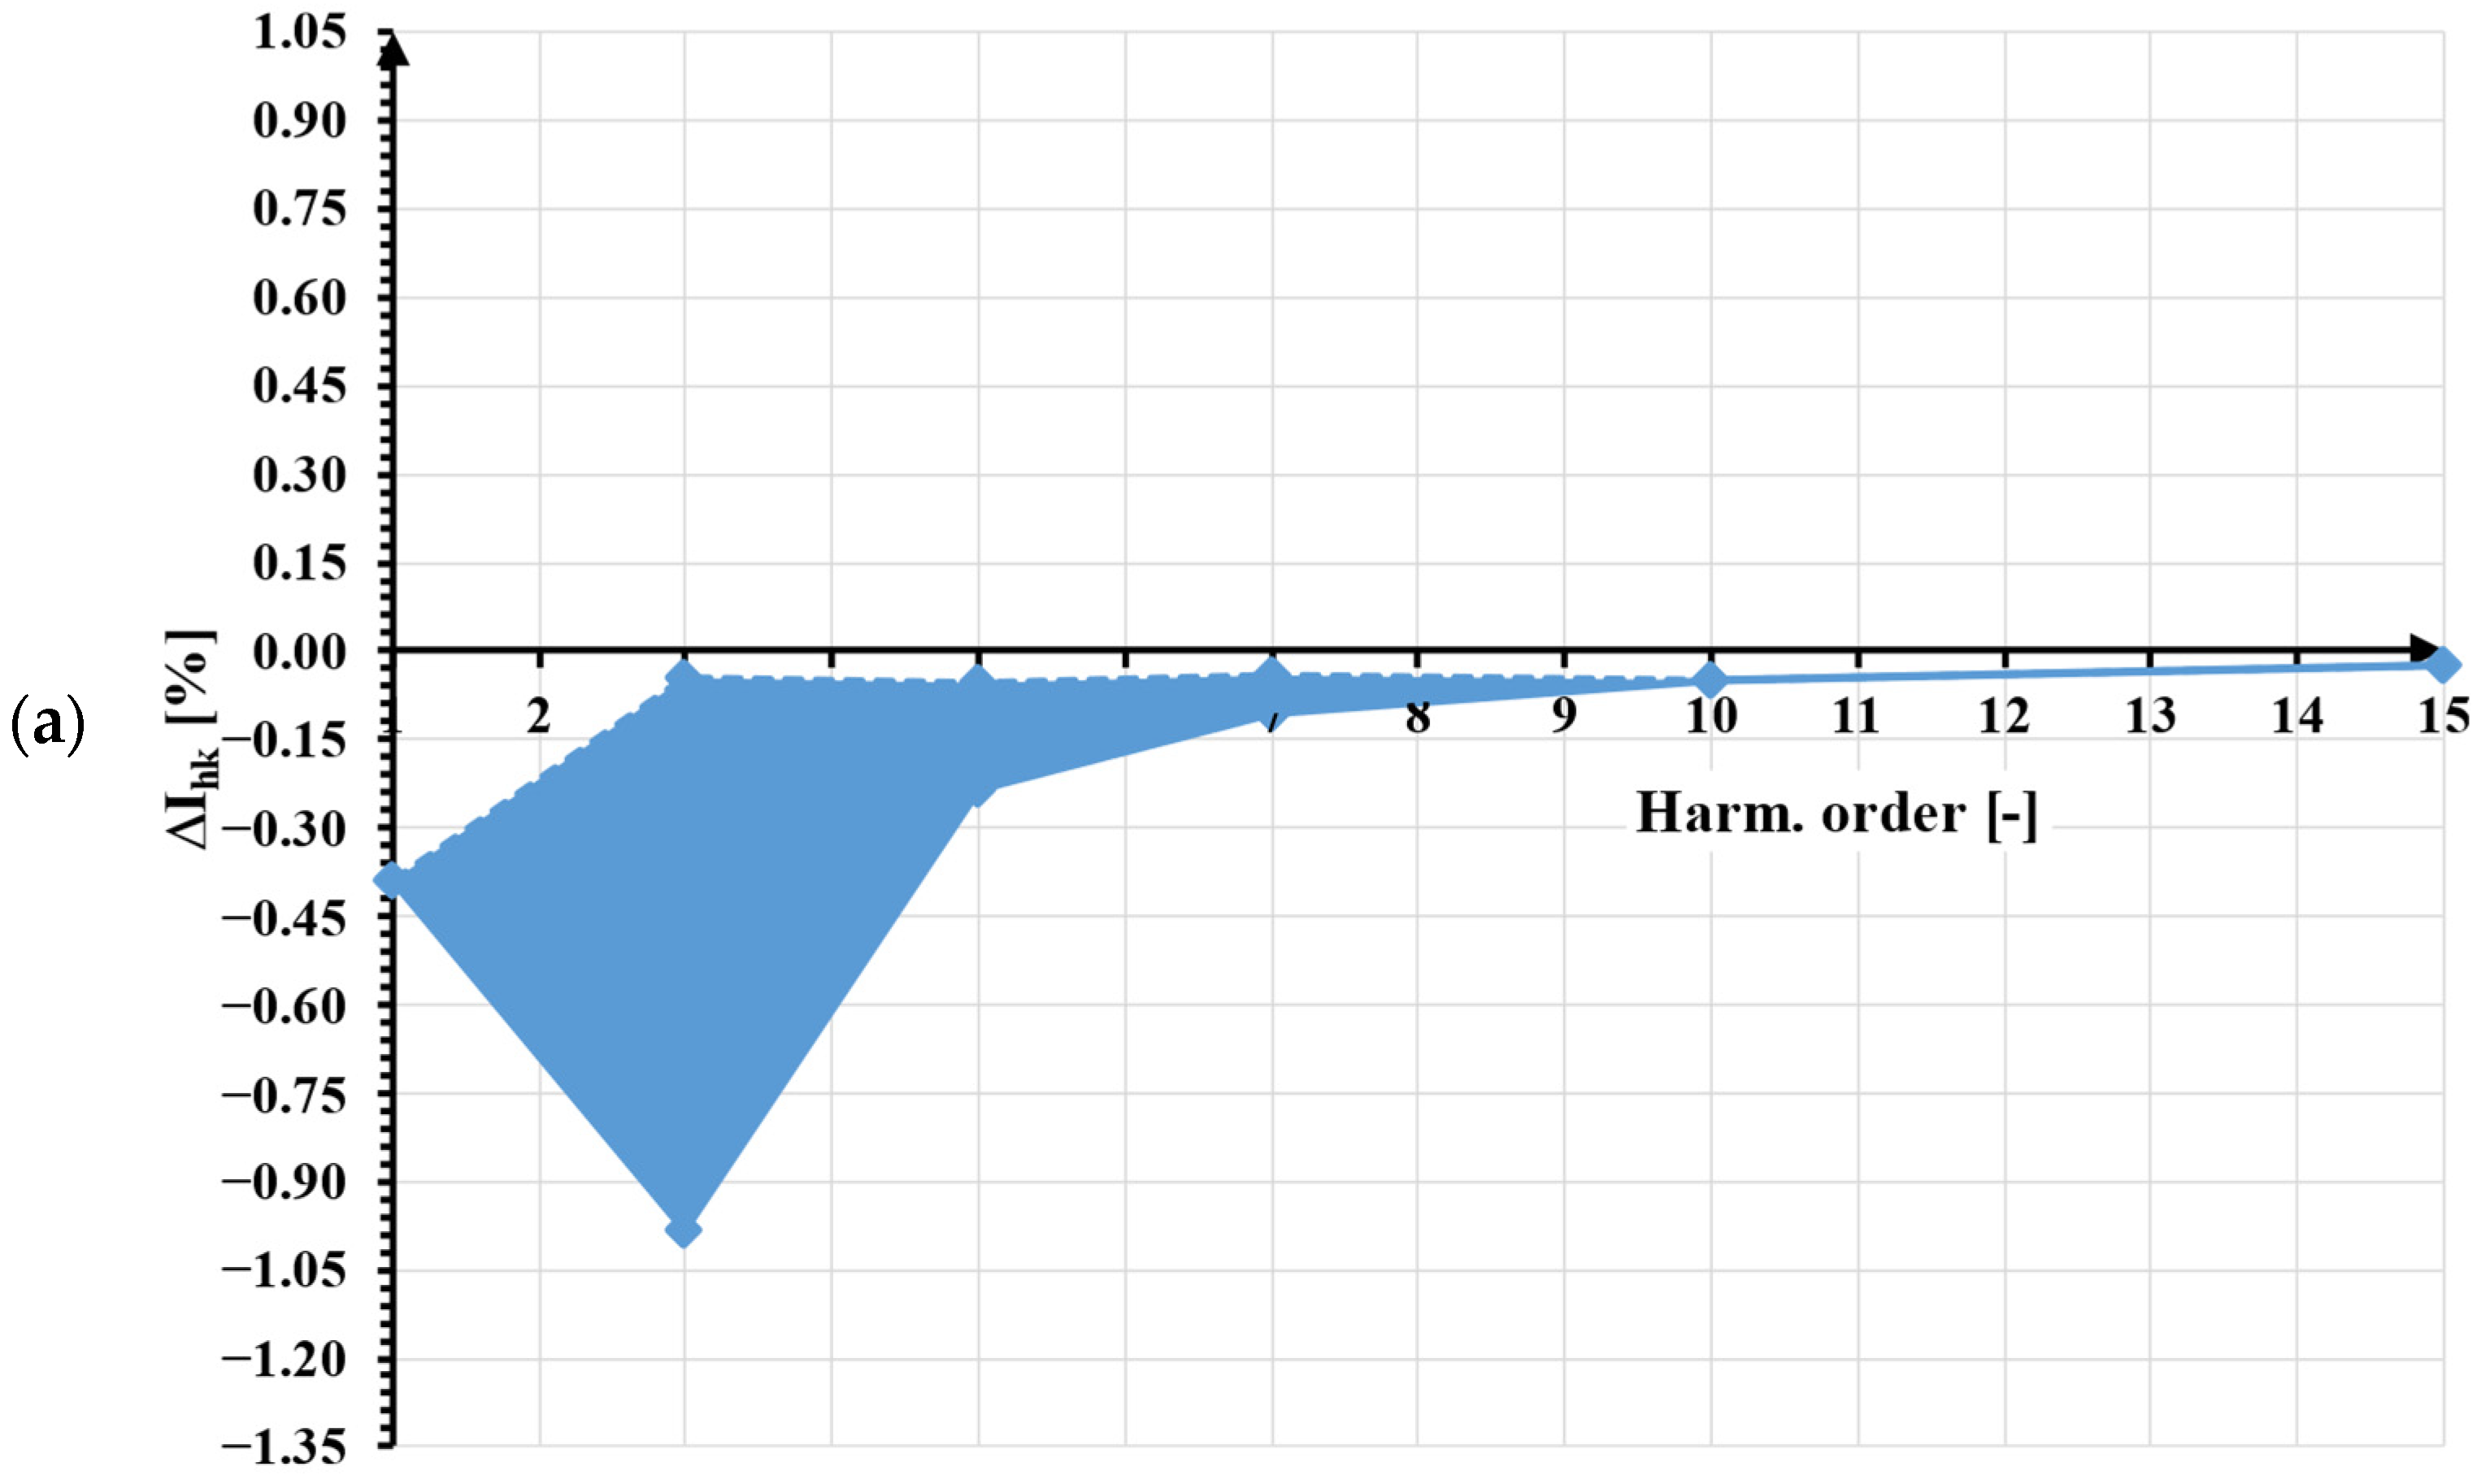
Figure 2 shows the operation points of a corrected inductive CT on the equivalent magnetization characteristic of the magnetic core for four rated primary current values. As the load on the secondary winding rises, the inductive CT’s equivalent magnetization characteristic approaches the shape of the magnetic core’s magnetization curve obtained in the non-load state. The operating point for a primary current of 120% of the rated value and rated secondary winding load (BHL120%, HHL120%) is positioned within the upper knee region of the equivalent magnetization characteristic. As a result, the RMS values of self-generated low-order higher harmonics increase. The same trend is noticed for low percentage values of the rated primary current, where the operating point is located near the lower knee of the equivalent magnetization characteristic. This occurrence alters the current error and phase displacement values measured for the low-order higher harmonic based on its phase angle relative to the transformed distorted current’s main component. Figure 3 shows the range of current error and phase displacement values for the low-order higher harmonics from the 2nd to the 15th, computed for 100% of the rated current and rated load of the secondary winding.
Each of the low-order higher harmonics self-generated to the secondary current of the inductive CT are added with the same frequency higher harmonic present in the transformed distorted primary current. Therefore, its RMS value in the secondary current depends on their mutual phase angle, which depends on the phase angle of the transformed higher harmonic in relation to the main component of the distorted primary current. In order to determine all possible values of the current errors and phase displacement for a given higher harmonic, it is necessary to smoothly adjust this phase angle. Obtained values will be in between the most positive (+) and the most negative (−) values of the current error and phase displacement determined for the phase angle when the self-generated and the transformed harmonics are in phase or antiphase, respectively.
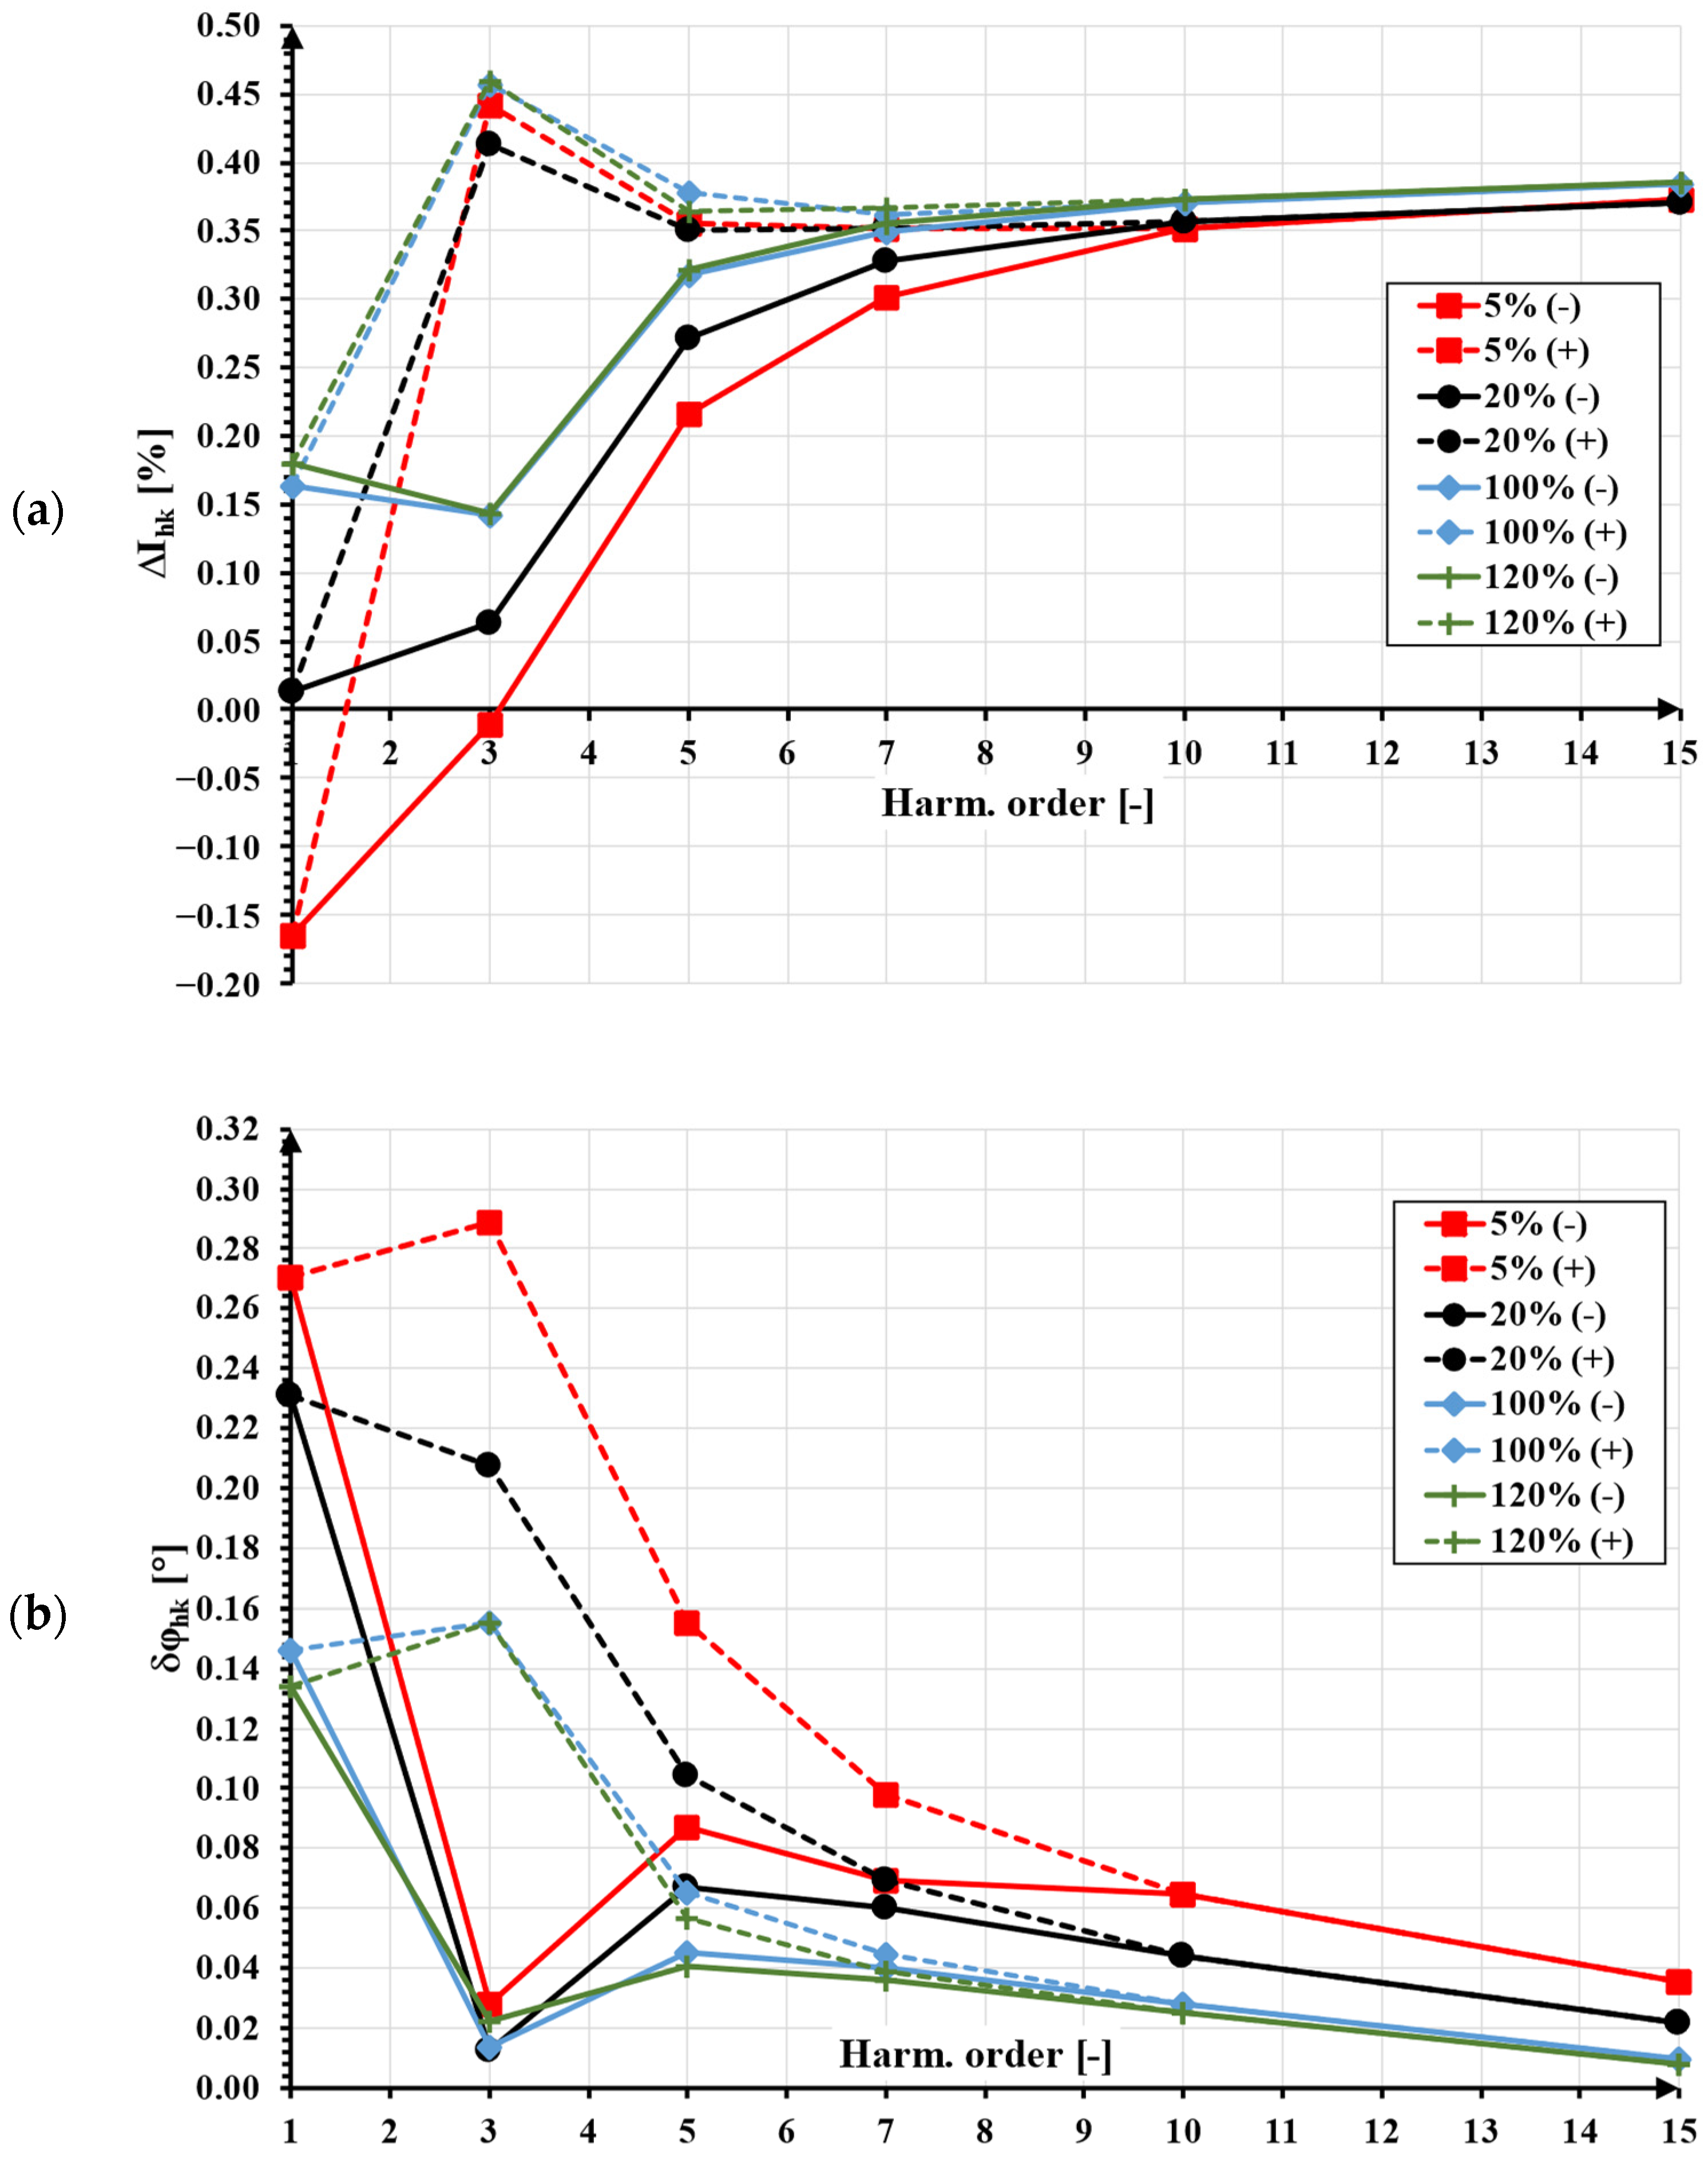
In Figure 4, the concept of the most positive (+) and the most negative (−) values of the current error and phase displacement is further explained. In the presented case, the results of the evaluation of the transformation accuracy of the distorted primary current containing a main component of frequency at 50 Hz and one higher harmonic of frequency from 100 Hz to 750 Hz by the inductive CT with a current ratio equal to 300 A/5 A are shown. The conditions of its operation are essential for accuracy. Therefore, it is required to define that, to the secondary winding, its rated resistance is connected. The RMS value of the higher harmonics is equal to 10% of the main component.
The presented results show that for each RMS value of the distorted primary current different most positive (+) and most negative (−) values of current error and phase displacement are determined. In the tested frequency range of higher harmonics of order ranging from the 2nd to 15th, the self-generation of the low-order higher harmonics is the most significant factor that determined the wideband accuracy of the inductive CT. In this case, depending on the phase angle of the transformed higher harmonic in relation to the main component of the value of current error for the third-order harmonic, it changes from −1.2% to 0.9% for 120% of the rated RMS value of the primary current. In these conditions, the value of phase displacement changes from 0.05° to 0.73°. This is a typical situation for inductive CTs.
To show how the value of the secondary winding load resistance influences the results in Figure 5, the most positive (+) and most negative (−) values of (a) current error and (b) phase displacement determined for the same inductive CT with the 25% of the rated resistive load of the secondary winding are presented.
A decrease in the load resistance of the secondary winding of the inductive CT typically causes a decrease in the RMS values of the self-generated low-order higher harmonics to the secondary current. Therefore, the change between the most positive (+) and the most negative (−) values of current error and phase displacement is also significantly smaller.
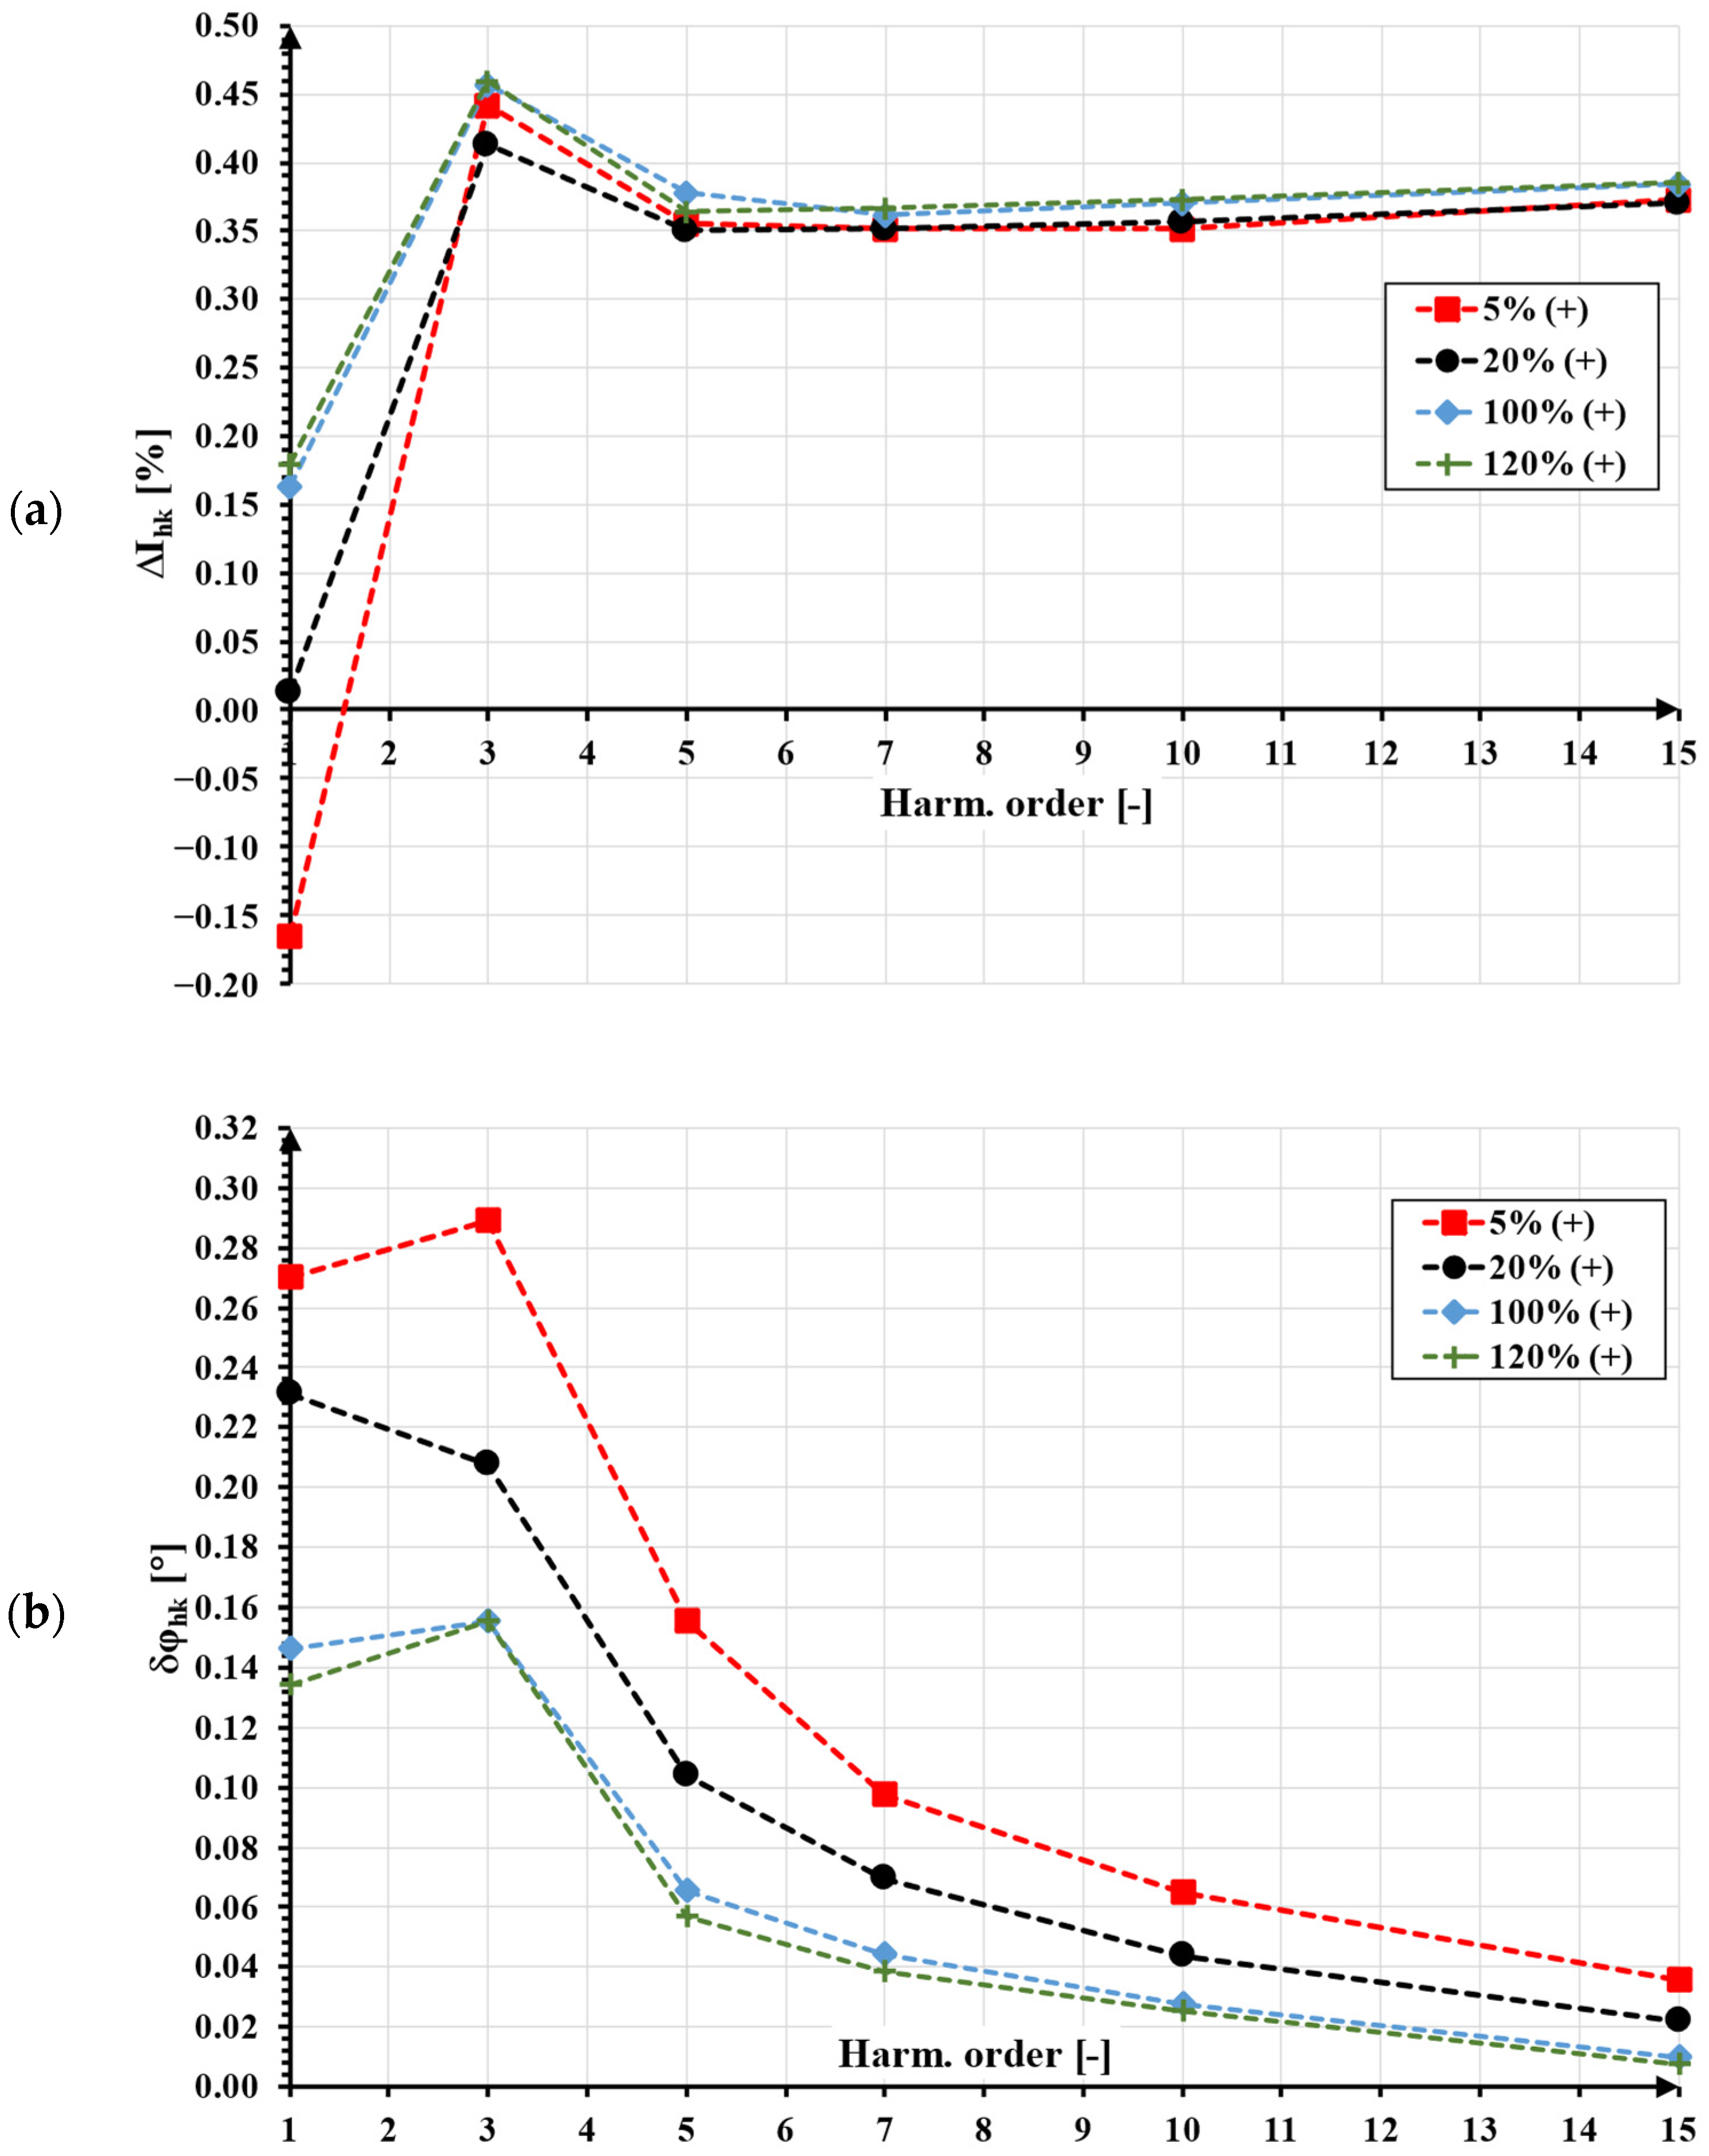
To define the worst possible transformation accuracy of the distorted current harmonics by the inductive CT, the maximum absolute values of the current error and phase displacement should be determined, as presented in Figure 6. These are the highest absolute values chosen from the most positive (+) and the most negative (−) values of current error and phase displacement determined for a given RMS value of the primary current and load of the secondary winding.
The defined maximum absolute values of the current error and phase displacement presented in Figure 6 are the highest absolute values chosen from the most positive (+) and the most negative (−) values of the current error and phase displacement presented in Figure 5. These results are analyzed for 5%, 20%, 100%, and 120% of the rated RMS value of the primary current and 25% of the rated resistive load of the secondary winding. The procedure should be repeated for the rated load of tested inductive CT 300 A/5 A. During the evaluation of the distorted current transformation accuracy, these maximum absolute values of the current error and phase displacement should be considered as ± values because some positive and negative values from 0 up to this limit may be obtained.
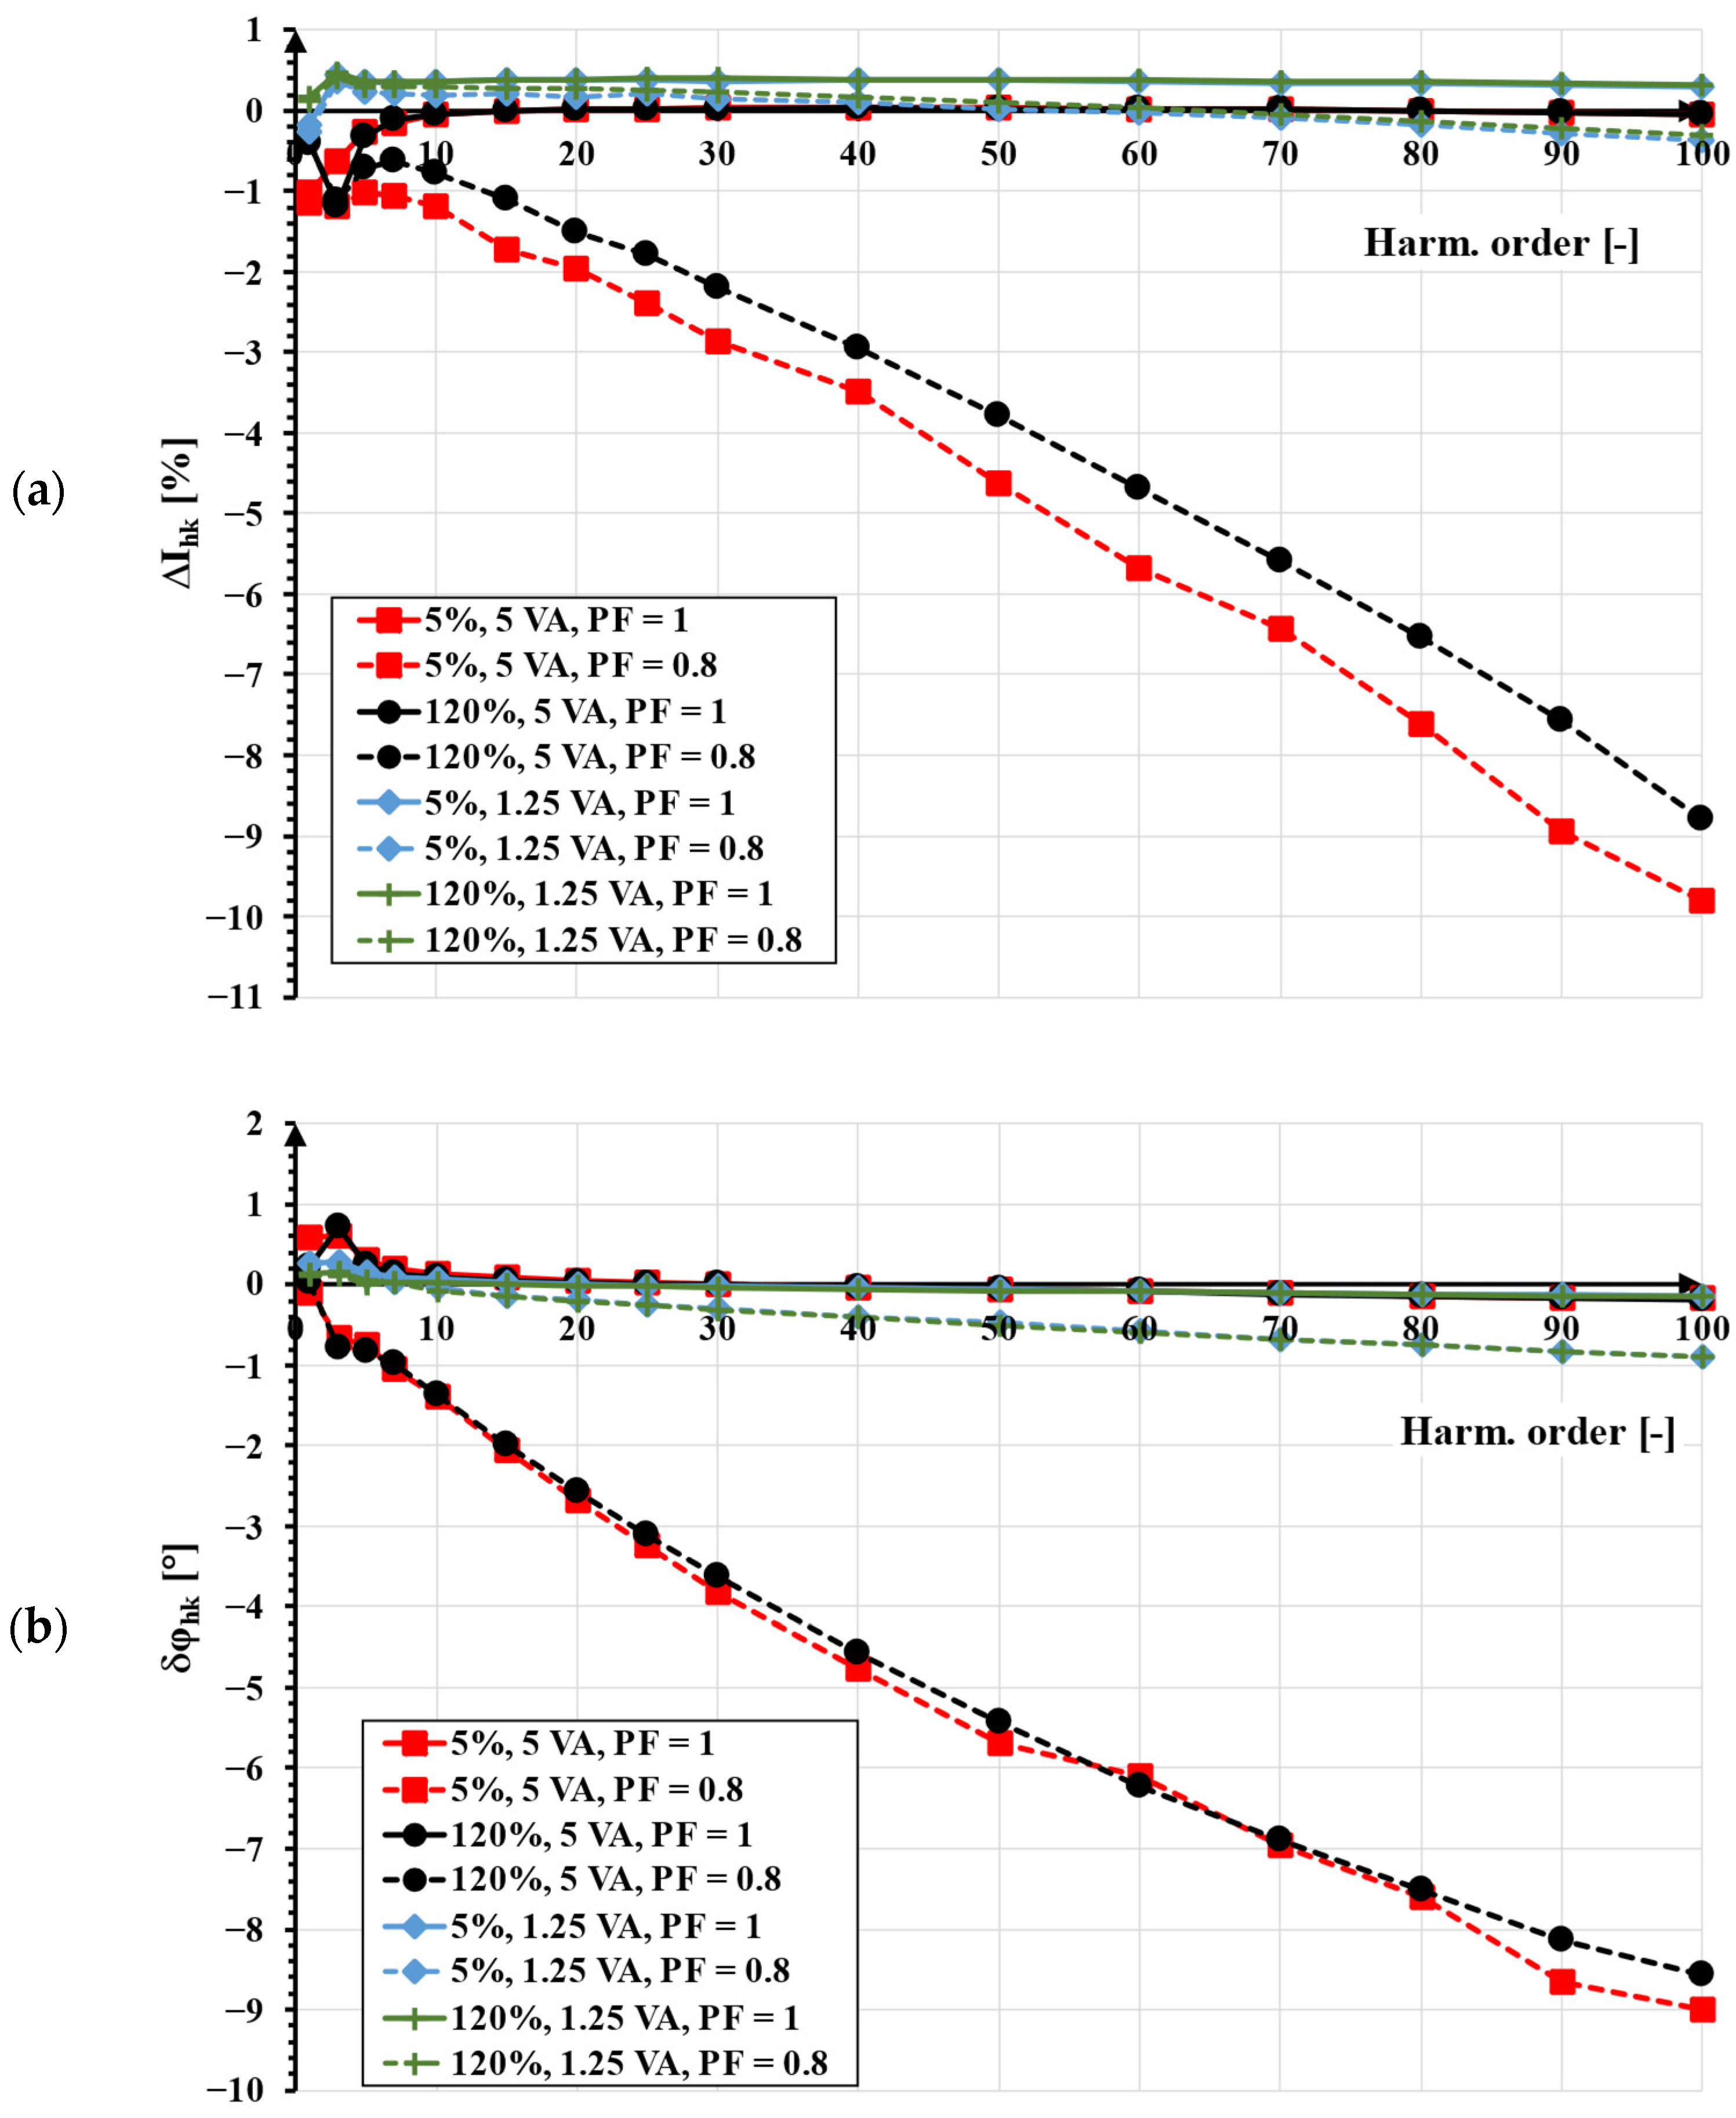
Another aspect that may affect the high transformation accuracy of the distorted currents by the inductive CTs is the power factor of the load connected to its secondary winding. The frequency characteristics of the current error (a) and phase displacement (b) for inductive CT with a rated current ratio of 300 A/5 A are shown in Figure 7. The results are presented for two load power factors equal to 0.8 ind. (dashed lines) and 1 (solid lines), The analysis involves four different primary current values, which correspond to 5%, 20%, 100%, and 120% of the rated value. The results of the tests and analyses are focused on the transformation of distorted current containing a main component of 50 Hz frequency and a single higher harmonic ranging from 100 Hz to 5 kHz.
The analysis of the results from Figure 7 shows that the values of current error and phase displacement determined for higher harmonics increase much more rapidly with frequency when the load power factor is 0.8 inductive. In contrast, when the load has the same impedance but a power factor of 1, the increase in these values is not as significant with increasing frequency. The shift in the inductive CT’s operating point on the magnetization characteristic of the magnetic core towards saturation is the main cause of this phenomenon, especially for resistive–inductive load of the secondary winding. However, for the resistive load, the increase in the transformed higher harmonic’s leakage reactance of the secondary winding is the only cause of this behavior, as it increases with frequency. If the load power factor is 0.8 inductive, the reactance of the load also increases with the frequency of the transformed higher harmonic. The self-generation of low-order harmonics in the secondary current of the inductive CT can have a major impact on the accuracy of harmonic transformation up to the 13th order. For higher-order harmonics up to 100th, the accuracy depends on the mutual inductance between the CT windings L″µhk and the resistance representing the active power losses R″Fehk in the magnetic core. Decreasing these values with increasing harmonic frequency leads to an increase in the RMS values of the reactive I″µhk and active I″Fehk components of the core excitation current, resulting in higher current errors and phase displacement.
The presented analysis indicates that using a resistive load for the secondary winding of the inductive CT results in significantly lower values of current error and phase displacement for the transformation of the higher-order harmonics in the investigated frequency range. The resistive load ensures a wider frequency range of operation for the inductive CT with the accuracy class defined for the transformation of sinusoidal currents of 50 Hz (60 Hz) frequency.
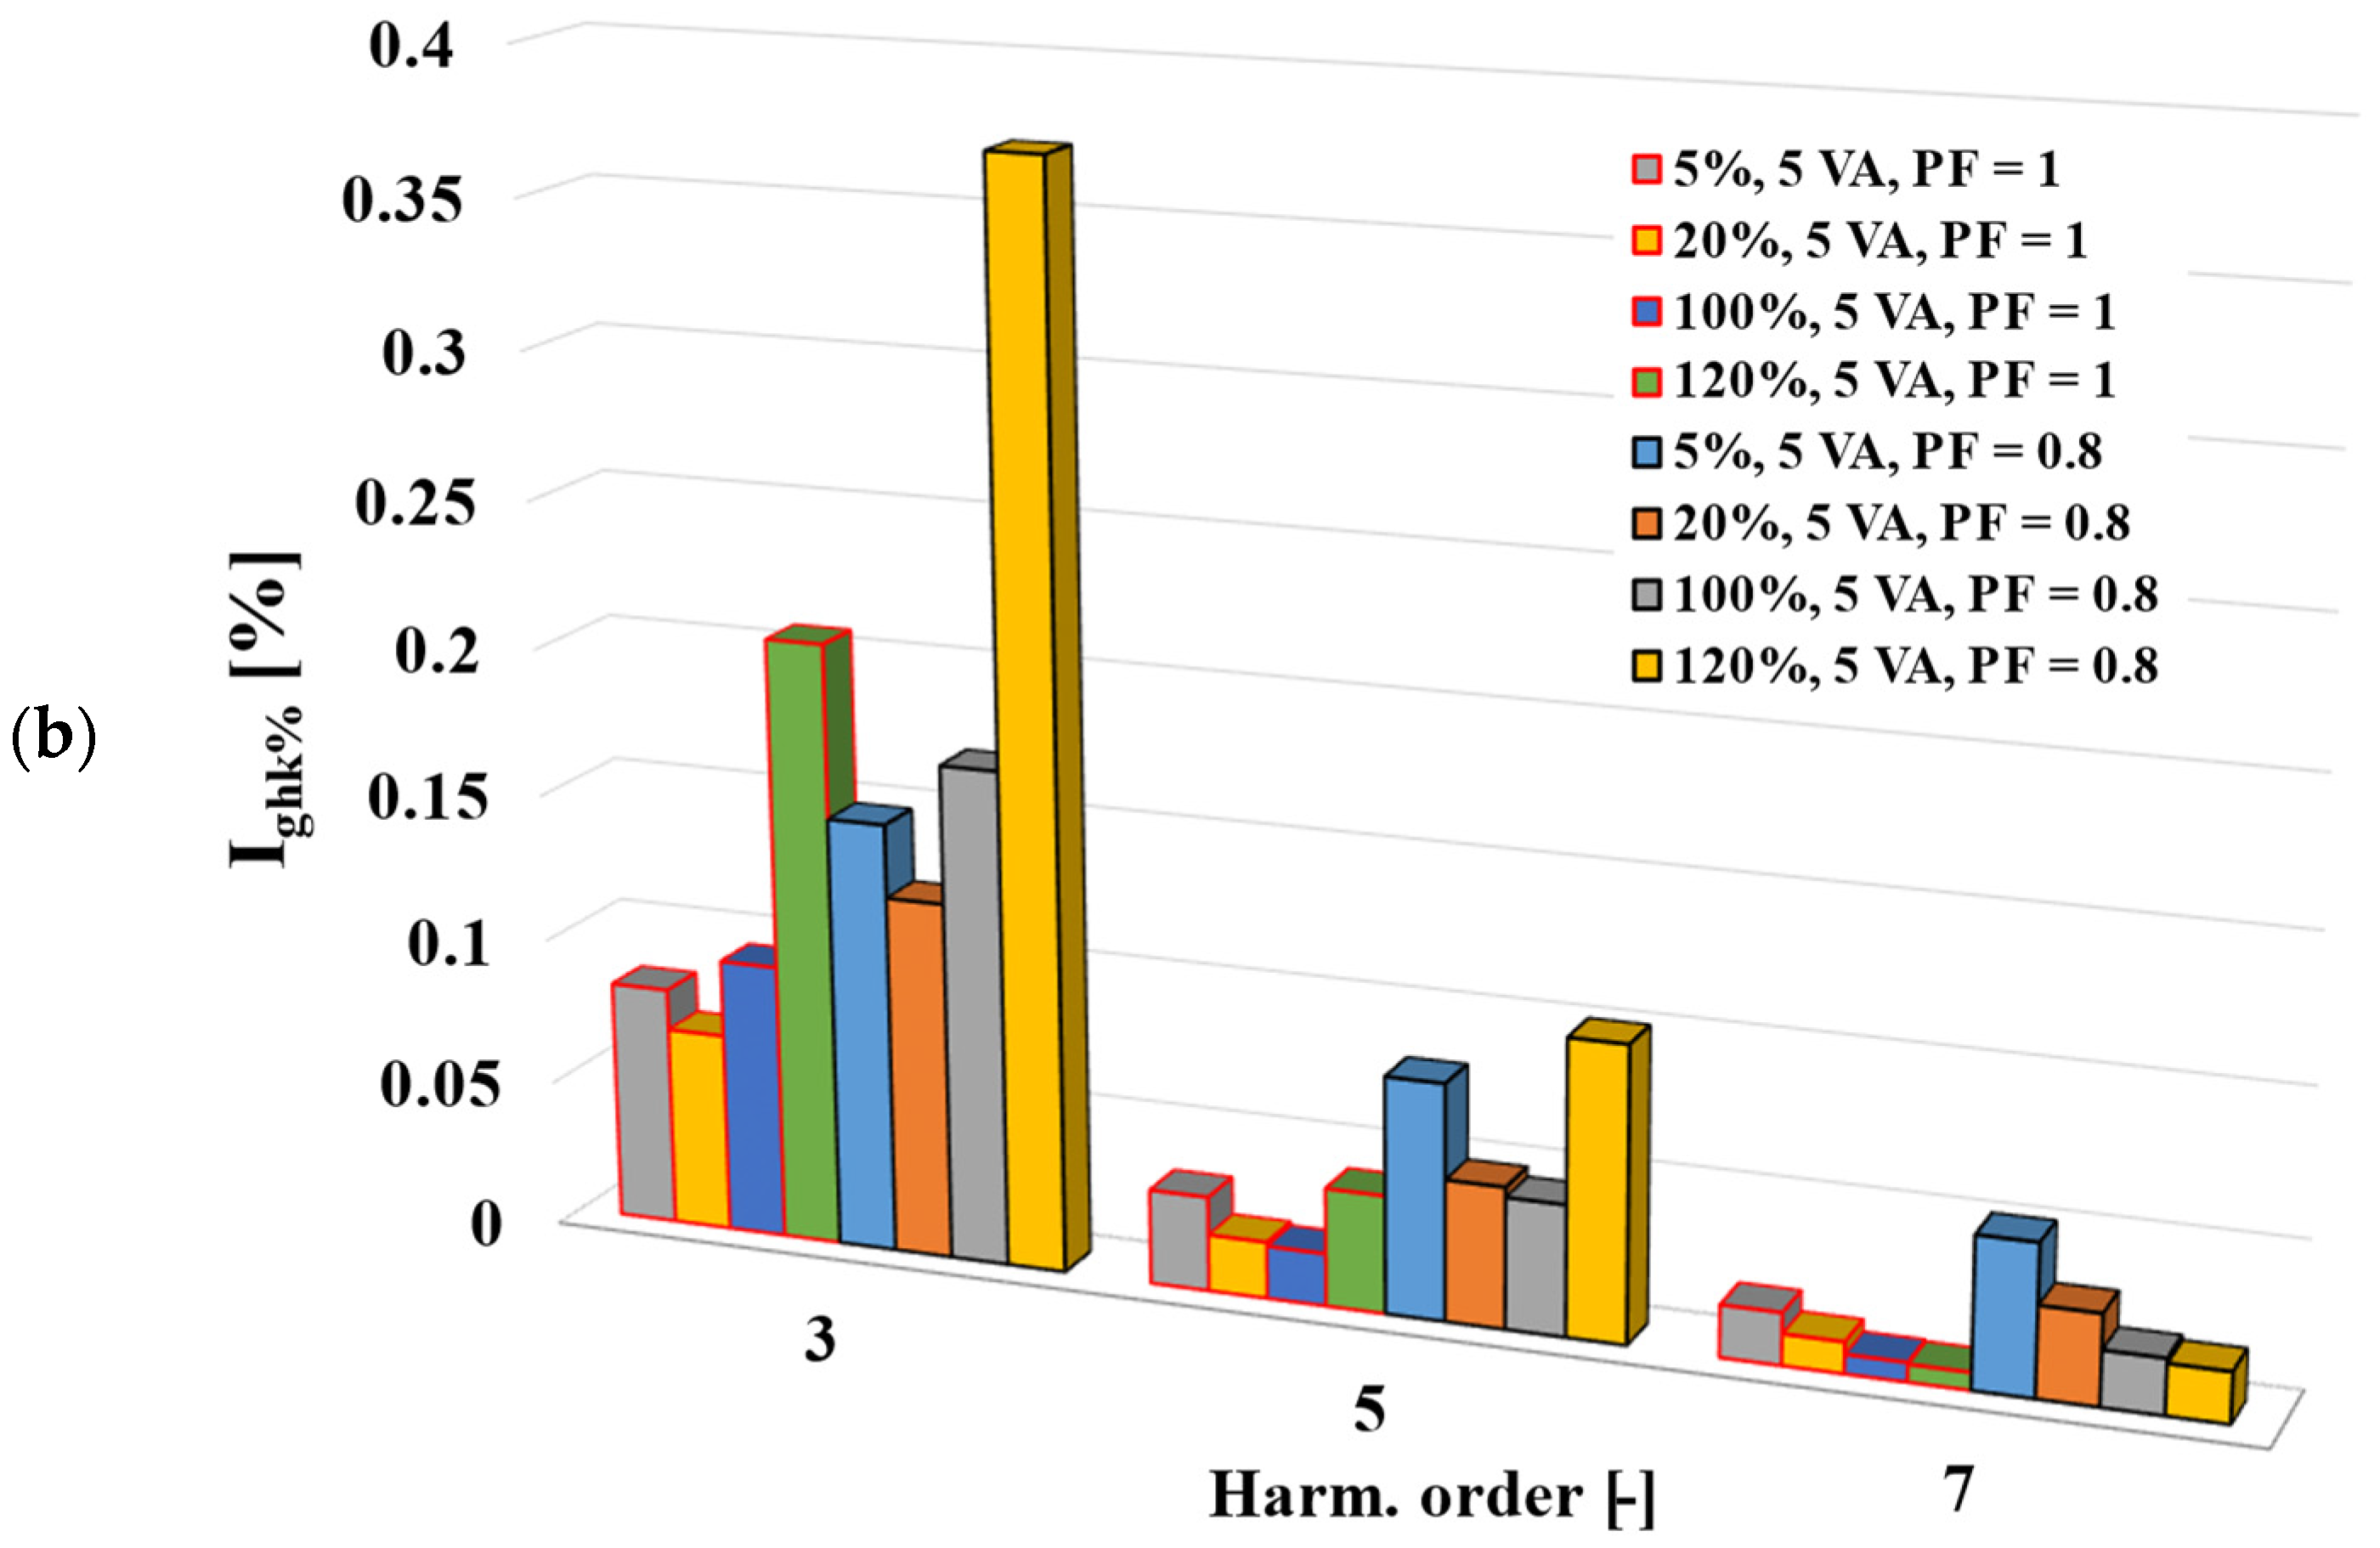
Figure 8 presents a comparison of the percentage values of the self-generated low-order higher harmonics for an inductive CT 300 A/5 A with two different power factors and two secondary winding load values.
The investigation of the percentage values of the self-generated low-order higher harmonics by the inductive CT is important as it corresponds to its non-linear behavior. Therefore, it may not be appropriate for wideband operation due to the low transformation accuracy of the third, fifth, and seventh higher harmonics. This possibility is detected up to the order 13th with the main frequency of the distorted primary current equal to 50 Hz. Typically, the self-generated higher harmonics are significantly lower for the case with the load of the secondary winding decreased to 25% of the rated value. Moreover, the resistive–inductive loads of the secondary winding of the inductive CT cause an increase in the percentage values of the self-generated low-order higher harmonics.

3. Inductive VT’s Resonance for Higher Harmonics of the Distorted Voltage

The main factor that determines the wideband accuracy of the inductive VTs is resonance [3,19,20,21,22]. Of course, an increase in the leakage reactances with the frequency of the transformed higher harmonics causes an additional increase in the voltage drop on its windings. Therefore, the values of voltage error and phase displacement for the transformation of the distorted primary voltage higher harmonics also increase up to a few or tens of percent values or degrees, respectively. However, the resonance may occur for the low-order higher harmonic of distorted primary voltage, e.g., the fifth, causing the values of voltage error and phase displacement to increase to, e.g., 500% or ±100°. The frequency mainly depends on the number of turns of the primary winding affecting the size of the primary winding cross section and resulting from the RMS value of the rated primary voltage of the inductive VT [3]. It is very important to notice that inductive VT may have more than one resonance frequency. Therefore, its equivalent circuit for transformation of distorted voltage must reflect the partial resistance, leakage inductance, and capacitance of each layer of the inductive VT’s primary winding (Figure 9).
According to the analysis presented in papers [3,36], the parasitic capacitance and leakage inductance of the primary winding of the inductive VT are divided into parts to properly reproduce its multi-resonance properties. The conductive path to ground of each layer of the primary winding is formed by the partial equivalent capacitance of the primary winding to ground, which results from the parasitic capacitance between each layer of the winding. The equivalent capacitance between the primary and secondary windings is caused by the parasitic capacitances between turns of the windings connected in series, and its value depends on the thickness of the insulation layer between them. The equivalent circuit indicates that the resistive–inductive load of the secondary winding of the inductive VT will have a positive influence on its limiting frequency of operation. This is because it will cause a decrease in the secondary current higher harmonic component, limiting the increase in the voltage drop on the reactance of the windings with the frequency of the transformed higher harmonic.
In Figure 10, the comparison of the highest absolute values of the voltage error and phase displacement determined for five medium-voltage (MV) inductive VTs is presented.
In Figure 10, the results labeled VT1 and VT2 concern the transformation accuracy tests of distorted voltage transformation performed on the indictive VTs with rated primary voltage equal to 15 kV/√3, while VT3, VT4, and VT5 refer to results obtained for 20 kV/√3 units. In the presented case, the distorted primary voltage contains a main component of frequency at 50 Hz and one higher harmonic frequency from 100 Hz to 5 kHz. The conditions of inductive VT operation are essential for the determined accuracy. Therefore, it is required to define that, to the secondary winding, no additional load is connected, except the measuring apparatus with above 1 MΩ impedance. The RMS value of the higher harmonics is equivalent to 10% of the main component. The presented results indicate different levels of accuracy in the transformation of distorted voltage higher harmonics among the MV inductive VTs. For three units of inductive VTs with a rated primary voltage of either 15 kV/√3 or 20 kV/√3, resonance is the primary factor that affects their wideband accuracy. In the other cases, the increase in the leakage reactances with the frequency of the transformed higher harmonics causes an additional increase in the voltage drop on their windings. Therefore, the values of voltage error and phase displacement for the transformation of the distorted primary voltage higher harmonics also increase up to a few or tens of percent or degrees, respectively.

4. Summary of the Results of the Inductive IT’s Transformation Accuracy Evaluation for Distorted Signals

The increase in the frequency of the transformed higher harmonic causes a decrease in the magnetic permeability of a used magnetic core, leading to an increase in current/voltage error and phase displacement [34,37,38,39]. However, wide frequency operation of inductive voltage transformers (VTs) or current transformers (CTs) up to several or dozens of kHz can be ensured by using silicone steel (VT) or permalloy as well as composed magnetic cores from electrotechnical steel and nanocrystalline material (CT) [25,27,28,29].
The transformation accuracy of higher harmonics by the inductive VTs is limited by the resonance phenomenon. Its frequency mainly depends on the size (number of turns and layers) of the primary winding resulting from the required RMS value of their rated primary voltage [3,36]. Thus, while 15 kV inductive VTs may ensure wide frequency operation up to 5 kHz, an increase in the RMS value of the primary voltage may result in a decrease in the resonance frequency to only 250 Hz for HV units such as 420 [3,19,20,37,40]. In such cases, the voltage error and phase displacement may increase to large values (e.g., 500%, ±100°). Without resonance, the values of voltage error and phase displacement may increase with frequency up to a few percent and degrees, respectively [3,41]. In inductive VTs, the self-generation phenomenon is less significant than in inductive CTs because the measuring units typically operate in the linear region of the magnetization characteristic of the magnetic core. The values of the voltage error and phase displacement of the transformation of the low-order higher harmonic may increase by about ±0.2% and ±0.2°, respectively [3,18].
In the case of inductive CTs, the transformation accuracy for distorted current may be significantly deteriorated by the self-generation phenomenon of the low-order higher harmonics. The values of current error and phase displacement may reach about ±1.5% and ±1.5°, respectively [4,17,18,32]. However, the high transformation accuracy of distorted currents was confirmed in the case of the inductive CT class 0.2S, where the values of current error and phase displacement in the frequency range of harmonics from 50 Hz up to 5 kHz did not exceed the limits defined for the transformation of sinusoidal current of frequency 50 Hz [4]. Additionally, it is possible to make inductive CTs with values of current error and phase displacement that do not exceed ±0.1% and ±0.1°, respectively, in the frequency range of harmonics from 50 Hz up to 5 kHz [42]. When an inductive CT is operating with a 0.8 inductive power factor of its secondary winding’s load, the RMS values of the self-generated low-order higher harmonics may significantly increase. Additionally, as the frequency of transformed higher harmonics increases, the secondary voltage of the inductive CT will also increase. This will cause an increase in the values of current error and phase displacement as the magnetic flux density in the magnetic core increases [12,43]. Therefore, the resistive load ensures a wider frequency range of operation.

5. Error Correction Methods

Many of the papers present solutions to correct the values of current or voltage errors and phase displacements of inductive CTs and VTs during their operation in distorted conditions [33,34,44,45,46]. The majority of them concentrate on inductive voltage transformers (VTs), where the impact of the magnetic core’s non-linear characteristics is less significant, resulting in a relatively low level of self-generated low-order higher harmonics in the secondary voltage. The presented method in paper [33] is based on the linear approximation of the inductive VT’s secondary voltage by the defined frequency response function. In the first step, such function is estimated for the power amplifier and step-up voltage transformer that supply the primary winding of tested inductive VT by injecting a random phase multisine signal [47]. In the next step, the quasi-sinusoidal multisine signals with 50 Hz main frequency are sampled from the defined probability density functions. These signals are used to supply the tested VT while the primary and secondary steady-state voltages are measured. The discrete Fourier transform is used to compute the input and output frequency spectrum. The defined numerical models are used to compensate for the response of the inductive VT. Another approach presented in paper [37] is the application of the digital filter to enable compensation of the frequency response of inductive VTs. This requires an additional device in which the frequency characteristic of voltage error and phase displacement of tested VT are implemented. Therefore, the secondary voltage is modified by the voltage generated by this device with counter-phase harmonics. Their RMS values and phases are measured for various RMS values of transformed sinusoidal voltage and chosen loads of the secondary winding. The paper [45] presents a frequency-domain nonlinear model of the inductive VT based on a simplified Volterra model. The number of coefficients in comparison with the standard model is reduced. This ensures faster identification procedures and computing. The proposed approach evaluates bandwidth limitations and nonlinearity of the magnetic characteristic of the magnetic core. Thus, it can be applied to determine the behavior of any kind of VT. Another approach shown in [34] is based on the implementation of the mapping function between the secondary and primary sides of the tested inductive VT and compensation for its accuracy even in nonlinear operating conditions. In case of the inductive CTs, the compensation methods are more difficult to implement due to the strong influence of the nonlinear behavior of the magnetic core. In paper [46], the compensation method is proposed that is based on the polynomial modeling of the harmonic distortion. Utilization of the least-squares approach results in easier implementation and low computational complexity of this method. However, for the best performance, each inductive CT has to be individually characterized in specified conditions. Therefore, the RMS values of the individual higher harmonics in the secondary current must be determined for all possible conditions, including the change in the RMS values of the primary current, its harmonic content, as well as the value and power factor of the load. The disadvantage of this method is that it requires aggregation of 2500 current waveforms for the compensation lookup table. In paper [32], this compensation method is called SINDICOMP. In the first stage, the tested inductive CT is characterized for the transformation of sinusoidal currents of the rated frequency where the harmonic content of the distorted secondary current is measured. In the second stage, determined phasors of higher harmonics are used to compensate for the frequency response. A similar approach is presented in paper [31], where the compensation factors of the inductive CT are determined using a frequency domain model based on tensor linearization. To obtain a real-value compensation matrix, the tested inductive CT is characterized for the transformation of sinusoidal currents of the rated frequency where the higher harmonics phasors are determined. A similar solution is presented in [48]. However, it uses a developed algorithm with determined coefficients under various operating conditions of the tested inductive CT. The input values are the RMS values and phase angles of individual harmonics recorded for various RMS values of the primary current of the rated frequency. In papers [49,50], the compensation technique of the DC component is studied. The presented solution is based on the measurement of the frequency spectrum of the inductive CT’s secondary current, and then required to eliminate the 2nd harmonic DC current is injected to the compensated CT’s secondary winding. The proposed idea has two disadvantages: an expensive lock-in amplifier is required, and the presence of a second harmonic in the primary current will be also compensated in the secondary current. An effective solution for this problem is fluxgate sensors [51,52].

6. Conclusions

This review article discusses advanced works devoted to the characterization of the inductive voltage and current transformers’ transformation accuracy of distorted currents and voltages. The presented results and cited references show that conventional instrument transformers may ensure the required transformation accuracy not only for the sinusoidal currents of the rated frequency 50 Hz/60 Hz but also for the higher harmonic components of distorted currents/voltages. Proposed compensation techniques are necessary only for poor-quality inductive instrument transformers. Additionally, these methods increase complexity and cost of the measuring circuit. A better solution is to properly design the inductive instrument transformer, including the application of modern magnetic materials, oversizing of the magnetic core (inductive CT), and reduction in the number of turns of the primary winding (inductive VT). Typical inductive instrument transformers designed for the transformation of the sinusoidal current/voltage may ensure, in the frequency range of higher harmonics from 50 Hz to 5 kHz, ±0.5%/±0.5° transformation accuracy in the case of the inductive CTs and ±5%/±5° in the case of the MV inductive voltage transformers. The challenges of accurate measurement of distorted current and voltage in the power grid by conventional instrument transformers are self-generation and resonance phenomena. Additional distortion of the secondary current by the inductive CTs is much more significant and important for their transformation accuracy of the low-order higher harmonics than self-distortion of the secondary voltage by the inductive VTs. Recent studies show that the resonance was only detected in the case of the inductive VTs, and it concerns the transformation of higher harmonics of distorted voltage by the medium and the high voltage units. Moreover, the power factor of the secondary winding’s load of the inductive IT may significantly affect its limiting frequency of the wideband operation with the required maximum values of ratio error and phase displacement.

Author Contributions

Conceptualization, M.K. and E.S.; methodology, M.K. and E.S.; validation, M.K. and E.S.; formal analysis, M.K. and E.S.; investigation, M.K. and E.S.; resources, M.K. and E.S.; data curation, M.K. and E.S.; writing—original draft preparation, M.K. and E.S.; writing—review and editing, M.K. and E.S.; visualization, E.S.; supervision, M.K. All authors have read and agreed to the published version of the manuscript.

Funding

This research received no external funding.

Data Availability Statement

Not applicable.

Conflicts of Interest

The authors declare no conflict of interest.

References

  1. Crotti, G.; D’Avanzo, G.; Letizia, P.S.; Luiso, M. Measuring Harmonics with Inductive Voltage Transformers in Presence of Subharmonics. IEEE Trans. Instrum. Meas. 2021, 70, 1–13. [Google Scholar] [CrossRef]
  2. Crotti, G.; D’Avanzo, G.; Landi, C.; Letizia, P.S.; Luiso, M. Evaluation of Voltage Transformers’ Accuracy in Harmonic and Interharmonic Measurement. IEEE Open J. Instrum. Meas. 2022, 1, 1–10. [Google Scholar] [CrossRef]
  3. Kaczmarek, M.; Stano, E. Why should we test the wideband transformation accuracy of medium voltage inductive voltage transformers? Energies 2021, 14, 4432. [Google Scholar] [CrossRef]
  4. Stano, E.; Kaczmarek, P.; Kaczmarek, M. Why Should We Test the Wideband Transformation Accuracy of Inductive Current Transformers? Energies 2022, 15, 5737. [Google Scholar] [CrossRef]
  5. Kaczmarek, M. The effect of distorted input voltage harmonics rms values on the frequency characteristics of ratio error and phase displacement of a wideband voltage divider. Electr. Power Syst. Res. 2019, 167, 1–8. [Google Scholar] [CrossRef]
  6. Draxler, K.; Hlavacek, J.; Styblikova, R. Calibration of Instrument Current Transformer Test Sets. In Proceedings of the 2019 International Conference on Applied Electronics (AE), Pilsen, Czech Republic, 10–11 September 2019. [Google Scholar] [CrossRef] [Green Version]
  7. Draxler, K.; Styblikova, R. Calibration of instrument current transformers at low currents using lock-in amplifier. In Proceedings of the 2017 International Conference on Applied Electronics (AE), Pilsen, Czech Republic, 5–6 September 2017; pp. 18–21. [Google Scholar] [CrossRef] [Green Version]
  8. Van Den Brom, H.E.; Jol, L.; Rietveld, G.; So, E. High-current AC current transformer calibration using an automated sampling system. In Proceedings of the 2012 Conference on Precision Electromagnetic Measurements, Washington, DC, USA, 1–6 July 2012; pp. 134–135. [Google Scholar] [CrossRef]
  9. Siegenthaler, S.; Mester, C. A computer-controlled calibrator for instrument transformer test sets. IEEE Trans. Instrum. Meas. 2017, 66, 1184–1190. [Google Scholar]
  10. Mingotti, A.; Peretto, L.; Tinarelli, R.; Ghaderi, A. Uncertainty analysis of a test bed for calibrating voltage transformers vs. Temperature. Sensors 2019, 19, 4472. [Google Scholar] [CrossRef] [PubMed] [Green Version]
  11. Mingotti, A.; Bartolomei, L.; Peretto, L.; Tinarelli, R. On the long-period accuracy behavior of inductive and low-power instrument transformers. Sensors 2020, 20, 5810. [Google Scholar] [CrossRef]
  12. Kaczmarek, M.; Kaczmarek, P.; Stano, E. The Effect of the Load Power Factor of the Inductive CT’s Secondary Winding on Its Distorted Current’s Harmonics Transformation Accuracy. Energies 2022, 15, 6258. [Google Scholar] [CrossRef]
  13. Mingotti, A.; Peretto, L.; Bartolomei, L.; Cavaliere, D.; Tinarelli, R. Are inductive current transformers performance really affected by actual distorted network conditions? An experimental case study. Sensors 2020, 20, 927. [Google Scholar] [CrossRef] [Green Version]
  14. Kondrath, N.; Kazimierczuk, M.K. Bandwidth of current transformers. Proc. IEEE Trans. Instrum. Meas. 2009, 58, 2008–2016. [Google Scholar] [CrossRef]
  15. So, E.; Bennett, D. Compact wideband high-current (≤ 1000 A) multistage current transformers for precise measurements of current harmonics. Proc. IEEE Trans. Instrum. Meas. 2007, 56, 584–587. [Google Scholar] [CrossRef]
  16. Stano, E.; Kaczmarek, P.; Kaczmarek, M. Understanding the Frequency Characteristics of Current Error and Phase Displacement of the Corrected Inductive Current Transformer. Energies 2022, 15, 5436. [Google Scholar] [CrossRef]
  17. Kaczmarek, M.; Stano, E. The Influence of the 3rd Harmonic of the Distorted Primary Current on the Self-Generation of the Inductive Current Transformers. IEEE Access 2022, 10, 55876–55887. [Google Scholar] [CrossRef]
  18. Cataliotti, A.; Cosentino, V.; Crotti, G.; Giordano, D.; Modarres, M.; Di Cara, D.; Tinè, G.; Gallo, D.; Landi, C.; Luiso, M. Metrological performances of voltage and current instrument transformers in harmonics measurements. In Proceedings of the I2MTC 2018—2018 IEEE International Instrumentation and Measurement Technology Conference: Discovering New Horizons in Instrumentation and Measurement, Houston, Texas, USA, 14–17 May 2018; pp. 1–6. [Google Scholar]
  19. Letizia, P.S.; Signorino, D.; Crotti, G. Impact of DC Transient Disturbances on Harmonic Performance of Voltage Transformers for AC Railway Applications. Sensors 2022, 22, 2270. [Google Scholar] [CrossRef]
  20. Filipović-Grčić, D.; Filipović-Grčić, B.; Krajtner, D. Frequency response and harmonic distortion testing of inductive voltage transformer used for power quality measurements. Procedia Eng. 2017, 202, 159–167. [Google Scholar] [CrossRef]
  21. Kaczmarek, M.; Stano, E. Application of the Sinusoidal Voltage for Detection of the Resonance in Inductive Voltage Transformers. Energies 2021, 14, 7047. [Google Scholar] [CrossRef]
  22. Kaczmarek, M.; Stano, E. Measuring system for testing the transformation accuracy of harmonics of distorted voltage by medium voltage instrument transformers. Measurement 2021, 181, 109628. [Google Scholar] [CrossRef]
  23. Chen, W.; Ma, J.; Huang, X.; Fang, Y. Predicting iron losses in laminated steel with given non-sinusoidalwaveforms of flux density. Energies 2015, 8, 13726–13740. [Google Scholar] [CrossRef] [Green Version]
  24. Lesniewska, E. Influence of the selection of the core shape and winding arrangement on the accuracy of current transformers with through-going primary cable. Energies 2021, 14, 1932. [Google Scholar] [CrossRef]
  25. Fritsch, M.; Wolter, M. High-Frequency Current Transformer Design and Construction Guide. IEEE Trans. Instrum. Meas. 2022, 71, 1–9. [Google Scholar] [CrossRef]
  26. Yu, X.; Li, Y.; Yang, Q.; Yue, S.; Zhang, C. Loss Characteristics and Model Verification of Soft Magnetic Composites under Non-Sinusoidal Excitation. IEEE Trans. Magn. 2019, 55, 18–21. [Google Scholar] [CrossRef]
  27. Pluta, W.A.; Swieboda, C.; Leszczynski, J.S.; Soinski, M. Some remarks on metrological properties and production technology of current transformers made of nanocrystalline cores. Meas. J. Int. Meas. Confed. 2017, 97, 38–44. [Google Scholar] [CrossRef]
  28. Swieboda, C.; Walak, J.; Soinski, M.; Rygal, J.; Leszczynski, J.; Grybos, D. Nanocrystalline oval cut cores for current instrument transformer prototypes. Meas. J. Int. Meas. Confed. 2019, 136, 50–58. [Google Scholar] [CrossRef]
  29. Lesniewska, E. Modern Methods of Construction Problem Solving in Designing Various Types of Instrument Transformers. Energies 2022, 15, 8199. [Google Scholar] [CrossRef]
  30. Faifer, M.; Laurano, C.; Ottoboni, R.; Toscani, S.; Zanoni, M. Characterization of voltage instrument transformers under nonsinusoidal conditions based on the best linear approximation. IEEE Trans. Instrum. Meas. 2018, 67, 2392–2400. [Google Scholar] [CrossRef]
  31. Collin, A.J.; Femine, A.D.; Gallo, D.; Langella, R.; Luiso, M. Compensation of current transformers’ nonlinearities by tensor linearization. IEEE Trans. Instrum. Meas. 2019, 68, 3841–3849. [Google Scholar] [CrossRef]
  32. Cataliotti, A.; Cosentino, V.; Crotti, G.; Femine, A.D.; Di Cara, D.; Gallo, D.; Giordano, D.; Landi, C.; Luiso, M.; Modarres, M.; et al. Compensation of Nonlinearity of Voltage and Current Instrument Transformers. IEEE Trans. Instrum. Meas. 2019, 68, 1322–1332. [Google Scholar] [CrossRef]
  33. Faifer, M.; Laurano, C.; Ottoboni, R.; Toscani, S.; Zanoni, M. Harmonic Distortion Compensation in Voltage Transformers for Improved Power Quality Measurements. IEEE Trans. Instrum. Meas. 2019, 68, 3823–3830. [Google Scholar] [CrossRef]
  34. Castello, P.; Laurano, C.; Muscas, C.; Pegoraro, P.A.; Toscani, S.; Zanoni, M. Harmonic Synchrophasors Measurement Algorithms with Embedded Compensation of Voltage Transformer Frequency Response. IEEE Trans. Instrum. Meas. 2021, 70, 9001310. [Google Scholar] [CrossRef]
  35. Stano, E. The Method to Determine the Turns Ratio Correction of the Inductive Current Transformer. Energies 2021, 14, 8602. [Google Scholar] [CrossRef]
  36. Kaczmarek, M.; Brodecki, D. Transformation of Transient Overvoltages by Inductive Voltage Transformers. Sensors 2021, 21, 4167. [Google Scholar] [CrossRef] [PubMed]
  37. Crotti, G.; Gallo, D.; Giordano, D.; Landi, C.; Luiso, M. Compensation of Complex Frequency Errors of Voltage Instrument Transformers. In Proceedings of the 2018 Conference on Precision Electromagnetic Measurements (CPEM 2018), Paris, France, 8–13 July 2018; pp. 3–4. [Google Scholar] [CrossRef]
  38. Kaczmarek, M.; Stano, E. Proposal for extension of routine tests of the inductive current transformers to evaluation of transformation accuracy of higher harmonics. Int. J. Electr. Power Energy Syst. 2019, 113, 842–849. [Google Scholar] [CrossRef]
  39. Crotti, G.; D’Avanzo, G.; Giordano, D.; Letizia, P.S.; Luiso, M. Extended SINDICOMP: Characterizing MV Voltage Transformers with Sine Waves. Energies 2021, 14, 1715. [Google Scholar] [CrossRef]
  40. IEC 61869-103; Instrument Transformers—The Use of Instrument Transformers for Power Quality Measurement. IEC: Geneva, Switzerland, 2010.
  41. Lesniewska, E.; Kaczmarek, M.; Stano, E. 3D Electromagnetic Field Analysis Applied to Evaluate the Accuracy of a Voltage Transformer under Distorted Voltage. Energies 2021, 14, 136. [Google Scholar] [CrossRef]
  42. Stano, E.; Kaczmarek, M. Wideband self-calibration method of inductive cts and verification of determined values of current and phase errors at harmonics for transformation of distorted current. Sensors 2020, 20, 2167. [Google Scholar] [CrossRef] [Green Version]
  43. Kaczmarek, M.; Stano, E. Nonlinearity of Magnetic Core in Evaluation of Current and Phase Errors of Transformation of Higher Harmonics of Distorted Current by Inductive Current Transformers. IEEE Access 2020, 8, 118885–118898. [Google Scholar] [CrossRef]
  44. Wath, M.G.; Raut, P.; Ballal, M.S. Error compensation method for current transformer. In Proceedings of the 2016 IEEE 1st International Conference on Power Electronics, Intelligent Control and Energy Systems (ICPEICES), Delhi, India, 4–6 July 2016; Volume 11, pp. 21–24. [Google Scholar] [CrossRef]
  45. Faifer, M.; Laurano, C.; Ottoboni, R.; Toscani, S.; Zanoni, M.; Crotti, G.; Giordano, D.; Barbieri, L.; Gondola, M.; Mazza, P. Overcoming Frequency Response Measurements of Voltage Transformers: An Approach Based on Quasi-Sinusoidal Volterra Models. IEEE Trans. Instrum. Meas. 2019, 68, 2800–2807. [Google Scholar] [CrossRef]
  46. Laurano, C.; Toscani, S.; Zanoni, M. A simple method for compensating harmonic distortion in current transformers: Experimental validation. Sensors 2021, 21, 2907. [Google Scholar] [CrossRef]
  47. Pintelon, R.; Schoukens, J. System Identification: A Frequency Domain Approach, 2nd ed.; John Wiley & Sons: Hoboken, NJ, USA, 2012; ISBN 9780470640371. [Google Scholar]
  48. Ballal, M.S.; Wath, M.G.; Suryawanshi, H.M. A novel approach for the error correction of ct in the presence of harmonic distortion. IEEE Trans. Instrum. Meas. 2019, 68, 4015–4027. [Google Scholar] [CrossRef]
  49. Ripka, P.; Draxler, K.; Styblíková, R. DC-compensated current transformer. Sensors 2016, 16, 114. [Google Scholar] [CrossRef] [Green Version]
  50. Ripka, P.; Draxler, K.; Styblikova, R. DC-compensated current transformer. In Proceedings of the Conference Record—IEEE Instrumentation and Measurement Technology Conference, Montevideo, Uruguay, 12–15 May 2014; pp. 212–215. [Google Scholar]
  51. Velasco-Quesada, G.; Roman-Lumbreras, M.; Conesa-Roca, A.; Jerez, F. Design of a low-consumption fluxgate transducer for high-current measurement applications. IEEE Sens. J. 2011, 11, 280–287. [Google Scholar] [CrossRef]
  52. Yang, X.; Zhang, B.; Wang, Y.; Zhao, Z.; Yan, W. The optimization of dual-core closed-loop fluxgate technology in precision current sensor. J. Appl. Phys. 2012, 111, 07E722. [Google Scholar] [CrossRef]
Figure 1. Equivalent circuit of inductive CT for transformation of distorted current. Where: i″1—instantaneous value of distorted primary current; i2—instantaneous value of distorted secondary current; i″0—instantaneous value of distorted excitation current; i″Fe—instantaneous value of distorted current associated with active power losses in the magnetic core; i″μ—instantaneous value of distorted magnetization current; u″μ—instantaneous value of distorted voltage on the mutual inductance of the windings; u2—instantaneous value of distorted secondary voltage; R″Fehk—resistance representing the active power losses in the magnetic core; L″μhk—mutual inductance of the windings; R2—resistance of the secondary winding; Lr2—leakage inductance of the secondary winding; RL—resistance of the load connected to the secondary winding; LL—inductance of the load connected to the secondary winding; CS—capacitance between terminals to the secondary winding; P1/P2—primary winding terminals; S1/S2—secondary winding terminals.
Energies 16 02648 g001
Figure 2. Operation points of the corrected inductive CT on the equivalent magnetization characteristic of the magnetic core [35]. Where: TC LL—equivalent magnetization characteristic of CT with applied turn correction determined for the low value of the load of the secondary winding; TC HL—equivalent magnetization characteristic of CT with applied turn correction determined for the high value of the load of the secondary winding; Non-load state—magnetization characteristic of the magnetic core determined in the non-load state of CT; BHL120%—the value of the magnetic flux density of the inductive CT obtained for 120% of the rated primary current and rated load of the secondary winding; BHL100%—the value of the magnetic flux density of the inductive CT obtained for 100% of the rated primary current and rated load of the secondary winding; BHL20%—the value of the magnetic flux density of the inductive CT obtained for 20% of the rated primary current and rated load of the secondary winding; BHL5%—the value of the magnetic flux density of the inductive CT obtained for 5% of the rated primary current and rated load of the secondary winding; BLL120%—the value of the magnetic flux density of the inductive CT obtained for 120% of the rated primary current and 25% of the rated load of the secondary winding; BLL100%—the value of the magnetic flux density of the inductive CT obtained for 100% of the rated primary current and 25% of the rated load of the secondary winding; BLL20%—the value of the magnetic flux density of the inductive CT obtained for 20% of the rated primary current and 25% of the rated load of the secondary winding; BLL5%—the value of the magnetic flux density of the inductive CT obtained for 5% of the rated primary current and 25% of the rated load of the secondary winding; HHL120%—the value of the magnetic field strength of the inductive CT obtained for 120% of the rated primary current and rated load of the secondary winding; HHL100%—the value of the magnetic field strength of the inductive CT obtained for 100% of the rated primary current and rated load of the secondary winding; HHL20%—the value of the magnetic field strength of the inductive CT obtained for 20% of the rated primary current and rated load of the secondary winding; HHL5%—the value of the magnetic field strength of the inductive CT obtained for 5% of the rated primary current and rated load of the secondary winding; HLL120%—the value of the magnetic field strength of the inductive CT obtained for 120% of the rated primary current and 25% of the rated load of the secondary winding; HLL100%—the value of the magnetic field strength of the inductive CT obtained for 100% of the rated primary current and 25% of the rated load of the secondary winding; HLL20%—the value of the magnetic field strength of the inductive CT obtained for 20% of the rated primary current and 25% of the rated load of the secondary winding; HLL5%—the value of the magnetic field strength of the inductive CT obtained for 5% of the rated primary current and 25% of the rated load of the secondary winding.
Energies 16 02648 g002
Figure 3. The area of the possible values of (a) current error and (b) phase displacement of the low-order higher harmonics from the 2nd to 15th determined for 100% of the rated primary current and the rated load of the secondary winding.
Energies 16 02648 g003aEnergies 16 02648 g003b
Figure 4. The most positive (+) and the most negative (−) values of (a) current error and (b) phase displacement determined for inductive CT 300 A/5 A with the rated resistive load of the secondary winding [4].
Energies 16 02648 g004
Figure 5. The most positive (+) and most negative (−) values of (a) current error and (b) phase displacement determined for inductive CT 300 A/5 A with 25% of the rated resistive load of the secondary winding [4].
Energies 16 02648 g005
Figure 6. The highest absolute values of (a) current error and (b) phase displacement determined for inductive CT 300 A/5 A with 25% of the rated resistive load of the secondary winding [4].
Energies 16 02648 g006
Figure 7. Comparison of the highest absolute values of (a) current error and (b) phase displacement determined for inductive CT 300 A/5 A with two values and power factors of the load [12].
Energies 16 02648 g007
Figure 8. Comparison of the percentage values of the self-generated low-order higher harmonics determined for inductive CT 300 A/5 A with two power factors and (a) 25% of the rated load and (b) the rated load [12].
Energies 16 02648 g008aEnergies 16 02648 g008b
Figure 9. The equivalent circuit of the inductive VT for transformation of distorted voltage [3]. The following abbreviations are used: u″1—instantaneous value of distorted primary voltage; u2—instantaneous value of distorted secondary voltage; R″1n/R″12/R″11—partial resistance of the primary winding; L″1n/L″12/L″11—partial leakage inductance of the primary winding; C″T1n/C″T12/C″T11—partial equivalent capacitance between the primary and secondary windings; C″G1n/C″G12/C″G11—partial equivalent capacitance of the primary winding to the ground; A/B(N)—terminals of the primary winding; a/b(n)—terminals of the secondary winding; R″Fe—resistance representing the active power losses in the magnetic core; L″μ—mutual inductance of the windings; R2—resistance of the secondary winding; L2—leakage inductance of the secondary winding.
Energies 16 02648 g009
Figure 10. Comparison of the highest absolute values of the (a) voltage error and (b) phase displacement determined for inductive VTs [3].
Energies 16 02648 g010aEnergies 16 02648 g010b
Disclaimer/Publisher’s Note: The statements, opinions and data contained in all publications are solely those of the individual author(s) and contributor(s) and not of MDPI and/or the editor(s). MDPI and/or the editor(s) disclaim responsibility for any injury to people or property resulting from any ideas, methods, instructions or products referred to in the content.