Abstract
The feasibility and potential assessment (PA) of solar PV energy is one of the key factors in identifying the most promising areas for the installation of solar PV stations. It determines the useful energy generated in the given area. This paper assesses the solar energy distribution and PA in the North Shewa administration zone. Based on the data collected and analysis made, it is found that more than 80% of the North Shewa areas are suitable for the solar energy generation for off-grid and on-grid systems. Hence, the solar potential of the North Shewa zone completely fulfills the standards of sunshine, solar radiation, and temperature. That is, most of the areas have solar radiation of 5.2 kWh/m2, and daily sunshine is greater than 7 h. The maximum energy production is found in December in Shewa Robit, Mehal Meda, Eneware, Debre Berhan, Alem Ketema, and Sela Dengay with 175.35 kWh, 188.18 kWh, 180.78 kWh, 189.54 kWh, 175.78 kWh, and 189.63 kWh, respectively. This is a good opportunity for investors to invest in solar PV electricity generation. It will solve the issue of electricity supply to the community, which currently relies on wood and fossil fuels. It also highlights the positive opportunities for the future implementation of solar energy.
1. Introduction
Ethiopia is one of the countries in sub-Saharan Africa with a low electrification rate. Even though the country has massive potential in diversified energy sources, only 40% of the house holds have electricity access [1]. The energy system is highly dependent on traditional fossil fuels and biomass, which accounts for about 91% of the total energy consumption [2]. Due to the lack of electricity, the rural villagers are forced to use wood for cooking at home and selling it in the market, which has made the problem more severe and has led to desertification due to deforestation. Since there has been no proper solar feasibility and potential assessment (PA) in this area, it is not possible to implement solar PV electrification for the rural communities [3]. The country experiences an estimated solar energy potential of 4–6 kWh/m2/day [4]. As this potential estimation value varies from area to area, a proper feasibility and PA study is necessary. To address this, the study of PA of one of the most suitable clean energy technologies, such as solar energy, is very important. The North Shewa zone is one part of Ethiopia in the Amhara region where most of the rural people are without access to electricity. With this in mind, this paper mainly addresses the feasibility and PA of solar resources in this area. With this PA, any interested stakeholders can implement an off-grid system in the area to solve the problem of lack of access to electricity.
1.1. Motivation
Currently, human life directly or indirectly depends on energy in developing countries and also in developed countries. Thus, the search for possible resources and their location is the beginning point in the process of energy production. In Ethiopia, most of the energy sources are not assessed. The geographical location and the people’s settlement patterns in the case study area are best suited for an off-grid system because connecting to the national grid and installing the new lines is difficult and costly. However, there is no predefined solar irradiation potential value for this particular zone. In this regard, most health centers, schools, and individual households are facing delays in obtaining proper electric service from solar PV energy. In addition to this, PV energy does not support any water pumps to provide pure drinking water to the community. These critical problems motivated the authors to study the solar PA in the North Shewa zone, Amhara Region, Ethiopia.
1.2. Literature Review
One of the most abundant renewable energy resources in Africa is solar energy. In [5], the authors estimate that the theoretical potential from PV solar energy is 660,000 TWh. This value is approximately 900 times that of the current annual solar energy generated on the continent, which is 750 TWh. The authors of [6] determined the solar irradiance value by considering 15 locations in Ethiopia. Based on the sunshine-hour-based models, they found power generation potential to be 2131.6 kWh/m2/year. The authors of [7] discussed how the use of renewable energy can affect climate change and noted that emissions must be reduced by nearly half by 2030 and may be able to reach net-zero by 2050. According to the solar energy PA analysis [8], Addis Ababa, which is the capital city of Ethiopia, receives the highest solar radiation value of 2915.03 kWh/m2/year. In addition, the PV module annual energy output is the highest in Ethiopia, which is 286.685 kWh/m2/year. The authors of [9] conducted a study on solar PA using radiation and sunshine hour data and noted that Ethiopia has abundant solar radiation distribution. In Ethiopia, the exploitable reserve of solar energy potential is 5.2 kWh/m2/day, and less than 1% of this amount has been exploited [10]. The country’s primary electric power supply is from hydropower, and it currently supplies approximately 17 times more electricity than solar power does. To further harness the potential of solar energy, in 2016 the government of Ethiopia asked for bids to build three 100 MW solar PV projects at Mekele, Humera, and Metehara. The Enel Green Power (EGP) was selected for the project located near Metehara with a cost of USD 58.98 per MWh. The other two projects have not yet been awarded [11]. Recently, the study of solar power PA in various parts of the country has increased. the authors of [12] used the Angestrom–Prescott model and rigorous interpolation methods to assess the potential of solar energy in the Amhara region. Authors of [13] proposed an analytic hierarchy process method for identifying suitable solar PV locations in the South Gonder zone, Amhara, Ethiopia. It was concluded that 25.5% of the areas are highly suitable, 35.7% of the areas are suitable, around 13.5% of the areas are considered to be moderately suitable, and 25.3% of the areas are not suitable for solar energy production. In [14], a feasibility study was conducted using hybrid PV, biogas, mini-hydro, and batteries with converter components by considering the case study of Minjar-Shenkora Woreda in the Amhara region, Ethiopia. In addition, it concludes that a stand-alone hybrid system can generate excess electricity and increase its reliability. In [15], HOMOR software was applied to conduct a study on the potential and feasibility of standalone solar PV, wind, biogas, and biodiesel hybrid electric supply systems in Ethiopia to analyze the generation of electricity from a hybrid system. In [16], by optimizing the string distances in PV using a graphical interface in Matlab, an improved annual energy capacity factor and performance ratios were achieved. The authors of [17] proposed a GIS-based data mining methodology using ANFIS to interpolate global solar radiation estimation for some selected locations in Ethiopia, and the result was validated with data from the PVGIS and SWERA projects. In [18], the potential and feasibility of a standalone solar–wind hybrid electric energy supply system study was conducted. This study contributed a lot to the wind power generation of Ashegoda near Mekele and the wind power generation project in Nazret (Adama I and Adama II). The authors of [19,20,21,22,23,24,25] discussed the feasibility and PA of renewable energy systems such as solar and examined their economic impact, contribution to the environment, impact on grid integration systems, etc. Because of the rapid migration of people from rural to urban areas, energy consumption in cities is increasing. Some countries have taken steps to address such issues. Norway, for example, installed solar panels in urban buildings to reduce greenhouse gas emissions after assessing the potential resources in Trondheim [26]. Based on the solar assessment of rooftops with integrated PV systems, the assessed PV potential in the northwestern region of Italy reaches 6.9 TWh/year [27]. Using a high-resolution geospatial assessment method, researchers concluded that rooftop solar PV systems could potentially produce 680 TWh of solar electricity in the European Union [28]. The authors of [29] conducted a review for estimating the global solar radiation in Africa. In [30], the performance evaluation and optimization of a PV/thermal system based on climatic conditions was studied, and the best performance was identified with a multi-objective evolutionary algorithm based on the decomposition optimization technique. The authors of [31] discussed how thermal management techniques can increase overall efficiency. The authors of [32] presented a comprehensive review of PV power plant performance assessment.
This paper presents the feasibility and PA of solar resources in the North Shewa zone, Amhara region, Ethiopia. This paper collected data for more than 5 years from the National Meteorology Agency (NMA) of Addis Ababa, Ethiopia. This study will provide good input for the future implementation of solar energy in the identified areas. The rest of the paper is organized as follows. The materials and methods are discussed in Section 2. Study area descriptions are presented in Section 3. The results of the test studies and discussions are presented in Section 4. The concluding highlights of the paper are described in Section 5.
1.3. Contributions
This work includes all the districts in the North Shewa zone and assesses the solar energy potential of each location. The following are the contributions of this work:
- Identify the locations of solar PV resource potential in the study areas.
- Determine the solar irradiation in kWh/m2/day in the study areas.
- Provide information of annual solar potential at different locations.
- Indicate the solar potential of the areas using map locations.
- Assess temperature in the study areas.
- Contribute knowledge implications.
- Determine the suitable solar potential location in urban, semi-urban, and rural areas.
- Mitigate the emission of greenhouse gas.
- Contribute to the world’s sustainable goal for the achievement of zero carbon release by 2050.
2. Materials and Methods
This paper focuses mainly on the PA of solar energy and the best locations for the resource in the North Shewa zone. In this work, seven districts located in different parts of the North Shewa zone are selected as case studies. The data were collected from 7 meteorology centers in the zone and more than 27 locations from NASA for more than 5 years and DNI (direct normal irradiation in kWh/m2 per year), DIF (diffuse horizontal irradiation in kWh/m2 per year), sunshine, and probability of energy production were analyzed at each site. This paper uses hybrid optimization of multiple electric renewables (HOMER) and Matlab software to determine the daily, monthly, and annual possible availability of the resource. The data on global solar radiation and other meteorological parameters, including average temperature, sunshine duration, GHI (global horizontal irradiation in kWh/m2 per year), and DFI for the selected locations were collected from the National Meteorology Agency (NMA), located in Addis Ababa. Solar radiation, temperature, and sunshine duration were measured at a 2 m height.
Based on meteorological and NASA data, which include average daily, monthly, and yearly radiation by latitude, HOMER can calculate the clearness index using the global horizontal radiation (GHI). The clearness index is a dimensionless number between zero and one indicating the fraction of solar radiation that makes it through the atmosphere to strike the Earth’s surface. The following Equation (1) defines the monthly average clearness index.
where Have is the monthly average radiation on the horizontal surface of the Earth (kWh/m2/day), and Ho,ave is extraterrestrial horizontal radiation (kWh/m2/day).
The hybrid optimization of multiple electric renewables (HOMER) uses the following equation to calculate the intensity of solar radiation at the top of the Earth’s atmosphere.
where Gsc is the solar constant (1.367 kW/m2), and n is the day of the year (a number between 1 and 365).
Equation (2) gives the extraterrestrial radiation on a surface from the sun’s rays. The extraterrestrial radiation on the horizontal surface can be calculated by the following equation.
The zenith angle is calculated by using Equation (3),
The solar declination is calculated using the following equation,
where θz is the zenith angle (°), is the latitude (°), is the hour angle (°), and is the solar declination (°).
The total daily extraterrestrial radiation per square meter is given by Equation (6) by integrating the Go from sunrise to sunset.
where Ho is the average extraterrestrial horizontal radiation for the day (kWh/m2/day), and is the sunset hour angle (°).
The sunset hour angle using the following equation is:
where N is the number of days in the month
The HOMER divides the monthly average global solar radiation by Ho,ave to find the monthly average clearness index.
3. Study Area Descriptions
This research covers the areas of the North Shewa zone, which are in the Amhara region of Ethiopia. North Shewa takes its name from the kingdom of the former province of Shewa, Debre Berhan city, which is the main administrative center of North Shewa. In this zone, there are 23 districts and 10 city administrations, such as Sela Dengay, Debre Berhan, Debre Sina, Shewa Robit, and Ankober. Based on the 2007 census conducted by the Central Statistical Agency of Ethiopia (CSA), the zone has a total population of 1,837,490, of whom 928,694 are men and 908,796 are women. With an area of 15,936.13 square kilometers, 11.66% are urban. A total of 429,423 households are counted in this zone, which results in an average of 4.28 people per household and 413,235 housing units [17].
Out of 23 districts in the North Shewa zone, only 7 districts have meteorology centers. In this paper, the data were collected from the seven meteorology centers and online data from NASA. The map of North Shewa, which has a meteorology center. This paper addresses seven of the total districts and city administrations in North Shewa, such as Debre Berhan, Mehal Meda, Eneware, Gunde Meskel, Majete, Alem Ketema, and Shewa Robit.
4. Result and Discussion
Recently in Ethiopia, power consumption and energy generation have not been balanced due to different factors, such as rapidly growing populations and the country’s high dependence on one type of energy source (i.e., hydropower). To overcome such challenges, the feasibility and PA of all types of energy resources are important first steps to take. Figure 1 depicts the average daily solar radiation, minimum radiation, maximum radiation, and cleanness index of the North Shewa zone using HOMER software. The data were collected from NASA, and the daily solar radiation of the Debre Berhan site and the cleanness index were calculated using HOMER software.
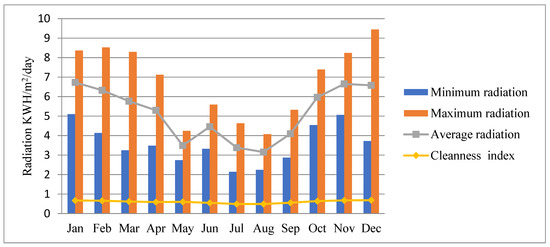
Figure 1.
Solar radiation and cleanness index of North Shewa zone.
Figure 1 shows that the average solar radiation is minimum in July and maximum in February. The cleanness index is minimum in August and maximum in December. The daily solar radiation of the Debre Berhan site obtained from the National Renewable Energy Laboratory database was found to be between 5.060 kWh/m2 and 6.33 kWh/m2 per day, which is feasible for the production of solar energy. The mean value of solar radiation data throughout the year is 5.23 kWh/m2/day. According to the NMA and NASA, the daily measured radiation of the sun is sufficient to generate maximum solar power from January to May, with minimum values occurring from June to September. The assessment also covers the temperature of each site, which is another factor in solar energy production because semiconductor materials use dare affected by temperature. Therefore, before installing solar panels, one should consider the air temperature to maximize their efficiency and increase their lifetime. Figure 2 shows the average, minimum, and maximum temperature assessment of the Debre Berhan site from NASA. The maximum and minimum temperature measured at the site in May and July, respectively, are 22.66 °C and 18.58 °C.
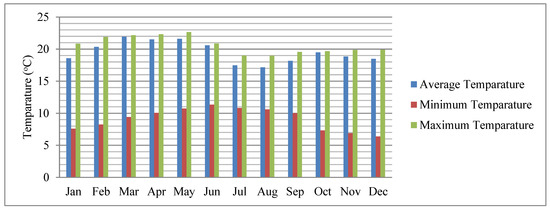
Figure 2.
Temperature data assessment of Debre Berhan in the North Shewa zone.
In order to assess the potential of this renewable energy, solar radiation was continuously monitored in all areas of the North Shewa zone for five years. Table 1 shows the monthly average solar radiation measured at 22 locations in the North Shewa zone for different parameters, such as specific PV, GHI, DNI, DIF, and temperature, which were obtained from NASA. Specific yield is specific PV power output in kWh/m2/year. DNI is direct normal irradiation in kWh/m2/year. GHI is global horizontal irradiation in kWh/m2/year, and DIF is diffuse horizontal irradiation in kWh/m2/year. The test results show that most of the locations have good potential for solar energy generation since they meet the minimum requirements for GHI, DNI, and other parameters [33].

Table 1.
Annual average solar radiation assessment of North Shewa at various locations.
In the North Shewa zone, the global horizontal radiation varies from 1933.5 to 2294.4 kWh/m2, and direct normal irradiation varies from 1394.8 to 2115.9 kWh/m2. In addition, we note that the highest and lowest average monthly temperatures are (23.3 °C) and (9.1 °C) at Lam Washa and Mut’a’i Mayes, respectively. In this paper, daily, monthly, and yearly data were collected and analyzed in order to properly identify and select the best potential locations for solar PV energy production. Figure 3 shows the daily solar PA of GHI, DNI, DIF, and temperature at different locations. In most of the areas, GHI is greater than 2400 kWh/m2 per year, DNI is more than 2100 kWh/m2 per year, and DIF is more than 1850 kWh/m2 per year.
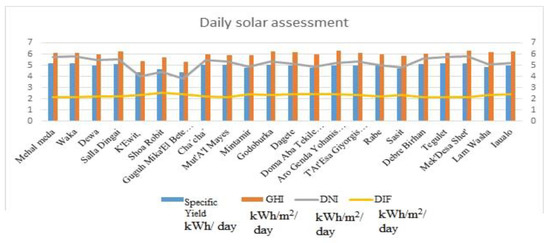
Figure 3.
Daily solar assessment atdifferent locations.
Based on Table 2, and the DNI values from Table 1, it is observed that most of the locations in North Shewa, such as Mehal Meda, Waka, Sela Dengay, Dewa, Tegulet Chacha, etc., are good for solar energy product. They have a DNI greater than 2000 kWh/m2 per year. There are also solar-friendly locations in the zone, such as Mintamir, Godoburka, Dagete, Rabe, Sasit, Lam Washa, and others have DNI 1600 to 2000 kWh/m2/year.A few locations in the zone have DNI less than 1600 kWh/m2/year, such as K’ewit, which is not recommended for solar. Figure 3 shows the daily solar assessment of the DNI, DIF, GHI, and specific yields in the zone. Daily assessment is important to analyze the actual output of each parameter. Since average values are used, the annual assessment is less accurate, and it will not show clear information for each parameter.
Table 2.
Cumulative solar DNI in kWh/m2 per year and remarks [34].
This research also attempts to address each district in the area, even those without meteorology centers, by collecting data from NASA. The sun’s rays are attenuated as they pass through the atmosphere, leaving maximum normal surface irradiance at sea level on a clear day of around 1000 W/m2. The minimum solar insolation needed to generate electricity is 100–200 W/m2 (2.4 kWh/m2–4.8 kWh/m2) [33]. The result indicates the daily solar radiation is 4.688 kWh/m2 and 5.335 kWh/m2,the minimum and maximum, respectively, which is best for solar energy production.
Figure 4 shows the annual sunshine assessment of North Shewa at different districts collected from the NMA of Ethiopia. The result shows that the sunshine of most of the areas is greater than 6 h per day, but Gunde Meskel’s sunshine is only 5 h. Those data were not recorded at the NMA, so the minimum value from all the given data at the district was used.
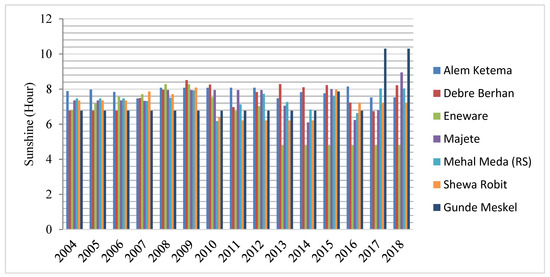
Figure 4.
Annual sunshine assessment of North Shewa from the NMA.
4.1. Assessment of Solar Potential Based on NASA Online Data
For data accuracy and analysis, the data were collected from both the NMA and NASA data centers. Figure 5 shows the direct normal radiation data of seven selected districts of the zone which were collected from NASA. Most of the locations have the best solar DNI from January to May. On the other hand, they have the minimum DNI from June to August and moderate DNI from September to December.
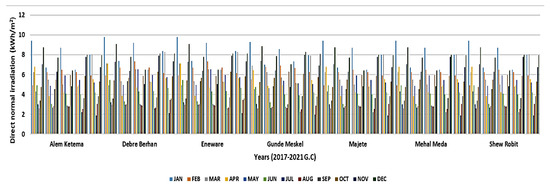
Figure 5.
NASA’s assessment of solar radiation [35].
4.2. Solar Potential Analysis
Figure 6, Figure 7, Figure 8, Figure 9, Figure 10 and Figure 11 depict the energy assessment reports of solar systems at six selected solar energy production locations. Solar energy production is dependent on solar radiation and sunshine, which means that the location with the best solar radiation and the longest-lasting sunshine will be able to produce more energy from the sun. Figure 6, Figure 7, Figure 8, Figure 9, Figure 10 and Figure 11 show that maximum energy production occurred in December in Shewa Robit, Mehal Meda, Eneware, Debre Berhan, Alem Ketema, and Sela Dengayare, 175.35 kWh, 188.18 kWh, 180.78 kWh, 189.54 kWh, 175.78 kWh, and 189.63 kWh, respectively.
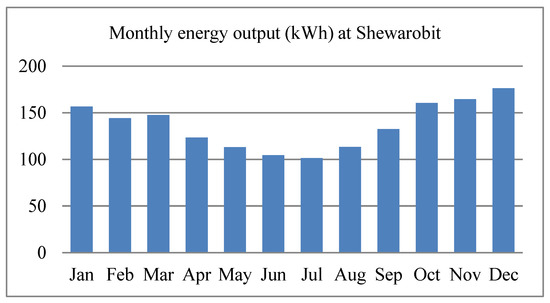
Figure 6.
Energy assessment of solar system at Shewa Robit.
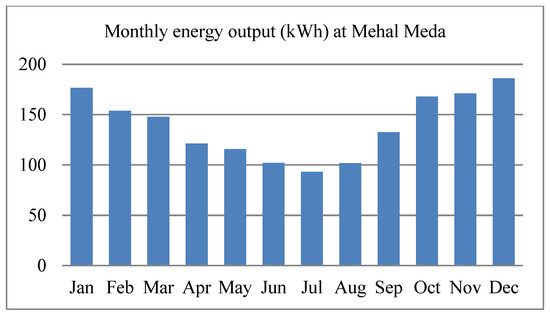
Figure 7.
Energy assessment of solar system at Mehal Meda.
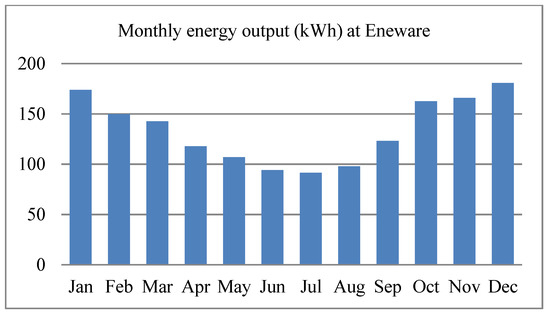
Figure 8.
Energy assessment of solar system at Eneware.
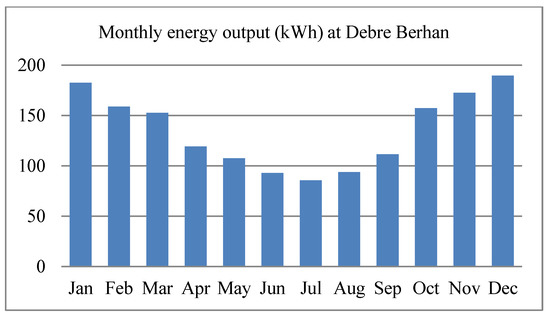
Figure 9.
Energy assessment of solar system at Debre Berhan.
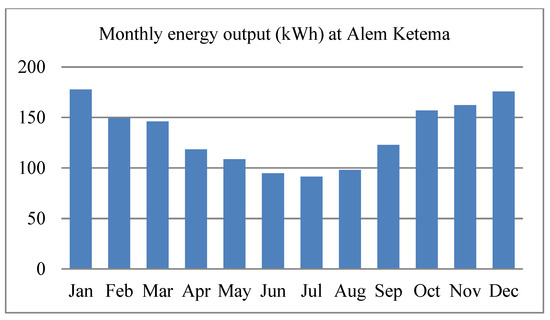
Figure 10.
Energy assessment of solar system at Alem Ketema.
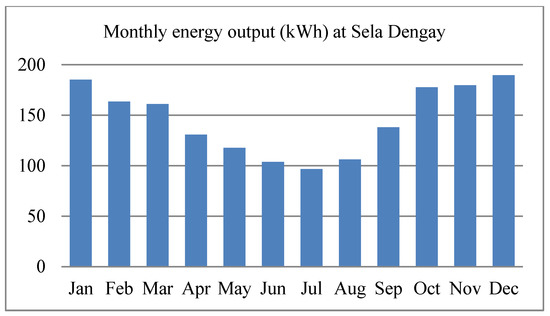
Figure 11.
Energy assessment of solar system at Sela Dengay.
From Figure 12, Figure 13, Figure 14, Figure 15, Figure 16 and Figure 17 shows the monthly global solar radiation of Eneware, Debre Berhan, Sela Dengay, Shewa Robit, Mehal Meda, and Alem Ketema, respectively. The global solar radiation starts decreasing from May to August and increases from September to April. In most of the locations, the minimum and maximum solar radiations vary from month to month and location to location. As a result, the minimum radiation occurred in June, July, and August. The worst case occurs in July at various locations because this season is rainy for Ethiopia. So the minimum radiation levels in July are 118.35 kWh/m2, 110.87 kWh/m2, 121.59 kWh/m2, 135.49 kWh/m2, 119.38 kWh/m2, and 118.75 kWh/m2 for Eneware (9.83, 39.15, 2561 m), Debre Berhan (9.633333, 39.5, 2750 m), Sela Dengay (9.58, 39.38, 2880 m), Shewa Robit (10.0127, 39.89436, 1277 m), Mehal Meda (10.3146, 39.66025, 3084 m), and Alem Ketema (10.033333, 39.033333, 2280 m), respectively. Most of the locations in the zone have high radiation for more than nine months of the year, from September to May, with the maximum radiation occurring at all six locations in December. In general, the best solar radiation is available at each site during the dry or winter seasons. The remaining season, i.e., 3 months, has moderate solar radiation for solar energy production.
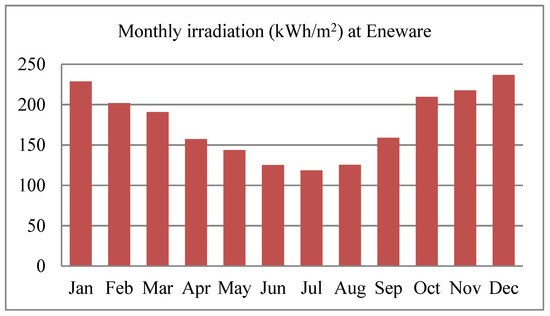
Figure 12.
Solar radiation assessment of North Shewa zone at Eneware.
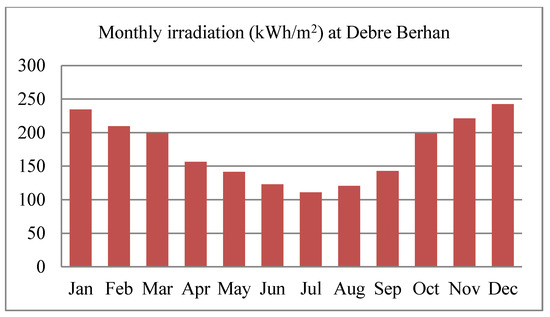
Figure 13.
Solar radiation assessment of North Shewa zone at Debre Berhan.
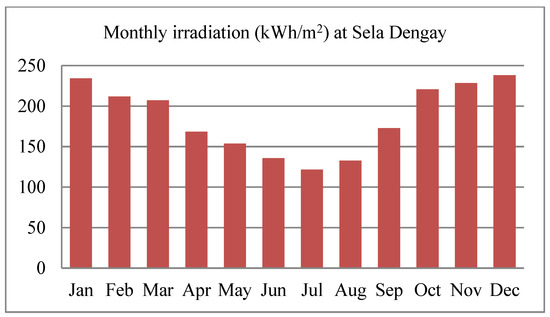
Figure 14.
Solar radiation assessment of North Shewa zone at Sela Dengay.
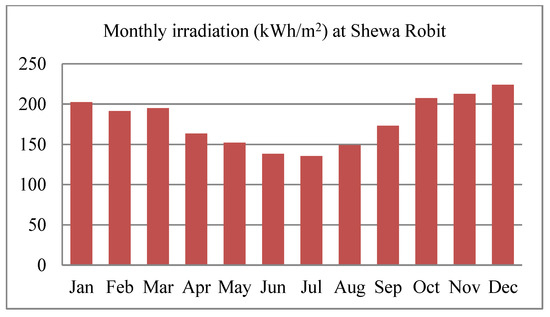
Figure 15.
Solar radiation assessment of North Shewa zone at Shewa Robit.
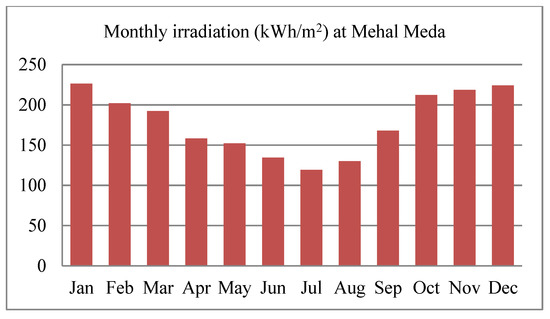
Figure 16.
Solar radiation assessment of North Shewa zone at Mehal Meda.
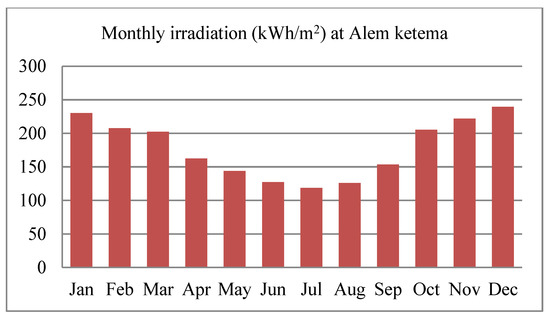
Figure 17.
Solar radiation assessment of North Shewa zone at Alem Ketema.
The collected analytical data and data simulation show that solar irradiance is quite stable throughout the year, and the sunshine is on average eight hours at each site. In addition, this paper recommends using a battery to supply the load to increase the reliability and customer satisfaction in certain months that have cloudy or rainy days. By analyzing all the data from the NMA and NASA, the assessment shows that the areas listed in the figure and tables throughout North Shewa have the best solar radiation, sunshine, and long-term peak sun hours. Therefore, the zone is feasible and best for generating solar energy for domestic, commercial, and irrigation purposes. The zone has the ability to receive sufficient solar resources for energy production throughout the year.
5. Conclusions
This research paper covers the theoretical, geographical, and technical potentials of solar energy at different areas of North Shewa. The results of the feasibility assessment show that almost all 23 districts of the North Shewa zone have the best solar potential based on NMA and NASA data. For detailed analysis, six locations were considered for the case study of the feasibility and PA of solar resources in the North Shewa zone, Amhara region, and Ethiopia. The following are the main conclusions of the study. The maximum energy potential is in December in Shewa Robit, Mehal Meda, Eneware, Debre Berhan, Alem Ketema, and Sela Dengay and is 175.35 kWh, 188.18 kWh, 180.78 kWh, 189.54 kWh, 175.78 kWh, and 189.63 kWh, respectively. This paper presents the daily and monthly potentials of solar power throughout North Shewa, such as daily solar potential at different locations, annual solar potential at different locations, map locations of solar potential, NASA’s assessment of solar radiation, monthly energy output from a fixed angle, and PV monthly in-plane irradiation for a fixed angle. All were analyzed using HOMER software. The minimum radiation levels found to exist in July are 118.35 kWh/m2, 110.87 kWh/m2, 121.59 kWh/m2, 135.49 kWh/m2, 119.38 kWh/m2, and 118.75 kWh/m2 for Eneware, Debre Berhan, Sela Dengay, Shewa Robit, Mehal Meda, and Alem Ketema, respectively. Finally, the North Shewa zone has solar potential, with solar radiation ranging between 4.2 kWh/m2 and 5.8 kWh/m2/day, but areas such as Majete, Alem Ketema, and Shewa Robit have the best solar potential in the list.
Author Contributions
S.F., D.A., B.P. and R.S. designed the problem under study and performed the simulations and obtained the results; S.F., D.A., B.P. and R.S. wrote the paper, which was further reviewed by A.Y.A. and A.E.-S. All authors have read and agreed to the published version of the manuscript.
Funding
This research received no external funding.
Data Availability Statement
Not applicable.
Conflicts of Interest
The authors declare no conflict of interest.
Nomenclature
| Acronym | Definition |
| PA | Potential Assessment |
| DNI | Direct Normal Irradiation |
| GHI | Global Horizontal Irradiation |
| DIF | Diffuse Horizontal Irradiation |
| NMA | National Meteorology Agency |
| NASA | National Aeronautics and Space Administration |
| EMA | Energy Market Authority |
| PV | Photo Voltaic |
| EEP | Ethiopia Electric Power |
| HOMER | Hybrid Optimization of Multiple Energy Resources |
| GIS | Geographic Information System |
| ANFIS | Adaptive Neuro-Fuzzy Inference System |
| PVGIS | Photovoltaic Geographical Information System |
| SWERA | Solar Wind Energy Resource Assessment |
References
- Mugisha, J.; Ratemo, M.A.; Keza, B.C.B.; Kahveci, H. Assessing the opportunities and challenges facing the development of off-grid solar systems in Eastern Africa: The cases of Kenya, Ethiopia, and Rwanda. Energy Policy 2021, 150, 112131. [Google Scholar] [CrossRef]
- Tucho, G.T.; Weesie, P.D.; Nonhebel, S. Assessment of renewable energy resources potential for large scale and standalone applications in Ethiopia. Renew. Sustain. Energy Rev. 2014, 40, 422–431. [Google Scholar] [CrossRef]
- Kebede, M.H.; Beyene, G.B. Feasibility study of PV-wind-fuel cell hybrid power system for electrification of a rural village in Ethiopia. J. Electr. Comput. Eng. 2018, 2018, 4015354. [Google Scholar]
- Guta, D.D. Determinants of household adoption of solar energy technology in rural Ethiopia. J. Clean. Prod. 2018, 204, 193–204. [Google Scholar] [CrossRef]
- IRENA. Estimating the Renewable Energy Potential in Africa—A GIS-Based Approach; IRENA: Abu Dhabi, United Arab Emirates, 2014. [Google Scholar]
- Benti, N.E.; Aneseyee, A.B.; Asfaw, A.A.; Geffe, C.A.; Tiruye, G.A.; Mekonnen, Y.S. Estimation of global solar radiation using sunshine-based models in Ethiopia. Cogent Eng. 2022, 9, 2114200. [Google Scholar] [CrossRef]
- United Nations, Renewable Energy—Powering a Safer Future. Available online: https://www.un.org/en/climatechange/raising-ambition/renewable-energy (accessed on 2 January 2023).
- Dursun, E. Solar Energy Potential in Horn of Africa: A Comparative Study Using Matlab/Simulink. Balk. J. Electr. Comput. Eng. 2021, 9, 310–319. [Google Scholar] [CrossRef]
- Drake, F.; Mulugetta, Y. Assessment of solar and wind energy resources in Ethiopia. I. Solar energy. Sol. Energy 1996, 57, 205–217. [Google Scholar] [CrossRef]
- Beyene, G.E.; Kumie, A.; Edwards, R.; Troncoso, K. Opportunities for Transition to Clean Household Energy in Ethiopia: Application of the Household Energy Assessment Rapid Tool (HEART). 2018. Available online: https://www.who.int/publications/i/item/9789241514491 (accessed on 2 January 2023).
- Kruger, W.; Stuurman, F.; Alao, F. Ethiopia Country Report in Report 5: Energy and Economic Growth Research Programme (W01 and W05) PO Number PO00022908. 2019. Available online: https://www.gsb.uct.ac.za/files/Ethiopia_Country_Report.pdf (accessed on 2 January 2023).
- Hailu, E.; Salau, A.O.; Godebo, A.J. Assessment of solar energy potential of east gojjam zone Ethiopia using angestrom-prescott model. Int. J. Eng. Res. Afr. 2021, 53, 171–179. [Google Scholar] [CrossRef]
- Nebey, A.H.; Taye, B.Z.; Workineh, T.G. Site Suitability Analysis of Solar PV Power Generation in South Gondar, Amhara Region. J. Energy 2020, 2020, 3519257. [Google Scholar] [CrossRef]
- Lachore, W.L.; Biru, G. Feasibility Study and Design of Standalone Hybrid Power Generation System for Rural Area in Ethiopia: Case Study of Minjar-ShenkoraWoreda. Int. J. Renew. Energy Sources 2021, 6, 8–29. [Google Scholar]
- Teferra, D.M. Potential and feasibility study of standalone solar PV/wind/biogas and biodiesel hybrid electric supply system in Ethiopia. Int. J. Energy Technol. Policy 2017, 13, 368–377. [Google Scholar] [CrossRef]
- Aprilianti, K.P.; Baghta, N.A.; Aryani, D.R.; Jufri, F.H.; Utomo, A.R. Potential assessment of solar power plant: A case study of a small island in Eastern Indonesia. IOP Conf. Ser. Earth Environ. Sci. 2020, 599, 012026. [Google Scholar] [CrossRef]
- AbebeWorke, B.; Bludszuweit, H.; Domínguez-Navarro, J.A. Solar Radiation Estimation Using Data Mining Techniques for Remote Areas—A Case Study in Ethiopia. Energies 2020, 13, 5714. [Google Scholar] [CrossRef]
- Bekele, G. Study into the Potential and Feasibility of a Standalone Solar-Wind Hybrid Electric Energy Supply System; KTH Royal Institute of Technology: Stockholm, Sweden, 2009; Available online: http://kth.diva-portal.org/smash/record.jsf?pid=diva2%3A282919&dswid=8816 (accessed on 2 January 2023).
- Miad, A.M.A.; Mostafa, S.M.G.; Arafat, Y. Feasibility Analysis and Economic Impact Assessment of Microgrid Renewable Energy Systems in Burao, Somaliland. In Proceedings of the 2019 1st International Conference on Advances in Science, Engineering and Robotics Technology (ICASERT), Dhaka, Bangladesh, 3–5 May 2019; pp. 1–6. [Google Scholar]
- Akhtar, I.; Kirmani, S.; Jameel, M.; Alam, F. Feasibility Analysis of Solar Technology Implementation in Restructured Power Sector with Reduced Carbon Footprints. IEEE Access 2021, 9, 30306–30320. [Google Scholar] [CrossRef]
- Maliro, P.; Diarra, B.; Samikannu, R. Technical and economic feasibility assessment for a solar PV mini-grid for Matekenya village. Cogent Eng. 2022, 9, 2110707. [Google Scholar] [CrossRef]
- Kassem, Y.; Camur, H.; Abughinda, O.A. Solar energy potential and feasibility study of a 10MW grid-connected solar plant in Libya. Eng. Technol. Appl. Sci. Res. 2020, 10, 5358–5366. [Google Scholar] [CrossRef]
- Abnavi, M.D.; Mohammadshafie, N.; Rosen, M.A.; Dabbaghian, A.; Fazelpour, F. Techno-economic feasibility analysis of stand-alone hybrid wind/photovoltaic/diesel/battery system for the electrification of remote rural areas: Case study Persian Gulf Coast-Iran. Environ. Prog. Sustain. Energy 2019, 38, 13172. [Google Scholar] [CrossRef]
- Nacer, T.; Hamidat, A.; Nadjemi, O.; Bey, M. Feasibility study of grid connected photovoltaic system in family farms for electricity generation in rural areas. Renew. Energy 2016, 96, 305–318. [Google Scholar] [CrossRef]
- Iqbal, S.; Jan, M.U.; Rehman, A.U.; Shafiq, A.; Rehman, H.U.; Aurangzeb, M. Feasibility Study and Deployment of Solar Photovoltaic System to Enhance Energy Economics of King Abdullah Campus, University of Azad Jammu and Kashmir Muzaffarabad, AJK Pakistan. IEEE Access 2022, 10, 5440–5455. [Google Scholar] [CrossRef]
- Lobaccaro, G.; Lisowska, M.M.; Saretta, E.; Bonomo, P.; Frontini, F. A methodological analysis approach to assess solar energy potential at the neighborhood scale. Energies 2019, 12, 3554. [Google Scholar] [CrossRef]
- Bergamasco, L.; Asinari, P. Scalable methodology for the photovoltaic solar energy potential assessment based on available roof surface area: Application to Piedmont Region (Italy). Sol. Energy 2011, 85, 1041–1055. [Google Scholar] [CrossRef]
- Bódis, K.; Kougias, I.; Jäger-Waldau, A.; Taylor, N.; Szabó, S. A high-resolution geospatial assessment of the rooftop solar photovoltaic potential in the European Union. Renew. Sustain. Energy Rev. 2019, 114, 109309. [Google Scholar] [CrossRef]
- Chukwujindu, N.S. A comprehensive review of empirical models for estimating global solar radiation in Africa. Renew. Sustain. Energy Rev. 2017, 78, 955–995. [Google Scholar] [CrossRef]
- Assareh, E.; Jafarian, M.; Nedaei, M.; Firoozzadeh, M.; Lee, M. Performance Evaluation and Optimization of a Photovoltaic/Thermal (PV/T) System according to Climatic Conditions. Energies 2022, 15, 7489. [Google Scholar] [CrossRef]
- Guedri, K.; Salem, M.; Assad, M.E.H.; Rungamornrat, J.; Malek Mohsen, F.; Buswig, Y.M. PV/Thermal as Promising Technologies in Buildings: A Comprehensive Review on Exergy Analysis. Sustainability 2022, 14, 12298. [Google Scholar] [CrossRef]
- Aslam, A.; Ahmed, N.; Qureshi, S.A.; Assadi, M.; Ahmed, N. Advances in Solar PV Systems; A Comprehensive Review of PV Performance, Influencing Factors, and Mitigation Techniques. Energies 2022, 15, 7595. [Google Scholar] [CrossRef]
- Solar constant. Available online: https://en.wikipedia.org/wiki/Solar_constant (accessed on 2 January 2023).
- Wang, Z. Design of Solar Thermal Power Plants; Academic Press: Cambridge, MA, USA, 2019; pp. 417–424. ISBN 9780128156131. [Google Scholar] [CrossRef]
- Available online: https://globalsolaratlas.info/map/c=9.637307,39.37912,9&s=9.811916,39.556274&m=site (accessed on 2 January 2023).


Disclaimer/Publisher’s Note: The statements, opinions and data contained in all publications are solely those of the individual author(s) and contributor(s) and not of MDPI and/or the editor(s). MDPI and/or the editor(s) disclaim responsibility for any injury to people or property resulting from any ideas, methods, instructions or products referred to in the content. |
© 2023 by the authors. Licensee MDPI, Basel, Switzerland. This article is an open access article distributed under the terms and conditions of the Creative Commons Attribution (CC BY) license (https://creativecommons.org/licenses/by/4.0/).