Abstract
Incorporating photovoltaic (PV) inverters in power distribution systems via static synchronous compensators (PV-STATCOM) during the nighttime has lately been described as a solution to improve network performance. Hunter prey optimization (HPO) is introduced in this study for efficient PV-STATCOM device allocation in distribution systems. HPO generates numerous scenarios for how animals could act when hunting, some of which have been expanded into stochastic optimization. The PV-STATCOM device allocation issue in distribution networks is structured to simultaneously minimize the electrical energy losses and improve the voltage profile while accounting for variable 24 h loadings. The impacts of varying the number of installed PV-STATCOM devices are investigated in distribution systems. It is tested on two IEEE 33-node and 69-node distribution networks. The effectiveness of the proposed HPO is demonstrated in comparison to the differential evolution (DE) algorithm, particle swarm optimization (PSO), artificial rabbits algorithm (ARA), and golden search optimizer (GSO). The simulation results demonstrate the efficiency of the proposed HPO in adequately allocating the PV-STATCOM devices in distribution systems. For the IEEE 33-node distribution network, the energy losses are considerably decreased by 57.77%, and the voltages variance sum is significantly reduced by 42.84%. The energy losses in the IEEE 69-node distribution network decreased by 57.89%, while voltage variations are reduced by 44.69%. Additionally, the suggested HPO is highly consistent than the DE, PSO, ARA, and GSO. Furthermore, throughout the day, the voltage profile at all distribution nodes surpasses the minimum requirement of 95%.
1. Introduction
The use of fossil fuels has been recognized as one of the main causes of climate change for many years. This has led, among other effects, to global warming, which is expected to reach 1.5 degrees Celsius by 2030 [1]. With the global depletion of fossil fuels and the deregulation of the energy sectors, the integrating technology of the distributed generator (DG) has gained significant attention during the last decade [2]. Modern electrical power systems have demanded the creation of new solutions and services to fulfill the increased demand for electrical energy caused by population expansion, technological advancements, and the pursuit of quality of life [3]. DGs, particularly solar-distributed generation, have been progressively supporting active power generation in distribution networks [2]. The use of DGs has a wide range of positive benefits for power systems, particularly in distribution systems with large power supply distances and a fragile structure of the network. The optimal placement of DGs is critical to these favorable benefits. Improper DG placement and sizing always result in low utilization of DG investment. In extreme cases, system indices may be worse following DG integration. Because of the fast rise of DG penetration in distribution networks, studies on appropriate DG siting and size are becoming increasingly important. In [4], three advanced systems—the operator training simulator, the outage management system, and the real-time operation and control system—as well as their design and primary function modules have been studied, with uses in China. In [5], a data-driven online algorithm for voltage control issues has been handled with an interior point solution and recursive kernel regression. In order to accomplish security and cost-effective operation, a cluster of energy hubs in an event-triggered distributed energy management system has been described in [6].
In power systems, active power needs to be backed up by reactive power to meet the needs of the power system [7]. The power transfer capability of the transmission line is growing as the energy demand grows [8]. In addition, distorting or sensitive loads in power networks are accountable for power quality problems such as low power factor, voltage fluctuations, harmonics, and high reactive power demand [9]. Meeting reactive power demand has been a great concern. The majority of distribution system reactive power demands may be supplied by deploying flexible resources based on grid-connected inverters. Flexible AC transmission devices (FACTS) play an important role among reactive compensation devices in increasing the available transfer capability of the transmission line and in regulating the reactive power flow in the power system, which affects the fluctuations and stability of the system voltage [7,8]. One of the most popular FACTs in modern power systems is the static synchronous compensator (STATCOM), which is essentially a shunt compensator. The STATCOM has a number of applications for power system management and control. A photovoltaic inverter acting as a FACT known as PV-STATCOM performs the functions of a STATCOM controller, including voltage regulation, PF improvement, current harmonic suppression, and reactive power compensation. To enhance the power quality during the day and night, it preserves the DC capacitor voltage stable and consistently injects or absorbs active, reactive power into the proposed system at the point of common connection. Additionally, it can be utilized to balance power fluctuations in the proposed grid-connected system by performing charging and discharging operations. The technical, financial, and environmental advantages of PV-STATCOM can be maximized with proper allocation and sizing. Furthermore, effective allocation and sizing can enhance power system dependability and quality, minimize capital and operating costs, and lessen the negative environmental consequences of centralized power generation.
The literature has examined DG siting and sizing in distribution networks from several perspectives. Many studies have targeted different planning scenarios [1,2]. However, optimization models of DG planning are always solved using mathematical approaches and intelligence search strategies. Due to optimization model complexity and non-convexity, mathematical approaches are better at finding global optimum solutions [9]. Intelligence search strategies are simple to implement and typically competent in solving complex optimization models. However, they are time-consuming and sometimes provide local optimal solutions instead of global optimal solutions. Utilized in [1,2,3,7,8,9,10,11,12], they include the differential evolution (DE) algorithm, artificial rabbits algorithm (ARA), golden search optimizer (GSO), genetic algorithm (GA), non-dominated sorting genetic algorithm (NSGA), particle swarm optimization (PSO), genetic algorithm–particle swarm optimization hybrid algorithm (GA–PSO), honey bee mating optimization (HBMO), and ant colony optimization (ACO). Recently, Reference [12] developed a novel hunter–prey optimization (HPO) strategy, an efficient population-based method. The HPO approach is motivated by predatory animal behavior as well as prey species. Animal hunting behavior can take many forms, some of which have been optimized through combinatorial methods. In place of the hypothetical situation that is utilized by the other methods, the HPO method makes use of a unique model instead. Most research on optimal DG location and sizing in distribution networks treats PV as a pure active power source. Only a few pieces of literature [13,14] have addressed PV reactive output in steady-state voltage profiles. With the new trending technology in PVSTATCOM [15], PV reactive power production is fast and responsive, which greatly influences voltage recovery efficiency under voltage sag or post-fault circumstances [16]. Thus, PV-rapid STATCOM’s reaction is crucial to DGs’ appropriate siting and sizing.
A PV-STATCOM is a solar system that includes a STATCOM and is employed to regulate the voltage of an electrical distribution network that comprises solar power sources [17]. The PV inverters can execute that function throughout the night when there is no real power production by the PV modules. The voltage at the point of common coupling (PCC) is controlled by the reactive power delivered by STATCOM [18]. Voltage control is used over the day to greatly improve the system’s performance [19]. To increase transient stability, the PV-STATCOM systems were adopted as voltage controls combined with supplementary damping controllers [20]. The findings show that PV-STATCOMs are appropriate, and they greatly raise the stably transmitted power limits [7]. PV-STATCOM, or the use of PV systems such as STATCOM, was developed to improve power transfer capacities throughout the day and night [21,22]. In [21], transient overvoltage’s and steady-state voltages were regulated via PV-STATCOM in a real-world distribution system. PV-STATCOMs were used in [22] to improve the operation of distribution networks wherein voltage regulation under essential operational demands may be supplied. In that investigation, STATCOM was controlled by triggering a smart PV inverter to support a dynamically reactive power compensation.
In [23], a unique artificial rabbits’ algorithm (ARA) influenced by wild rabbit survival tactics was designed to simultaneously reduce energy losses and voltage profile. Although the study in [23] indicates considerable benefits in terms of lowering energy power losses and improving voltage profiles, it ignores investigating the impact of the number of installed PV-STATCOMs on distribution system performance. In general, the PV-STATCOM may substantially aid in suitable incorporation in order to solve a variety of issues in power systems [24]. Furthermore, PV-STATCOM’s rapid reactive power management focuses on improving the dynamical performance of the IEEE 33-bus distribution network in terms of voltage recovery processes during post-fault circumstances or voltage sag [2]. Moreover, considering the grid-connected mode of operation under abnormal grid situations, Reference [25] investigated the PV-STATCOM for providing low voltage ride-through capacity and increasing power quality with an active and reactive injection of powers to boost the whole system’s voltages.
There has been significant advancement at the level of optimization algorithms, particularly in the efficient use of these techniques in electricity distribution networks. In order to reduce power loss and enhance the current and voltage profile in distribution networks, a biologically influenced immune method for DSTATCOM has been developed [26]. The optimum capacitor location issue in a radial delivery structure has been suggested in [27] and solved using a flower pollination method that simulates the pollination procedure of flowers. Moreover, a mixed fuzzy technique and flower pollination method have been used [28] to reconfigure the distribution network in order to improve the performance of the radial distribution feeders. In order to reduce the total yearly costs and the overall network losses, particle swarm optimization has been used to handle the photovoltaic storage segment planning issue [29]. In [30], an intelligent supply-demand algorithm was implemented to identify the unknown parameters of the storage system.
Recently, a novel hunter-prey optimization (HPO) has been proposed by Iraj Naruei et al. in [12], which is a population-based efficient algorithm. HPO draws inspiration from the behavior of prey species, such as stag and gazelle, as well as predator creatures, such as lions, leopards, and wolves. There are several possibilities for how animals could behave during hunting, and a number of them have been developed into combinatorial optimization [10]. In contrast to the scenario employed by the other methods, a unique model is utilized in HPO. A predator strikes a victim that travels far from their group in the suggested approach, which involves prey and predator populations. The hunter positions himself closer to this distant prey, and the animal positions himself farther away from danger. The search agent’s station, which had the highest fitness value, was thought to be a secure location. Given the distinctive characteristics of HPO, this paper’s focus is on the optimal allocation of PV-STATCOM for energy loss minimization in distribution systems. The suggested HPO is used to minimize daily energy losses, and the daily voltage profile when varied 24 h loadings are considered. Its applicability is demonstrated using typical IEEE 33-node and 69-node distribution networks. The following are the important contributions of the paper:
- A revolutionary HPO for PV-STATCOM allocation in distribution networks has been developed.
- The goal function and restrictions have considered daily energy losses and voltage profiles for various 24 h loadings.
- The impacts of varying the number of installed PV-STATCOM devices are investigated in distribution systems.
- The suggested HPO is more effective than the differential evolution (DE) algorithm, PSO, ARA, and golden search optimizer (GSO) [11] in minimizing energy losses and voltage profile variances while maintaining all operational requirements.
The following are the next portions of the paper. Section 2 emphasizes the presented form of the PV-STATCOM allocation problem in distribution feeders, whereas Section 3 demonstrates the proposed framework of the innovative HPO. Furthermore, Section 4 elaborates on the simulation findings of the created HPO in solving the presented formulated problem considering two IEEE distribution feeders, while Section 5 develops on the work’s concluding remarks.
2. PV-STATCOM Allocation Problem in Distribution Feeders
The minimizing of the daily voltage variations and energy losses must be considered when allocating PV-STATCOM in distribution feeders. As in Equation (1), both goals are addressed in a single objective form (F) to be minimized.
where, Nb indicates the number of nodes; Vk refers to the voltage value at every distribution bus (k); NLine regards the number of distribution lines in the system; ILine refers to the current flow in every line (Line); RLine symbolizes the resistance of every line (Line).
From Equation (1), the presented model is concerned with the 24 h loading variations per day where the first term handles the voltage deviation minimization, and the second term addresses the energy losses. Furthermore, the voltages at each distribution node and the current flow across each distribution branch must be kept within acceptable limits at all hours, as shown below [31]:
where Vk,min and Vk,max are the minimum and upper bounds of the voltage nodes, giving a 5% allowable range; ILine,max represents the distribution branch’s thermal capacity.
The real component of the inverter current governs the DC voltage in the PV-STATCOM devices for voltage regulation at the PCC, which might be provided by PV modules during real or reactive power injections. The PV-STATCOM’s capacity to input active power throughout the day, as well as its simultaneous potential to inject/absorb reactive power through the day and night, is considered in this study. The overall balance restrictions are adjusted every hour in an effort to incorporate the PV-STATCOM system into the electrical distribution network. As a result, the active and reactive power balancing constraints may be modeled as follows:
where, PSub and QSub are, respectively, the overall active and reactive power provided by the substation; PPVSj and QPVSj are, respectively, the actual and reactive power injected via PV-STATCOM that is placed at node (j); NPVS indicates the total number of PV-STATCOM units established in the feeder; Pdi and Qdi are, respectively, actual and reactive power consumption at node (i); Plosses and Qlosses are, respectively, the real and reactive system losses; hr denotes each hour of the day’s horizon.
In that regard, the PV-STATCOM’s capacity to concurrently consume and inject reactive power throughout the daytime and night and its ability to supply active power throughout the day is considered. As a result, the actual and reactive power injections from PV-STATCOM to be placed at node (j) must be kept within the permissible bounds as follows:
where, PPVS,max and QPVS,max are, respectively, the overall active and reactive power of the candidate size.
Furthermore, the penetration limitation (Kp) of PV renewable DERs resources must be addressed not to exceed 60% of the overall active power requirement in the feeder, as shown in [32]:
In order to effectively handle the inequality constraints of Equations (2), (3), and (8), the objective function illustrated in Equation (1) should be modified to higher values by adding some penalty terms for the violations in one or more of these constraints too as follows:
where, KA, KB, KC, and KD represent penalty factors with extremely high values.
3. Proposed HPO for PV-STATCOM Allocation in Distribution Systems
In the proposed HPO, prey usually swarms when a hunter goes in search of it; as a result, the hunter chooses prey that is located far away from the swarm. Once the hunter has located its target, he chases and attacks it. The prey searches for food while also fleeing a predator threat and finding a safe refuge. This safe area is considered the best prey location based on a fitness function.
The initial population could be generated at random, , and all population representatives could subsequently be used to determine the objective function . The population in the search area is regulated and divided using a number of rules and strategies that were motivated by the suggested algorithm.
The suggested algorithm’s rules are applied for each iteration to update each population member’s location, which is then evaluated by the fitness function. The solutions grow finer as the process is continued. Each member of the starting population is assigned, based on Equation (15), to a random location inside the search area, while Equation (16) represents the bottom and upper limits of the search area.
where Hi refers to the position of the hunter or prey, lb and ub indicate the lower and upper limits of the considered variables, rand(1,d) is randomized dimensional numbers that are followed by uniformly distributed functions within the range [0,1], and d regards their whole number.
Following the generation of the original population and the determination of each agent’s location, the fitness of each solution member is assessed . The search mechanism is based on two major foundations of exploration and exploitation. The algorithm’s propensity for very chaotic behaviors, which frequently result in solutions changing, is described in exploration. The search space is thus investigated to determine its very promising parts in light of the significant variances in the solutions. After potential locations have been found, the operation of exploitation involves minimizing random behaviors in order for the algorithm to view around and within the promising areas. Equation (17) allows for the updating of the hunter location for the hunter searching technique:
where H(t) and H(t + 1) denote the hunter’s previous and current positions, respectively, Z denotes an adaptive quantity, Ppos depicts the prey position, and µ specifies the mean of all positions as depicted in Equation (18):
where Pz depicts a randomized vector comprising numbers between 0 and 1 that is comparable to the number of the decision variables, R1 and R3 represent arbitrary vectors with numbers in the [0,1] range, and R2 represents a randomized integer within the same range. IDT also represents the index numbers of the vector R1 that satisfies the condition (Pz = 0). C shows the balancing parameter between exploitation and exploration, and its value decreases from 1 to 0.02 throughout the course of repetitions. The following mathematical formulation of this parameter C is possible:
where t and MaxIt stand for the maximum and current iteration rates, correspondingly.
In order to first compute the mean of all positions (µ) in accordance with Equation (20), the prey position (Ppos) is determined.
The distance is determined using the Euclidean distance formula as shown in Equation (21):
The maximum distance from the positions’ mean of the search agent is considered as prey (Ppos) as illustrated in Equation (22):
When the hunter captures the prey in accordance with the hunting case, the prey dies, and the hunter subsequently searches for a different prey. To solve this problem, a diminishing mechanism is taken into account, as shown in Equation (23):
Therefore, the prey position may be determined using Equation (22) and adjusted to yield Equation (24):
The value of Kbest at the beginning of the algorithm is equal to N. Therefore, the final search agent, which is furthest away from the average location of the group (μ), is chosen as prey and assaulted by the hunter. At the conclusion of the process, the Kbest value equals the first search agent (the search agent that is situated the closest to the average position of the search agents (μ)). It should be emphasized that each iteration’s ranking of the search agents is based on their distance from their average position (μ). Prey tries to flee and find a safe place after being attacked. Since it gives the prey a chance of surviving, the most secure posture is thought to determine the ideal global position, whereas the hunter would choose substitute prey. As shown in Equation (25), the prey location could be changed as follows:
where Xpos is the global best solution with the minimum fitness value; R4 is a randomized number with a value between [−1,1]. The cosine function and its input parameters enable the positioning of the forthcoming prey at various globally optimized radials and angles. Consequently, the effectiveness of the exploiting developmental stage can be enhanced. Based on the above, Equations (17) and (25) are used in HPO to choose the hunter and prey, as seen in the following Equation:
where β designates a regulated parameter, where 0.1 is set as its value, an arbitrary number is represented by the symbol (R5), and its value is between [0,1]. If R5 is smaller than β, the search agent becomes a hunting predator, and as a result, its following position is modified, as shown in the first row in Equation (12). Nevertheless, if R5 is more than β, the search agent will fall victim, and as a result, the search agent’s position is adjusted, as shown in the second row in Equation (12). In Figure 1, the HPO’s flowchart is shown.
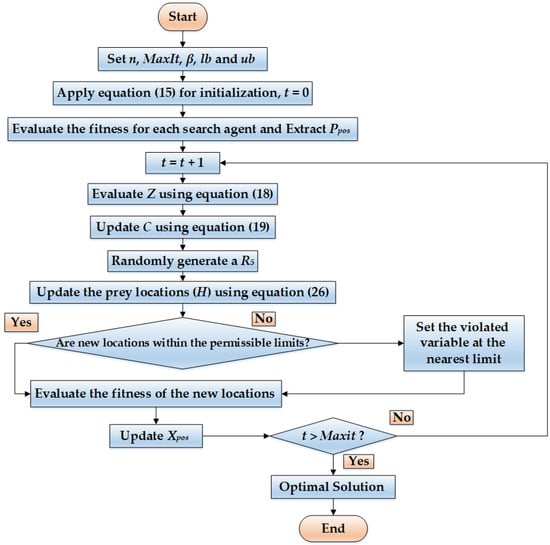
Figure 1.
Main steps of the proposed HPO.
4. Simulation Results
The proposed HPO is validated on IEEE 33-node and 69-node distribution feeders. The first feeder includes 33 nodes and 32 distribution lines. Figure 2 depicts the related system one-line schematic with a typical voltage of 12.66 kV. The total active (MW), reactive (MVAr), and apparent loads (MVA) for the nominal loading state are, respectively, 3.715, 2.3, and 4.369 [33]. The second feeder includes 69 nodes and 68 distribution lines. Figure 3 depicts the regarding networked one-line graph with a typical voltage of 12.66 kV. The total system loads are 3.802 MW and 2.694 MVAr, respectively [34]. The maximum reactive power limit of PV-STATCOM is ±1000 kVAr.
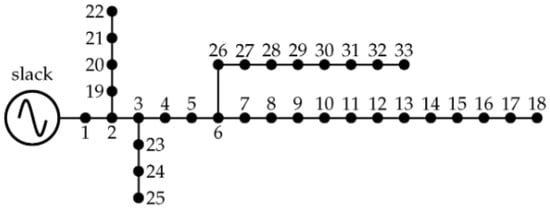
Figure 2.
IEEE 33-distribution system.
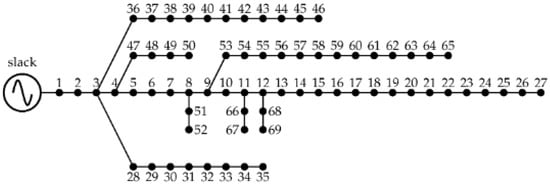
Figure 3.
IEEE 69-distribution system.
During the simulations, every load’s power factor remains constant, and the distribution nodes are supposed to have the same loading curve, as shown in Figure 4.
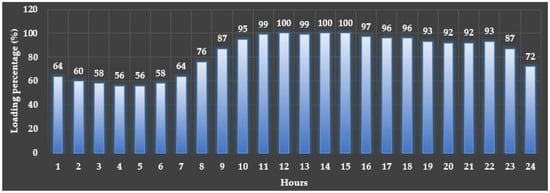
Figure 4.
Loading profile per hour as a percent of the nominal condition [35].
4.1. IEEE 33-Distribution Feeder
4.1.1. Comparative Assessment of PV-STATCOM Allocations in IEEE 33-Distribution Feeder
The suggested HPO is used in contrast to ARA, PSO, GSO, and DE for PV-STATCOM allocation on the first examined feeder to reduce energy losses and voltage deviation compromise. The total number of PV-STATCOM units is limited to three. Table 1 shows the outcomes of the HPO, ARA, PSO, GSO, and DE for PV-STATCOM allocation. This table displays the PV-STATCOM allocations where their installed buses acquired by the proposed HPO are 11, 26, and 30, and their associated PV sizes are 840, 767, and 844 kW, respectively, and their corresponding STATCOM sizes are the same as ±1000 kVAr at the three locations. From this table, the proposed HPO achieves the least compromise of the energy losses and voltage deviations by reducing it from 10,505.6 to 1534.093 with an improvement percentage of 85.39%. In the second rank, the ARA achieves 1643.77, DE comes third with 2132.16, and GSO comes fourthly with 2387.5. PSO presents the worst objective with 2909.081. Figure 5 shows their relevant convergence characteristics. As shown, the proposed HPO derives excellent convergence characteristics compared to all other applied algorithms in obtaining the least compromise of energy losses and voltage deviations. The proposed HPO shows a faster approach to the lower objective values very early at the first 20% of the iterations.

Table 1.
PV-STATCOM allocations for IEEE 33-distribution feeder.
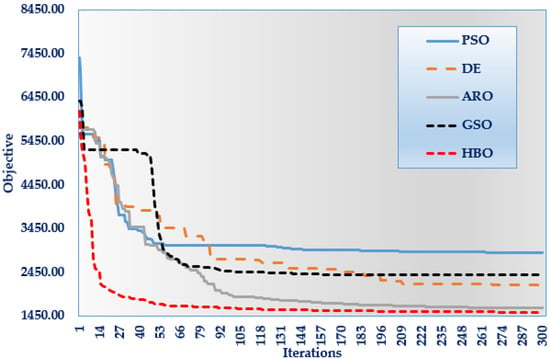
Figure 5.
Convergence properties of the applied algorithms for IEEE 33-distribution feeder.
Comparing the two best algorithms of HPO and ARA, their related hourly power losses are depicted versus the initial case in Figure 6. As can be seen, the proposed HPO shows a great reduction in power losses at all hours compared to the initial case. The energy losses are considerably decreased from 3557.25 kW/day to 1513.697 kW/day by 57.77% using the HPO compared to the initial case. The proposed HPO shows a significant reduction in power losses at most hours compared to ARA. The energy losses are decreased from 1623.56 kW/day to 1513.697 kW/day by 6.67% using the HPO compared to ARA. Additionally, the related hourly voltage deviations of HPO compared to ARA and the initial case are depicted in Figure 7. Both ARA and HPO obtain very close benefits of 20.21 and 20.38 PU/day, respectively. As shown, the voltage deviations are considerably decreased from 35.643 PU/day to 20.21 PU/day by 42.37% using the HPO compared to the initial case.
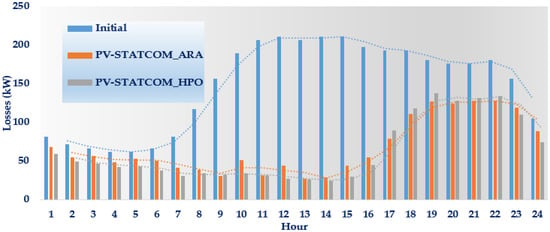
Figure 6.
Hourly power losses based on the proposed HPO and ARA versus the initial case for IEEE 33-distribution feeder.
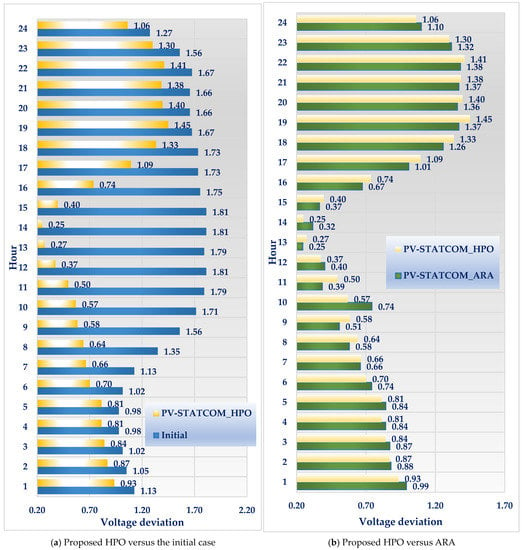
Figure 7.
Hourly voltage deviations based on the proposed HPO versus the initial case (a) and ARA (b) for IEEE 33-distribution feeder.
4.1.2. Impacts of Varying the Number of Installed PV-STATCOM Devices in IEEE 33-Distribution Feeder
The impacts of varying the number of installed PV-STATCOM devices are investigated in distribution systems. The proposed HPO is applied considering one, two, three, and four devices installation, and the regarding locations, sizes, and benefits are tabulated in Table 2. In this regard, Figure 8 shows the convergence properties of HPO with varying the number of installed devices for the IEEE 33-distribution feeder. As shown, the considered objective is reduced from 10,505.6 to 4424.035, 1549.66, 1534.093, and 1520.24, respectively considering one, two, three, and four PV-STATCOM devices installation.

Table 2.
PV-STATCOM allocations with varying the number of installed devices for IEEE 33-distribution feeder.
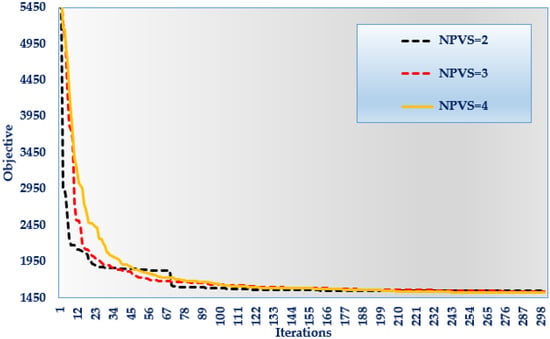
Figure 8.
Convergence properties of HPO with varying the number of installed devices for IEEE 33-distribution feeder.
Based on these varying numbers of PV-STATCOM devices installation, Figure 9 and Figure 10 describe the hourly power losses and voltage deviations. These figures illustrate the beneficial achievements in reducing the losses and voltage deviations for each loading hour with the increased number of PV-STATCOM devices installed. It can also be noticed that two, three, or four PV-STATCOM devices provide approximated benefits. On the other side, one PV-STATCOM is insufficient to achieve the operational constraints, and therefore, the related objective is considerably high. To show that, Figure 11 depicts the hourly minimum voltage with varying the number of installed devices. As shown, the minimum voltage, in the case of considering one PV-STATCOM device, causes undervoltage through the hours 9:23, whereas it improves the minimum voltage all over the day. On the contrary, considering two, three, and four PV-STATCOM devices, the minimum voltage is improved throughout the day and successfully exceeds the lowest threshold.
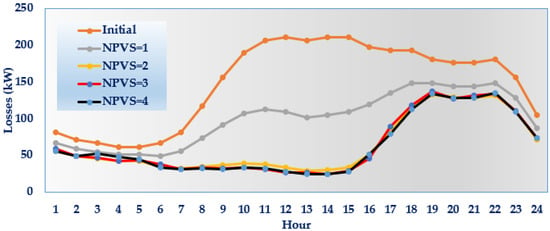
Figure 9.
Hourly power losses with varying the number of installed devices compared to the initial case for IEEE 33-feeder.
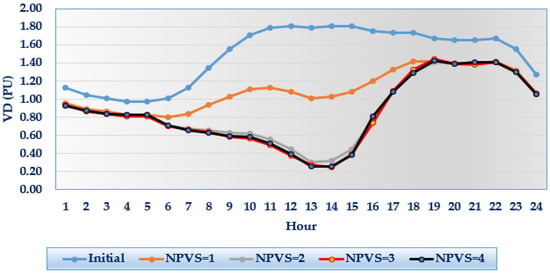
Figure 10.
Hourly voltage deviations with varying the number of installed devices compared to the initial case for IEEE 33-feeder.
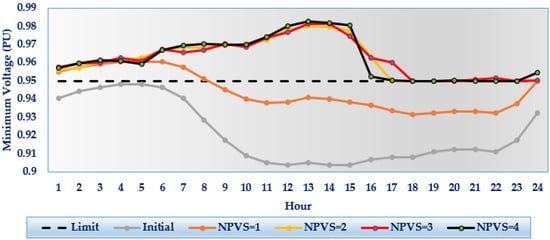
Figure 11.
Hourly minimum voltage with varying the number of installed devices compared to the initial case for IEEE 33-feeder.
4.2. IEEE 69-Distribution Feeder
4.2.1. Comparative Assessment of PV-STATCOM Allocations in IEEE 69-Distribution Feeder
In contrast to ARA, PSO, GSO, and DE, the proposed HPO is employed for PV-STATCOM allocation on the second studied feeder to decrease energy losses and voltage deviation compromise. There are only three PV-STATCOM devices available. The results of the HPO, ARA, PSO, GSO, and DE for PV-STATCOM allocation are shown in Table 3. Similar results are produced where this table illustrates the PV-STATCOM allocations when the projected HPO’s installed buses are 61, 62, and 63, and their related PV sizes are 1000, 1000, and 508 kW, respectively, and their corresponding STATCOM sizes are the same of ±1000 kVAr at the three sites. According to this data, the proposed HPO achieves the least compromise of energy losses and voltage variations by lowering it from 3821.42 to 1616.61 with a 57.7% improvement. The ARA is ranked second with 1622.93, DE is third with 1814.4, and GSO is fourth with 1952.97. With 2416.34, PSO has the poorest objective. Figure 12 also depicts their key convergence features. As demonstrated, the suggested HPO outperforms all previously used algorithms to get the least amount of energy loss and voltage variation. The suggested HPO approaches the lower objective values more quickly in the first 20% of iterations.

Table 3.
PV-STATCOM allocations for IEEE 69-distribution feeder.
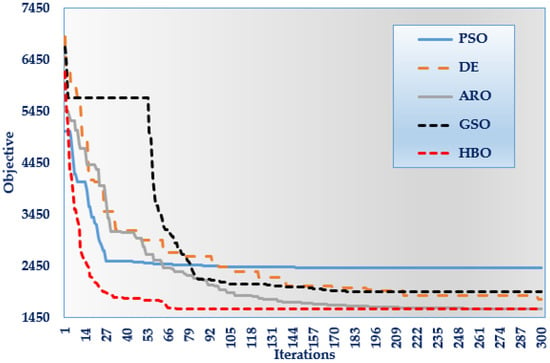
Figure 12.
Convergence properties of the applied algorithms for IEEE 69-distribution feeder.
4.2.2. Impacts of Varying the Number of Installed PV-STATCOMs in IEEE 69-Distribution Feeder
In addition, the effects of altering the number of installed PV-STATCOM devices are investigated in the second distribution feeder. The proposed HPO is used when installing one, two, three, or four devices, and the corresponding positions, sizes, and advantages are reported in Table 4. In this context, Figure 13 depicts the convergence features of HPO when the number of installed devices for an IEEE 33-distribution feeder is varied. As indicated, the considered target is lowered from 3821.416 to 2882.764, 1642.25, 1616.61, and 1609.65 when one, two, three, and four PV-STATCOM devices are installed, respectively.

Table 4.
PV-STATCOM allocations with varying the number of installed devices for IEEE 69-distribution feeder.
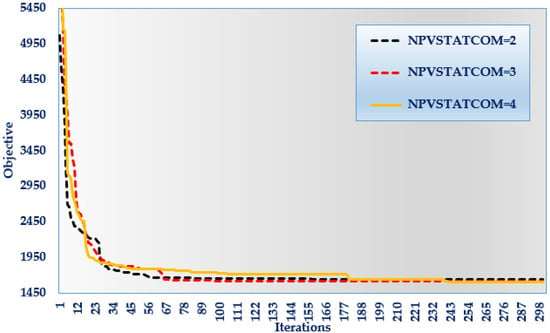
Figure 13.
Convergence properties of HPO with varying the number of installed devices for IEEE 69-distribution feeder.
Figure 14 and Figure 15 show the hourly power losses and voltage variations. These statistics show the benefits of increasing the number of PV-STATCOM devices installed in lowering losses and voltage variations for each loading hour. It is also worth noting that two, three, or four PV-STATCOM devices give equivalent advantages. On the other hand, one PV-STATCOM is inadequate to meet the operational constraints; hence, the related goal is significantly higher. Figure 16 displays the hourly minimum voltage as the number of installed devices varies. As illustrated, in the instance of one PV-STATCOM device, the minimum voltage causes undervoltage during the hours 9:23, whereas it improves the minimum voltage throughout the day.
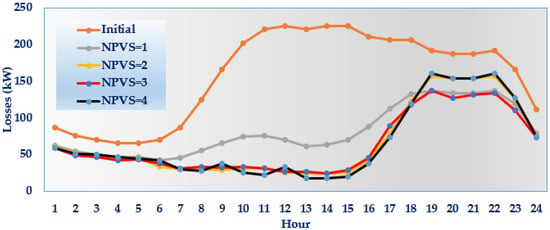
Figure 14.
Hourly power losses with varying the number of installed devices compared to the initial case for IEEE 69-feeder.
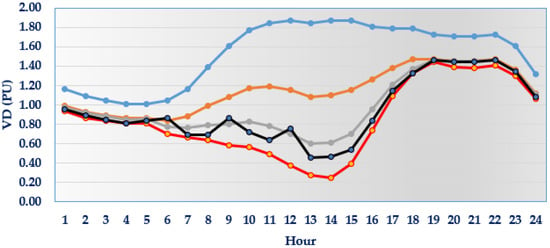
Figure 15.
Hourly voltage deviations with varying the number of installed devices compared to the initial case for IEEE 69-feeder.
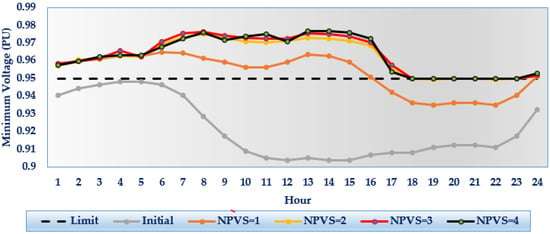
Figure 16.
Hourly minimum voltage with varying the number of installed devices compared to the initial case for IEEE 69-feeder.
5. Conclusions
This paper introduces hunter-prey optimization (HPO) for effective photovoltaic-static synchronous compensators (PV-STATCOM) device allocation in distribution feeders to improve its performance. The suggested solution to the PV-STATCOM device allocation problem in distribution networks is designed to reduce electrical energy losses by improving voltage profile while accounting for changing 24 h loadings. In distribution feeders, the effects of altering the number of installed PV-STATCOM devices are also investigated. It has been tested on two IEEE distribution networks of 33 and 69 nodes. Based on the simulation results, we concluded the following:
- The suggested HPO outperforms the differential evolution (DE) method, particle swarm optimization (PSO), artificial rabbits algorithm (ARA), and golden search optimizer (GSO) in assigning PV-STATCOM devices in distribution systems, decreasing energy losses and voltage profile variations while meeting all operational criteria.
- Considering converging characteristics, the proposed HPO delivers quicker convergence than DE, PSO, ARA, and GSO since it can approach the least objective values faster in the first 20% of iterations.
- Furthermore, for both distribution feeders under consideration, one PV-STATCOM unit is insufficient to fulfill all requirements throughout the day due to considerable levels of operational constraint violation.
As future research, different points can be further investigated, including PV-STATCOM devices allocation in distribution feeders, such as the impacts of inserting other ancillary services, automatic reconfiguration capability, distribution custom devices, automatic voltage regulators, and other advanced technologies.
Author Contributions
Conceptualization, A.M.S., A.G.; Methodology, A.M.S.; Software, A.M.S.; Validation, A.M.S.; Formal analysis, R.A.E.-S., A.M.E., S.F.A.-G.; Investigation, R.A.E.-S., A.M.E.; Data curation, R.A.E.-S.; Writing—original draft, R.A.E.-S., A.G., S.F.A.-G.; Writing—review and editing, A.M.S., A.M.E.; Visualization, S.F.A.-G.; Supervision, A.G., S.F.A.-G. All authors have read and agreed to the published version of the manuscript.
Funding
This work was supported by the Deanship of Scientific Research at King Khalid University through General Research Project under grant number (RGP.1/425/44).
Institutional Review Board Statement
Not applicable.
Informed Consent Statement
Not applicable.
Data Availability Statement
Not applicable.
Conflicts of Interest
The authors declare no conflict of interest.
References
- Fernández, G.; Martínez, A.; Galán, N.; Ballestín-fuertes, J.; Muñoz-cruzado-alba, J.; López, P.; Stukelj, S.; Daridou, E.; Rezzonico, A.; Ioannidis, D. Optimal D-Statcom Placement Tool for Low Voltage Grids. Energies 2021, 14, 4212. [Google Scholar] [CrossRef]
- Luo, L.; Gu, W.; Zhang, X.P.; Cao, G.; Wang, W.; Zhu, G.; You, D.; Wu, Z. Optimal Siting and Sizing of Distributed Generation in Distribution Systems with PV Solar Farm Utilized as STATCOM (PV-STATCOM). Appl. Energy 2018, 210, 1092–1100. [Google Scholar] [CrossRef]
- Alves, Z.M.; Martins, R.M.; Marchesan, G.; Junior, G.C. Metaheuristic for the Allocation and Sizing of PV-STATCOMs for Ancillary Service Provision. Energies 2022, 16, 424. [Google Scholar] [CrossRef]
- Wu, W.; Li, P.; Wang, B.; Liu, Y.; Xu, T.; Du, H.; He, Y. Integrated Distribution Management System: Architecture, Functions, and Application in China. J. Mod. Power Syst. Clean Energy 2022, 10, 245–258. [Google Scholar] [CrossRef]
- Hong, T.; Zhang, Y. Data-Driven Optimization Framework for Voltage Regulation in Distribution Systems. IEEE Trans. Power Deliv. 2022, 37, 1344–1347. [Google Scholar] [CrossRef]
- Zhang, N.; Sun, Q.; Yang, L.; Li, Y. Event-Triggered Distributed Hybrid Control Scheme for the Integrated Energy System. IEEE Trans. Ind. Informatics 2022, 18, 835–846. [Google Scholar] [CrossRef]
- Sirjani, R. Optimal Placement and Sizing of PV-STATCOM in Power Systems Using Empirical Data and Adaptive Particle Swarm Optimization. Sustainability 2018, 10, 727. [Google Scholar] [CrossRef]
- Shriya, U.; Veena, S.H. Increasing Grid Power Transmission Using PV-STATCOM. In Proceedings of the 2021 6th International Conference for Convergence in Technology (I2CT), Maharashtra, India, 2–4 April 2021. [Google Scholar]
- Popavath, L.N.; Nagaraju, G.; Naresh, K. A PV-Statcom for Enhancement of Power Quality in Grid Integrated System Using Unit Vector Controller. In Proceedings of the 2020 International Conference on Artificial Intelligence and Signal Processing (AISP), Amaravati, India, 10–12 January 2020. [Google Scholar]
- Elshahed, M.; El-Rifaie, A.M.; Tolba, M.A.; Ginidi, A.; Shaheen, A.; Mohamed, S.A. An Innovative Hunter-Prey-Based Optimization for Electrically Based Single-, Double-, and Triple-Diode Models of Solar Photovoltaic Systems. Mathematics 2022, 10, 4625. [Google Scholar] [CrossRef]
- Noroozi, M.; Mohammadi, H.; Efatinasab, E.; Lashgari, A.; Eslami, M.; Khan, B. Golden Search Optimization Algorithm. IEEE Access 2022, 10, 37515–37532. [Google Scholar] [CrossRef]
- Naruei, I.; Keynia, F.; Molahosseini, A.S. Hunter-Prey Optimization: Algorithm and Applications. Soft Comput. 2022, 26, 1279–1314. [Google Scholar] [CrossRef]
- Zou, K.; Agalgaonkar, A.P.; Muttaqi, K.M.; Perera, S. Distribution System Planning with Incorporating DG Reactive Capability and System Uncertainties. IEEE Trans. Sustain. Energy 2012, 3, 112–123. [Google Scholar] [CrossRef]
- AlKaabi, S.S.; Khadkikar, V.; Zeineldin, H.H. Incorporating PV Inverter Control Schemes for Planning Active Distribution Networks. IEEE Trans. Sustain. Energy 2015, 6, 1224–1233. [Google Scholar] [CrossRef]
- Varma, R.K.; Rahman, S.A.; Vanderheide, T. New Control of PV Solar Farm as STATCOM (PV-STATCOM) for Increasing Grid Power Transmission Limits during Night and Day. IEEE Trans. Power Deliv. 2015, 30, 755–763. [Google Scholar] [CrossRef]
- Milanović, J.V.; Zhang, Y. Modeling of FACTS Devices for Voltage Sag Mitigation Studies in Large Power Systems. IEEE Trans. Power Deliv. 2010, 25, 3044–3052. [Google Scholar] [CrossRef]
- Varma, R.K.; Khadkikar, V.; Seethapathy, R. Nighttime Application of PV Solar Farm as STATCOM to Regulate Grid Voltage. IEEE Trans. Energy Convers. 2009, 24, 983–985. [Google Scholar] [CrossRef]
- Gasperic, S.; Mihalic, R. Estimation of the Efficiency of FACTS Devices for Voltage-Stability Enhancement with PV Area Criteria. Renew. Sustain. Energy Rev. 2019, 105, 144–156. [Google Scholar] [CrossRef]
- Varma, R.K.; Das, B.; Axente, I.; Vanderheide, T. Optimal 24-Hr Utilization of a PV Solar System as STATCOM (PV-STATCOM) in a Distribution Network. In Proceedings of the IEEE Power and Energy Society General Meeting, Detroit, MI, USA, 24–28 July 2011. [Google Scholar]
- Sadiq, R.; Wang, Z.; Chung, C.Y.; Zhou, C.; Wang, C. A Review of STATCOM Control for Stability Enhancement of Power Systems with Wind/PV Penetration: Existing Research and Future Scope. Int. Trans. Electr. Energy Syst. 2021, 31, e13079. [Google Scholar] [CrossRef]
- Varma, R.K.; Siavashi, E.M. Enhancement of Solar Farm Connectivity with Smart PV Inverter PV-STATCOM. IEEE Trans. Sustain. Energy 2019, 10, 1161–1171. [Google Scholar] [CrossRef]
- Varma, R.K.; Siavashi, E.M. PV-STATCOM: A New Smart Inverter for Voltage Control in Distribution Systems. IEEE Trans. Sustain. Energy 2018, 9, 1681–1691. [Google Scholar] [CrossRef]
- Elshahed, M.; Tolba, M.A.; El-Rifaie, A.M.; Ginidi, A.; Shaheen, A.; Mohamed, S.A. An Artificial Rabbits’ Optimization to Allocate PVSTATCOM for Ancillary Service Provision in Distribution Systems. Mathematics 2023, 11, 339. [Google Scholar] [CrossRef]
- Kumar, P.; Bohre, A.K. Optimal Allocation of Hybrid Solar-PV with STATCOM Based on Multi-Objective Functions Using Combined OPF-PSO Method. SSRN Electron. J. 2021. [Google Scholar] [CrossRef]
- Popavath, L.N.; Kaliannan, P. Photovoltaic-STATCOM with Low Voltage Ride through Strategy and Power Quality Enhancement in a Grid Integrated Wind-PV System. Electronics 2018, 7, 51. [Google Scholar] [CrossRef]
- Taher, S.A.; Afsari, S.A. Optimal Location and Sizing of DSTATCOM in Distribution Systems by Immune Algorithm. Int. J. Electr. Power Energy Syst. 2014, 60, 34–44. [Google Scholar] [CrossRef]
- Tamilselvan, V.; Jayabarathi, T.; Raghunathan, T.; Yang, X.S. Optimal Capacitor Placement in Radial Distribution Systems Using Flower Pollination Algorithm. Alex. Eng. J. 2018, 57, 2775–2786. [Google Scholar] [CrossRef]
- Mariaraja, P.; Manigandan, T.; Thiruvenkadam, S. An Expert System for Distribution System Reconfiguration through Fuzzy Logic and Flower Pollination Algorithm. Meas. Control. 2018, 51, 002029401879077. [Google Scholar] [CrossRef]
- Zhang, Y.; Yang, Y.; Zhang, X.; Pu, W.; Song, H. Planning Strategies for Distributed PV-Storage Using a Distribution Network Based on Load Time Sequence Characteristics Partitioning. Processes 2023, 11, 540. [Google Scholar] [CrossRef]
- El-Sehiemy, R.; Hamida, M.A.; Elattar, E.; Shaheen, A.; Ginidi, A. Nonlinear Dynamic Model for Parameter Estimation of Li-Ion Batteries Using Supply-Demand Algorithm. Energies 2022, 15, 4556. [Google Scholar] [CrossRef]
- Nasef, A.; Shaheen, A.; Khattab, H. Local and Remote Control of Automatic Voltage Regulators in Distribution Networks with Different Variations and Uncertainties: Practical Cases Study. Electr. Power Syst. Res. 2022, 205, 107773. [Google Scholar] [CrossRef]
- Shaheen, A.M.; Elsayed, A.M.; El-Sehiemy, R.A.; Kamel, S.; Ghoneim, S.S.M. A Modified Marine Predators Optimization Algorithm for Simultaneous Network Reconfiguration and Distributed Generator Allocation in Distribution Systems under Different Loading Conditions. Eng. Optim. 2021, 54, 687–708. [Google Scholar] [CrossRef]
- Shaheen, A.; El-Sehiemy, R.; Kamel, S.; Selim, A. Optimal Operational Reliability and Reconfiguration of Electrical Distribution Network Based on Jellyfish Search Algorithm. Energies 2022, 15, 6994. [Google Scholar] [CrossRef]
- Paz-Rodríguez, A.; Castro-Ordoñez, J.F.; Montoya, O.D.; Giral-Ramírez, D.A. Optimal Integration of Photovoltaic Sources in Distribution Networks for Daily Energy Losses Minimization Using the Vortex Search Algorithm. Appl. Sci. 2021, 11, 4418. [Google Scholar] [CrossRef]
- El-Ela, A.; El-Ela, A.A.A.; El-Sehiemy, R.A.; Allam, S.M.; Shaheen, A.M.; Nagem, N.A.; Sharaf, A.M. Renewable Energy Micro-Grid Interfacing: Economic and Environmental Issues. Electronics 2022, 11, 815. [Google Scholar] [CrossRef]
Disclaimer/Publisher’s Note: The statements, opinions and data contained in all publications are solely those of the individual author(s) and contributor(s) and not of MDPI and/or the editor(s). MDPI and/or the editor(s) disclaim responsibility for any injury to people or property resulting from any ideas, methods, instructions or products referred to in the content. |
© 2023 by the authors. Licensee MDPI, Basel, Switzerland. This article is an open access article distributed under the terms and conditions of the Creative Commons Attribution (CC BY) license (https://creativecommons.org/licenses/by/4.0/).