Abstract
The deposition of sulfur particles in gathering and transportation pipeline system can cause serious safety problems and economic losses. When the high sulfur content natural gas (HSCNG) flows through the throttle valve of the gathering and transportation system, it will cause the supersaturation of elemental sulfur in the gas phase, and then the sulfur crystal nuclei and sulfur particles will appear in the pipeline system. Studying the initial growth behavior of sulfur crystal nuclei and sulfur particles can lay a necessary prerequisite for the accurate prediction of sulfur particle deposition in high sulfur content natural gas gathering and transportation (HSCNGGT) pipelines. Based on the homogeneous nucleation theory in crystallization kinetics, a mathematical model of elemental sulfur nucleation was established. Taking the throttling condition in the process of HSCNGGT as an example, the effects of temperature, pressure and H2S concentration in HSCNG on the critical nucleation radius and nucleation rate of elemental sulfur were explored. The results show that: (1) after the supersaturation of elemental sulfur, sulfur crystal nuclei with nanoscale radius will be precipitated. The temperature and pressure after throttling have great influence on the nucleation radius, and the influence of H2S concentration on the nucleation radius is more complex. (2) The temperature, pressure and H2S concentration after throttling also have great influence on the nucleation rate. By solving the growth kinetics model of sulfur particles based on Brownian condensation, it is found that the nano-sized sulfur crystal nuclei can grow into micron-sized sulfur particles in a very short time.
1. Introduction
As the world’s energy structure continues to transition to low-carbon, more and more unconventional natural gas (such as HSCNG, shale gas, carbonate gas, etc.) are being developed and utilized [1,2]. The temperature and pressure of the pipeline have a very important impact on the exploitation and transportation of oil and natural gas [3,4]. In the HSCNGGT pipeline, when the gas passes through the throttling device, the temperature and pressure of the gas are significantly reduced, causing the concentration of elemental sulfur in the gas phase to exceed its saturated solubility in natural gas, and the sulfur molecules will be precipitated from the gas phase in the form of nuclei. Subsequently, the precipitated sulfur crystal nuclei will further condense and grow, and finally form sulfur particles in a macroscopic state. This stage can be regarded as the physical growth stage of sulfur particles. Studying the nucleation and growth law of sulfur particles in pipelines is a prerequisite for analyzing the elemental sulfur deposition in sulfur-containing natural gas gathering and transportation pipelines, which provides data support for the prediction of sulfur particles deposition in pipelines.
When the change of gathering pressure, temperature or composition causes the supersaturated dissolution of elemental sulfur, a thermodynamic driving force will appear. This driving force promotes the aggregation of elemental sulfur molecules originally in the gas phase. The aggregated sulfur molecular clusters will form an interface with the gas phase, and the generation of interfacial tension will prevent sulfur molecules from continuing to aggregate to a certain extent. When the thermodynamic driving force generated by supersaturated dissolution is greater than the interfacial tension, a new phase will be generated; that is, the gas phase sulfur molecules undergo a phase transition to form a solid phase sulfur crystal nucleus [5]. This process can be regarded as the formation of sulfur crystal nucleus.
At present, the description of crystal nucleation mainly includes classical nucleation theory [6,7], density functional theory [8,9], Monte Carlo method based on molecular simulation, molecular dynamics simulation and other methods [10,11]. Although density functional theory and molecular simulation have relatively high computational accuracy, they are computationally intensive and time-consuming [12]. The earlier nucleation was concerned with the nucleation of droplets in saturated vapors. Subsequently, Turnbull (1949) and Fisher (1949) proposed the classical liquid phase homogeneous nucleation theory and proposed the calculation model of nucleation rate [13]. After further derivation, the calculation model of homogeneous nucleation rate in gas phase can be obtained [14]. Zhu et al. (2011) explored the nucleation rate of elemental sulfur based on the classical nucleation theory [15].
Since the size of the initial precipitated sulfur crystal nuclei is often at the micro or nano scale, the corresponding number of nuclei is very large, and then thus collision and coagulation will inevitably occur quickly. The coagulation nuclei model of particles is usually very complex. It is representative that Fuchs et al. (1960) introduced a correction factor to describe the coagulation nuclei of particles in the transition zone based on the coagulation nuclei model in the continuous zone [16]. On this basis, Wright et al. (1960), Park et al. (1999) and Otto et al. (1999) also proposed their own models [17,18,19]. Smoluchowski (1918) first studied the particle collision kernel model under the condition of simple uniform shear laminar flow [20], and his research results show that the relative velocity of colliding or coalescing particles is directly proportional to the turbulent shear rate. Saffman and Turner et al. (1956) were the first to put forward an accurate model of turbulent coagulation nuclei model of fine particles based on the concept of colliding spheres [21]. Because Brownian motion and turbulent shear affect particle collision on different scales, the effects of the two can be regarded as independent [22].
Aiming at the coagulation process of sulfur crystal nucleus, Liu et al. (2013) established the governing equation of sulfur particle size change with time based on the Brownian collision coagulation theory, and solved the equation by moment method [23]. Zhu et al. (2011) used the Smoluchowski model to preliminarily calculate and analyze the agglomeration growth process after precipitation of sulfur crystal nuclei [15]. On the basis of Zhu’s model, Santos et al. (2015) further studied the influence of heavy fractions and operating temperature in tubes on nucleation rate, and the result showed that the higher the content of heavy fractions, the more conducive to homogeneous nucleation [24]. Meanwhile, it was found that the nucleation rate of solid sulfur molecules increased as the temperature decreased. With the development of computer computing power, the particle coagulation model has been built into commercial fluid computing software [25].
At present, based on the classical nucleation theory, scholars at home and abroad have conducted preliminary exploration on the nucleation and growth process of sulfur particles, and revealed the variation of the critical nucleation radius and nucleation rate of elemental sulfur as a function of temperature and pressure. On this basis, the relationship of precipitated sulfur crystal nucleus agglomeration growth and other related parameters with time was explored. However, there are few studies on the agglomeration and coagulation of sulfur particles after the throttle valve of the gathering and transportation pipeline. The emergence of solid particles in the pipeline system will have a serious impact on the safe operation of the pipeline, and it is necessary to investigate the growth process of solid sulfur particles in detail [26]. In this paper, the mathematical model of elemental sulfur nucleation is established based on the nucleation theory in crystallization kinetics for the initial stage of sulfur particle formation in the HSCNG transportation system. The effects of temperature, pressure and H2S concentration on the critical nucleation radius and nucleation rate of elemental sulfur under throttling conditions were studied. Then, according to the theory of solid particle growth dynamics, the growth dynamics model of sulfur particles was established, and the size change and distribution of sulfur particles during the evolution of sulfur particles to microscale were analyzed.
2. Modelling and Analysis
2.1. Model of Sulfur Particle Nucleation Mechanism
When elemental sulfur is supersaturated and dissolved in HSCNG, the gaseous sulfur will precipitate in the form of solid phase nuclei. According to the principle of crystallization dynamics, the formation of particles includes two stages: nucleation and growth, and nucleation includes homogeneous nucleation and heterogeneous nucleation [14]. Homogeneous nucleation refers to nucleation in a uniform parent phase; heterogeneous nucleation refers to the nucleation on the surface of crystalline solid phase existing in the parent phase. Since the generation of sulfur particles in the gathering and transportation system mainly comes from the throttling and depressurization process, in order to more accurately study the nucleation of elemental sulfur and its subsequent growth and development process, it is assumed that there is no solid phase elemental sulfur precipitation in the previous gathering and transportation pipeline. Therefore, the nucleation mode of gas phase elemental sulfur after supersaturation can be regarded as homogeneous nucleation in this paper. Based on the homogeneous nucleation theory of crystallization kinetics, a mathematical model of elemental sulfur nucleation is established in this paper. The effects of different gathering temperature, pressure and H2S concentration on critical nucleation radius and nucleation rate of elemental sulfur were studied.
2.1.1. Calculation Model of Critical Nucleation Radius of Elemental Sulfur
According to the principle of crystallization kinetics, in the nucleation process of elemental sulfur, the energy change caused by the formation of a single crystal nucleus can be expressed as:
- (1)
- The surface free energy can be expressed in Equation (2).
According to the classical nucleation theory, assuming that the interfacial tension is the same, then . At the same time, assuming that the shape of the formed sulfur crystal nucleus is spherical and its radius is r, then can be expressed as
where interfacial tension is calculated by the Equation (4) [27].
- (2)
- The free energy of volume can be expressed by Equation (5).
The negative value of this term is the necessary condition for nucleation of elemental sulfur. Since the model assumes that the sulfur crystal nucleus is spherical, Equation (5) can be rewritten as:
According to the derivation of in reference [28], can be expressed as:
where S is supersaturation, which is calculated by Equation (8).
Therefore, the volume free energy can be rewritten as:
To sum up, the total amount of energy change caused by nucleation can be expressed as:
For , the derivative of the nucleation radius r is obtained
When , the critical nucleation radius of elemental sulfur is obtained, as shown in Equation (12).
2.1.2. Calculation Model of Elemental Sulfur Nucleation Rate
The nucleation rate of elemental sulfur refers to the number of sulfur crystal nuclei produced per unit time and volume, expressed as In, as shown in Equation (13). Based on the homogeneous nucleation theory, it is assumed that elemental sulfur nucleates with a critical radius.
where is the pre-exponential factor, expressed in Equation (14) [24].
where and N can be calculated by Equations (15) and (16), respectively.
where is the elemental sulfur mole fraction precipitated by supersaturation.
2.2. Study on the Kinetic Model of Sulfur Particle Growth under Gathering and Transportation Conditions
In the process of sulfur deposition, the supersaturated precipitated elemental sulfur first forms a sulfur crystal nucleus. From the previous analysis, it can be seen that after the gas phase sulfur is supersaturated, the nanoscale sulfur crystal nucleus is formed first. According to the existing reference data, the minimum size of sulfur particles that can be deposited in the pipeline is at least micron scale [28,29,30]. This means that the formed sulfur crystal nuclei cannot be deposited on the inner wall of the pipeline immediately. Instead, after further collision, coagulation and growth of sulfur crystal nuclei, sulfur particles will be deposited in the pipeline after the particle size meets certain deposition conditions. The size of the particles is different, and the main factors causing coagulation are also different. In view of the situation faced in this paper, the size of sulfur crystal nuclei precipitated at the beginning is often very small, and reach the nanometer level. During the migration of sulfur particles following the airflow in the gathering and transportation pipeline, they may further agglomeration and coagulation under turbulent shear.
Before establishing the kinetic growth model of sulfur crystal nucleus, the following basic assumptions are made:
- (1)
- Since the size of the precipitated sulfur crystal nuclei is nanoscale, it is assumed that the coagulation of sulfur crystal nuclei is dominated by Brown coagulation [21];
- (2)
- Once the sulfur crystal nucleus collides, coagulation occurs, which is regarded as a sulfur particle in the calculation;
- (3)
- The shape of the sulfur particles after the coagulation of the two sulfur particles is still spherical.
2.2.1. Kinetic Growth Model of Sulfur Particles
Müller et al. (1928) derived the transport equation of polydisperse particles based on Smoluchowski’s transport equation for monodisperse particles, as shown in Equation (17) [31]. This equation can also be used as the governing equation for the growth size of sulfur particles with time.
where is the distribution of particle concentration, and represents the number of sulfur particles with a volume of v at time t; is Brownian nucleation, representing the collision frequency function of two sulfur particles of the same or different size; the first integral on the right of Equation (17) represents the process of collision between particles of volume and particles of volume to generate particles of volume v, because the repeated count is twice, the coefficient is multiplied by 1/2; the second integral is the process by which a particle of volume v collides with other particles, resulting in volume loss.
2.2.2. Sulfur Particle Coagulation Nuclear Model
The coagulation nuclear in Equation (17) does not have a fixed expression, but is divided into four zones according to a different Knudsen number (Kn), and different zones have their specific calculation formulas:
- (1)
- Continuous zone, , using Equation (18) to calculate the coagulation nuclei [19];
- (2)
- Slip zone () and the transition zone (), are expressed by Equation (19).where is the Cunningham slip correction coefficient for sulfur particles, the expression is:where ;
- (3)
- Free molecular zone, , calculated by Equation (21) [18].
In the above formulas, the Kn number is calculated by Equation (22).
where, is calculated by Equation (23).
- (4)
- Calculation of collision coefficient
In addition, in Equations (18)–(20), K is the collision coefficient and is calculated by Equation (24).
Reference [29] evaluated the applicability of eight commonly used viscosity calculation methods to the viscosity calculation of HSCNG, and the results show that the Dempsey model combined with the standing correction method had the minimum prediction error. This method is also used to calculate the viscosity of HSCNG.
- (1)
- Dempsey viscosity prediction model
This method is mainly obtained by fitting the chart drawn by Carr et al. (1992), and calculated according to Equation (25) [32].
where Tr is the comparative temperature of the mixed gas; Pr is the comparative pressure of mixed gas; is the viscosity of gas under one atmospheric pressure and a certain temperature, calculated by Equation (26) and are constant coefficients, obtained by fitting type curves, Table 1 lists the values.

Table 1.
The value of constant parameter expression in gas viscosity calculation.
- (2)
- Standing non-hydrocarbon correction method
In order to improve the prediction accuracy of the model, a standing non-hydrocarbon correction for Dempsey’s viscosity prediction model was proposed. In other words, the influence of three non-hydrocarbon gases—H2S, CO2 and N2—is considered in the calculation of . The correction formula is Equation (27).
where , and are the corrected viscosity of H2S, CO2 and N2, and the unit is m . They are represented by Equations (28)–(30).
2.3. Solution of Sulfur Particle Growth Kinetics Model Based on Moment Method
In order to understand the variation of sulfur particle size with time, it is generally required to solve the governing Equation (17) of particle growth size change, that is, to find the specific expression of n in the equation. Because Equation (17) contains three unknowns and two integrals, it is difficult to solve directly. In this paper, the moment method is used to solve the problem.
According to the research of Chaterjee et al. (1975), the particle size obeys the lognormal distribution law during the growth and change of particles; that is, Equation (31) is valid [33]. It is assumed that the coagulation growth of sulfur crystal nuclei in this paper also conforms to this basic law.
where is the geometric standard deviation obtained based on particle size. In this way, the specific expression of n in Equation (17) can also be converted into the solution of the three key parameters N, and in Equation (31).
Since the initial sulfur crystal nucleus may be in both the slip zone and the continuous zone, the particle size distribution equation in these two cases will be solved separately.
- (1)
- The solution of the particle growth kinetic model occurs when sulfur particles are in continuous zone
According to the definition of the moment method, moment of order k can be expressed as Equation (32).
Combining Equations (17) and (32), it can be deduced that the change of momentum in the coagulation process is shown in Equation (33).
At this time, the sulfur crystal nucleus is in a continuous zone, and Equation (18) is substituted into Equation (33), as follows:
When , is the number of sulfur particles in unit space, and the variation of the number of sulfur particles with time can be obtained according to Equation (34), as shown in Equation (35), where and is the total number of particles at time t.
When , since represents the total volume of sulfur particles in unit space, there is:
When , there is:
According to the natural of the lognormal distribution, the following relation holds:
where is the geometric standard deviation, set , then Equation (38) can be written as:
Substituting Equation (39) into Equations (35) and (37) can obtain:
Considering that the variation of geometric standard deviation is much smaller than that of N and vg, the integral of Equation (40) is obtained:
where is the dimensionless. Equation (43) is the relationship between the number of sulfur particles and the dimensionless time as the sulfur crystal nucleus coagulation process occurs. In addition, the following relationships are established:
Taking the derivative of Equation (39), with k = 1, 2, can obtain:
Combining Equations (40), (41), (47) and (48), can obtain:
Divide both ends of the Equation (47) by N to obtain:
Substitute Equation (50) into Equation (49) and obtain:
Integrate both ends of Equation (51) and obtain:
Solve Z according to Equation (52) and obtain:
According to Equation (39), when , and according to the law of mass conservation, the following relationship is established:
Substitute Equation (53) into Equation (54) and obtain:
To sum up, when the sulfur crystal nucleus is in the continuous zone, the size variation of sulfur particles can be calculated by Equations (43), (53) and (55).
- (2)
- Solution of particle size distribution equation for sulfur crystal nuclei occurs in the slip zone
When the sulfur crystal nucleus is in the slip zone, the coagulation nucleus is calculated by Equation (19), substituting Equation (19) into Equation (33) to obtain:
When k is equal to 0, 1, 2 the following can be obtained:
Substituting Equation (39) into Equations (57) and (59) can obtain:
During the growth of sulfur particles, the change of is much smaller than that of N and ; in addition, according to the conservation of mass, when , Equation (60) transforms into:
where p and q are respectively expressed as Equation (63) and formula:
Integrate both ends of Equation (62) to obtain:
where .
Combining Equations (47), (48), (60) and (61) obtains:
where Q is represented by the following formula:
Substituting Equation (50) into Equation (67) obtains:
In Equation (69), Q is regarded as a constant, and the two ends of the equation are integrated to obtain:
From Equation (70), obtain:
According to the conservation of mass, when there is:
Substituting Equation (71) into Equation (72) obtains:
To sum up, the total number of sulfur particles, the geometric mean deviation and the variation of sulfur particle size during the growth of sulfur particles in the slip zone can be calculated by the Equations (66), (71) and (73).
3. Results and Discussion
3.1. Case Introduction of Elemental Sulfur Nucleation Process
The pressure drop before and after the throttle valve is large, which can easily cause gas phase elemental sulfur supersaturation. This paper studied the effects of gathering pressure, temperature and H2S concentration on the critical nucleation radius and nucleation rate of elemental sulfur. Based on the actual situation of HSCNG field engineering in China, it is assumed that the pressure before throttling of a gathering and transportation pipeline is 12.0 MPa, and the temperature is 318.15 K. The components mainly contain H2S, CO2 and CH4, and the molar content of each component is shown in Table 2. According to the requirements of pipeline transportation, the temperature range after throttling is 273.15–308.15 K; the pressure range is 3–9 MPa.
Table 2.
The components of HSCNG mixture.
3.2. Analysis of Influencing Factors on the Critical Nucleation Radius of Elemental Sulfur
3.2.1. Influence of Gathering Pressure and Temperature on the Critical Nucleation Radius of Elemental Sulfur
Gas 2 and gas 3 in Table 3 are selected as the objects to analyze the relationship between critical nucleation radius of gas elemental sulfur and post-throttling pressure and temperature. As shown in Figure 1a,b, the critical nucleation radius of elemental sulfur decreases with the increase in temperature after throttling.
Table 3.
Calculation results of critical nucleation radius of elemental sulfur in gas 2.
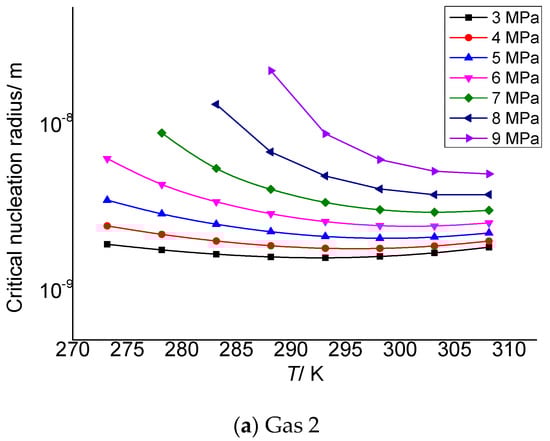
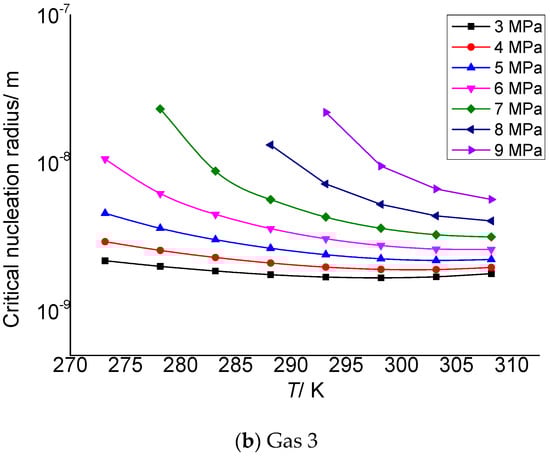
Figure 1.
Curve of critical nucleation radius changing with the temperature.
The critical nucleation radius of elemental sulfur can be considered to be affected by two effects. One is the temperature. The higher the temperature after throttling, the stronger the molecular kinetic energy, which is not conducive to the formation of sulfur crystal nuclei with larger particle size. The second is supersaturation. The larger the supersaturation is, the more the solid phase sulfur molecules are precipitated, which is theoretically beneficial to the formation of sulfur crystal nuclei with larger particle size. Combined with the calculation results in the third section, it can be seen that when the temperature is smaller, the total solubility of elemental sulfur is larger, and the corresponding supersaturation is smaller. However, the lower temperature is beneficial to the nucleation of gas phase sulfur molecules. Under the combined action of the two, supersaturation plays a dominant role. Therefore, as shown in the figure, the critical nucleation radius of elemental sulfur gradually decreases with the increase in temperature.
Figure 2 is the relationship between the critical nucleation radius of elemental sulfur and the pressure after throttling. It can be seen that the critical nucleation radius gradually increases with the increase in the pressure after throttling. In addition, under the same conditions, the smaller the temperature after throttling, the larger the critical nucleation radius, and the greater the increase in the critical radius with the increase in pressure. One reason is that the lower the temperature, the more conducive to the aggregation of solid sulfur and the more conducive to nucleation. The second reason is that the higher the pressure, the greater the intermolecular density, the greater the chance of collision between solid sulfur molecules and the more favorable for nucleation, so the critical radius of sulfur crystal nucleus increases with the increase in pressure. Although the smaller the pressure after throttling, the greater the supersaturation, its effect on nucleation is weak.
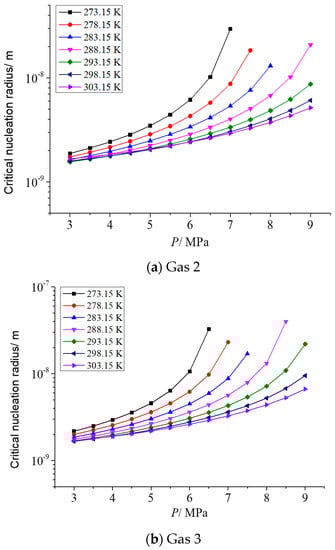
Figure 2.
Curve of critical nucleation radius changing with pressure.
Table 3 and Table 4 are the calculation results of the critical radius of sulfur crystal nuclei formed by supersaturated precipitation of the elemental sulfur due to pressure and temperature changes in gas 2 and gas 3. The molar contents of H2S, CO2 and CH4 in gas 2 in Table 3 are 2%, 5% and 93%, respectively, and the critical nucleation radius varies from 1.88 to 20.8 nm. In Table 4, the molar contents of H2S, CO2 and CH4 are 5%, 5% and 90%, respectively, and the critical nucleation radius varies from 2.18 to 23.10 nm. The data show that the initial size of the sulfur crystal nucleus is in the nanometer scale range, which is similar to the calculation results in the reference [30], indicating that the calculation results in this paper are reliable.
Table 4.
Calculation results of critical nucleation radius of elemental sulfur in gas 3.
3.2.2. Effect of H2S Concentration on the Critical Nucleation Radius of Elemental Sulfur
As describe in the previous section, the gas phase fraction of H2S has a more significant effect on the solubility of elemental sulfur in gases than other gas phase components. Therefore, it is necessary to analyze the influence of different H2S gas fractions on the critical radius of sulfur crystal nuclei. Two representative post-throttle temperatures and post-throttle pressures were selected to analyze the variation in the critical nucleation radius of elemental sulfur with H2S concentration. Figure 3a–d is the relationship between the critical nucleation radius and the concentration of H2S in the gas under the conditions of 278.15 K and 293.15 K after throttling and 3 MPa and 6 MPa after throttling, respectively. The molar content of H2S ranges from 0.5% to 20%. It can be seen that, in general, with the increase in gas phase H2S concentration, the critical nucleation radius increases first and then basically remains unchanged. Combined with the calculation results in our previous research [34], this is because when the H2S content in the gas is low, the variation of the solubility of elemental sulfur and the solubility of elemental sulfur is relatively small, so the number of solid sulfur molecules precipitated is small, eventually leading to a correspondingly smaller critical nucleation radius. With the increase in H2S content, the solubility of elemental sulfur and the variation of elemental sulfur solubility gradually increase, which leads to the increase in the number of solid sulfur molecules precipitated, and finally leads to the corresponding increase in the critical nucleation radius. It can also be seen that when the H2S content in the gas is close to 20%, the critical nucleation radius decreases slightly with the increase in H2S content in the gas. This is because when H2S content increases to a certain extent, the variation of elemental sulfur solubility before and after throttling is smaller than that at low concentration, and the supersaturation has a slight decreasing trend. Therefore, when the H2S content in the gas is high, the critical nucleation radius has a slight downward trend.
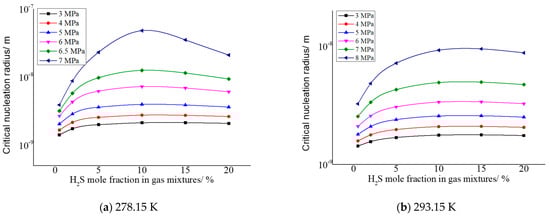
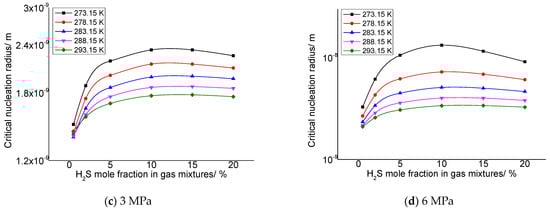
Figure 3.
The variation curve of critical nucleation radius with H2S concentration.
3.3. Analysis of Influencing Factors on the Nucleation Rate of Sulfur Crystal Nuclei
3.3.1. Analysis of the Influence of Pressure and Temperature on the Nucleation Rate after Throttling
As described in Section 2.1.2, when the elemental sulfur is supersaturated and dissolved, the model assumes that elemental sulfur first forms a sulfur crystal nucleus at a critical radius. This section mainly analyzes the relationship between the formation rate of sulfur crystal nuclei and the temperature after throttling, the pressure after throttling and the mole fraction of H2S in the gas. Gas 2 and gas 3 in Table 2 are also selected for analysis.
Table 5 and Table 6 show the calculation results of elemental sulfur nucleation rates in gas 2 and gas 3, respectively. It can be seen that the nucleation rate of elemental sulfur varies from 6.10 × 10²⁰ to 7.54 × 10²¹ (m−3·s−1). It shows that once the sulfur crystal nucleus is precipitated by a throttling condition, a large number of sulfur crystal nucleus can be formed in a short time.
Table 5.
Calculation results of elemental sulfur nucleation rate in gas 2.
Table 6.
Calculation results of elemental sulfur nucleation rate in gas 3.
Figure 4a,b show the temperature variation curves of elemental sulfur nucleation rate in gas 2 and gas 3, respectively. As shown in Figure 4a, when the pressure after throttling is less than 5 MPa, the nucleation rate gradually decreases with the increase in temperature. When it exceeds 6 MPa, the nucleation rate increases first and then decreases with the increase in temperature. In Figure 4b, the nucleation rate shows the same trend. The difference is that because the concentration H2S in gas 3 is higher than in gas 2, the nucleation rate first increases and then decreases, a trend that appears at lower pressure conditions. Since the temperature and pressure before throttling are certain, as the temperature after throttling increases, the total amount of elemental sulfur precipitated will gradually decrease, and the nucleation rate will decrease accordingly. When the pressure is high, the nucleation radius will gradually decrease with the increase in temperature, and the nucleation rate will increase first.
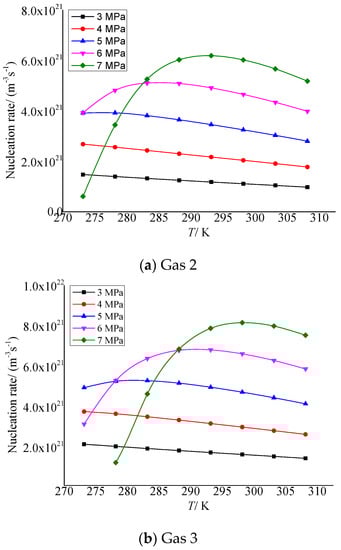
Figure 4.
Curve of nucleation rate with temperature.
Figure 5a,b show the variation of elemental sulfur nucleation rate in gas 2 and gas 3 with the pressure after throttling, respectively. It can be seen that with the increase in pressure after throttling, the nucleation rate increases first and then decreases. The lower the temperature after throttling, the smaller the maximum nucleation rate and the corresponding pressure. This is because when the pressure gradually increases from 3 MPa after throttling, firstly, the distance between sulfur molecules precipitated decreases due to the increase in pressure, which is conducive to the formation of sulfur crystal nuclei. As the pressure further increases, the intermolecular repulsion dominates and begins to inhibit the nucleation of sulfur molecules.
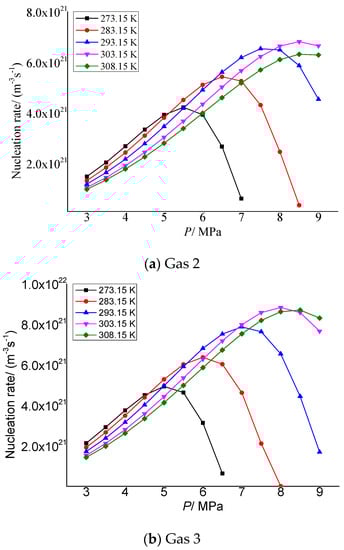
Figure 5.
Curve of nucleation rate with pressure.
3.3.2. Analysis of the Influence of H2S Content on Nucleation Rate
As shown in Figure 6, the critical nucleation rate increases with the increase in H2S concentration in the gas in general. In addition, it can be seen from the figure that the nucleation rate is relatively larger when the pressure after throttling is higher and the temperature after throttling is lower. This is mainly due to the increase in solubility of elemental sulfur caused by the increase in H2S concentration, and the absolute value of the solubility change of elemental sulfur in the gas phase will also increase before and after throttling; that is, the amount of elemental sulfur precipitation increases. This results in an increase in the rate of nucleation of sulfur crystal nuclei.
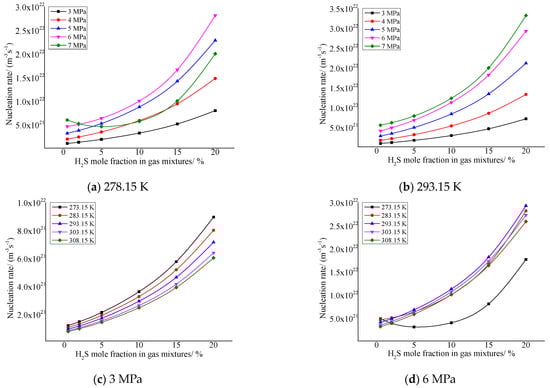
Figure 6.
Curve of nucleation rate with concentration of H2S.
The change trends of the green curve in Figure 6a and the black curve in Figure 6d are slightly different from other curves. The main reason is that the higher pressure after throttling causes an increase in the intermolecular repulsive force of sulfur precipitated, so that the nucleation rate decreases with the increase in H2S concentration in the gas phase.
3.4. Case Study of Sulfur Particle Growth Process
Taking the throttling condition of gathering and transportation pipelines as the background, gas 3 (H2S:CO2:CH4 = 5:5:90) in Table 2 was taken as the representative for analysis. The temperature before throttling is 318.15 K, and the pressure before throttling is 12 MPa. The temperature after throttling is 288.15 K, and the pressure after throttling is 6 MPa.
When the gas phase elemental sulfur in the HSCNGGT pipeline is supersaturated, the elemental sulfur precipitated by supersaturated will rapidly form a large number of sulfur crystal nuclei. According to the calculation results of elemental sulfur nucleation, the formed sulfur crystal nucleus is nano-scale solid sulfur particles. According to previous research conclusions, the sulfur particles with sulfur deposition are micron-scale solid particles [28,29,30]. Therefore, it is necessary to analyze the coagulation and growth process of nano-scale sulfur crystal nuclei to micro-scale sulfur particles. The growth and evolution process of initial sulfur nuclei is studied, so as to continuously reveal the intrinsic nature of sulfur deposition in the gathering and transportation pipeline and further deepen the understanding of the mechanism of sulfur deposition of sulfur particles in gathering and transportation pipeline.
3.5. Variation of Basic Parameters during the Growth of Sulfur Particles
Figure 7 shows the variation curve of the total number of dimensionless sulfur particles with dimensionless time. It can be seen that the total number of dimensionless sulfur particles gradually decreases with the increase in dimensionless time during the nucleation and growth of sulfur crystal nuclei. Since the initial solid particles are sulfur crystal nuclei, it shows that the number of sulfur crystal nuclei decreases with the increase in time under the action of Brownian coagulation. This is because two or more sulfur crystal nuclei are coagulated by collision to form a larger sulfur particle. Therefore, the total number of sulfur particles is decreasing.
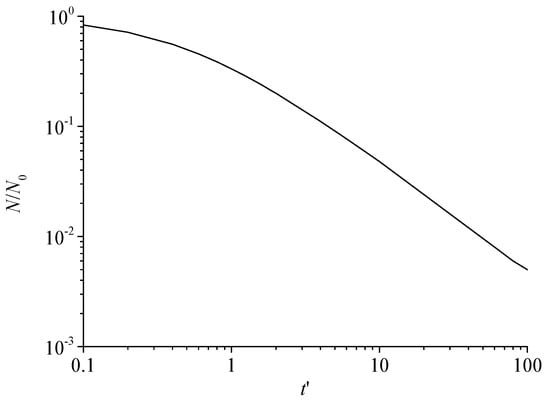
Figure 7.
The total number of dimensionless sulfur particles varies with dimensionless time.
Figure 8 shows the variation curve of the geometric mean volume of dimensionless sulfur particles with dimensionless time. With the continuous coagulation and coalescence of sulfur crystal nuclei, the geometric volume of sulfur particles increases gradually.
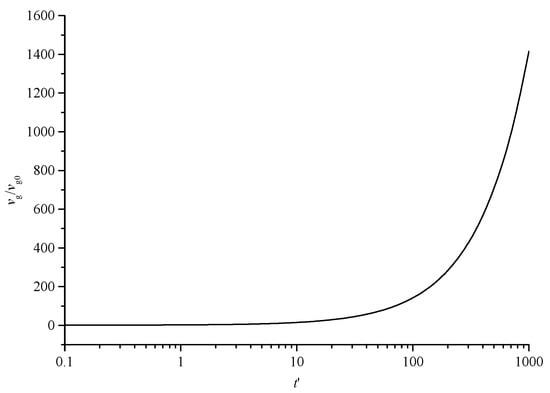
Figure 8.
The geometric mean volume curve of dimensionless sulfur particles with dimensionless time.
Figure 9 shows the variation curve of the geometric standard deviation changing with dimensionless time. The geometric standard deviation represents the degree of dispersion of sulfur particles of different sizes. It can be seen that with the increase in dimensionless time, the geometric standard deviation first shows a gradual increase trend. This is because in the initial stage, most of the sulfur particles are sulfur crystal nuclei with uniform size. With the increase in time, the sulfur crystal nuclei continue to coagulate and coalesce to form sulfur particles of different sizes, gradually increasing the geometric standard deviation. The final geometric standard deviation of the final trend is a certain value, indicating that the dispersion degree of sulfur particles has reached the maximum.
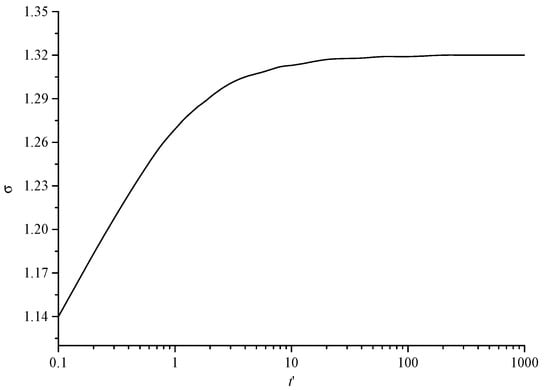
Figure 9.
The variation curve of geometric standard deviation with dimensionless time.
3.6. Analysis of Influencing Factors of Sulfur Particle Growth Process
3.6.1. Analysis of the Influence of Pressure on the Growth Process of Sulfur Particles
Figure 10 shows the influence of pressure after throttling on the total number of dimensionless particles. The symbols of different colors in the figure represent the change rule of the total number of sulfur particles at different times after the coagulation of sulfur crystal nuclei. It can be seen that with the gradual increase in pressure after throttling, the number of sulfur particles decreases first and then increases. With the passage of sulfur crystal nucleus or sulfur particle coagulation time, this trend is increased. According to the influence of pressure on nucleation rate, the nucleation rate increases first and then decreases with the increase in pressure after throttling. When the nucleation rate is smaller, that is, the number of initial sulfur crystal nuclei formed in unit time and space is less, the chance and probability of coagulation are relatively small. Therefore, the total number of sulfur particles at the same time is slightly larger than the initial sulfur crystal nuclei. This variation trend is opposite to the effect law of pressure on sulfur crystal nucleus after throttling.
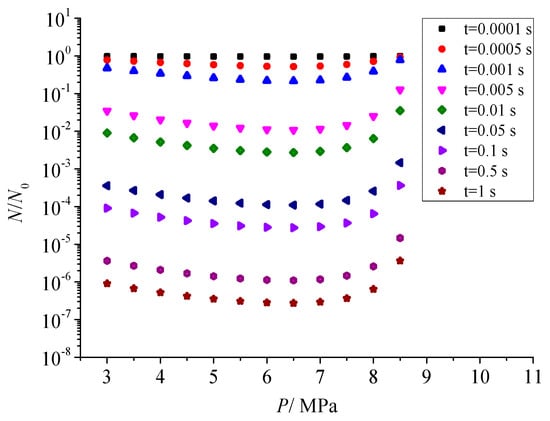
Figure 10.
Effect of pressure on the total number of dimensionless particles.
Figure 11 shows the influence of different pressure after throttling on geometric standard deviation. As shown in the figure, when the coagulation time does not exceed 0.001s, as the pressure after throttling gradually increases, the geometric standard deviation increases first and then decreases. The geometric standard deviation represents the dispersion degree of sulfur particles. In the early stage of coagulation, a serious of sulfur particles with different sizes are formed with the coagulation of sulfur crystal nuclei and the continuous combination of sulfur particles. The more the initial number of sulfur crystal nuclei, the larger the dispersion degree of sulfur particles at different scales at the initial coagulation stage, and the larger the corresponding geometric standard deviation. Therefore, the variation trend of geometric standard deviation with the pressure after throttling is consistent with the variation trend of the nucleation rate with the pressure after throttling. However, as the sulfur particle coagulation time goes on, the geometric standard deviation of the dispersion degree of sulfur particle size finally remains constant, and its value is 1.320. It shows that the dispersion degree of sulfur particles with different sizes will remain unchanged with the advance of coagulation process.
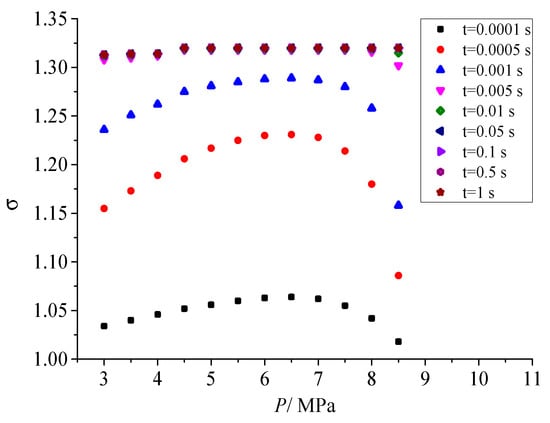
Figure 11.
Effect of pressure on geometric standard deviation.
Figure 12 shows the effect of pressure after throttling on the geometric volume of sulfur particles. There is a close relationship between the geometric volume of sulfur particles and the number of initial sulfur crystal nuclei. With the increase in pressure after throttling, the geometric volume increases first and then decreases. According to the curve of nucleation rate with the increase in pressure, the nucleation rate increases first and then decreases with the increase in pressure. The larger the nucleation rate, the more the total number of sulfur crystal nuclei, and the more likely it is to coagulate at the same time. Therefore, the geometric volume of sulfur particles also shows the same trend as the nucleation rate with the pressure after throttling.
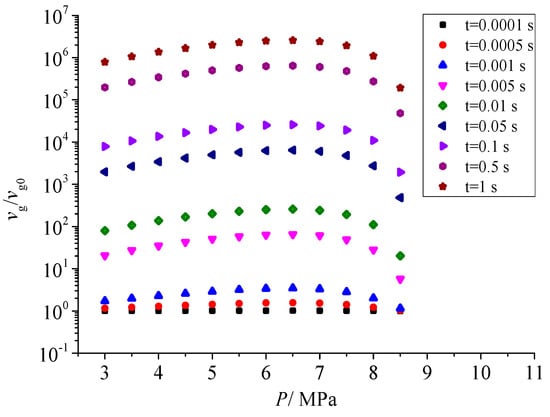
Figure 12.
Effect of pressure on dimensionless geometric volume.
3.6.2. Analysis of the Influence of Temperature on the Growth Process of Sulfur Particles
Figure 13 shows the effect of temperature on the total number of dimensionless sulfur particles after throttling. It can be seen that the effect of pressure after throttling on the dimensionless total number of sulfur particles is consistent. With the increase in temperature after throttling, the total number of dimensionless particles of sulfur particles also decreases first and then increases. However, with the increase in temperature after throttling, the nucleation rate of sulfur crystal nuclei is relatively small, so the total number of dimensionless particles does not change significantly with temperature.
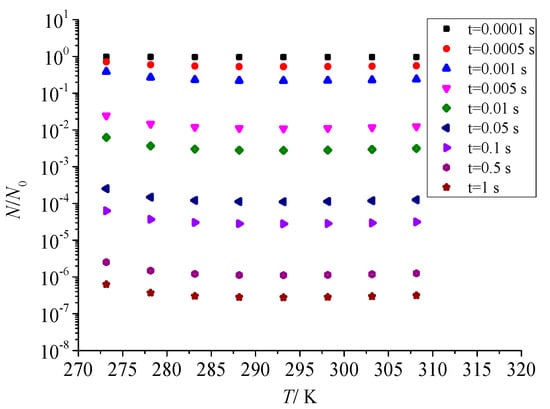
Figure 13.
Effect of temperature on the total number of dimensionless particles.
Figure 14 shows the influence law of temperature after throttling on geometric standard deviation in the coagulation process of sulfur crystal nuclei. It can be seen that in the early stage of nucleation, with the increase in temperature after throttling, the geometric standard deviation increases first and then decreases to a small extent. This is consistent with the effect of temperature on nucleation rate after throttling. However, as the sulfur particle coagulation time goes on, the geometric standard deviation of the dispersion degree of sulfur particle size finally remains constant, and its value is also 1.320. The results show that the dispersion degree of sulfur particle size will eventually remain unchanged as the coagulation process.
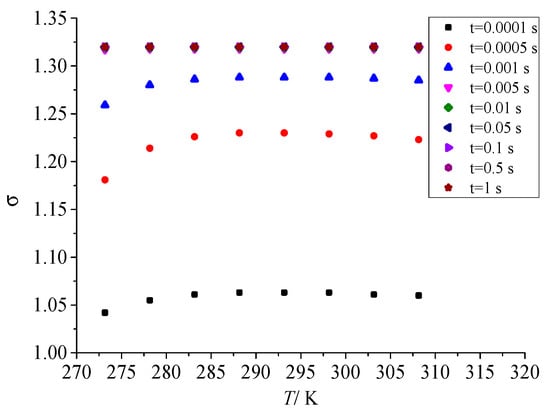
Figure 14.
Effect of temperature on geometric standard deviation.
Figure 15 shows the effect of temperature on the geometric volume of sulfur particles after throttling. With the increase in temperature after throttling, the nucleation rate of sulfur crystal nucleus increases accordingly. The larger the number of critical sulfur crystal nuclei, the larger the geometric volume of sulfur particles. Therefore, the effect of temperature after throttling on the nucleation rate of sulfur crystal nuclei is consistent with the effect of temperature after throttling on the geometric volume.
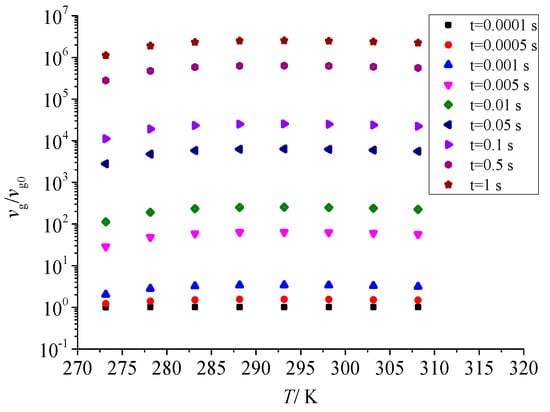
Figure 15.
Effect of temperature on dimensionless geometric volume.
3.6.3. Analysis of Influence of H2S Concentration on the Growth Process of Sulfur Particles
Figure 16 shows the effect of H2S concentration in the gas mixture on the total number of dimensionless sulfur particles in the coagulation process of sulfur crystal nucleation. It can be seen that with the increase in H2S concentration in the gas mixture, the total number of dimensionless particles of sulfur particles decreases. This is because the nucleation rate of sulfur crystal nuclei increases with the increase in H2S concentration.
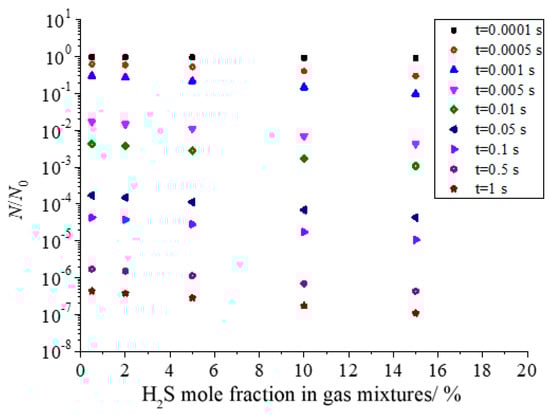
Figure 16.
Effect of H2S concentration on the total number of dimensionless particles.
Figure 17 shows the effect of H2S concentration on the geometric standard deviation during the growth of sulfur particles. It can be seen from the figure that the geometric standard deviation increases with the increase in H2S concentration in the initial stage of sulfur crystal nucleation. In the initial stage of sulfur crystal nucleation, the more the number of sulfur crystal nuclei, the greater the probability of coagulation. At the same time, the larger number of initial sulfur crystal nucleation is favorable to the coagulation of sulfur particles. Therefore, it is easier to form a series of different sizes of sulfur particles, resulting in a larger geometric standard deviation. Similarly, when the geometric standard deviation is constant at 1.320 after a period of coagulation, the dispersion degree of sulfur particles will reach a stable state.
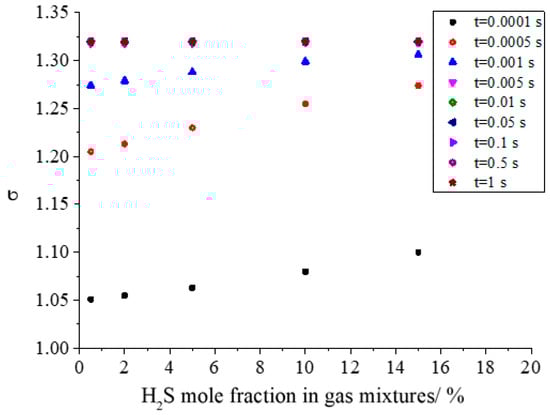
Figure 17.
Effect of H2S concentration on geometric standard deviation.
Figure 18 shows the effect of H2S concentration on the dimensionless geometric volume of sulfur particles. As shown in the figure, the dimensionless volume increases with the increase in H2S concentration. Under the same conditions, the larger the concentration of H2S is, the more initial sulfur crystal nuclei are produced, and the geometric volume of sulfur particles after coagulation should be larger. This is consistent with the actual situation.
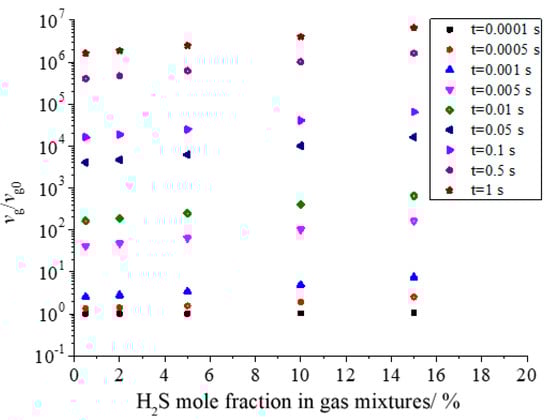
Figure 18.
Effect of H2S concentration on dimensionless geometric volume.
3.7. The Variation of Particle Size Distribution with the Time during the Growth of Sulfur Particles
3.7.1. Sulfur Particle Size Distribution at Different Times (nv/N0)
Figure 19 shows the relationship between the size distribution of sulfur particles and the actual time within a period of time after the coagulation of sulfur crystal nuclei. The abscissa dp in the figure represents the diameter of the sulfur particles. The ordinate nv/N0 represents the ratio of the number of sulfur particles with a diameter dp to the number of initial sulfur particles N0. Figure 19a–h represent the change of sulfur particle size within 0.0001 s to 0.5 s after the coagulation sulfur crystal nucleation. The calculation example is mainly aimed at the law of coagulation and growth of the part of the sulfur crystal nucleus precipitated after throttling with time, without considering the influence of the sulfur crystal nucleus continuously precipitated in the pipeline on the coagulation and growth of the previous sulfur crystal nucleus.
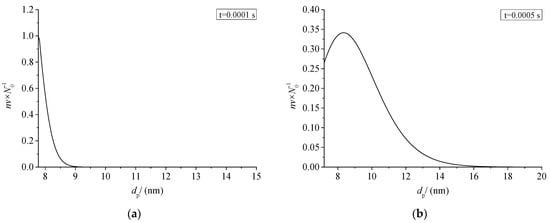
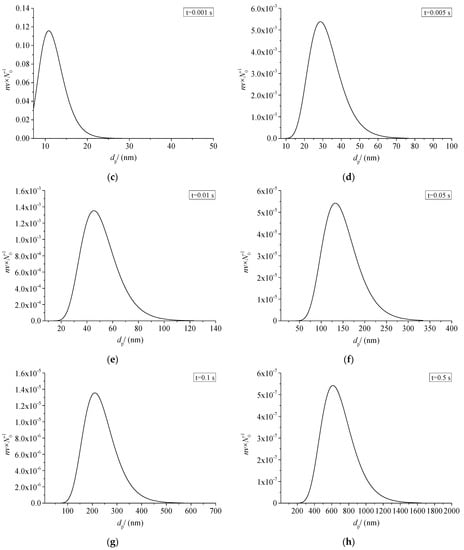
Figure 19.
Sulfur particle size distribution at different time (nv/N0).
From the change of ordinate, the maximum value of nv/N0 decreases gradually with the passage of particle coagulation time, indicating that the number of sulfur particles of different sizes decreases with the passage of time. From the change of the abscissa value range, the minimum value of the abscissa in the figure is the diameter of the critical crystal nucleus, and the maximum value keeps increasing, indicating that more and more sulfur particles with a larger particle size appear. The shape of the whole normal distribution curve is unchanged, and the whole curve shifts toward the larger particle size. As shown in Figure 19a–c, when the coagulation time of sulfur crystal nuclei is less than 0.001 s, the size distribution curve of sulfur particles is not complete. This is because the initial particles of coagulation are sulfur particles with critical nuclei, and at this time the sulfur particles can only grow gradually. According to the characteristics of Brownian coagulation with normal distribution, sulfur particles smaller than the critical radius do not exist, so the situation shown in Figure 19a–c appears.
As shown in Figure 19h, micron-sized sulfur particles began to appear significantly in the system after 0.5 s of coagulation time. It indicates that sulfur particles may deposit on the inner wall of the pipeline. In summary, when there is saturated precipitation of simple sulfur in the gathering and transportation pipeline, the precipitated sulfur crystal nuclei may grow into large particles in a very short time, and then deposit. This partly explains the phenomenon of sulfur deposition near the throttle valve.
3.7.2. Sulfur Particle Size Distribution at Different Times (nv/N)
The variation of sulfur particle size distribution with the time is discussed in the previous part. The nv/N0 has a large variation range, as low as order of magnitude 10−7 at 0.5s. In order to further analyze the change of the proportion of sulfur particles of different sizes in the total number of sulfur particles at the same times, the curves of nv/N at different times after coagulation are drawn, as shown in Figure 20 and Figure 21. For the convenience of observation, the abscissa of Figure 20 is the logarithmic axis, and the abscissa of Figure 21 is the conventional axis.
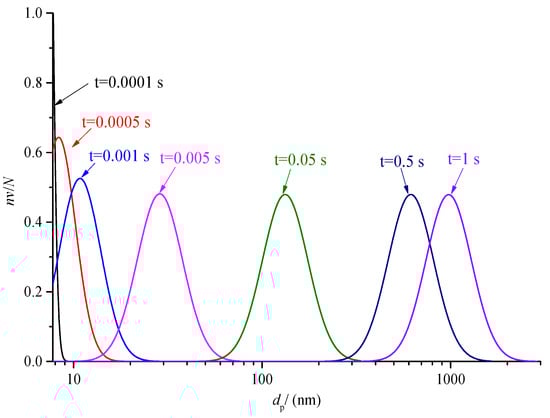
Figure 20.
Comparison of sulfur particle size distribution at different time logarithmic coordinates (nv/N).
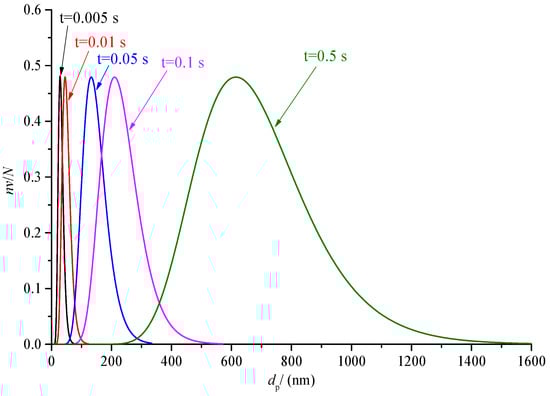
Figure 21.
Comparison of sulfur particle size distribution at different time under conventional coordinates (nv/N).
As shown in Figure 20, the normal distribution curves of different colors represent the variation of sulfur particle size distribution at different times. With the increase in coagulation time, the size distribution curve of the sulfur particles shifts to the right of the abscissa axis. It represents the overall increase in sulfur particle size. In addition, it can also be seen from the figure that when the coagulation process is carried out for a certain time, the particle size distribution curve changes from incomplete to a complete normal distribution curve. After 0.005 s, the maximum value of nv/N is 0.48; in other words, the number of the same sulfur particle size at the same time that occupies the maximum proportion of the total number of particles is 0.48. When the time is close to 1 s, the sulfur particles with a particle size above 1 almost account for more than half of the total number of sulfur particles at this time, indicating that the sulfur crystal nucleus can grow into micron-scale sulfur particles in a very short time.
As shown in Figure 21, the size distribution curve of sulfur particles during 0.005 s to 0.5 s is given. The difference from Figure 20 is that the abscissa of Figure 21 is the conventional coordinate axis of the average size distribution. The purpose is to observe the span of sulfur particle size at different times. It can be seen that the span of sulfur particle size increases with the increase in time. For example, when the time is 0.005 s, the size of sulfur particle size is roughly in the range of 8 nm to 80 nm, and when the time is 0.5 s, the size of sulfur particle size is roughly in the range of 200 nm to 1600 nm.
4. Conclusions
Based on the basic principles of crystallization kinetics, this paper explores the saturation precipitation and particle growth stages of elemental sulfur from a microscopic perspective, establishes a mathematical model for elemental sulfur nucleation and studies the effects of temperature, pressure and H2S concentration on the critical nucleation radius and nucleation rate of elemental sulfur after throttling. The following conclusions were reached:
- (1)
- With the increase in temperature after throttling, the critical nucleation radius of sulfur nuclei decreases gradually. With the increase in pressure after throttling, the nucleation radius increases gradually. With the increase in H2S concentration in the gas phase, the sulfur nucleation radius increases first and then changes little.
- (2)
- With the increase in temperature after throttling, the nucleation rate of sulfur crystal nuclei generally decreases. With the increase in pressure after throttling, the nucleation rate increases first and then decreases. The increase in H2S concentration always promotes the nucleation rate of sulfur crystal nuclei.
- (3)
- Under throttling conditions, nano-sized sulfur crystal nuclei can grow into micron-sized sulfur particles in an extremely short time (no more than 1.0 s).
5. Suggestions
In this paper, the homogeneous nucleation theory is used to describe the nucleation law of sulfur crystal nuclei. The model assumes that there is no sulfur particle deposition in the initial state of the pipeline. In a period of time after the supersaturation of elemental sulfur precipitates, a certain amount of solid sulfur particles will inevitably precipitate in the pipeline. Subsequently, sulfur crystal nuclei may be precipitated in the form of heterogeneous nucleation, which is more complicated than homogeneous nucleation. In the future, the nucleation model can further consider the effect of heterogeneous nucleation of elemental sulfur.
Author Contributions
Methodology, G.L. and C.L.; Formal analysis, D.C. and B.L.; Investigation, B.L.; Resources, G.L.; Data curation, G.L., D.C. and B.L.; Writing—original draft, D.C.; Writing—review & editing, C.L.; Supervision, G.L. and C.L.; Funding acquisition, G.L. All authors have read and agreed to the published version of the manuscript.
Funding
This study was financially supported by the National Natural Science Foundation of China (No. 52104063), the General Program of the Chongqing Natural Science Foundation (grant number: cstc2020jcyj–msxmX0174) and the Science and Technology Research Project of Chongqing Education Commission (grant number: KJQN202001539).
Data Availability Statement
Not applicable.
Conflicts of Interest
The authors declare no conflict of interest.
Nomenclature
| is the change in total free energy caused by the formation of a single crystal nucleus, J; | |
| is the surface free energy change caused by the formation of a single crystal nucleus, J; | |
| is the volume free energy change caused by the formation of a single crystal nucleus, J; | |
| A | is the interface area of sulfur crystal nucleus and parent phase, m2; |
| is the interfacial tension between the sulfur nucleus and the parent phase, N/m; | |
| r | is the radius of sulfur crystal nucleus, m; |
| is the interfacial tension N/m; | |
| T | is the temperature, K; |
| is the volume of crystal nucleus, m3; | |
| is the difference between the free energy of elemental sulfur in the solid phase and the gas phase; | |
| is the Boltzmann constant, 1.38 × 10⁻²³ J/K; | |
| R | is the gas state constant, 8.314 J/K·mol; |
| is the solubility of elemental sulfur in the initial state, mol/mol; | |
| is the solubility of elemental sulfur in supersaturated solution equilibrium state, mol/mol; | |
| is the critical nucleation radius of elemental sulfur, m; | |
| is the nucleation rate, m−3·s−1; | |
| is the pre-exponential factor, m−3·s−1; | |
| is non-isothermal coefficient, for dilute solution system. is 1; | |
| is the condensation coefficient. The value is 0.1 m/s; | |
| is the molecular volume of elemental sulfur solid phase, m3; | |
| N | is the number of condensing molecules, m−3; |
| is the molar volume of elemental, m3/mol; | |
| is Avogadro’s constant, 6.023 × 10²³ mol−1; | |
| is the molar density of the mixture, mol/m3; | |
| is the mean free path of gas molecules, m; | |
| d | is the average diameter of gas molecules, m; |
| P | is the pressure, Pa; |
| μ | is the gas viscosity, ; |
| is gas viscosity to be obtained, m ; | |
| is the viscosity of gas under one atmospheric pressure and a certain temperature, m ; | |
| is the relative density of gas. The air density is 1.29 kg/m3; | |
| N | is the total number of sulfur particles in unit space at time t; |
| is the geometric mean volume of sulfur particles, m3; | |
| is the geometric mean radius of sulfur particles, m; |
References
- Liu, E.B.; Peng, Y.; Peng, S.B.; Yu, B.; Chen, Q.K. Research on low carbon emission optimization operation technology of natural gas pipeline under multi-energy structure. Pet. Sci. 2022, 19, 3046–3058. [Google Scholar] [CrossRef]
- Rashid, M.; Luo, M.; Ashraf, U.; Hussain, W.; Ali, N.; Rahman, N.; Hussain, S.; Aleksandrovich Martyushev, D.; Vo Thanh, H.; Anees, A. Reservoir Quality Prediction of Gas-Bearing Carbonate Sediments in the Qadirpur Field: Insights from Advanced Machine Learning Approaches of SOM and Cluster Analysis. Minerals 2023, 13, 29. [Google Scholar] [CrossRef]
- Galkin, V.I.; Martyushev, D.A.; Ponomareva, I.N.; Chernykh, I.A. Developing features of the near-bottomhole zones in productive formations at fields with high gas saturation of formation oil. J. Min. Inst. 2021, 249, 386–392. [Google Scholar] [CrossRef]
- Ponomareva, I.N.; Martyushev, D.A.; Govindarajan, S.K. A new approach to predict the formation pressure using multiple regression analysis: Case study from Sukharev oil field reservoir—Russia. J. King Univ.—Eng. Sci. 2022, in press. [Google Scholar] [CrossRef]
- Kathmann, S.-M. Understanding the chemical physics of nucleation. Theor. Chem. Acc. 2006, 116, 169–182. [Google Scholar] [CrossRef]
- Frenkel, J. Statistical Theory of Condensation Phenomena. J. Chem. Phys. 1939, 7, 200–201. [Google Scholar] [CrossRef]
- Zou, L.; Zhang, W. Molecular Dynamics Simulations of the Effects of Entanglement on Polymer Crystal Nucleation. Macromolecules 2022, 55, 4899–4906. [Google Scholar] [CrossRef]
- Saidi, W.-A. Density Functional Theory Study of Nucleation and Growth of Pt Nanoparticles on MoS 2(001) Surface. J. Cryst. Growth Des. 2015, 15, 642–652. [Google Scholar] [CrossRef]
- Ugwu, L.I.; Morgan, Y.; Ibrahim, H. Application of density functional theory and machine learning in heterogenous-based catalytic reactions for hydrogen production. Int. J. Hydrog. Energy 2022, 47, 2187–2199. [Google Scholar] [CrossRef]
- Yang, J.; Wang, M.; Wu, L.; Liu, Y.; Qiu, S.; Xu, P. A Novel Monte Carlo Simulation on Gas Flow in Fractal Shale Reservoir. Energy 2021, 236, 121513. [Google Scholar] [CrossRef]
- Seghier, M.E.A.B.; Spyridis, P.; Jafari-Asl, J.; Ohadi, S.; Li, X. Comparative Study on the Efficiency of Simulation and Meta-Model-Based Monte Carlo Techniques for Accurate Reliability Analysis of Corroded Pipelines. Sustainability 2022, 14, 5830. [Google Scholar] [CrossRef]
- Wen, Y. Study on Thermal Process of Ultrafine Particles Prepared by Gas Phase Method. Ph.D. Thesis, University of Science and Technology Beijing, Beijing, China, 2018. [Google Scholar]
- Turnbull, D.; Fisher, J.-C. Rate of nucleation in condensed systems. J. Chem. Phys. 1949, 17, 71–73. [Google Scholar]
- Jie, W.Q. Principle and Technology of Crystal Growth; Science Press: Beijing, China, 2010. [Google Scholar]
- Zhu, Z.; Tajallipour, N.; Teevens, P.J.; Eng, P.; Lepková, K.; Gubner, R. Modeling of Elemental Sulfur Deposition in Sour-gas Petroleum Pipelines. In Proceedings of the CORROSION 2011, Houston, TX, USA, 13–17 March 2011; NACE International: Houston, TX, USA, 2011. [Google Scholar]
- Fuchs, N.A. Aerosol Dynamics; Science Press: Beijing, China, 1960; pp. 279–282. [Google Scholar]
- Wright, P.-G. On the discontinuity involved in diffusion across an interface (the delta of Fuchs). J. Discuss. Faraday Soc. 1960, 30, 100–112. [Google Scholar] [CrossRef]
- Park, S.H.; Lee, K.W.; Otto, E.; Fissan, H. The Log-normal Size Distribution Theory of Brownian Aerosol Coagulation for the Entire Particle Size Range Part I-analytical Solution Using the Harmonic Mean Coagulation Kernel. J. Aerosol Sci. 1999, 30, 3–16. [Google Scholar] [CrossRef]
- Otto, E.; Fissan, H.; Park, S.-H.; Lee, K.W. The log-normal size distribution theory of brownian aerosol coagulation for the entire particle size range Part II-analytical solution using Dahneke’s coagulation kernel. J. Aerosol Sci. 1999, 30, 17–34. [Google Scholar] [CrossRef]
- Smoluchowski, M. Versuch einer mathematischen Theorie der Koagulationskinetik kolloider Lösungen. Z. Phys. Chem. 1918, 92, 129–168. [Google Scholar]
- Saffman, P.G.F.; Turner, J.-S. On the collision of drops in turbulent clouds. J. Fluid Mech. 1956, 1, 16–30. [Google Scholar] [CrossRef]
- Wang, L.; Vigil, R.-D.; Fox, R.-O. CFD simulation of shear-induced aggregation and breakage in turbulent Taylor-Couette flow. J. Colloid Interface Sci. 2005, 285, 167–178. [Google Scholar] [CrossRef] [PubMed]
- Liu, J. Study on Sulfur Deposition Law in Acid Natural Gas Gathering and Transportation System. Master’s Thesis, China University of Petroleum, Qingdao, China, 2013. [Google Scholar]
- Santos, J.P.L.; Lobato, A.L.; Moraes, C.; Santos, L.C.L. Determination of Elemental Sulfur Deposition Rates for Different Natural Gas Compositions. J. Pet. Sci. Eng. 2015, 135, 461–465. [Google Scholar] [CrossRef]
- Buchholz, M.; Haus, J.; Pietsch, B.S.; Jäger, F.K.; Heinrich, S. CFD-aided population balance modeling of a spray drying process. Adv. Powder Technol. 2022, 33, 103636. [Google Scholar] [CrossRef]
- Liu, E.; Li, D.; Li, W.; Liao, Y.; Liao, Y.; Qiao, W.; Liu, W.; Azimi, M. Erosion Simulation and Improvement Scheme of Separator Blowdown System—A case study of Changning national shale gas demonstration area. J. Nat. Gas Sci. Eng. 2021, 88, 103856. [Google Scholar] [CrossRef]
- Onischuk, A.; Valiulin, S.; Vosel, S.; Karasev, V.V.; Zelik, V.D.; Baklanov, A.M. Surface Tension of Sulfur Nanoparticles as Determined From Homogeneous Nucleation Experiments. J. Aerosol Sci. 2016, 97, 1–21. [Google Scholar] [CrossRef]
- Li, L. Study on Sulfur Sedimentary Facies and Dynamic Prediction Model of High Sulfur Gas Reservoir Wellbore. Ph.D. Thesis, Southwest Petroleum University, Chendu, China, 2012. [Google Scholar]
- Chen, L. Research on Sulfur Deposition Prediction Method of High Sulfur Natural Gas Gathering Pipeline. Master’s Thesis, Southwest Petroleum University, Chendu, China, 2015. [Google Scholar]
- Pack, D.J. Elemental Formation in Natural Gas Transmission Pipelines. Ph.D. Thesis, University of Western Australia, Perth, WA, Australia, 2005. [Google Scholar]
- Müller, H. Zur Allgemeinen Theorie Der Raschen Koagulation. Fortschr. Über Kolloide Polym. 1928, 27, 223–250. [Google Scholar] [CrossRef]
- Yang, L.S. Gas Production Process Basis; Petroleum Industry Press: Beijing, China, 1992. [Google Scholar]
- Chatterjee, A.; Kerker, M.; Cooke, D.D. Brownian Coagulation of Aerosols in the Transition Regime. J. Colloid Interface Sci. 1975, 53, 71–82. [Google Scholar] [CrossRef]
- Liu, G.; Hao, M.; Fan, S.; Li, C. A Study on Elemental Sulfur Equilibrium Content in Mixtures of Methane, Carbon Dioxide, and Hydrogen Sulfide under Conditions of Natural Gas Pipeline Transmission. Energies 2023, 16, 2466. [Google Scholar] [CrossRef]


Disclaimer/Publisher’s Note: The statements, opinions and data contained in all publications are solely those of the individual author(s) and contributor(s) and not of MDPI and/or the editor(s). MDPI and/or the editor(s) disclaim responsibility for any injury to people or property resulting from any ideas, methods, instructions or products referred to in the content. |
© 2023 by the authors. Licensee MDPI, Basel, Switzerland. This article is an open access article distributed under the terms and conditions of the Creative Commons Attribution (CC BY) license (https://creativecommons.org/licenses/by/4.0/).