Article

A Model Predictive Control Approach for Heliostat Field Power Regulatory Aiming Strategy under Varying Cloud Shadowing Conditions

Key Laboratory of Collaborative Sensing and Autonomous Unmanned Systems of Zhejiang Province, Zhejiang University, 38 Zheda Rd., Xihu District, Hangzhou 310027, China
*
Author to whom correspondence should be addressed.
Energies 2023, 16(7), 2997; https://doi.org/10.3390/en16072997
Submission received: 13 December 2022 / Revised: 1 February 2023 / Accepted: 22 March 2023 / Published: 24 March 2023
(This article belongs to the Section A2: Solar Energy and Photovoltaic Systems)

Abstract

:
Weather conditions have significant impacts on the solar concentration processes of the heliostat fields in solar tower power plants. The cloud shadow movements may cause varying solar irradiance levels received by each heliostat. Hence, fixed aiming strategies may not be able to guarantee the solar concentrating performance. Dynamic aiming strategies are able to optimize the aiming strategy based on real-time shadowing conditions and short-term forecast, and, therefore, provide much more robust solar concentration performance compared to fixed strategies. In this work, a model predictive control approach for s heliostat field power regulatory aiming strategy was proposed to regulate the total concentrated solar flux on the central receiver. The model predictive control method obtains the aiming strategy, leveraging real-time and forecast shadowing conditions based on the solar concentration model of the heliostat field. The allowable flux density of the receiver and the aiming angle adjustment limits are also considered as soft and hard constraints in the aiming strategy optimization. A Noor III-like heliostat field sector was studied with a range of shadow-passing scenarios, and the results demonstrated the effectiveness of the proposed method.

1. Introduction

In recent decades, the global energy demand has been proliferating [1]. At the same time, the over-exploitation and over-burning of the limited fossil fuels have created pressing environmental problems and energy crisis [1,2]. Solar energy has attracted widespread attention for its significant advantages, such as being clean, renewable, and sustainable [2,3,4]. The concentrated solar power (CSP) system is an effective solar power generation method developing in many countries [5]. It is expected to be a proven alternative to conventional fossil fuel power plants due to the high potential for efficiency improvement and adjustability [6,7]. The solar power tower (SPT) system is a typical CSP technology, which occupies a significant market position on account of its high efficiency, low operating costs and significant scale-up potential compared to other kind of CSP technologies [2]. In an SPT plant, heliostats in the heliostat field reflect and concentrate the sunlight onto the receiver placed at the top of a central tower [4,8]. The solar radiation gathered by the receiver is absorbed by the heat transfer fluid (HTF) and converted into thermal energy to drive the conventional generator [4]. Like most solar power systems, the weather condition heavily influences the operation of the SPT system. The irradiance level received by each heliostat varies as the cloud shadow passing over the heliostat field. As a result, wild fluctuations may occur in the output solar power, which affects the operation stability [9,10,11]. The optimal heliostat field aiming strategy is an effective method to lower the risk. Through the aiming point adjustments of the heliostats, the solar flux distribution on the receiver can meet the requirements that ensure stable system operation.
There are a number of studies about the aiming strategy of the SPT plants. Binotti et al. evaluated the effect of different aiming strategies on peak flux reduction by analyzing the annual optical efficiency [12]. Collado and Guallar proposed a two-parameter aiming strategy to cope with the peak flux and spillage [13]. Kuhnke et al. proposed a robust aiming strategy for the uncertainty caused by the heliostat tracking error arising from the sun-tracking process [14]. The optimization model was formulated by mixed-integer linear programming to obtain the desired flux distribution. These studies were generally concerned with the static state of the aiming strategy optimization.
Several studies also paid attention to the control strategy and dynamic performance. García-martín et al. proposed a closed-loop automatic control strategy to keep the receiver temperature profile within the target range [15]. On the other hand, Salomé et al. used an open-loop control method combined with a TABU metaheuristic optimization algorithm to select the aiming point for heliostats [16]. Cruz et al. adjusted the aiming points of the heliostats after the optimization strategy had been implemented [17]. The method calculated the flux differences of the solar flux distribution and the total flux relative to their respective target value. The focusing and defocusing of the heliostats were dependent on the flux offset in the area. García et al. reduced the control variables by grouping the heliostats in the field [18]. The aiming point distribution of the heliostats in each group was expressed as one control variable. Some studies also consider the energy consumption in the dynamic processes as an optimization objective for heliostat optimal scheduling [19,20].
Recent studies also analyzed the solar concentrating performances with shadow variations caused by moving clouds over the heliostat field. Crespi et al. discussed the effect of cloud movement on the transient performance of the SPT plant [7]. García et al. brought the concept of closed-loop feedback control in the aiming strategy design to handle the passing cloud disturbances [21]. The allowable flux density (AFD) limits of the solar flux distribution were the controlled variables. Furthermore, the focusing parameters of the heliostats were the manipulated variables. A dynamic matrix control method was implemented, considering that the aiming strategy was a Multiple-Input Multiple-Output system. Soo Too et al. implemented similar aiming strategy as García et al. proposed to control the temperatures of the receiver pipes, as the temperature could be easily measured compared to the flux density [22]. The feedback control approach was only introduced to control the variables to meet the setpoint, without taking additional weather forecast data and the optimization process into account. The proposed aiming strategy lowered the inclement weather impact through the concentrated performance close to real-time. Ashley et al. also applied a near real-time optimal aiming strategy for the cases with cloud disturbances [23]. The dynamic aiming strategies implemented by computational acceleration are essentially composed of a series of static aiming strategies, without considering the continuity between the strategies related to the passing clouds.
There are also some studies in photovoltaic (PV) systems on cloud conditions which caused partial shading faults. Hong and Pula introduced methods about detection of the partial shading faults [24]. Dhanraj et al. supervised the PV panel and used machine learning techniques to detect the partial shading faults [25]. Hosseinzadeh and Salmasi proposed a procedure to detect the shading fault based on maximum power point tracking and the defined voltage ratio [26]. However, those studies paid more attention to the detection instead of the dynamic aiming strategy.
To cope with the dynamic aiming problem with cloud shadowing disturbances, in this work, a model predictive control (MPC) approach for the heliostat field power regulatory aiming strategy is proposed. The MPC controller obtains optimized aiming strategies using a predicted solar flux distribution model based on real-time and shadowing forecasts to regulate total received solar flux on the central receiver. The heliostat adjustment is restricted in each control interval as hard constraints to limit the energy consumption. The AFD limits are also considered as soft constraints for operation safety. The feedback compensation is included in the aiming strategy to compensate the error of the prediction model. The aiming strategy optimization is solved by the particle swarm optimization (PSO) algorithm. A number of shadow-passing scenarios based on real data are carried out to demonstrate the effectiveness of the proposed aiming strategy.
The remainder of this paper is structured in the following sections. The MPC approach for the power regulatory heliostat field aiming strategy is explained in Section 2, including the aiming strategy and the MPC controller. Section 3 conducted a case study to demonstrate the effectiveness of the proposed heliostat field aiming strategy. Finally, Section 4 is the conclusion.

2. Materials and Methods

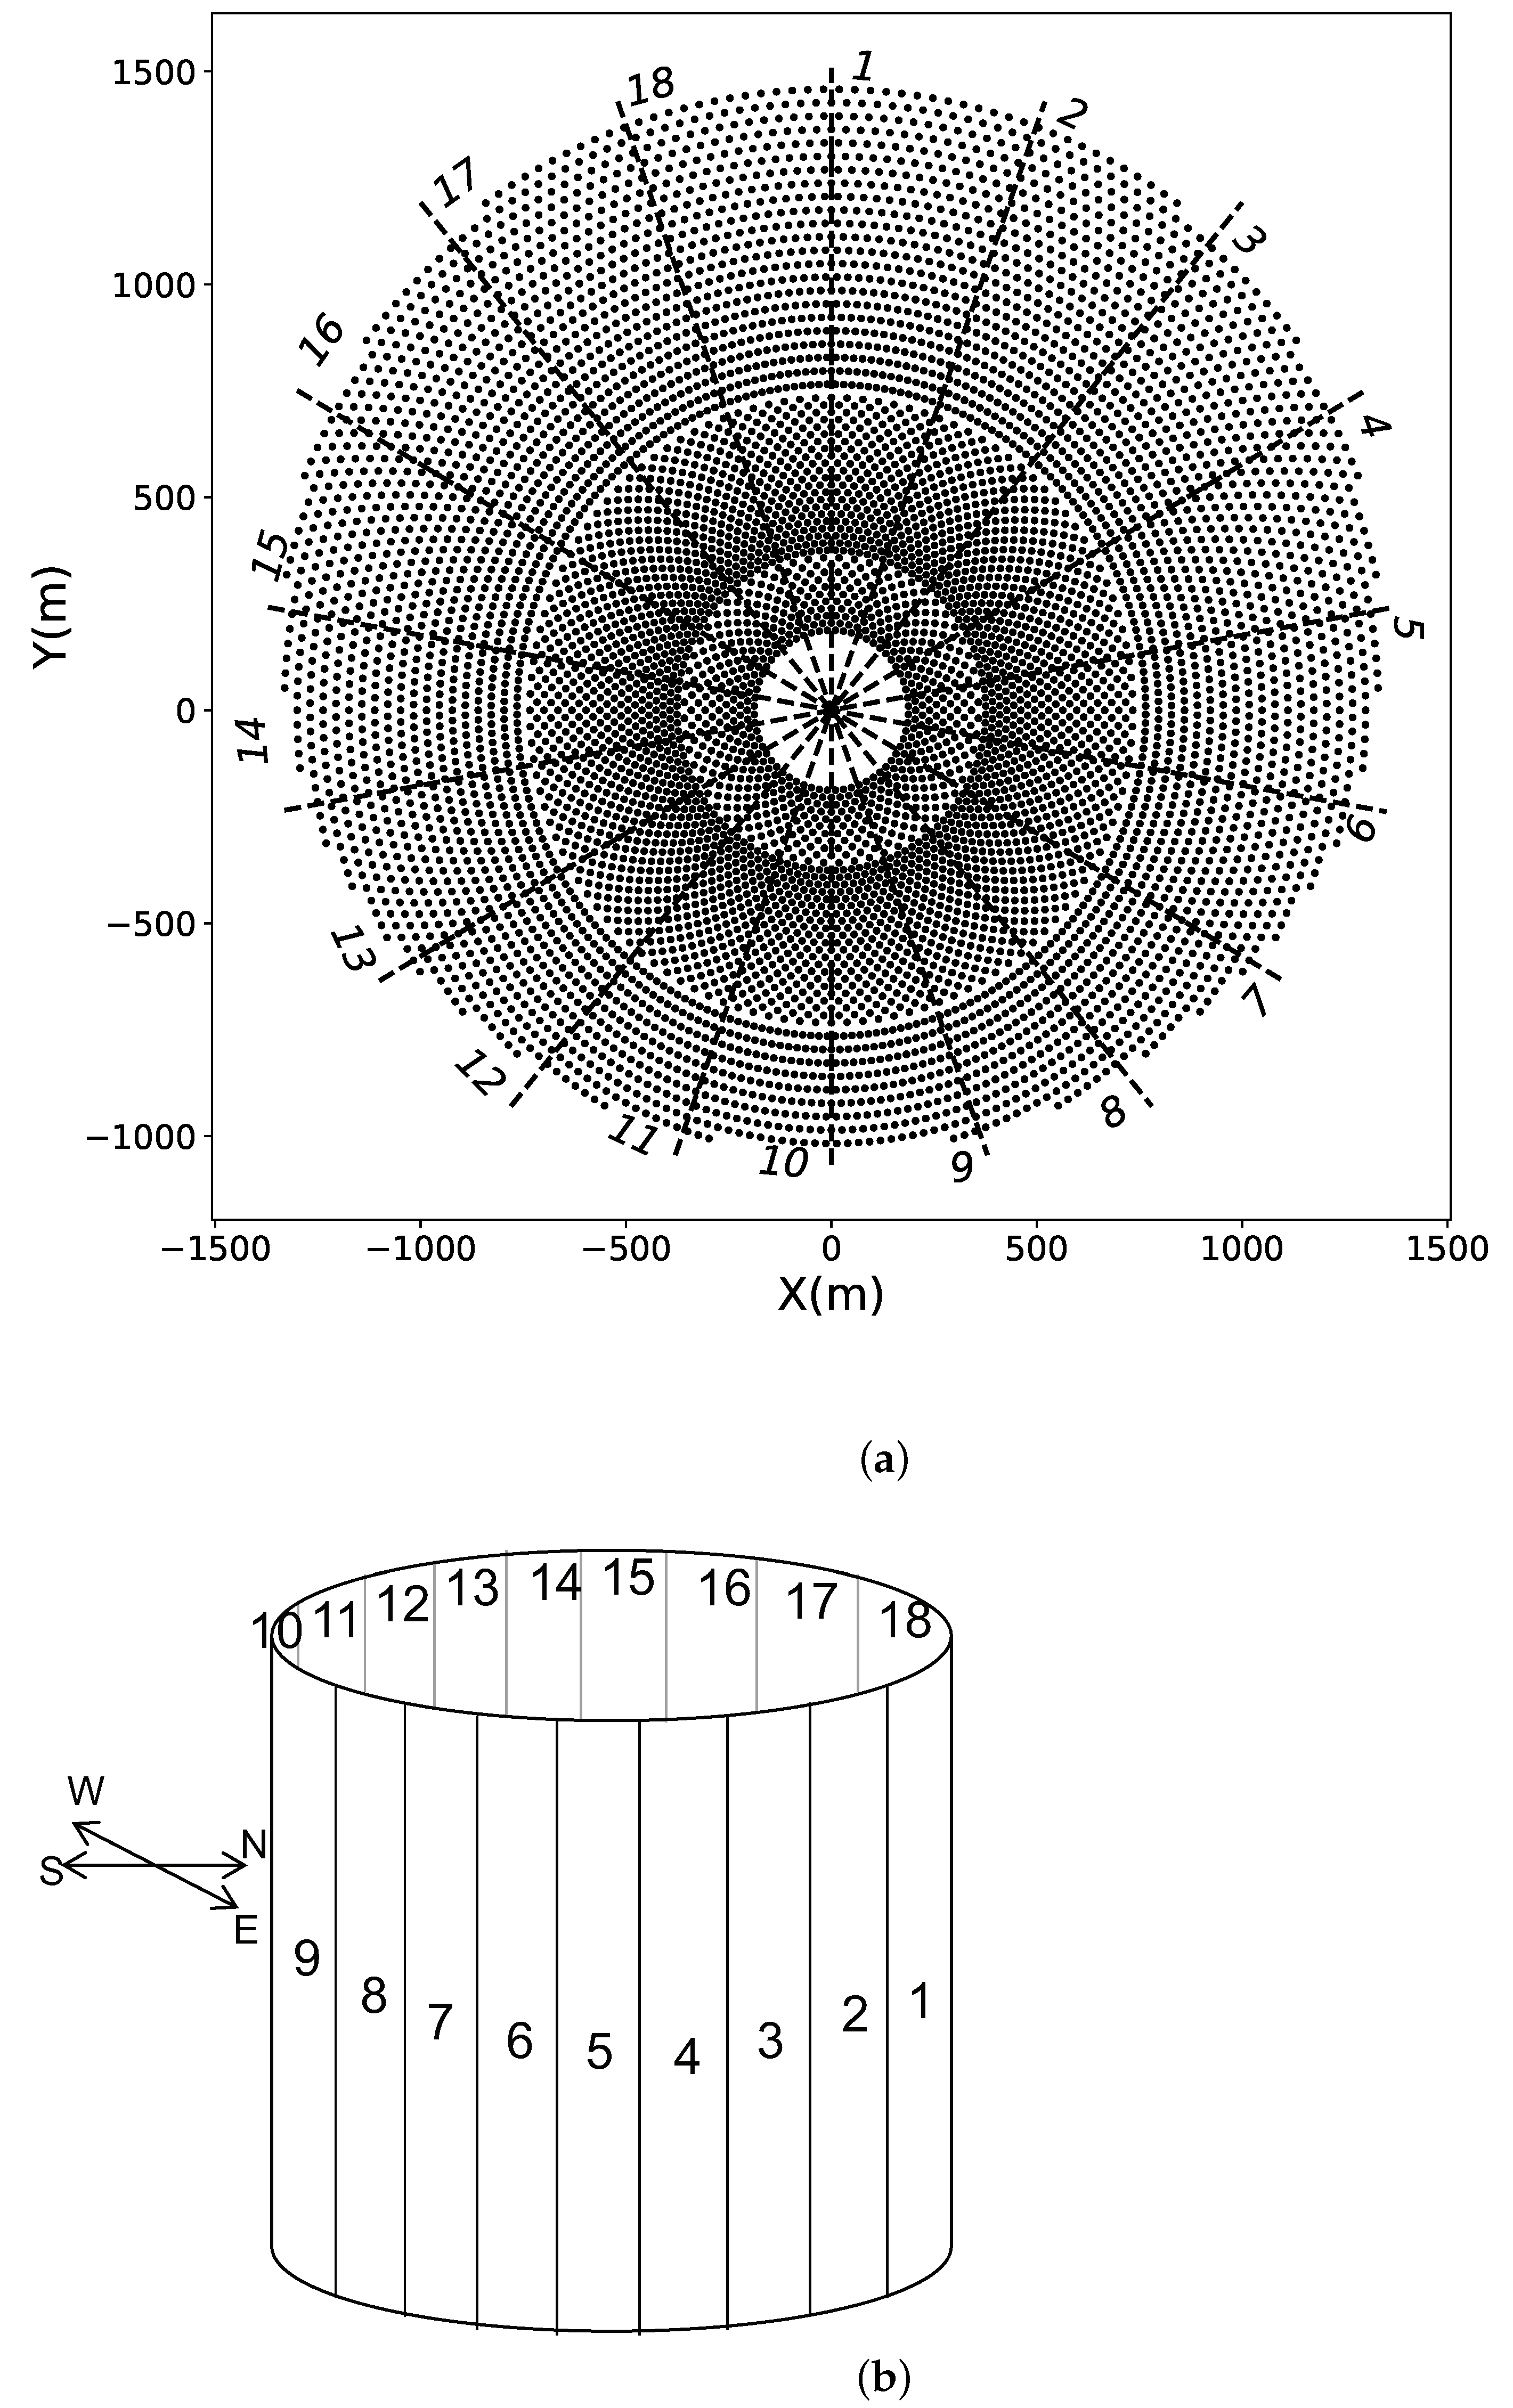
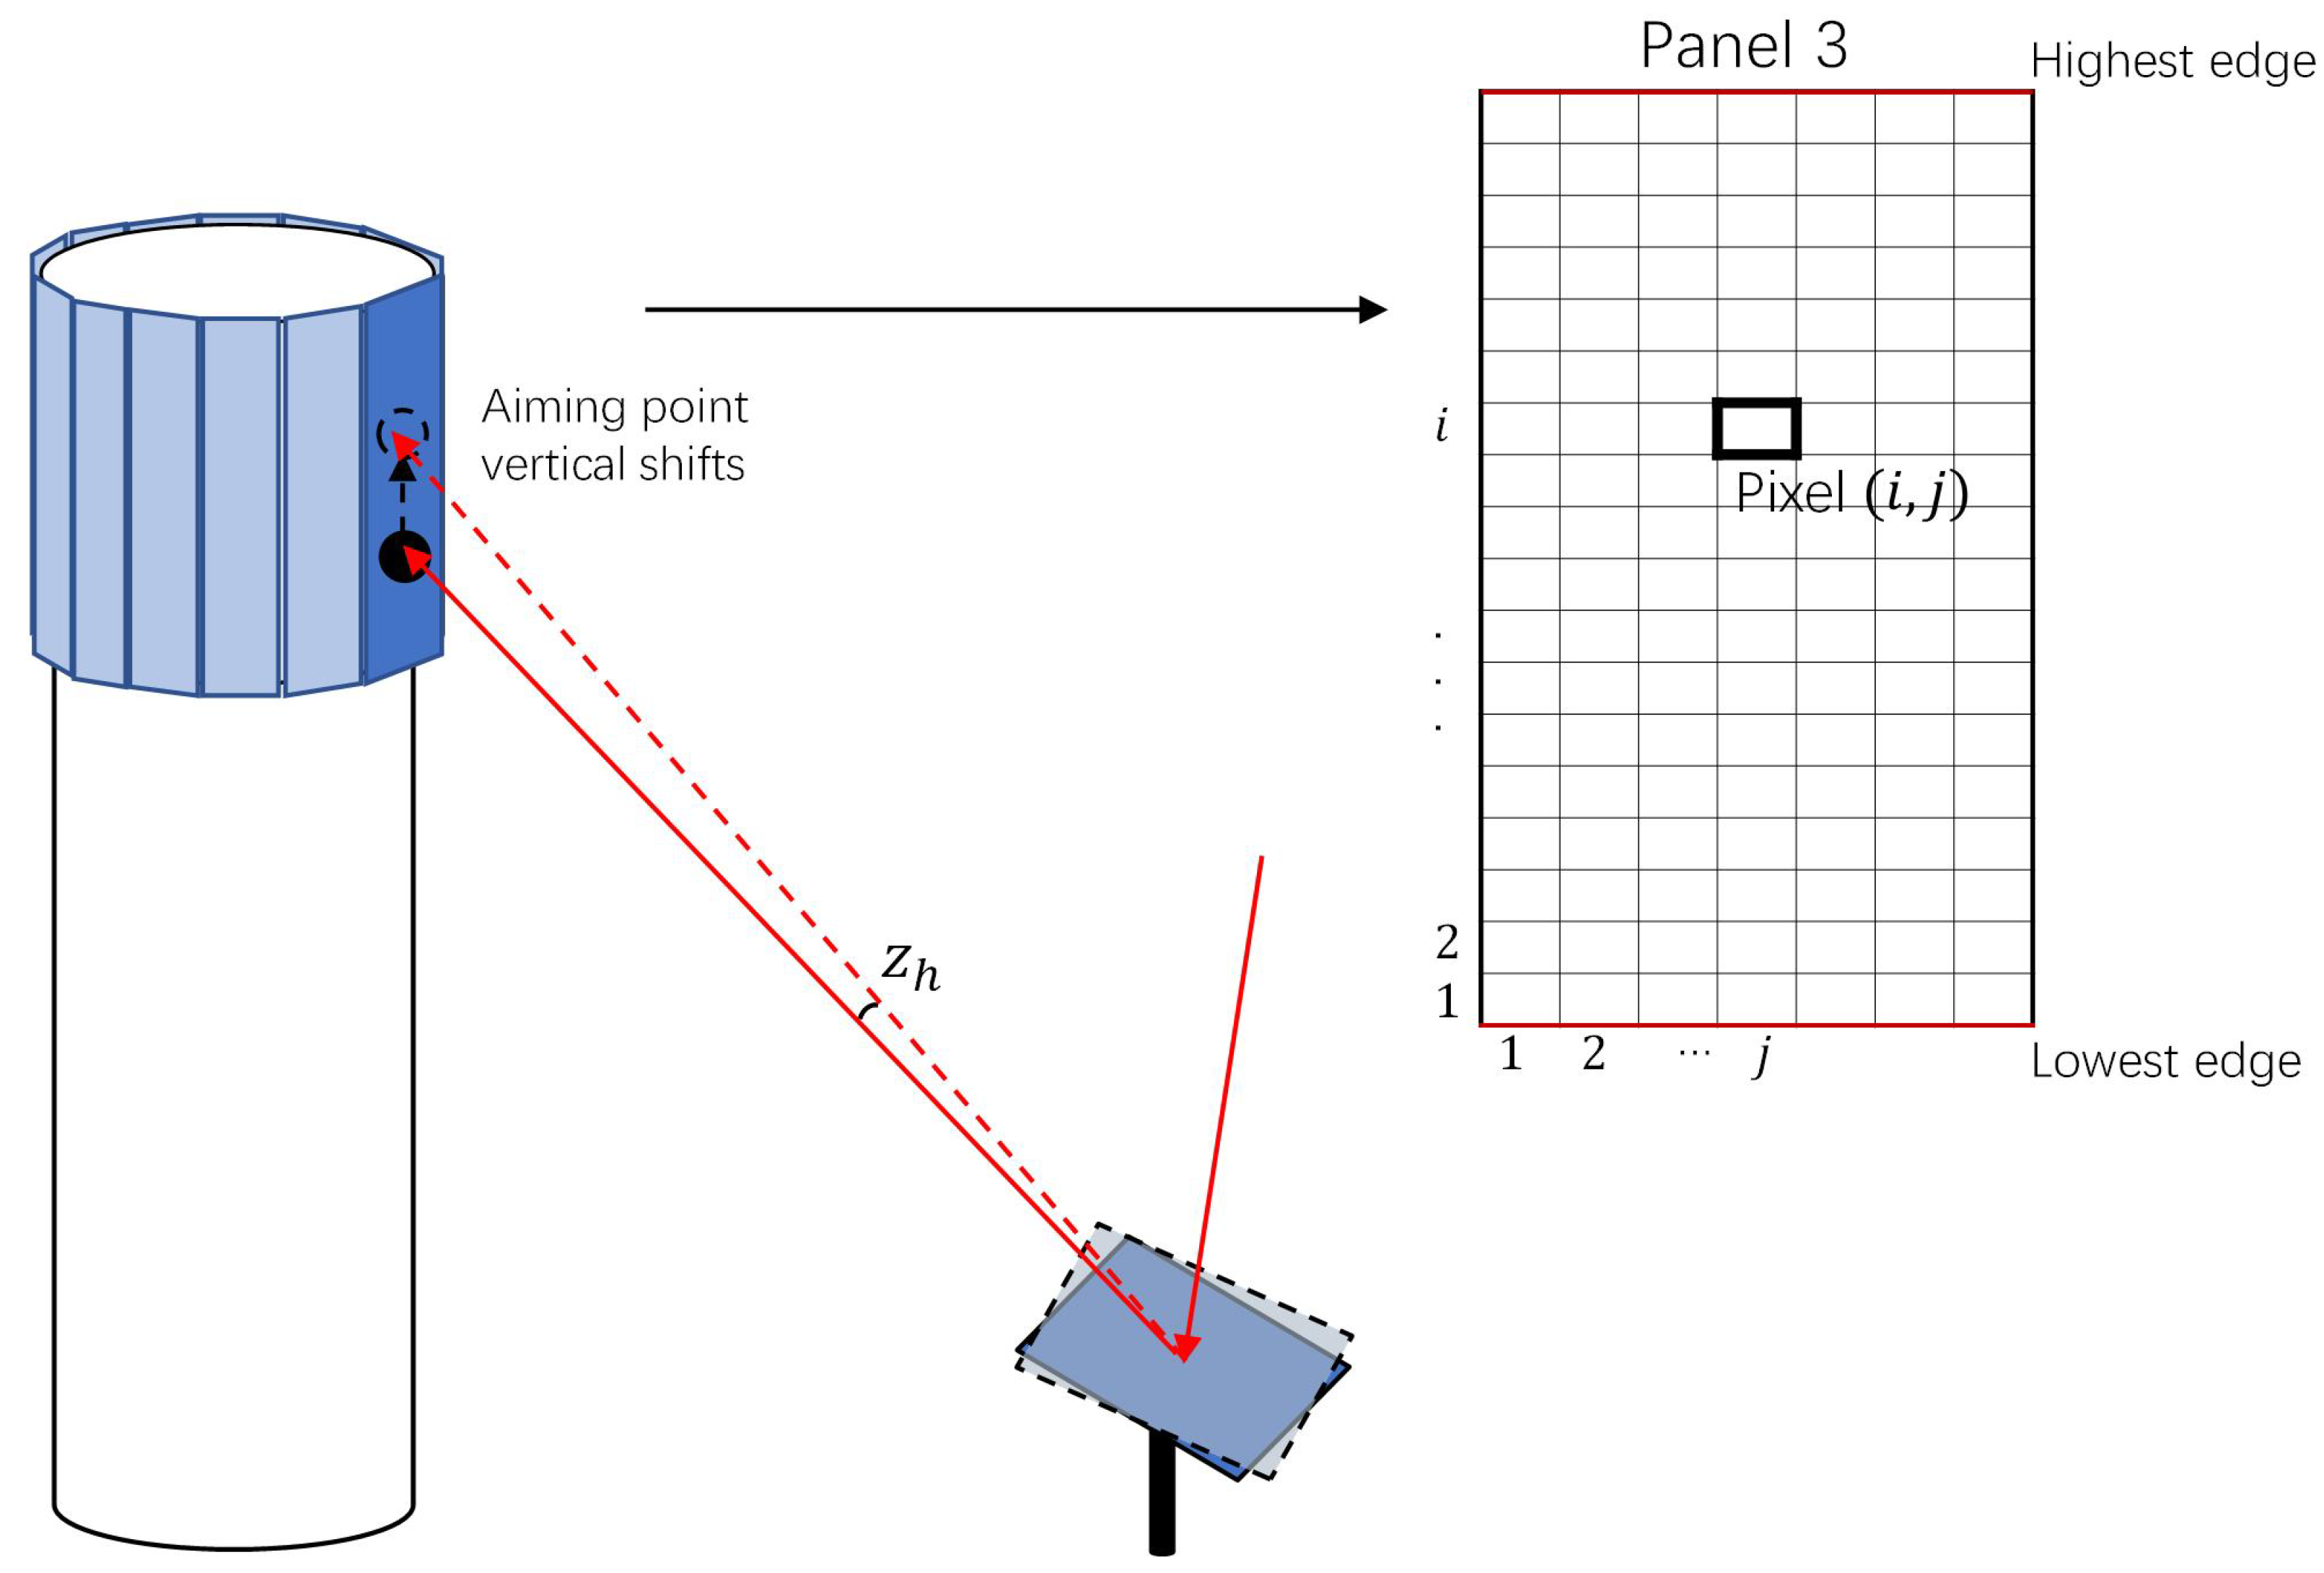
2.1. Problem Description

The SPT system output is influenced by both the solar concentration performance of the heliostat field and the HTF flow rate from the receiver subsystem. There will typically be a hierarchical control scheme, such as the study described in [27], where a supervisory control determines the optimal trajectories for the heliostat field focusing and the receiver system, maximizing the overall efficiency while considering the restraints. Therefore, a heliostat field control system is needed to ensure the solar flux distribution generated by the heliostat field following the reference trajectory. It is in fact a regulatory control problem which, in this work, is referred to as the heliostat field power regulatory aiming strategy. An MPC approach is adopted here to obtain the heliostat field power regulatory aiming strategy to cope with varying cloud shadowing conditions. Short-term cloud shadowing forecast methods based on all-sky images have developed recent years, such as a patent pending method developed by our group [28], and thus is available for the aiming strategy optimization with the MPC controller.
Specifically, the aiming strategy model in this work is formulated with a case of the external cylindrical receiver and a Noor III-like heliostat field. Figure 1a shows the layout of the heliostat field, and Figure 1b shows the geometry of the receiver consisting of 18 panels. The field sectors are labeled and correspond to the receiver panels. Figure 2 shows a brief description of the heliostat aiming problem on the specific receiver panel. The panel is divided into a computing grid to quantify the solar flux distribution. The pixel at coordinate ( i , j ) represents the flux density in this square area. The aiming point of the each heliostat is shifted on the panel by the aiming angle variation to change the aiming strategy. In this work, only the vertical shifts were considered, and the azimuth angles of the aiming points remained constant and were equal to that of the heliostat as in [29]. When the aiming point shifts beyond the highest and lowest edge of the receiver, the heliostat will be set at an off-state. In this state, the heliostat did not participate in the concentrating. z h is used to represent the aiming angle variation of heliostat h, and thereby the heliostat field aiming strategy is denoted as vector Z = [ z 1 , z 2 , , z p ] where the dimension p refers to the heliostat number. F ( Z ) denotes the density matrix of the solar flux distribution on the panel generated by aiming strategy Z .
As the solar flux distribution significantly impacts the reliability and safety of the system, the AFD is considered as the soft constraint in the aiming strategy to limit the excessive temperature gradients and flatten the flux distribution. There are specific upper bound densities given by AFD for each area of the solar flux distribution, in order to cope with the corrosion and thermal stress of the molten salt receiver pipes. The value of the AFD limit is related to the mass flow rate and temperature of the HTF in the operation [29]. In this work, the AFD limits are expressed as matrices with the same size as solar flux distribution matrices. A F D i , j denotes the AFD limit at coordinates ( i , j ) .
Furthermore, since heliostat adjustments implementing the aiming strategy are achieved by heliostat rotation to different aiming angles, which makes up the main energy consumption of the heliostat field operation. Its energy consumption impact should also be considered. If the adjustment energy consumption is employed as a component in the optimization objective formulation, the already complex optimization problem will become more complex and impossible to compute in real time. Therefore, in this work, hard constraints on heliostat adjustment angles are imposed instead to set the upper bound of the energy consumption of the heliostat field. Angle α represents the heliostat adjustment limits where a heliostat is allowed to adjust during the aiming interval.
The power regulatory control of the heliostat field aiming strategy requires the solar flux distribution to follow a reference trajectory provided by the supervisory layer. While a reference trajectory of flux distribution can be supported by the MPC method, the total received solar flux value is used for the reference trajectory tracking for simplicity. The total received solar flux is derived by the solar flux distribution. The total received solar flux Q ( Z ) is approximately formulated as Q ( Z ) i j F i , j ( Z ) × S i , j , where F i , j ( Z ) denotes flux density of the pixel at coordinates ( i , j ) and S i , j is the corresponding area. The reference trajectory during the cloud passing is also simplified to a constant set point for the ease of presenting the overall methodology while the non-stationary reference can be directly used instead. Q r e f represents the reference flux trajectory for heliostat field output to follow. The regulatory aiming strategy is formed as an optimization problem minimizing the difference between the reference flux trajectory and the total received solar flux subject to the AFD and the heliostat adjustment limits, with a penalty function of AFD limits denoted as Φ . The penalty function was formulated according to the optimization solving process, and was expressed in the following section on PSO algorithm and Equations (8) and (9). In Equation (1), the aiming strategy optimization problem is formulated, including the objective and constraints.
min L ( Z ) = ( Q ( Z ) Q r e f ) 2 + Φ F ( Z ) , A F D ( Z ) s . t . α z h α ( h = 1 , 2 , 3 , , p ) .

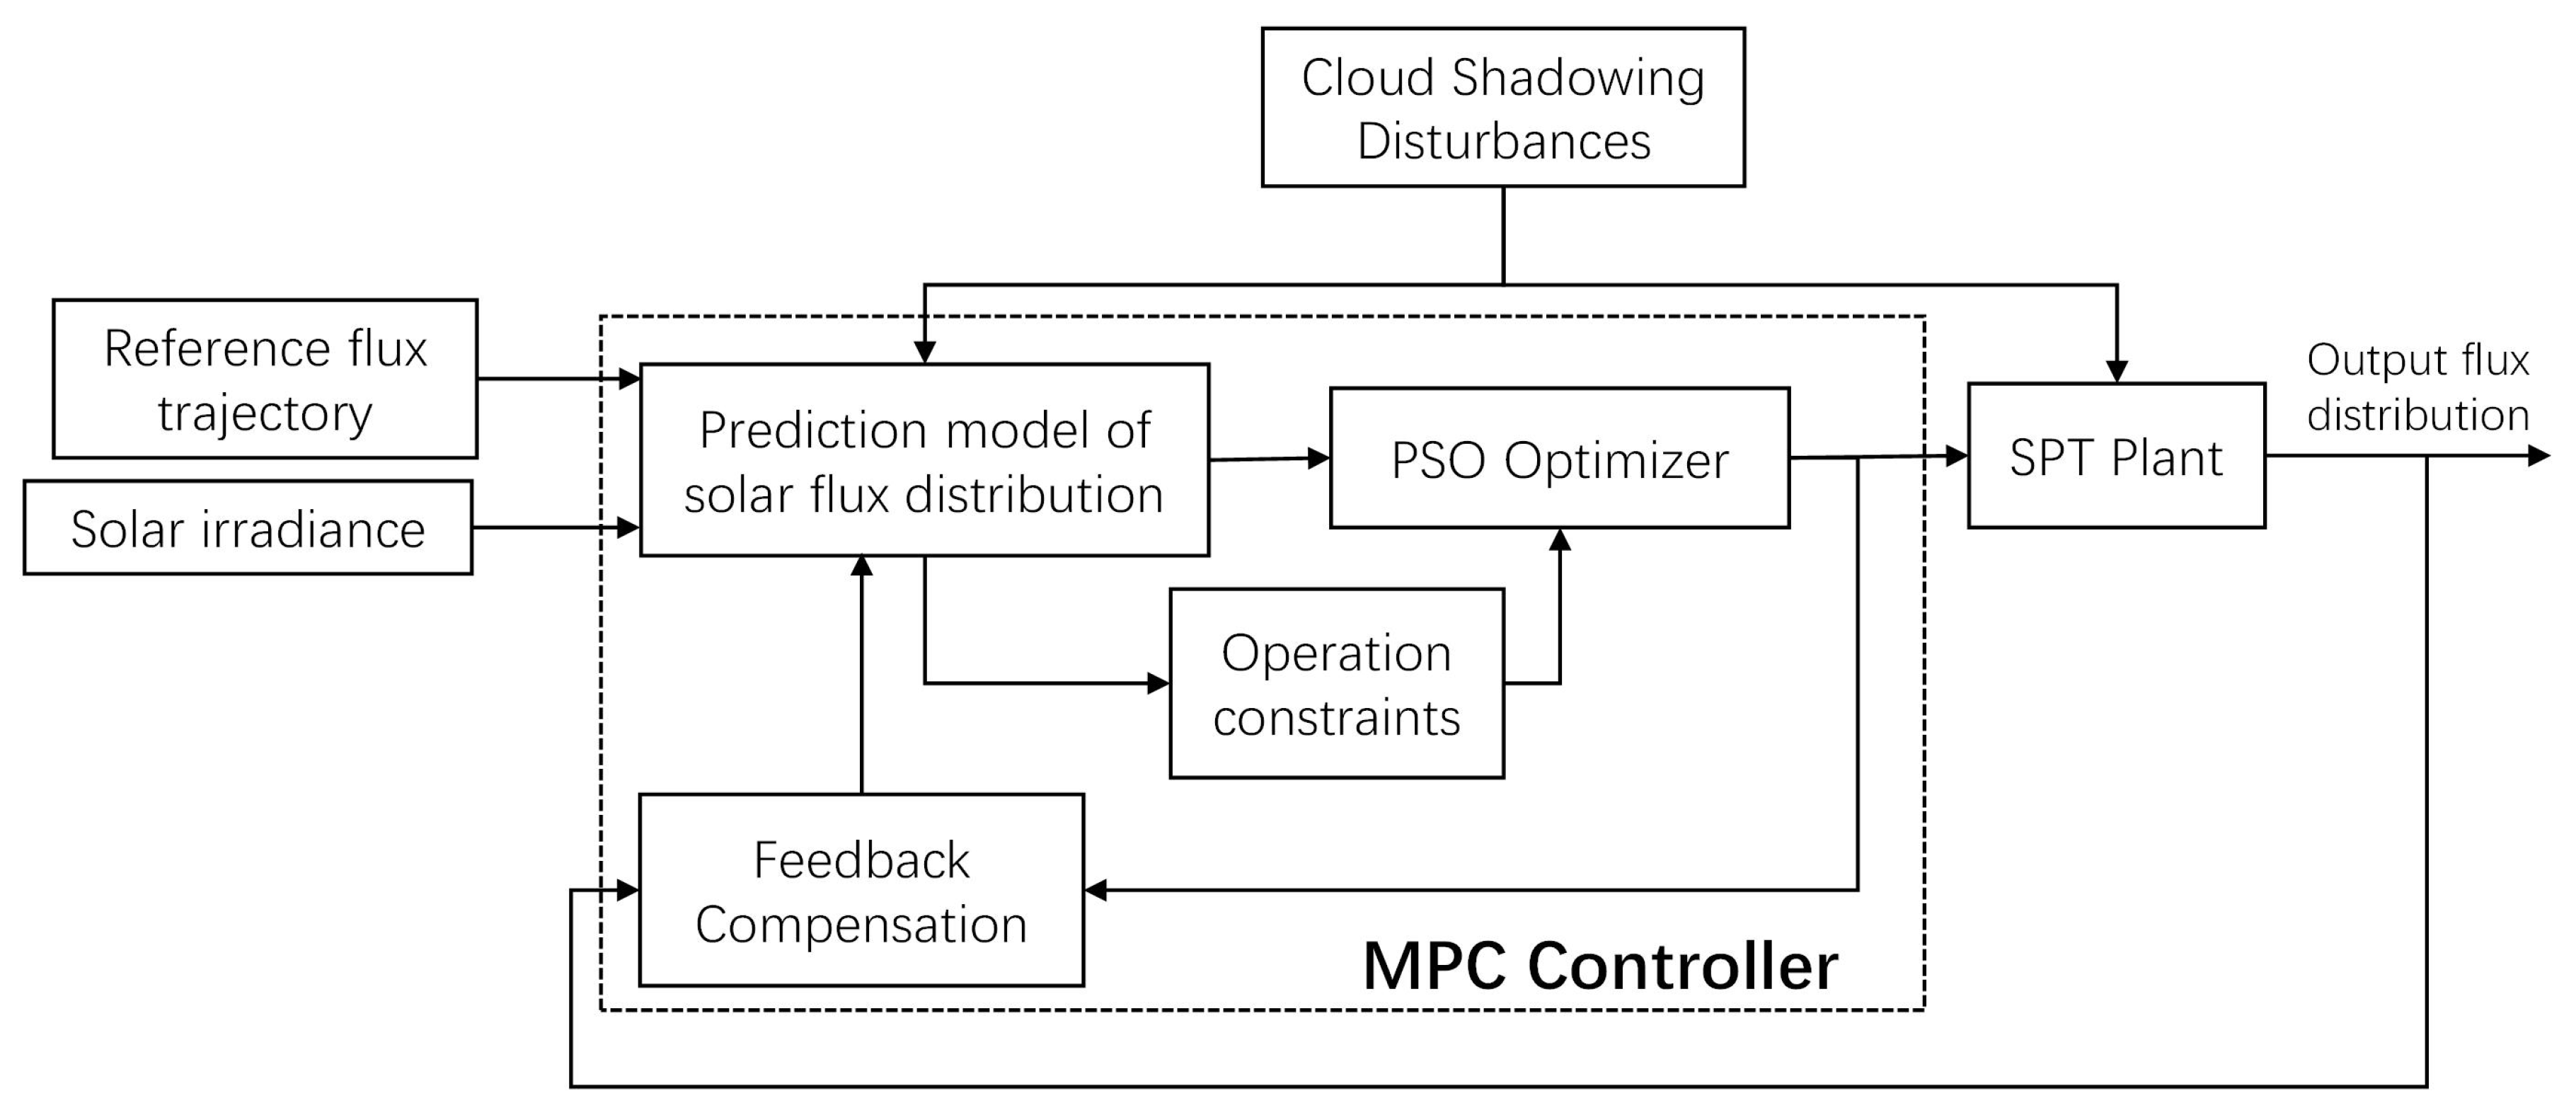
2.2. MPC Formulation

MPC is a model-based optimal control method applied in the process industries in recent years [31]. The MPC controller exploits the explicit model of the process to predict the future evolution of the system outputs and obtain control actions by solving an open-loop optimization problem [32,33]. MPC control schemes usually have better performance than non-model-based control schemes and can handle constraints explicitly and effectively.
At each control interval, the optimization formulation is constructed in terms of both the current and future information by a finite prediction horizon and solved iteratively over the horizon. When minimizing the given criterion, the predicted control actions with intervals ahead corresponding to the prediction horizon are acquired satisfying the constraints. Let k denote the current control interval and k + n | k indicate control interval k + n that depends on information up to and including interval k. A typical MPC framework is expressed as an optimization problem in Equation (2).
min n = 0 P 1 l k + n | k ( x k + n | k , y k + n | k , u k + n | k ) s . t . x k + n | k X k + n | k y k + n | k Y k + n | k u k + n | k U k + n | k ( k = 0 , 1 , 2 , P 1 ) . x k + 1 = f ( x k , u k ) y k = g ( x k )
x k + n | k , y k + n | k and u k + n | k represent the states, outputs, and manipulated inputs, respectively. X k + n | k , Y k + n | k and U k + n | k denote the constraint sets, respectively, for x k + n | k , y k + n | k and u k + n | k .
Figure 3 shows a schematic diagram of the heliostat field power regulatory aiming strategy based on the MPC approach. In terms of the heliostat field power regulatory aiming strategy, the MPC mainly relies upon a prediction model of the solar flux distribution and a PSO optimization tool of the aiming strategy with operation constraints, combined with a feedback compensation module. The prediction model receives the solar irradiance input and gives the predicted solar flux distribution based on the cloud shadowing forecasts. The aiming strategy optimization using the predicted solar flux distribution obtains the optimal aiming adjustment plan of angle variations to the heliostats, which aims to make the total received solar flux follow the reference trajectory under the constraints of the AFD and the heliostat adjustments. The aiming adjustment plan at the current control interval is formulated for the following several sampling intervals corresponding to the prediction horizon. Additionally, the SPT plant only implements the first step of the aiming plan. The procedure is performed iteratively at the next control interval. As there are various uncertainties occurred in the real plant, leading to solar flux distribution deviating from the desired one, a feedback compensation method is added in the control scheme. The feedback compensation obtains the prediction model error by the measured solar flux distribution of the plant output, and provides the modified predicted solar flux distribution to the optimizer for the aiming strategy optimization.
The MPC approach of the heliostat field power regulatory aiming strategy is formulated as Equation (3). The MPC-based aiming strategy is a non-linear system and the dimension corresponds to the number of the heliostats p. The manipulated variables u k indicate the heliostat aiming adjustments Z and are restricted by the heliostat adjustment limit α . The states x k indicate the heliostat aiming states after adjustments. The outputs y k indicate the flux densities F ( Z ) in the pixels of the solar flux distribution and are restricted by the AFD limits AFD k + n | k .
min n = 0 P 1 y k + n | k y k + n | k , ref 2 s . t . α u k + n | k , h α ( h = 1 , 2 , 3 , , p ) y k + n | k AFD k + n | k x k + 1 = x k + u k y k = g ( x k ) ( k = 0 , 1 , 2 , P 1 ) .
The aiming strategy optimization of the MPC controller is expressed as Equation (4). The total received solar flux Q k + n | k derived by the flux distribution F k + n | k ( Z k + n | k ) which represents the output y k + n | k is required to follow the reference trajectory flux Q k + n , r e f for simplicity. The aiming strategy Z k + n | k representing the vector of heliostat aiming adjustments provides the manipulated inputs u k + n | k for the control interval k. P is the prediction horizon. The MPC controller deals with the restrictions in two forms: soft and hard constraints. Since the heliostat adjustments are physically restricted, they are implemented as hard constraints which are not allowed to be violated. The AFD limits are for plant operation safety and are, thus, treated as soft constraints. The soft constraints are not as mandatory as hard constraints, which cannot be violated. Penalty function Φ k + n | k is included in the cost function to avoid the AFD limit being exceeded, which is a common way to cope with such constraints. Additional constraints of interest can be imposed on the aiming strategy optimization formulation if needed.
min n = 0 P 1 Q k + n | k ( Z k + n | k ) Q k + n , r e f 2 + Φ k + n | k F k + n | k ( Z k + n | k ) , A F D k + n | k ( Z k + n | k ) s . t . α z k + n | k , h α ( h = 1 , 2 , 3 , , p ) .

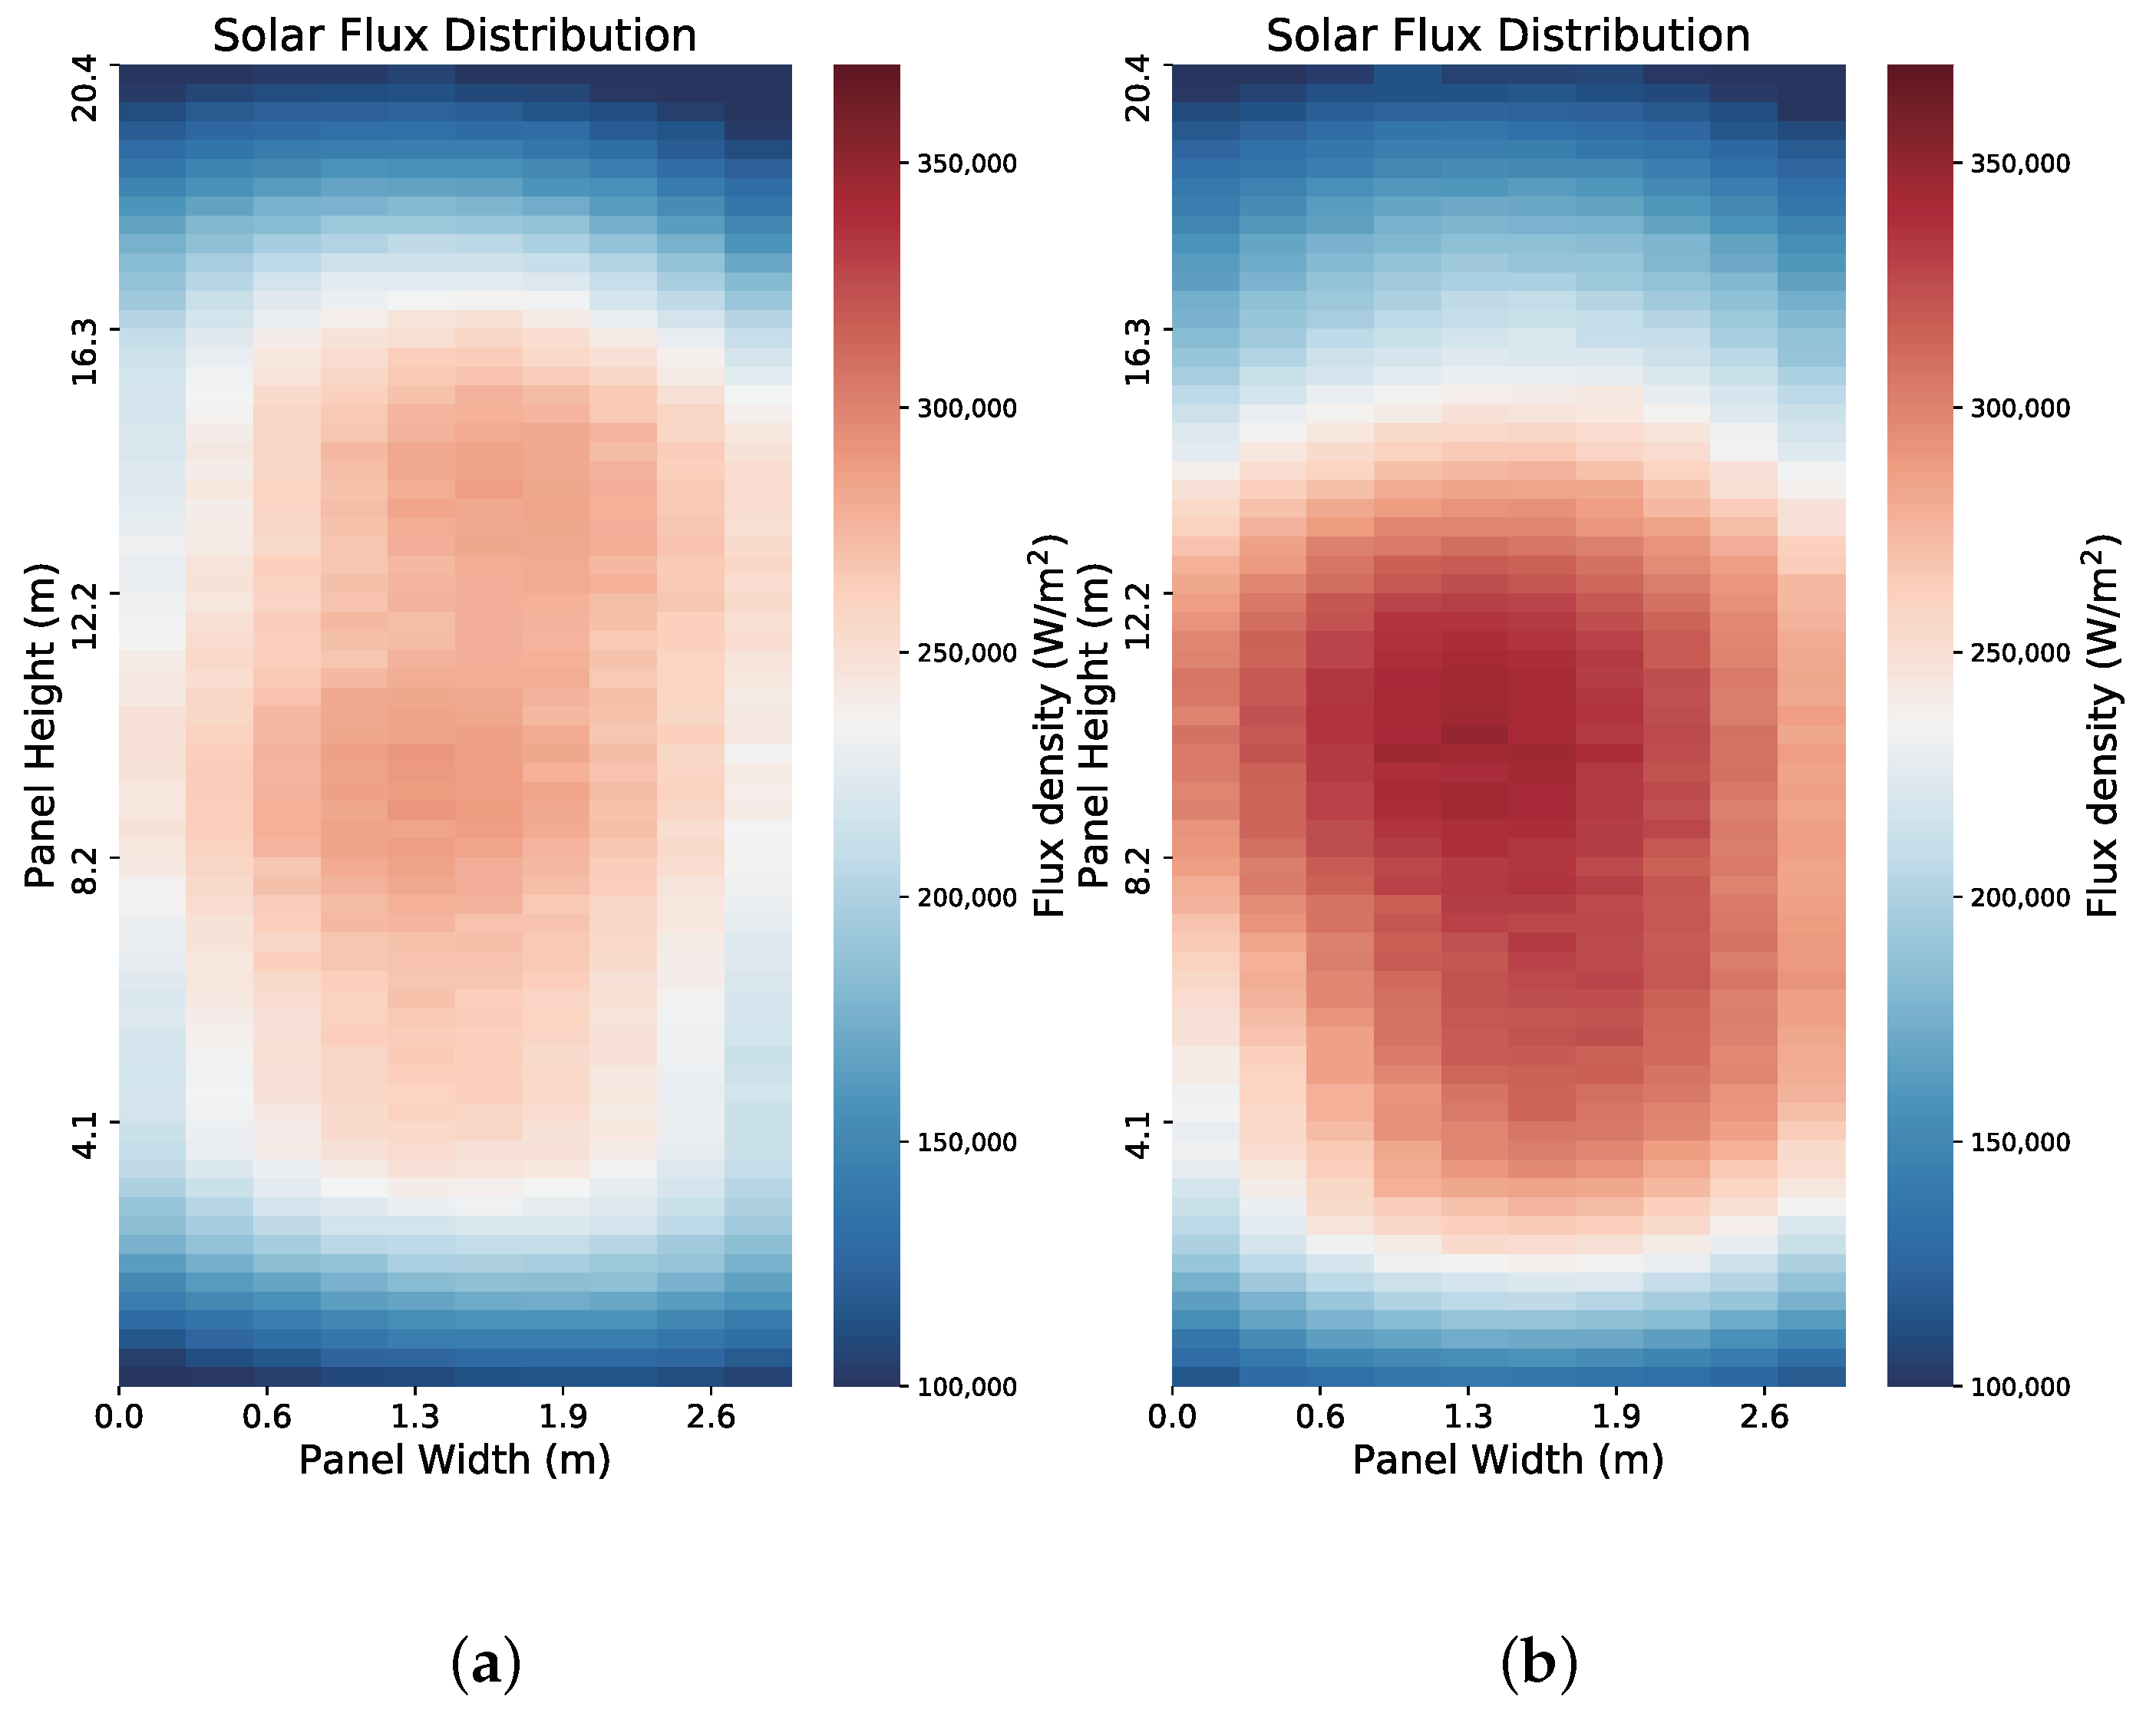
2.3. Solar Flux Distribution Calculation

The aiming strategy rests first of all on the solar flux distribution calculation that makes up the solar flux distribution prediction model. The solar flux distribution depends on the full geometry of the solar power plant, including the heliostat spectral and structural properties. The cloud shadowing forecast provides irradiance levels to determine the radiation of solar rays received by each heliostat. Solstice is adopted here to obtain the solar flux distributions [34]. Solstice is a simulation tool for the concentrated solar power plant that computes the collected power by statistical sampling for the solar rays based on the Monte Carlo ray tracing (MCRT) method [35,36]. Referring to the most used method of aiming strategy model, the total solar flux distribution used here is formed by superimposing the single-heliostat flux distributions that are pre-simulated in order to reduce the time consumption of the flux distribution simulation. The offline data of single-heliostat flux distributions considered different aiming positions of 0.2 m apart vertically.
Apart from the losses due to the cosine effect, surface reflectivity, and atmosphere absorption evaluated by Solstice, the shadowing effect among the heliostats is further considered by adding eight heliostats around the specified heliostat with eight nearest relative distances in the simulation. The shadowing effect indicates the shading and blocking loss of the heliostat in the field. The shading loss is occurred when the receiving sun lights are shaded by the surrounding heliostats. Additionally, the reflected lights can also be blocked by the surrounding heliostats, which generates the blocking loss. Thus, to consider the shadowing effect in the heliostat field simulation, the surrounding heliostats are set as fully absorption surfaces without reflectivity and aimed at the equator of the receiver [37]. The differences in the results caused by the aiming position variation of the surrounding heliostats change minimally and thereby can be neglected [37]. Then the solar flux distribution is generated only by the solar rays reflected from the specified heliostat while considering the shading and blocking of the heliostats surrounded.

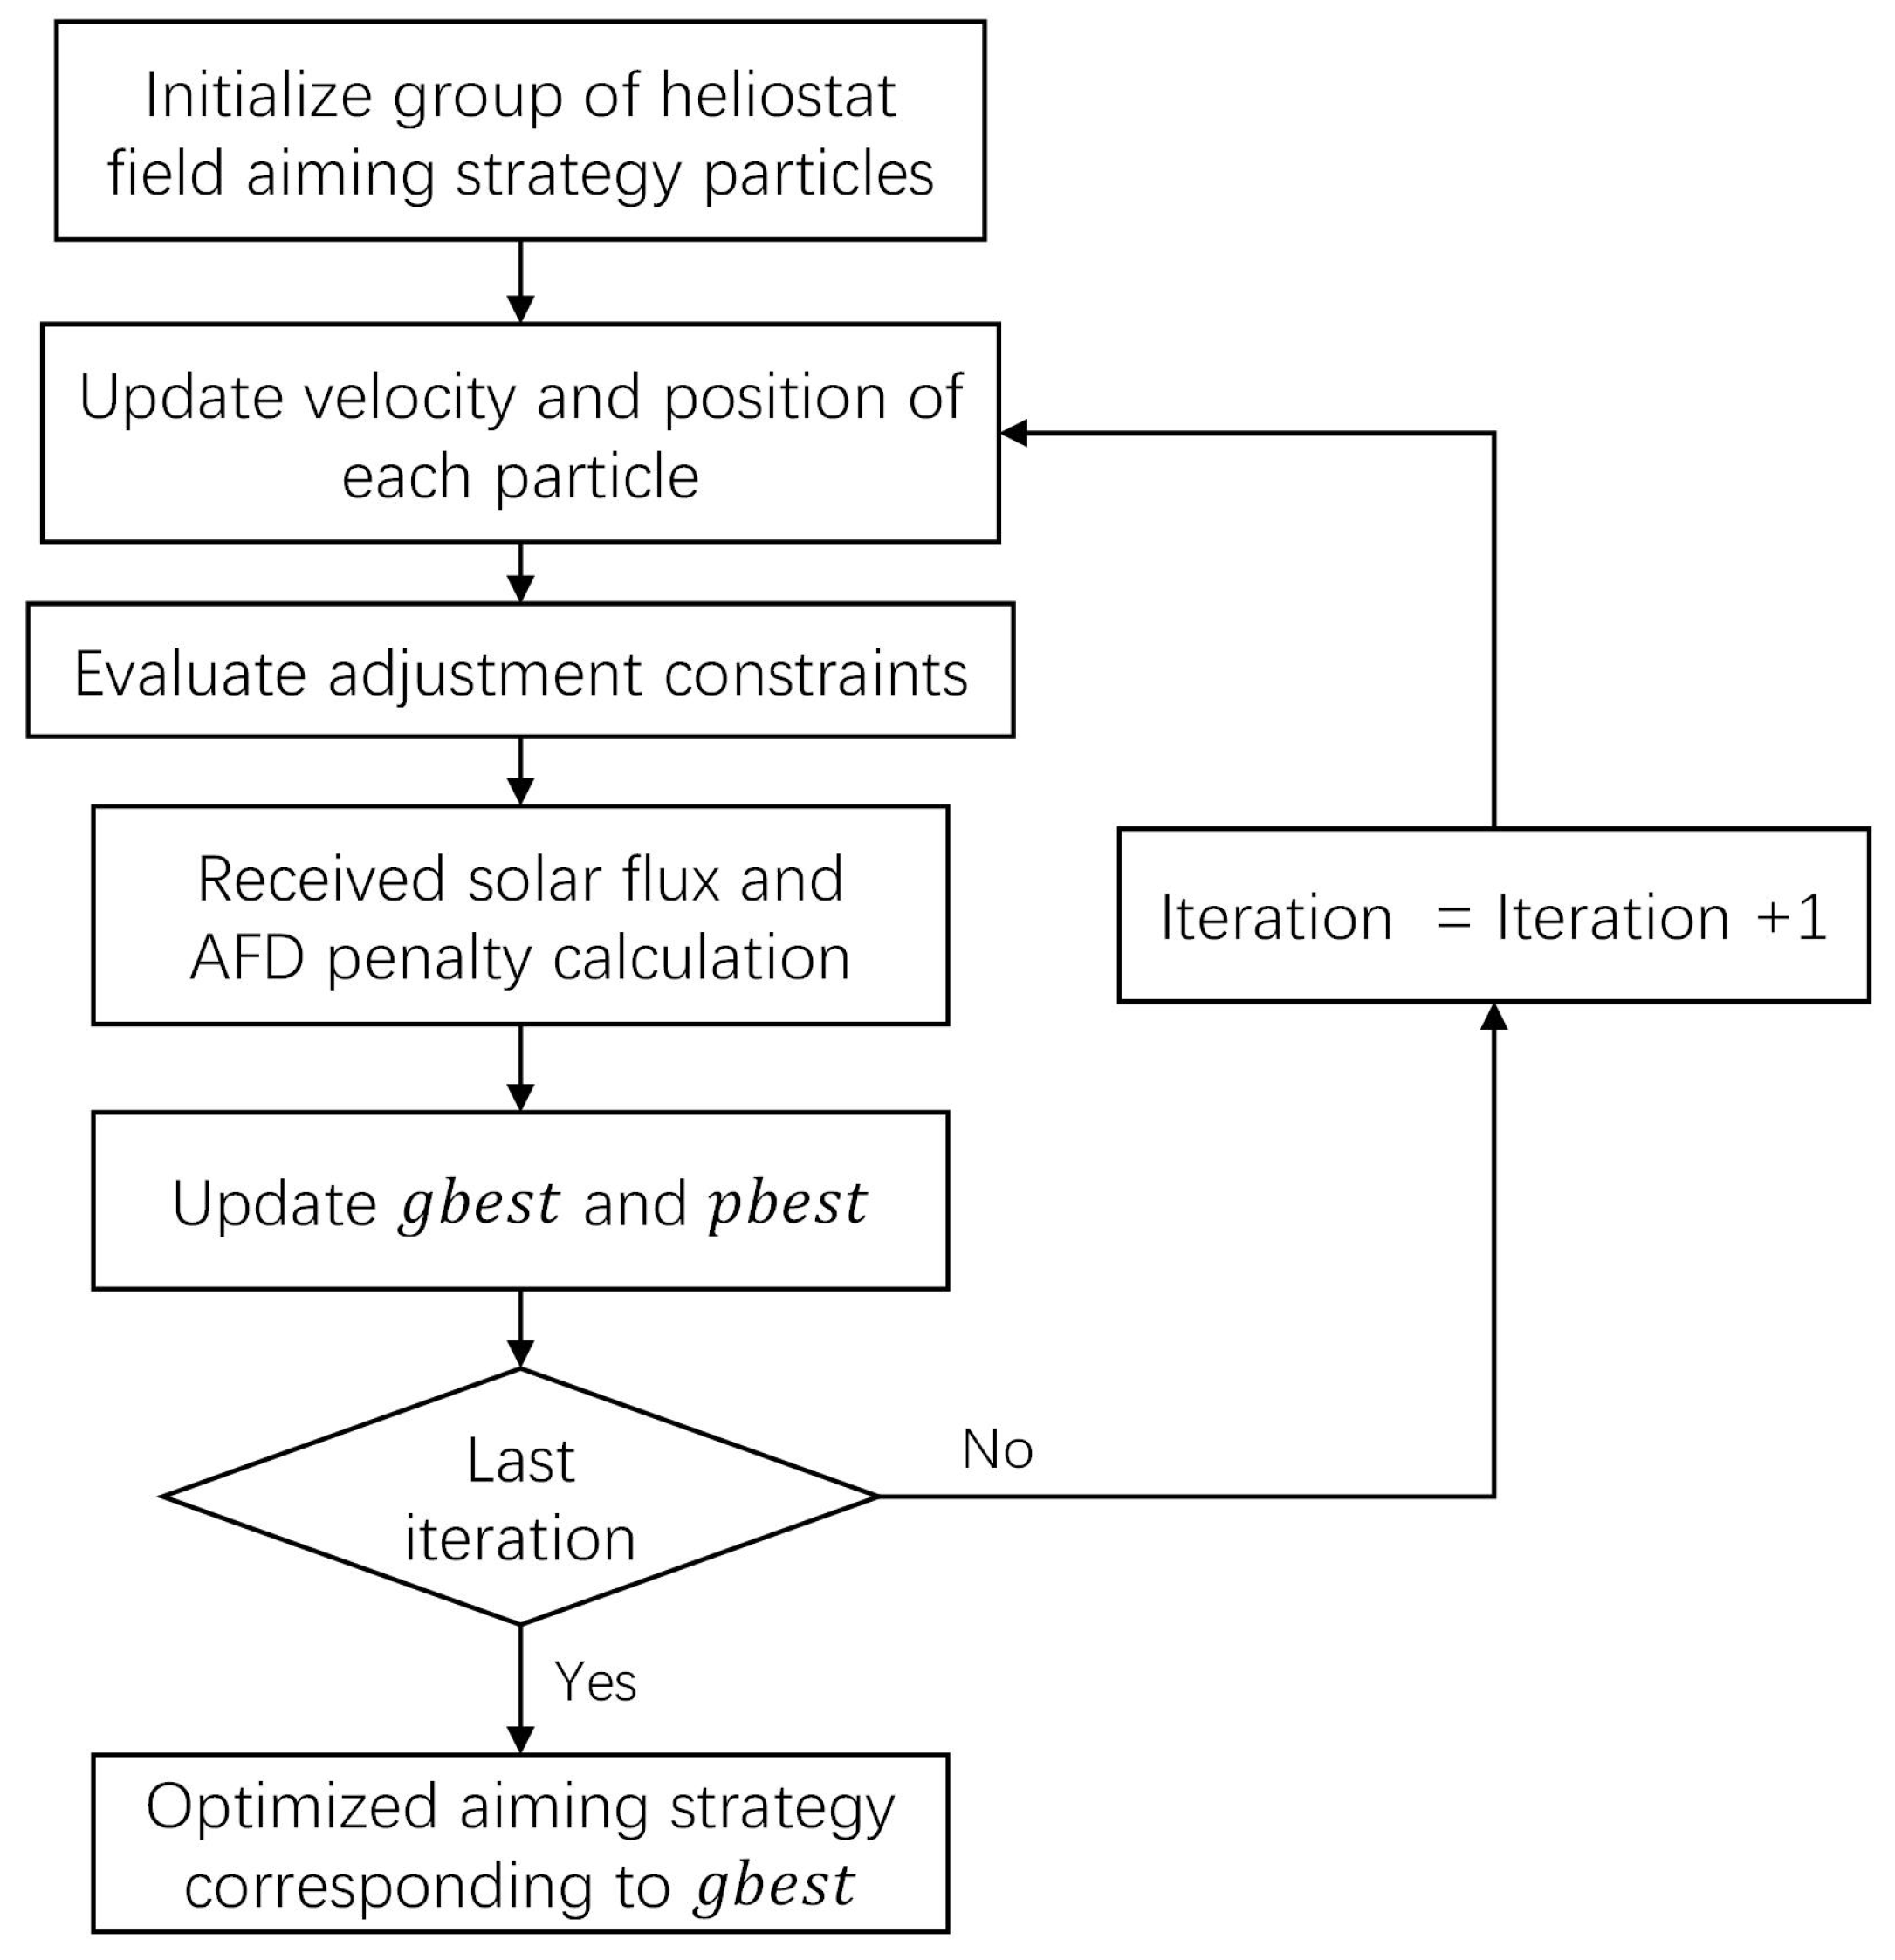
2.4. Particle Swarm Optimization Algorithm

PSO is a bio-inspired heuristic algorithm that mimics the social behaviors of collaborative searching, initially developed in 1995 for non-linear optimization problems [38,39]. The searching process is inspired by social learning and conducted by a population corresponding to individuals [40]. The searching direction incorporates the individual explorations of their own, as well as the population experiences, with a balance of the social aspect of intelligence and the individual cognitive. In addition, it is a non-gradient-based optimizer where only the cost function is necessary. As the aiming strategy problem is formed as a non-linear optimization problem and hard to be derived, PSO algorithm is flexible for the problem solving.
A flow chart of the PSO algorithm for the heliostat field aiming strategy is shown in Figure 4. For the aiming strategy optimization problem with a p dimensional space corresponding to the amount of the heliostats, particle s has the position vector Z s = [ z s , 1 , z s , 2 , , z s , p ] and the velocity vector V s = [ v s , 1 , v s , 2 , , v s , p ] . In this problem, the position vector Z s indicates a possible heliostat field aiming strategy Z . The position and velocity of heliostat h at iteration t will be updated according to the following rules in Equations (5) and (6) [41].
v s , h t + 1 = χ ω t v s , h t + c 1 r 1 t ( p b e s t s , h z s , h t ) + c 2 r 2 t ( g b e s t h z s , h t ) ( h = 1 , 2 , 3 , , p )
z s , h t + 1 = z s , h t + v s , h t + 1 ( h = 1 , 2 , 3 , , p )
p b e s t s , h is referred to as the “personal best” of particle s representing the best position of the specific individual, while g b e s t h is referred to as the “global best” representing the best solution achieved so far by the swarm. r 1 t and r 2 t are randomly generated from the range of [0,1]. c 1 and c 2 are positive constants representing the cognitive coefficient and social coefficient respectively, balancing the experiences of individual and social for the searching step modulation of the particle. χ represents the constriction factor [41]. ω t is the inertia weight expressed in Equation (7) with linear decreasing to firstly benefit the global searching and then the local searching as the iterations increase.
ω t = ω m a x ω m a x ω m i n t m a x t
ω m a x represents the maximum inertia constant while ω m i n is the minimum. t m a x is the total iteration number.
The heliostat aiming adjustment limits as hard constraints are treated by restricting the particle positions. The AFD limits are added to the cost function as penalty terms combined. The penalty Φ is formulated in Equations (8) and (9) [41].
Φ s = t i j θ ( q i , j ( Z s ) ) q i , j ( Z s ) γ ( q i , j ( Z s ) ) .
q i , j ( Z s ) = m a x 0 , F i , j ( Z s ) A F D i , j ( Z s )
q i , j ( Z s ) is a relative violated function. θ ( q i , j ( Z s ) ) and γ ( q i , j ( Z s ) ) are the multi-stage assignment function and the power of the penalty function, respectively, formulating as [41] mentioned. In this work, both the c 1 and c 2 are set at 2; ω m a x is 1.2, while ω m i n is 0.1; χ is 0.73, and they were default value selected according to [41]. By iteratively implementing the process, the best solution for the heliostat field aiming strategy is obtained from the g b e s t .

2.5. Feedback Compensation

The MPC-based power regulatory aiming strategy is able to reduce the impact of the deviation by feedback compensation for the solar flux distribution. The actual operation of the system may deviate from the desired optimization results due to various uncertainties, such as model mismatch and unknowable perturbations that inevitably exist in real systems. MPC can compensate to some extent for the effects of various uncertainties by a closed-loop feedback approach. At each sampling instant, the heliostat field output will be first detected to obtain the measured solar flux distribution used as feedback information to correct the predicted solar flux distribution in the next control interval before the manipulated actions are optimally solved. Before the MPC-based aiming strategy optimizing the aiming adjustments at control interval k + 1 , the actual output solar flux distribution F k + 1 , m will be measured and compared with the model predicted output F k + 1 | k , which constitutes the output error. This error information reflects model uncertainty effects on the output solar flux distribution and is used to predict future output errors to complement the model-based predictions. Let F c o r denote the output of the modified predictive model and w denote the weighting factor for the correction. The correction formula is expressed in Equation (10).
F k + n | k + 1 , c o r = F k + n | k + 1 + w n ( F k + 1 , m F k + 1 | k ) ( n = 1 , 2 , 3 , , P )
Thus, the modified total received solar flux Q k + n | k + 1 , c o r will be calculated through F k + n | k + 1 , c o r , ( i , j ) and S i , j as previously expressed, constructing the objective function as the output term Q k + n | k + 1 which has been modified by feedback compensation. The optimization of MPC is carried out with the corrected output of the solar flux distribution prediction model. The feedback compensation thus allows the optimization of each control interval to be based on a closer approximation to reality.

3. Experiments and Results

A Noor III-like heliostat field was carried out, including a cylindrical external receiver to validate the proposed aiming strategy [30,42]. The field is divided into 18 sectors, corresponding to the 18 panels of the receiver. With limited computational resources, Sector 3 at the northeast corner was chosen for validation, as its angle had less typical relationships with respect to the direction of the rays. There are 474 heliostats in Sector 3, and their aiming points are shifted on the panel directly facing Sector 3. The parameters of the heliostat and the receiver are shown in Table 1. The solar noon of the equinox was chosen as the simulation moment. The elevation and azimuthal angles of the sun were calculated regarding the geographical location of the Noor III plant [43]. The ground shadow data were derived from processed realistic all-sky cloud map photos, with clouds at about 1000 m to 2500 m high. The sample time was set to 30 s and corresponded to the interval between the cloud map shots. The field shadow distribution was binarized for simplicity of presenting the methodology, with a solar irradiance level of 100 W / m 2 in the shadow and 950 W / m 2 elsewhere [27]. The computing grid on the panel was 70 × 10 . The heliostat adjustment constraint was set to 0.157 deg. The pixels of AFD limits were formed empirically as 1.3 times the average flux density of the solar flux distribution for simplicity to introduce the overall scheme. The correction coefficient was set to 1 in the feedback compensation method.

3.1. Methods in Comparison

In this study, three aiming strategies were included for comparison.
Strategy 1. 
PSO-based aiming strategy. The optimization was carried out with corresponding solar irradiance for each control interval in the scenario. The aiming strategy only concerned the weather condition at the current control interval without predicting subsequent behaviors. Moreover, the constraints of heliostat aiming adjustment were not taken into account. For more practical, the PSO algorithm adopted the aiming strategy of the previous control interval as the starting point for current optimization.
Strategy 2. 
MPC-based power regulatory aiming strategy. The dynamic heliostat field aiming strategy accounted for the cloud shadowing forecasts in the cloud variation scenarios. The MPC controller provided optimized aiming strategies based on the predicted solar flux distribution. The heliostat adjustment limits were structured as hard constraints in the control scheme.
Strategy 3. 
Static aiming strategy. The heliostat field aiming strategy was optimized under the weather condition of the initial time in the scenario, and remained constant while the cloud passed over the field.
All the strategies have the same optimization objective of flux trajectory tracking. At the same time, they shared the same initial optimized aiming strategy at the start of the scenario. An example scenario of the shadows passing over the field sector is shown in Figure 5, which is adopted to analyze the performances of the aiming strategies. A generated solar flux distribution example on the panel is shown in Figure 6.
The effect of prediction horizon of the MPC-based aiming strategy was investigated in the example scenario by comparing the reference trajectory tracking performances with different prediction horizons. The intercepted flux curve in Figure 7 represents the total solar flux intercepted by the heliostats in the field, reflecting the shadowing variation. P indicates the prediction horizon. The reference flux was set as 1.5 × 10 7 W. As the prediction horizon increased, the system obtained more information about the future cloud shadowing variation. The aiming strategy at the current control interval became forward-looking, as the optimization included more predicted solar flux distributions of the future control intervals. Thus, it benefited the smoothness of the output flux fluctuation over a long period by repeated optimization. The longer prediction horizon generally achieved smoother fluctuations, as is indicated in Figure 7. However, the number of manipulated variables that participated in the optimization also scales with the increased prediction horizon, leading to excessive time consumed in calculations. In this study, P = 1 was set in the strategy comparison for simplicity. The solution of each control interval could be computed in about 15 s using an AMD Ryzen 9 processor with 3.8 GHz and 64 GB random-access memory, while costing about 10 s by the PSO-based aiming strategy. The computation time of the aiming strategies are below the control interval time as 30 s, while it is able to achieve the real-time control.

3.2. Single Case Study

The total received solar flux on the panel was compared to evaluate the performances of reference trajectory tracking. The effect of cloud shadowing on the heliostat field output corresponds to the trend of intercepted flux. The available solar radiation decreases significantly when the shadowing coverage of the field increases. Figure 8 shows the performance comparison of the three aiming strategies in the example scenario. The static aiming strategy deviates significantly from the reference trajectory before the time at about 600 s, due to the weather variation as the intercepted flux curve shows. The performance improved in the subsequent time as the weather gradually returned to clear, for the strategy was optimized based on a clear-sky condition corresponding to the initial time in this scenario. In contrast, the PSO-based aiming strategy outperforms the static strategy before the time at about 600 s, as the PSO-based strategy optimized the heliostat field aiming strategy with real-time shadowing variation conditions. However, the PSO-based strategy produced the solar flux output deviated significantly from the reference value in the subsequent time. This is because the heliostat adjustment limits were not taken into account, many heliostats could not rotate to the specified adjustment angles as required by the strategy. Over time, the aiming of the heliostats continued to deviate from the specified strategy, causing the output solar flux to deviate significantly from the reference trajectory.
Figure 9 illustrates the extent to which the heliostats within the sector exceed the specified aiming position at an example control interval of the PSO-based and MPC-based aiming strategies. As the static strategy is a fixed strategy without aiming angle variation, only the first two strategies were compared. All heliostats using the MPC approach completely followed the aiming strategy, while over half of the heliostats could not be rotated to the specified position with the PSO-based aiming strategy. As a result, with the PSO-based strategy, the solar flux obtained on the receiver panel deviated from the desired effect when the solar irradiance intercepted by the heliostats had been raised. Consequently, the total absorbed solar flux failed to fall back to the reference flux value for a long time. The MPC-based aiming strategy considered the continuity of the heliostat aiming angle adjustments during the disturbance period so that the heliostats were able to achieve the indicated aiming adjustments at each control interval. When the field interception flux dropped below a critical point, the total absorbed solar flux was inadequate to reach the reference in spite of all the heliostats focusing on the receiver panel with minimum spillage. In such cases, both aiming strategies generated solar flux that reduced in parallel with the decreasing field intercepted flux. The aiming strategies still followed the reference trajectory as closely as possible by providing the maximum solar flux. The MPC-based aiming strategy outperforms the other two strategies overall due to including both shadowing forecasts and the heliostat adjustment restrictions.
The effect of the AFD constraints was compared by analyzing the exceeding solar power of the three aiming strategies, which indicated the overall information of the flux densities exceeding the permitted limit, reflecting the operation safety. The comparison was also conducted with the example scenario. As is shown in Figure 10, the three curves indicate the solar power that exceeds the AFD limits of the corresponding solar flux distribution. A high intercepted flux indicates a low level of cloud shadowing cover. In the first half of the time period, the cloud shadowing passing over the heliostat field gradually increased to the point where the intercepted flux was too low to meet the reference flux, and thus all three strategies exceeded the AFD limits to varying degrees. Since the static strategy was optimized under the clear-sky condition of the initial time, the constraint effect of the AFD was restored as the intercepted flux increased. The PSO-based aiming strategy had a significantly worse performance than the others over the entire time period. With the heliostat not rotating in place, the corresponding aiming point did not completely move away from the overheated area as the strategy required. After the intercepted flux has picked up, it took a few time for the PSO-based strategy to generate the solar flux distribution fully satisfying the AFD limits. The MPC-based aiming strategy allows the solar flux distribution to essentially satisfy the AFD constraints, thus ensuring the operation safety.

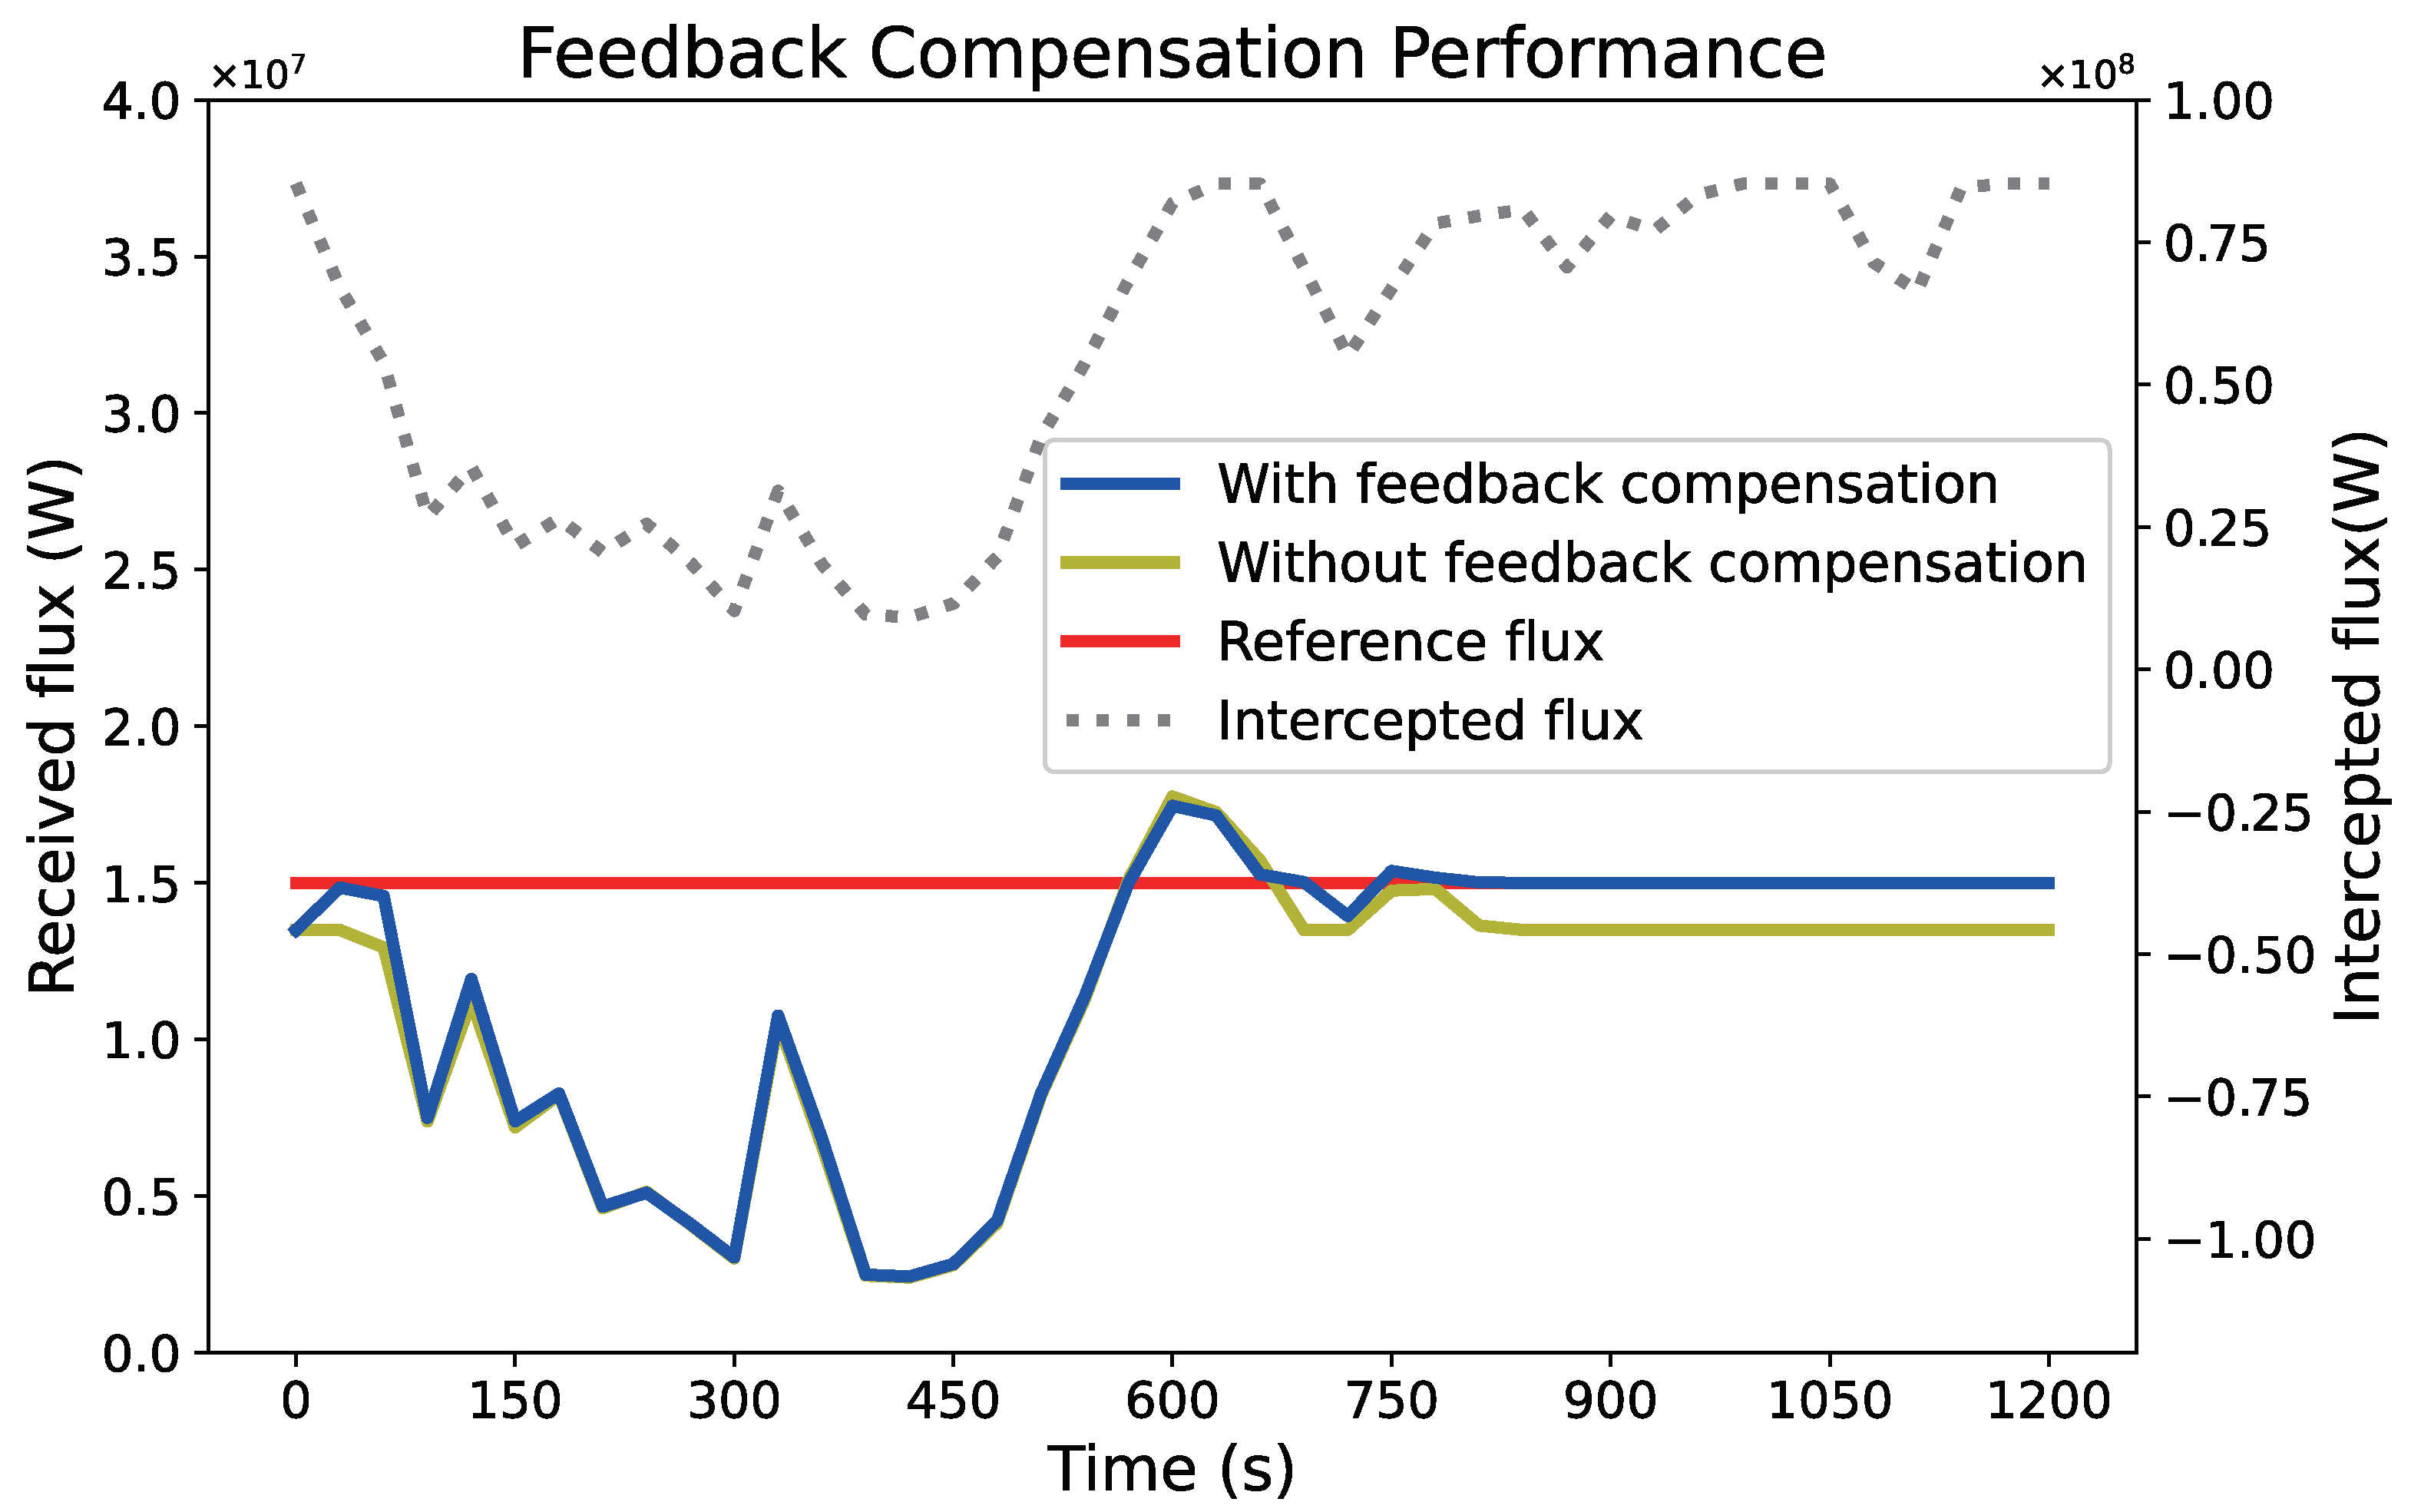
3.3. Feedback Compensation Performance

A simple validation was carried out to demonstrate the effectiveness of the feedback compensation method. In order to introduce the error information between the plant output and the predicted solar flux distribution, it was assumed that the actual flux distribution received by the receiver is only 90% of that estimated by the heliostat field. The performances of the total absorbed solar flux with and without the feedback compensation of the MPC-based aiming strategy were evaluated through the example scenario, as is shown in Figure 11. The strategy without feedback compensation produced the total received solar flux that had an error with respect to the reference trajectory. The error is caused by the impacts of various uncertainties in real world applications, which makes the predicted solar flux distribution deviate from the plant output. The open-loop strategy conducted the subsequent optimization based on the inaccurate model predictions and thereby significantly impacting the output of the total received solar flux. By adding the feedback compensation, the total received flux had a better performance on tracking the reference flux trajectory. The MPC controller, with updating feedback information, achieved closed-loop optimization throughout the repeated optimization process, compensating to a certain extent for the impacts of various uncertainties. Figure 12 shows the example of the solar flux distributions obtained by MPC-based aiming strategy without and with feedback compensation at time = 1050 s of the example scenario. The strategy with feedback compensation generates the solar flux distribution with higher power corresponding to the performance in Figure 11. The results showed that the MPC-based power regulatory aiming strategy is able to reduce the impact of the deviation by feedback compensation for the solar flux distribution.

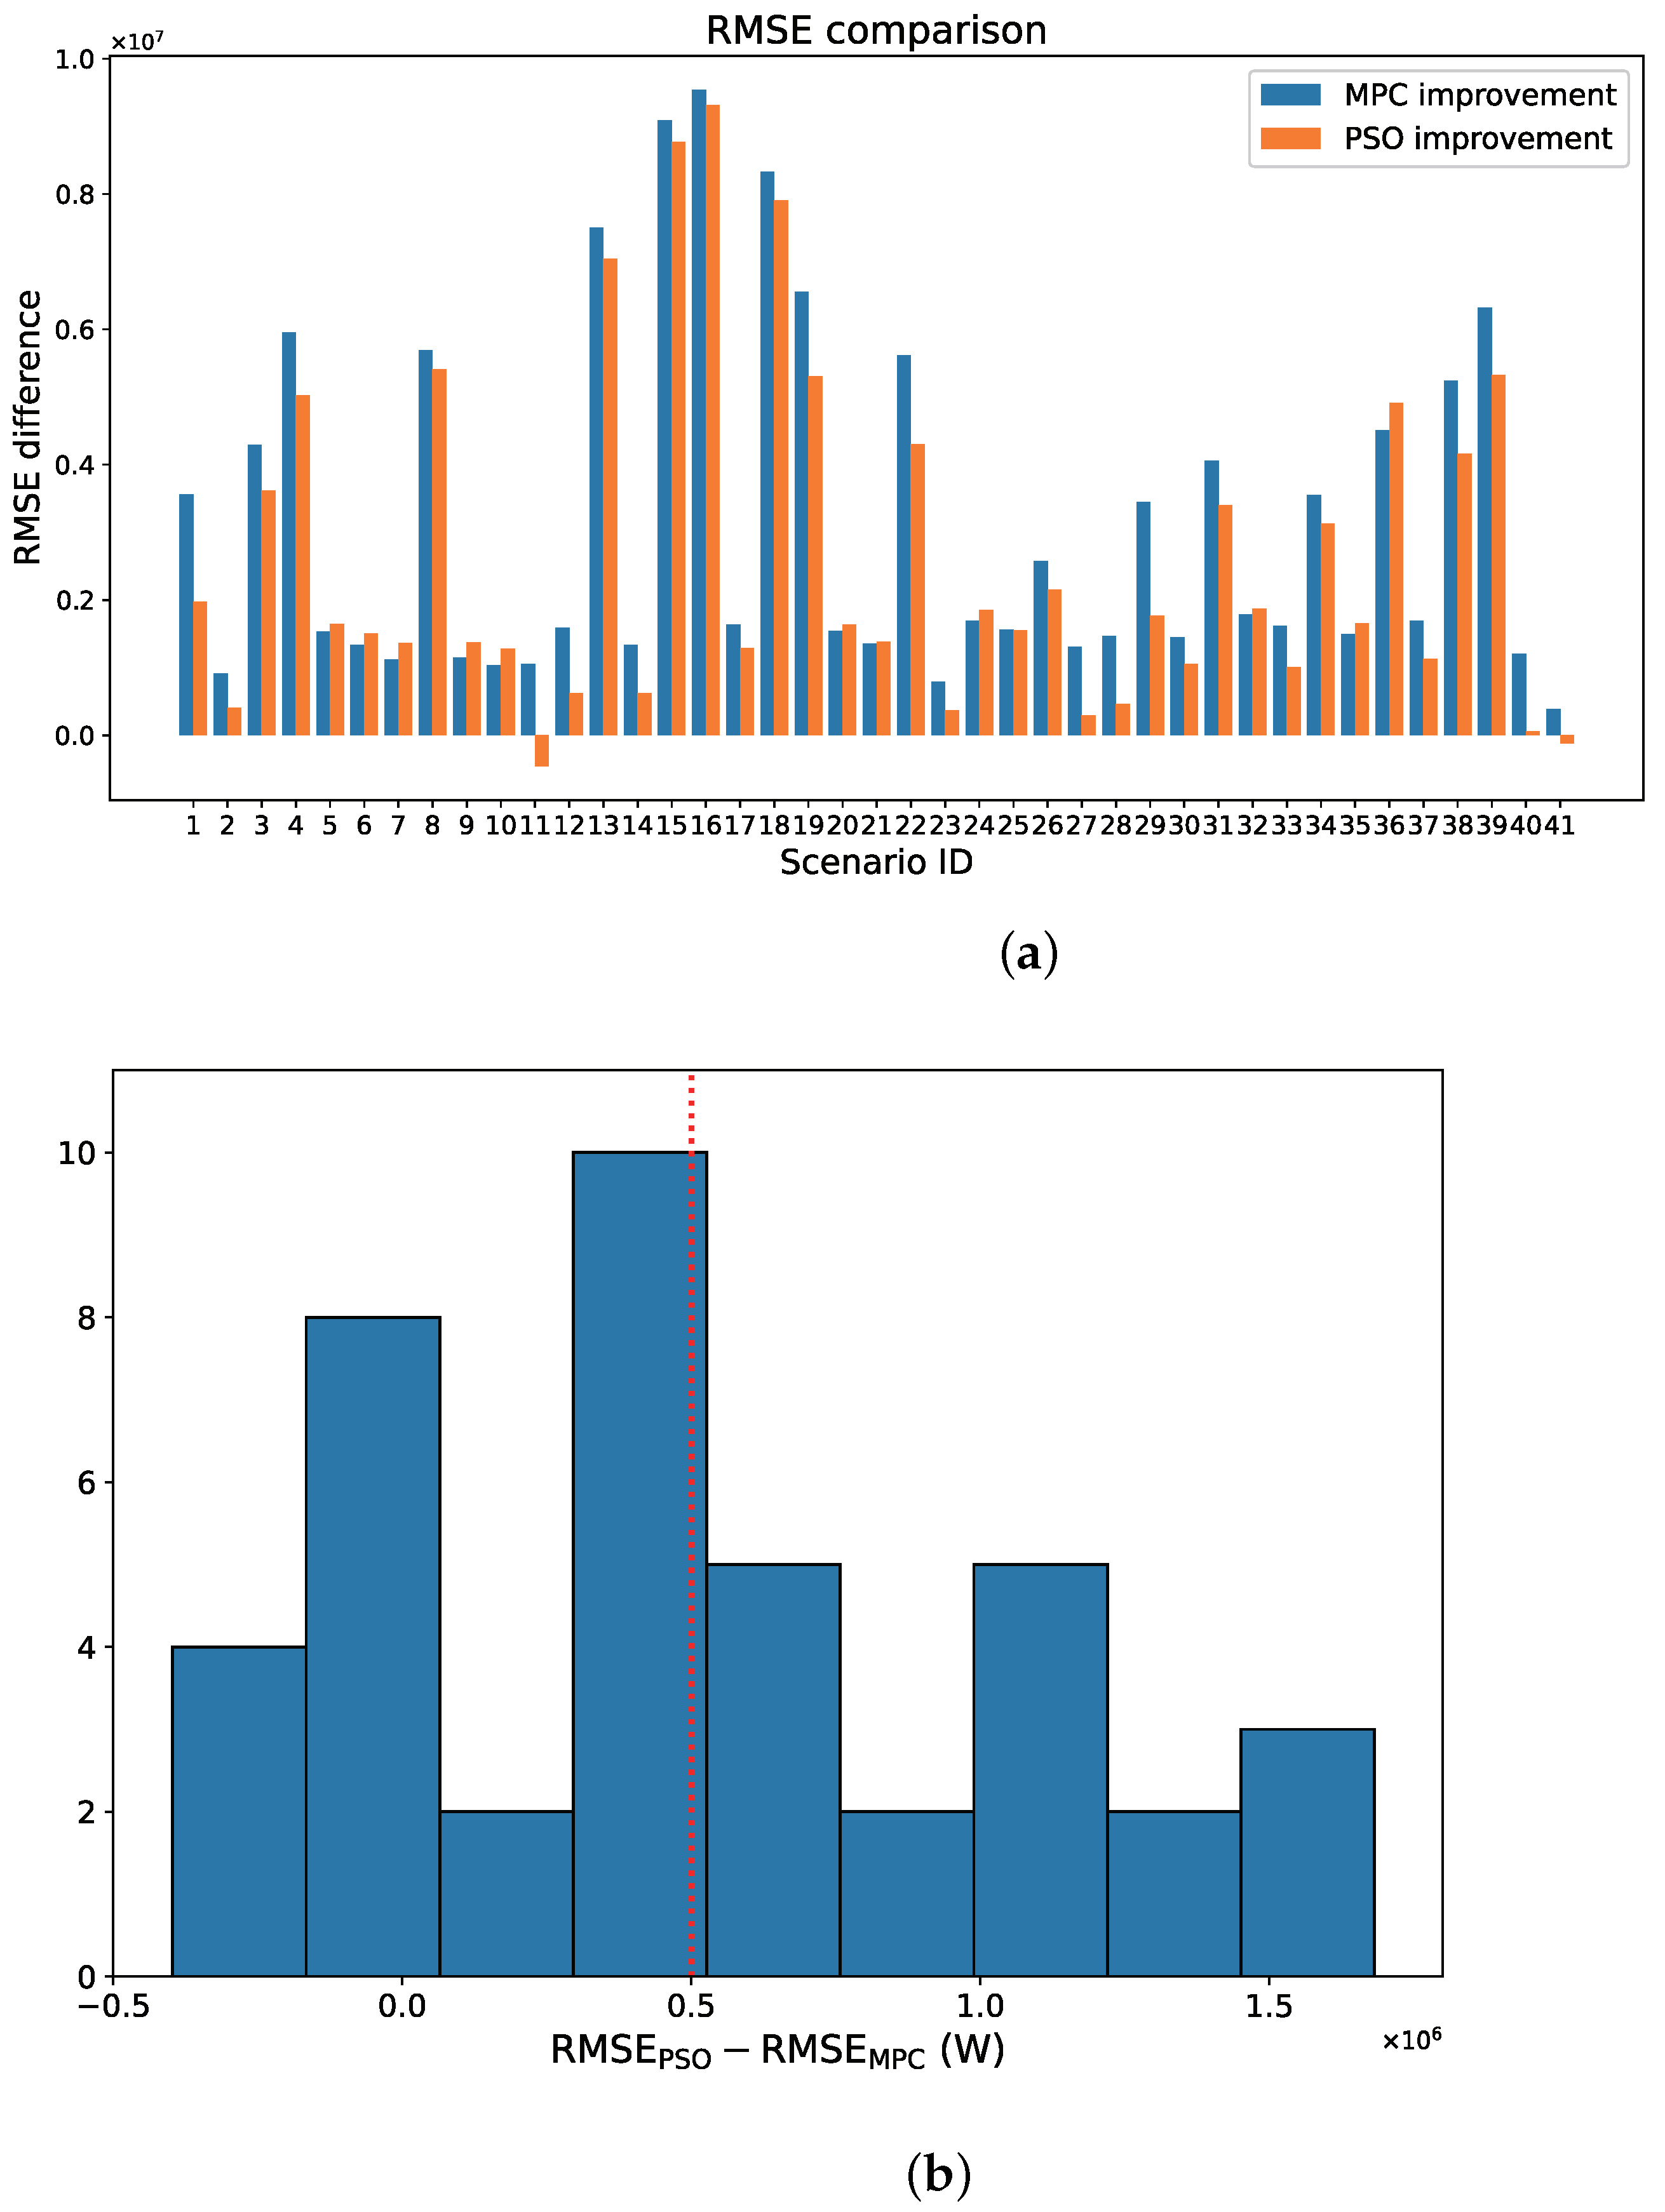
3.4. Real World Performance Evaluation

In order to evaluate the performance of the methodology in real world application on the various cloud conditions, 41 scenarios derived from all-sky images have been tested. The cloud moving speeds of scenarios are about 10 m / s to 50 m / s . For each scenario, the root mean square error (RMSE) of the three aiming strategies relative to the reference flux was calculated, respectively. Figure 13a shows the RMSE difference between the first two and the static strategy. Both optimized aiming strategies improved over the static strategy. The improvement levels vary among different scenarios due to different shadowing conditions. Figure 13b indicates the performance comparison between the first two aiming strategies. While a primary improvement from the dynamic aiming strategy is contributed by taking real-time cloud shadowing conditions into account, the proposed MPC strategy showed statistically significant improvement over PSO for about 0.5 × 10 3 kW for explicit consideration of the heliostat adjustment limits.

4. Conclusions

An MPC approach for power regulatory heliostat field aiming strategy was proposed in this paper to deal with disturbances caused by cloud shadowing conditions. The heliostat field aiming strategy regulated the concentrated solar power on the receiver to follow a reference flux trajectory. The MPC controller based on the solar concentration model leveraged the real-time and forecast cloud shadowing information to obtain the optimized aiming strategies. The heliostat adjustment limits were included in the optimization. The proposed aiming strategy successfully constrained the heliostat adjustment to less than about 0.157 deg in each control interval to limit the energy consumption. The feedback compensation is introduced in the aiming strategy. The module effectively compensated the error of the predicted solar flux distribution model and significantly improved the solar flux distribution output. A range of scenarios of cloud shadowing conditions were analyzed based on real data with three aiming strategies for comparison. The proposed MPC strategy showed about 0.5 ×   10 3 kW improvement over the PSO method by analyzing the scenarios. The results demonstrated the effectiveness of the proposed approach in coping with the varying cloud shadowing conditions. Further research could focus on the solar flux distribution measurement system in a real heliostat field and calibrating the prediction model in real-time to cope with the uncertainties. Additionally, the acceleration of the controller calculation is a matter of concern for large-scale heliostat fields.

Author Contributions

Conceptualization, D.N.; methodology, R.Z. and D.N.; software, R.Z.; validation, R.Z.; formal analysis, R.Z.; investigation, R.Z.; resources, D.N.; data curation, R.Z.; writing—original draft preparation, R.Z.; writing—review and editing, D.N. and R.Z.; visualization, R.Z.; supervision, D.N.; funding acquisition, D.N. All authors have read and agreed to the published version of the manuscript.

Funding

This research received financial support from National Key Research and Development Program of China (No. 2021YFF0500403).

Institutional Review Board Statement

Not applicable.

Informed Consent Statement

Not applicable.

Data Availability Statement

Not applicable.

Acknowledgments

The authors gratefully acknowledge the financial support from the National Key Research and Development Program of China Grant (No. 2021YFF0500403).

Conflicts of Interest

The authors declare no conflict of interest.

Abbreviations

SPTSolar Power Tower
MCRTMonte Carlo Ray Tracing
AFDAllowable Flux Density
MPCModel Predictive Control
RMSERoot Mean Square Error
CSPConcentrated Solar Power
HTFHeat Transfer Fluid
PSOParticle Swarm Optimization

References

  1. McGlade, C.; Ekins, P. The geographical distribution of fossil fuels unused when limiting global warming to 2 C. Nature 2015, 517, 187–190. [Google Scholar] [CrossRef] [PubMed] [Green Version]
  2. Zhang, H.L.; Baeyens, J.; Degrève, J.; Cacères, G. Concentrated solar power plants: Review and design methodology. Renew. Sustain. Energy Rev. 2013, 22, 466–481. [Google Scholar] [CrossRef]
  3. Wang, L.; Gueymard, C.A.; Bilal, M.; Lin, A.; Wei, J.; Zhang, M.; Yang, X.; Qin, W. Constructing a gridded direct normal irradiance dataset in China during 1981–2014. Renew. Sustain. Energy Rev. 2020, 131, 110004. [Google Scholar]
  4. Reddy, V.S.; Kaushik, S.C.; Ranjan, K.R.; Tyagi, S.K. State-of-the-art of solar thermal power plants—A review. Renew. Sustain. Energy Rev. 2013, 27, 258–273. [Google Scholar] [CrossRef]
  5. Li, Y.; Liao, S.; Rao, Z.; Liu, G. A dynamic assessment based feasibility study of concentrating solar power in China. Renew. Energy 2014, 69, 34–42. [Google Scholar] [CrossRef]
  6. Behar, O.; Khellaf, A.; Mohammedi, K. A review of studies on central receiver solar thermal power plants. Renew. Sustain. Energy Rev. 2013, 23, 12–39. [Google Scholar] [CrossRef]
  7. Crespi, F.; Toscani, A.; Zani, P.; Sánchez, D.; Manzolini, G. Effect of passing clouds on the dynamic performance of a CSP tower receiver with molten salt heat storage. Appl. Energy 2018, 229, 224–235. [Google Scholar] [CrossRef]
  8. Li, L.; Coventry, J.; Bader, R.; Pye, J.; Lipiński, W. Optics of solar central receiver systems: A review. Opt. Express 2016, 24, A985. [Google Scholar] [CrossRef]
  9. Blanc, P.; Espinar, B.; Geuder, N.; Gueymard, C.; Meyer, R.; Pitz-Paal, R.; Reinhardt, B.; Renné, D.; Sengupta, M.; Wald, L.; et al. Direct normal irradiance related definitions and applications: The circumsolar issue. Sol. Energy 2014, 110, 561–577. [Google Scholar] [CrossRef]
  10. Bone, V.; Pidgeon, J.; Kearney, M.; Veeraragavan, A. Intra-hour direct normal irradiance forecasting through adaptive clear-sky modelling and cloud tracking. Sol. Energy 2018, 159, 852–867. [Google Scholar] [CrossRef]
  11. Prasad, A.A.; Taylor, R.A.; Kay, M. Assessment of direct normal irradiance and cloud connections using satellite data over Australia. Appl. Energy 2015, 143, 301–311. [Google Scholar] [CrossRef]
  12. Binotti, M.; De Giorgi, P.; Sanchez, D.; Manzolini, G. Comparison of different strategies for heliostats aiming point in cavity and external tower receivers. J. Sol. Energy Eng. 2016, 138, 021008. [Google Scholar] [CrossRef]
  13. Collado, F.J.; Guallar, J. A two-parameter aiming strategy to reduce and flatten the flux map in solar power tower plants. Sol. Energy 2019, 188, 185–189. [Google Scholar] [CrossRef]
  14. Kuhnke, S.; Richter, P.; Kepp, F.; Cumpston, J.; Koster, A.M.; Büsing, C. Robust optimal aiming strategies in central receiver systems. Renew. Energy 2020, 152, 198–207. [Google Scholar] [CrossRef]
  15. García-Martín, F.J.; Berenguel, M.; Valverde, A.; Camacho, E.F. Heuristic knowledge-based heliostat field control for the optimization of the temperature distribution in a volumetric receiver. Sol. Energy 1999, 66, 355–369. [Google Scholar] [CrossRef]
  16. Salomé, A.; Chhel, F.; Flamant, G.; Ferrière, A.; Thiery, F. Control of the flux distribution on a solar tower receiver using an optimized aiming point strategy: Application to THEMIS solar tower. Sol. Energy 2013, 94, 352–366. [Google Scholar] [CrossRef]
  17. Cruz, N.C.; Álvarez, J.D.; Redondo, J.L.; Berenguel, M.; Ortigosa, P.M.; Klempous, R. Control and optimal management of a heliostat field for solar power tower systems. In Proceedings of the 2019 IEEE 23rd International Conference on Intelligent Engineering Systems (INES), Godollo, Hungary, 25–27 April 2019; pp. 271–274. [Google Scholar]
  18. García, J.; Barraza, R.; Too, Y.C.S.; Padilla, R.V.; Acosta, D.; Estay, D.; Valdivia, P. Aiming clusters of heliostats over solar receivers for distributing heat flux using one variable per group. Renew. Energy 2020, 160, 584–596. [Google Scholar] [CrossRef]
  19. Zhao, Q.; Zhao, Y. An Optimal Scheduling of the Heliostat Field in a Solar Tower Power Plant. In Computer Aided Chemical Engineering; Kravanja, Z., Bogataj, M., Eds.; Elsevier: Amsterdam, The Netherlands, 2016; Volume 38, pp. 1021–1026. [Google Scholar]
  20. Fernandez, N.; Street, A.; Montenon, A.; Maussion, P. A scheduling optimization model for sun tracking of an autonomous heliostat. In Proceedings of the 2013 IEEE Grenoble Conference PowerTech, POWERTECH 2013, Grenoble, France, 16–20 June 2013; pp. 1–6. [Google Scholar]
  21. García, J.; Too, Y.C.S.; Padilla, R.V.; Beath, A.; Kim, J.S.; Sanjuan, M.E. Dynamic performance of an aiming control methodology for solar central receivers due to cloud disturbances. Renew. Energy 2018, 121, 355–367. [Google Scholar] [CrossRef]
  22. Too, Y.C.S.; García, J.; Padilla, R.V.; Kim, J.S.; Sanjuan, M. A transient optical-thermal model with dynamic matrix controller for solar central receivers. Appl. Therm. Eng. 2019, 154, 686–698. [Google Scholar] [CrossRef]
  23. Ashley, T.; Carrizosa, E.; Fernández-Cara, E. Optimisation of aiming strategies in Solar Power Tower plants. Energy 2017, 137, 285–291. [Google Scholar] [CrossRef]
  24. Hong, Y.Y.; Pula, R.A. Methods of photovoltaic fault detection and classification: A review. Energy Rep. 2022, 8, 5898–5929. [Google Scholar] [CrossRef]
  25. Dhanraj, J.A.; Mostafaeipour, A.; Velmurugan, K.; Techato, K.; Chaurasiya, P.K.; Solomon, J.M.; Gopalan, A.; Phoungthong, K. An effective evaluation on fault detection in solar panels. Energies 2021, 14, 7770. [Google Scholar] [CrossRef]
  26. Hosseinzadeh, M.; Salmasi, F.R. Determination of maximum solar power under shading and converter faults—A prerequisite for failure-tolerant power management systems. Simul. Model. Pract. Theory 2016, 62, 14–30. [Google Scholar] [CrossRef]
  27. Speetzen, N.; Richter, P. Dynamic aiming strategy for central receiver systems. Renew. Energy 2021, 180, 55–67. [Google Scholar] [CrossRef]
  28. Ni, D.; Sun, Y. A Deep Learning Based Forecast Method For Regional Cloud Map; Patent pending; Zhejiang University: Hangzhou, China, 2021. [Google Scholar]
  29. Sánchez-González, A.; Rodríguez-Sánchez, M.R.; Santana, D. Aiming strategy model based on allowable flux densities for molten salt central receivers. Sol. Energy 2017, 157, 1130–1144. [Google Scholar] [CrossRef]
  30. Collado, F.J.; Guallar, J. Fast and reliable flux map on cylindrical receivers. Sol. Energy 2018, 169, 556–564. [Google Scholar] [CrossRef]
  31. Richalet, J.; Rault, A.; Testud, J.L.; Papon, J. Model algorithmic control of industrial processes. Ifac Proc. Vol. 1977, 10, 103–120. [Google Scholar] [CrossRef]
  32. Rawlings, J.B. Tutorial overview of model predictive control. IEEE Control Syst. Mag. 2000, 20, 38–52. [Google Scholar]
  33. Fernandez-Camacho, E.; Bordons-Alba, C. Model Predictive Control in the Process Industry; Springer: London, UK, 1995. [Google Scholar]
  34. Solar Plant Simulation Tool. Available online: https://www.meso-star.com/projects/solstice/solstice.html (accessed on 21 March 2023).
  35. Caliot, C.; Benoit, H.; Guillot, E.; Sans, J.L.; Ferriere, A.; Flamant, G.; Coustet, C.; Piaud, B. Validation of a Monte Carlo integral formulation applied to solar facility simulations and use of sensitivities. J. Sol. Energy Eng. Trans. Asme 2015, 137, 2. [Google Scholar] [CrossRef] [Green Version]
  36. Delatorre, J.; Baud, G.; Bézian, J.J.; Blanco, S.; Caliot, C.; Cornet, J.F.; Coustet, C.; Dauchet, J.; El Hafi, M.; Eymet, V.; et al. Monte Carlo advances and concentrated solar applications. Sol. Energy 2014, 103, 653–681. [Google Scholar] [CrossRef] [Green Version]
  37. Zeng, Z.; Ni, D.; Xiao, G. Real-time heliostat field aiming strategy optimization based on reinforcement learning. Appl. Energy 2022, 307, 118224. [Google Scholar] [CrossRef]
  38. Kennedy, J.; Eberhart, R. Particle swarm optimization. In Proceedings of the ICNN’95-international conference on neural networks, Perth, WA, Australia, 27 November–1 December 1995; Volume 4, pp. 1942–1948. [Google Scholar]
  39. Eberhart, R.; Kennedy, J. A new optimizer using particle swarm theory. In Proceedings of the MHS’95 Sixth International Symposium on Micro Machine and Human Science, Aichi, Japan, 4–6 October 1995; pp. 39–43. [Google Scholar]
  40. Marini, F.; Walczak, B. Particle swarm optimization (PSO). A tutorial. Chemom. Intell. Lab. Syst. 2015, 149, 153–165. [Google Scholar] [CrossRef]
  41. Parsopoulos, K.E.; Vrahatis, M.N. Particle swarm optimization method for constrained optimization problems. Intell.-Technol. -Theory Appl. New Trends Intell. Technol. 2002, 76, 214–220. [Google Scholar]
  42. Collado, F.J.; Guallar, J. Quick design of regular heliostat fields for commercial solar tower power plants. Energy 2019, 178, 115–125. [Google Scholar] [CrossRef]
  43. Relloso, S.; Gutiérrez, Y. SENER molten salt tower technology. Ouarzazate NOOR III case. In Proceedings of the AIP Conference Proceedings, Antalya, Turkey, 12–15 May 2017; AIP Publishing LLC: Melville, NY, USA, 2017; Volume 1850, p. 30041. [Google Scholar]
Figure 1. (a) The heliostat field layout [30]. The north is indicated as the positive direction of the Y-axis, and the east is indicated as that of the X-axis. (b) A schematic diagram of the external cylindrical receiver. The number of the panels corresponds to that of the sector [29].
Energies 16 02997 g001
Figure 2. A brief description of the heliostat aiming problem.
Energies 16 02997 g002
Figure 3. A schematic diagram of the aiming strategy with MPC approach.
Energies 16 02997 g003
Figure 4. A flowchart of the aiming strategy optimization based on the PSO algorithm.
Energies 16 02997 g004
Figure 5. An example scenario of the shadows passing over the sector of the field.
Energies 16 02997 g005
Figure 6. An example of the solar flux distribution on the panel.
Energies 16 02997 g006
Figure 7. The performance analysis of the MPC-based aiming strategy between different prediction horizons.
Energies 16 02997 g007
Figure 8. The comparison of the total received solar flux trajectory in the example scenario of the three strategies.
Energies 16 02997 g008
Figure 9. Extent to which the heliostat aiming exceeds the adjustment limits of (a) PSO-based aiming strategy and (b) MPC-based aiming strategy.
Energies 16 02997 g009
Figure 10. The solar flux distribution uniformity of the three aiming strategies.
Energies 16 02997 g010
Figure 11. The feedback compensation analysis of the MPC-based aiming strategy.
Energies 16 02997 g011
Figure 12. (a) Solar flux distribution generated without feedback compensation. (b) Solar flux distribution generated with feedback compensation.
Energies 16 02997 g012
Figure 13. (a) The total flux RMSE differences comparison of the two aiming strategy related to the static strategy. (b) The histogram indicates the distribution of the RMSE differences between the two optimized aiming strategies. The red dashed line represents the mean value indicating the average improvement of the MPC-based aiming strategy.
Energies 16 02997 g013
Table 1. Parameters of the heliostat and the receiver [30,43].
ParameterValue
Heliostat Size 15.4 m ×   12.3 m
Heliostat Reflectivity 0.9
Heliostat Slope Error 1.53   mrad
Central Tower Height250 m
Receiver Height 20.4  m
Receiver Radius 8.5  m
Disclaimer/Publisher’s Note: The statements, opinions and data contained in all publications are solely those of the individual author(s) and contributor(s) and not of MDPI and/or the editor(s). MDPI and/or the editor(s) disclaim responsibility for any injury to people or property resulting from any ideas, methods, instructions or products referred to in the content.

