Abstract
Large wind turbines of the horizontal axis are commonly used to gather wind energy; however, their performance is found to be constrained in conditions of erratic and low-speed wind flow. In contrast, low wind conditions—which are typically present in dense urban areas—are found to favour vertical axis wind turbines (VAWT). These turbines have a simple design, are inexpensive and quiet, and are discovered to be better in low wind situations. In this research, we have chosen wind tree applications to absorb the most available wind energy. The new Aeroleaf Savonius Wind Turbine was developed numerically and a computational fluid dynamics simulation was performed on this new type of Savonius tree to predict its performance. The results indicated that the system could accept wind from any direction and could start rotating as soon as the site had a cut in wind speed of 3.3 m/s. The rotor speed increased by 10.4% from 5.5 to 6.3 m/s wind speed at 0.45 tip speed ratio. The tip speed ratio is 0.52 at the site’s high wind speed, and under these circumstances, the maximum Cp is 12.9%. The turbine was able to produce superior performance coefficients, according to the results.
1. Introduction
Increasing populations and technological developments are driving up electricity demands, which in turn might affect environmental pollution levels depending on the types of fuels used for power generation [1]. The world’s demand for energy is soaring as each year passes. Global energy demand climbed by 5.8% in 2 years compared to 1.3% in 2019, and has since continued to rise [2]. The energy produced from renewable energy sources is green energy, while the energy produced from fossil fuels is the main cause of global warming. The demand for electricity worldwide is expected to triple by the year 2050 [3], compared to 80% of the energy used now, while fossil fuels only make up 60% of total energy utilised. Oil, natural gas, and coal are examples of traditional fossil fuels that are non-renewable, and they produce a significant quantity of air pollution [4,5]. About 28% of the energy used worldwide comes from renewable sources [6]. Estimating wind power is highly sensitive to the shape of the wind speed distribution, and even slight discrepancies in wind speed data resulting from modelling errors can have a major impact on the reliability of energy estimates [7,8,9].
Wind energy has undergone extensive research and is a promising option for the production of power. However, due to low wind speeds with turbulence, conventional horizontal axis wind turbines (HAWT) cannot be used in urban locations. The vertical axis wind turbine (VAWT) is an alternative because it can perfectly extract electricity even in low or turbulent wind conditions, and can receive wind from all directions. VAWT has the ability to start on its own and does not require a yaw mechanism [10]. Despite having a relatively small coefficient of power, it is ideal for tiny applications due to its compact design [11]. Therefore, Savonius type vertical axis wind turbines can be taken into consideration for numerous applications in urban areas due to their simplicity in manufacture and efficiency in low wind areas [11]. The idea of a wind tree, which has a steel trunk and thin branches, has also recently received a lot of attention. These branches are equipped with about five Aero leaf-shaped wind turbines. In both urban and rural settings, the wind tree can benefit from both light breezes and strong gusts of wind. The turbine’s working speed can range from 2.7 to 38 m/s.
The Airfoil Bladed Savonius Hydrokinetic Turbine (ABSHKT) and Savonius Hydrokinetic Turbine (SHKT) with deflectors were investigated and found to have maximum power coefficients of 0.25 at 0.8 TSR and 0.27 at 0.8 TSR, respectively [12]. When compared to SHKT with deflector, the ABSHKT performs less well. To boost ABSHKT’s performance, it is advised to use the improved augmentation procedure. In terms of previous research on the Savonius wind turbine’s performance, Akwa et al. [13,14] presented the key design factors that influence the Savonius turbine’s performance. The study also provided significant information on how turbulence intensity and Reynolds number affect a Savonius rotor’s power coefficient. The authors claim that a space between the buckets allows air to flow from the front to the return bucket, increasing the pressure on a concave bucket’s back side and lowering the drag force on this area of the rotor.
There has been experimental and numerical research in the literature that aims to depict and enhance the key characteristics of this kind of turbine. Studies were conducted to examine performance coefficients for typical Savonius rotors with a number of stages, aspect ratios, and overlap ratios. The overlap ratio (OR) is a significant factor that affects the flow structure inside the rotor and, as a result, its aerodynamic performance, according to Zemamou et al. [15]. To analyse the performance parameters of wind turbines, Youssef [16] quantitatively evaluated several geometrical parameters, such as the classic, elliptical and bach design of the Savonius rotor. They discovered that at 0.8 tip speed ratio (TSR), all geometries reach their maximum power. The elliptical rotor performed among the three with a TSR range of 0.2 to 0.4, despite the fact that the Bachtype rotor had a higher coefficient of power (Cp).
Saha et al. [17] tested rotors with one, two, and three stages in a wind tunnel to determine how well they performed aerodynamically. The bucket number, bucket shape and valves used on buckets—both twist and semicircular—were all mixed up by the authors. A total of 14 different wind rotors with the same aspect ratios (AR) and projected areas were produced. The test speed was adjusted from 6 to 11 m/s. The authors’ key finding is that, whether there are one, two, or three stages, there are always two buckets, which is the best number. Comparing two-stage rotors to one-stage and three-stage rotors, two-stage rotors showed greater power coefficients. Fujisawa [18] experimentally tested various rotor overlap ratios under both spinning and static situations. Four types of rotors with varying OR ranging from 0 to 0.5 were used in the trials. An increase in the overlap ratio enhanced performance for the static torque, particularly on the return bucket where the flow through the overlap had a pressure recovery impact. Peak torque and power coefficients for the rotation rotor were attained for an overlap ratio of 0.15 [18].
To improve Savonius turbine performance and increase torque uniformity, several authors proposed exploring a twist along its vertical axis of the helical type Savonius turbine. As per Oliveria [19], in the helical rotor with 180-degree twisted buckets, dynamic torque coefficient and as a result achieved more uniform (CP) as function of bucket angular position with less oscillatory behaviour. A Savonius turbine with 180-degree twist buckets was used in an experimental investigation described by Damak et al. [20]. Numerical optimization of helical turbine was studied by Zhao et al. [21]. The authors examined various rotor topologies by varying characteristics including AR, OR, and end plate diameter. The Standard k-turbulence model was selected. To lessen the effects of the wall system, the domain used was 100 times larger than projected area. The greatest outcomes came from using an overlap ratio of 0.19. The size is 1.1 times the diameter of turbine and produced the optimum performance when end plates were used. For an aspect ratio of 6.0, the maximum power coefficient is attained.
Authors have looked into the design of VAWT wind boosters when there is little wind. They noticed that the centre of a wind turbine’s vertical axis is where the wind flow is directed by a wind booster with guide vanes. The results shows that the performance of turbines improved as a result of this adjustment, and the maximum Cp improved by 14% to 55.6% [22]. Authors have evaluated wind turbines with a fixed-pitch angle using a MATLAB/Simulink model [23]. Using this software, blade forms, pitch angle variation, and Cp were examined.
In order to use a barrier to shelter the returning blade, blade shape optimization was performed on a modified Savonius turbine [24]. At TSR = 0.7, a maximum Cp of 0.3 was achieved. After that, a significant drop was seen at a TSR of 1.2. 2D computational fluid dynamics (CFD) simulations were performed to examine the impact of azimuthal angle on Cp and Savonius rotor torque [25]. A 160-degree blade arc angle produced the highest Cp, which was 0.2836. Additionally, they show that the Cp was 8.37% higher than the Cp from a basic Savonius rotor. By estimating flow parameters with a computational fluid dynamics (CFD) simulation, a Savonius rotor’s design-based optimization can be carried out. However, precision is challenging to obtain due to the flow’s transient nature, d thus the methodology that is to be employed should be validated [24]. The performance of the Savonius rotor can be enhanced using augmentation techniques, such as nozzle, V-shape wedge deflector, deflecting plate, curtains, venting slots, guide vane, and others, so that the Savonius rotor performance can also be increased [26,27]. Table 1 summaries the various studies conducted by researchers and different conditions applied to the Savonius rotor.

Table 1.
Literature review.
The performance of wind turbines is severely impacted by detrimental effects, especially when they are situated in sandy, debris-rich, or coastal areas. Carraro M et al. [34] present work to establish reduced-order models of degraded leading-edge arrangements; this work compares 2D and 3D CFD modelling of wind turbine blades. In particular, turbulent kinetic energy colour maps were analysed to perform a first qualitative comparison between the 2D and 3D flow fields after an exhaustive validation campaign of the accepted numerical models. The investigation showed that the reduced-order 2D configuration accurately describes the system’s inviscid features (i.e., pressure field and lift coefficients). The 2D model routinely underestimated the drag contribution by roughly 17%, leading to flow separation at various streamwise points. Yet, the proposed 2D model was 30 times faster than the 3D evaluation while maintaining the same level of accuracy when dealing with the more crucial aerodynamics performance of the blade. Hence, the suggested 2D CFD setup is crucial for usage in a digital twin of any physical wind turbine for the purpose of carefully and properly planning maintenance, also taking leading edge erosion into account. Leon Mishnaevsky et al. [35] studied about one of the major challenges of expanding wind power, which is the deterioration of wind turbine blades due to weathering and other forms of surface erosion. In this study, new studies on leading edge erosion (LEE) are summarised from a variety of disciplines, including meteorology, aerodynamics, materials science, and computational mechanics. As for the meteorological side of things, the parameters and characteristics of precipitation, the possibility of predicting rain and hail, and the regional variances, as well as the technologies of experimentally testing anti-erosion coatings, were discussed. Additionally, they offer computer models of LEE and discuss potential future approaches for anti-erosion coating research and development.
From the literature discussed above, it can be easily seen that several studies have already being conducted on the idea of harvesting wind energy on a variety of fronts, including the number of blades needed for VAWT and the materials to be utilised for turbine blades, among others. Additionally, there have been numerous efforts to increase Savonius wind turbine performance; nonetheless, VAWT energy efficiency improvements still need to be made.
Additionally, there is little research on the idea of a wind tree. The idea of wind trees and the effective and straightforward integration of other renewable energy sources with wind turbines hence require substantial investigation. Therefore, a simulation of computational fluid dynamics for a Savonius rotor is described in this study [11,36]. Numerical simulations carried out utilising commercial CFD Ansys 2023 R1 software have helped with the investigation.
This paper focused on designing and analysing a Savonius wind turbine tree that can be used for small-scale applications like wind trees. The goal of this work is to advance existing research in the field, particularly with the Savonius wind turbine tree. In this work to enhance the power output of the Savonius wind turbine, a Savonius wind turbine tree has been constructed. Additionally, having an understanding of the trustworthy parameters for this kind of method might be a helpful tool for doing further analyses of vertical axis wind turbines (VAWT) working in actual circumstances. The paper section distribution is as follows: in Section 2, materials and methods used have been shown, while Section 3 shows the results and discussion part, and at the end, concluding remarks are presented in Section 4.
2. Materials and Methods
This section initially describes the mesh generation of the model followed by system design and then the details of construction of the Savonius wind turbine tree. Numerical model validation is discussed at the end of the section.
2.1. Grid Generation
The MESH tool in ANSYS 2023 R1 was used to build the computational grid, as shown in Figure 1. Quadrilateral elements are preferred over triangular ones in two-dimensional grid generation because they take up less memory and yield more precise numerical answers. The rotor domain’s grid node density was greater than that of the other domains.
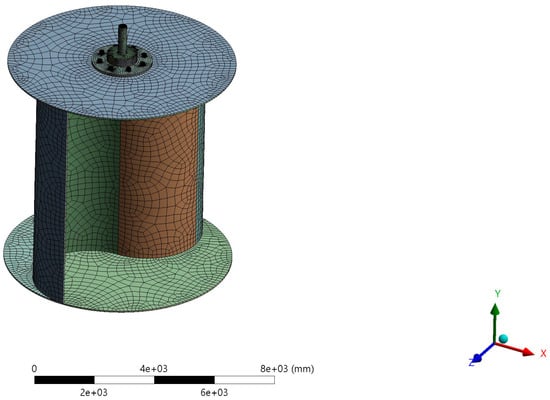
Figure 1.
Mesh diagram.
To increase grid quality and accurately depict the boundary layer flow, grid elements in the shape of prisms were extruded from the blade’s periphery. Depending on the rotor’s speed and where the pieces fell on the blade, the initial number of wall-borne components ranged from 25 to 100.
2.2. Numerical Model
When simulating turbulent flows, the RNG k- model was used. Swirl’s impact on turbulence is accounted for in this model, making for very precise predictions of rotating machinery [37]. In addition, the RNG k-ԑ turbulence model offers a differential formula for effective viscosity that is analytically determined and takes into consideration the low-Reynolds-number effect. In order to improve the precision of the solution at low Reynolds numbers, conventional wall functions were used to describe turbulent effects below the first grid element. The following equations are used in CFD analysis (from Equations (1)–(8)) [11,28,29,30,31,32,33,38]
Continuity equation:
Momentum equation:
Energy Equation:
For turbulence, the Continuity, Momentum, and Energy equation:
Turbulent Model:
k-turbulence model
ε-Rate of dissipation
2.3. System Design
This project is 2.4 m high (tree and turbine). The tree is composed of galvanized carbon steel, while the turbine edges are constructed of an aluminum alloy. The turbines may start functioning at low wind speeds and shut down if the wind speed becomes too high. Wind control technology refers to the various foundations and processes for harnessing wind energy for mechanical power. This primarily incorporates the wind and the characteristics associated with its quality and direction, as well as the operation of both the inward and outer portions of a wind turbine in terms of wind conduct [39,40].
The Aeroleaf wind turbine is a split part of a Savonius turbine. This project consists of 5 wind turbines, each of which can take the wind from any direction and create 100 watts of electricity. This is a green source of energy that minimizes carbon dioxide and carbon monoxide emissions that harm the environment during Earth’s existence [41,42]. Conventional wind turbines have been criticized for being unappealing, large, and frequently so loud that they are unsuitable for patios. The tree’s leaf-like cutting edges are essentially smaller size wind turbines that operate at speeds as low as 4.5 miles per hour (mph), with no regard for the wind’s direction. They are also silent, so they may theoretically be installed around structures, streets, or even in people’s enclosures. Figure 2 shows a systematic illustration of the Savonius rotor in 3D.
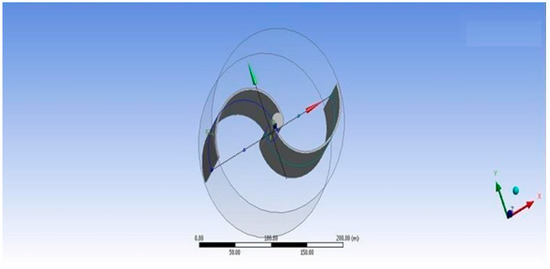
Figure 2.
Schematic diagram of the Savonius rotor in 3D.
Figure 3 depicts two cast iron metal sheets that have been bent into concave and convex shapes, and the top and bottom sheets are connected.
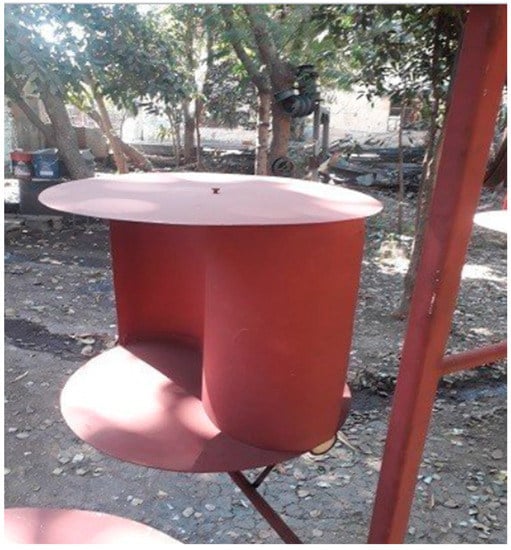
Figure 3.
Actual Savonius rotor blade.
The modelling of the rotor profiles in this investigation is done using the Ansys 2023 R1. In Figure 1, meshing is shown, while Figure 2 shows the models. For all test situations, a 0.5 mm blade thickness is assumed. The numerical model is surrounded by the unstructured triangular grids. This is because adaptivity may effectively be incorporated into unstructured grids. Additionally, it provides flexibility in creation of the mesh flow domain for a challenging flow problem [26]. Meshing is the first part; and the flow field is taken and divided into a finite number of cells. These cells provide the points at which the values are going to be calculated.
2.4. Velocity and Pressure Contours
Figure 4 displays the velocity contours of the rotor profile, while Figure 5 shows velocity contour for maximum velocity. The blade profile was seen to have a velocity around its surface of 4–7 m/s. Figure 6 depicts the rotor profile’s total pressure contours.
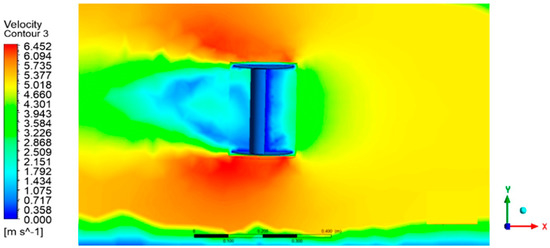
Figure 4.
Velocity contour.
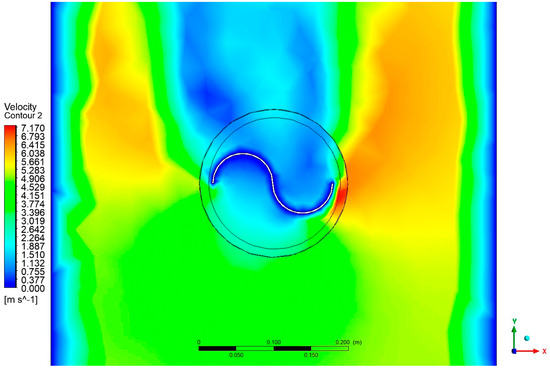
Figure 5.
Maximum speed reached by the laminar flow in contact with the Savonius rotor.
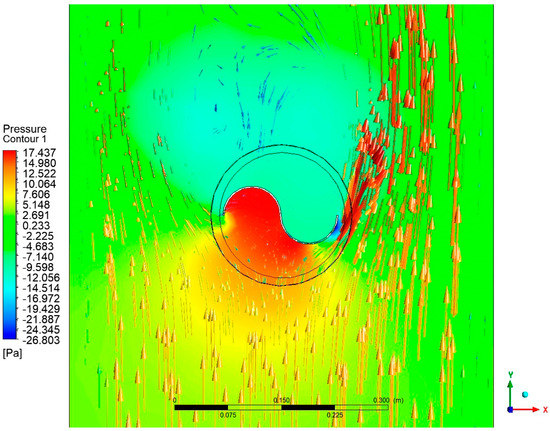
Figure 6.
Pressure contour of the Savonius rotor.
2.5. Construction of Savonius Turbine
The quarter-inch tempered steel vertical shaft holding the turbine was constructed with press fittings to connect to the generator. Additionally, it contained two set screws that served as a means of maintaining the connection between the pole and the two instruments and stabilising the turbine. Utilizing the convincing job examples and the provided requirements and specifics, the cutting-edge fabricating was assigned to a workshop plant in Mandideep.
From 3/8-inch acrylic, the top and base pieces were separated and then adhered. Epoxy was utilised to join the metal poles that were used to bolt the flexible cutting edge to the top and base sections. Figure 7 below shows distinct images of the fabrication of the tree and cutting edges.
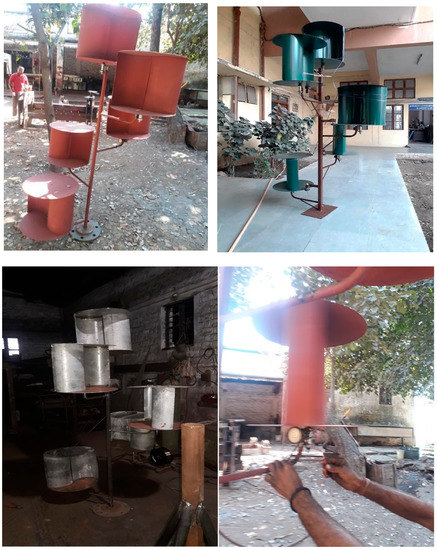
Figure 7.
Fabrication of the Savonius wind tree.
2.6. Wind Power Calculations and Power Coefficients Estimation
The coefficient of power (Cp) is estimated as follows [18,26,43,44,45,46]
Pavailable = ½ ρ A V3
Pturbine = T x ωs = 2 π N T/60
Cp = CT x TSR
Also, power is given by Power = voltage x current
where V = voltage and I = Current.
2.7. Numerical Method Validation
Tian et al. [37] performed validation studies using a two-bladed Savonius turbine. In this study, we performed the validation in the similar manner. Validation trials were performed using a standard two-bladed Savonius turbine (D = 1 m, C = 0.5 m, n = 2). The simulation findings were contrasted with the experimental data from [47]. Figure 8 compares the torque averaged across a full rotor rotation with the averaged coefficients of toque as a function of tip speed ratio. In particular, for higher tip speed ratios, Figure 8 indicates that the simulated findings correlate well with the experimental data. At = 0.6, where the CFD result is around 5% lower than the experimental data, the relative error is at its largest. Thus, the RNG k- ԑ turbulence, in conjunction with a typical wall treatment, is suitable for predicting the performance of a low-Reynolds-number Savonius wind rotor.
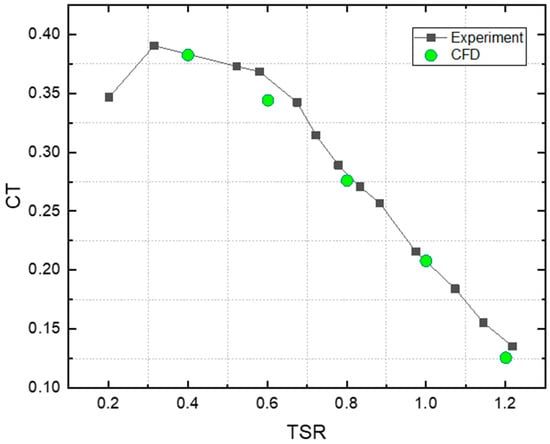
Figure 8.
Numerical method validation.
3. Results and Discussion
3.1. Wind Speed Characteristics
The site’s wind speeds for the time period under consideration ranged from 3.5 m/s to 9.8 m/s, according to analysis of the entire data spread as shown in Figure 9. It can be observed from Figure 9 that the site is having higher wind around the month of June, and during the month of October and November the site is having lower wind speed.
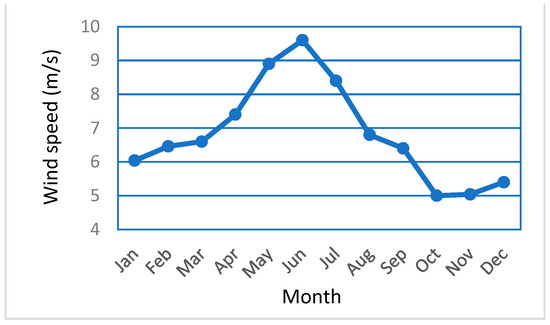
Figure 9.
Monthly mean wind speed at site.
An experiment was performed for a single rotor and for all rotors of the wind turbine tree. Table 2 shows the values of rotational speed at different wind speeds. Table 3 shows the reading’s voltage and current for a single rotor. In Table 4, it is clear that as the wind velocity increases, voltage and current increase, and hence power also increases.
Table 2.
Rotational speeds at different wind speeds.
Table 3.
Voltage and current measurement for a single turbine.
Table 4.
Experimental readings of voltage and current for different rotors starting from bottom to top.
3.2. Wind Power at the Site
In order to assess the wind potential for testing the system, the site’s wind speed distribution and wind power with respect to time of day are shown in Figure 10. As per the literature, each wind turbine design has a cut-in and rated wind speed [45,46]. The outcome and long-term data from [48] statistical analysis of wind speed at site based on Weilbull distribution functions showed that there is enough wind speed for the anticipated cut-in speed of 3.3 m/s. 8.42 W. At 9.6 m/s, we observed almost 65 percent higher power i.e., 875 W/m2, and an output power of 14.5 W.
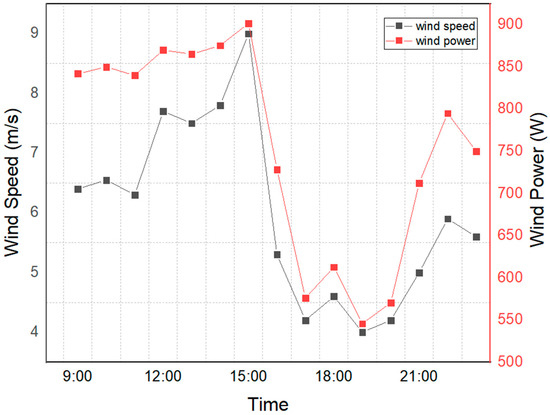
Figure 10.
Wind power and speed at different times.
3.3. Variation of Cp and TSR
This has the benefit of maintaining the generator’s rotor speed. As a result, the AC voltage’s frequency is fixed. As a result, it is possible to directly connect a wind turbine to a transmission system. Figure 11 reveals, however, that the power coefficient depends on the TSR. By extension, the tip-speed ratio influences the wind turbine’s efficiency. In a perfect world, a turbine would be running at its highest efficiency at all wind speeds [48].
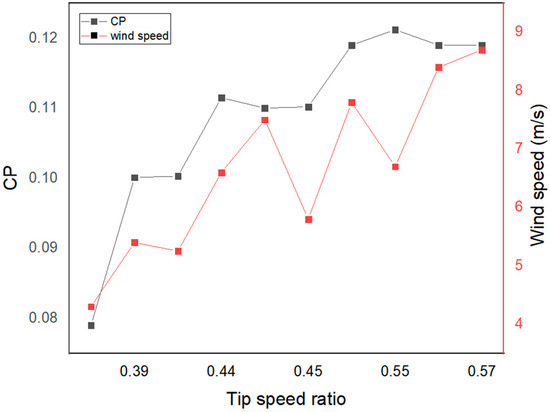
Figure 11.
Cp and tip speed ratio.
This implies that the rotor speed must alter as the wind speed does. At 0.45 tip speed ratio, the rotor speed increased by 10.4 percent from 5.5 to 6.3 m/s wind speed. At high wind speed of the site, the tip speed ratio is 0.52, and at this condition, the maximum achieved Cp is 12.9 percent. The graph shows that at the ideal tip speed ratio, the greatest power is extracted. The uncaptured power is a result of the turbine’s intrinsic inefficiency and losses, as well as the tip speed ratio’s non-constant behavior.
3.4. Current and Voltage
The results of the test to measure voltage and the related current with relation to wind speed are shown in Figure 12. As shown in Figure 12, as wind speed values rise, the output voltage and current levels produced by the proposed wind turbine rise as well. The generated voltage and current levels vary according to wind speed and peak of 8.5 to 9.1 m/s wind speed range. The proposed turbine is capable of producing high voltage levels at speeds of 3.8 to 9.1. It operates at a maximum speed of 850 rpm. The maximum power operating point for the turbine is thought to be at this speed.
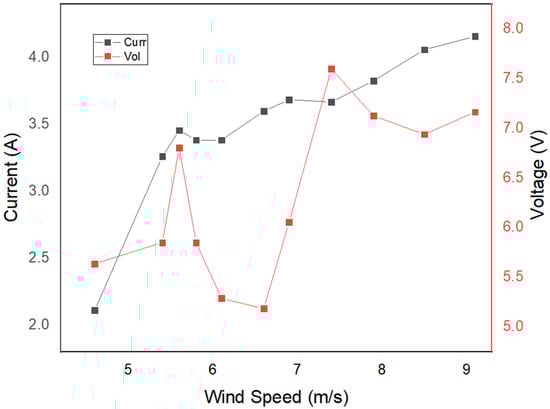
Figure 12.
Current and voltage.
4. Conclusions
An Aero leaf Savonius wind turbine tree was designed, constructed, and installed in this experiment to generate electricity. Further analysis of vertical axis wind turbines (VAWTs) in operation may benefit from knowing the reliable parameters for this method. Through this effort, a Savonius wind turbine tree has been built to increase the efficiency of Savonius wind turbines. During testing, the system produced 12.5 W of electricity with a wind speed of 7.8 m/s, and at this time, a voltage of 6.8 V was produced while the turbine’s RPM was measured to be 798 rpm. Also, numerical investigation has been done for Savonius turbine. The Cp values of the Savonius wind tree were estimated and compared using a wind speed range of 3.8 to 9 m/s. Wind speeds between 7.5 and 9.1 m/s were found to produce the highest coefficients of performance. The coefficients of performance were also found to be 11.8 and 7.8 percent, respectively, with a wind speed value of 9.1 m/s, a deviation of 4.6 percent. The turbine was able to produce superior performance coefficients, according to the results. However, these findings suggest that this turbine’s advantage in terms of energy generation lies not only in its efficiency but also in the broader areas that its rotor sweeps, exposing it to greater initial wind energy. Future possibilities of multiple smaller Savonius wind turbine forms in various planes are limited to wind tree development based on the findings of the current study. The concept outlined in this study can, however, be applied to the design and installation of wind trees in confined areas, such as rooftops, streets, or roads in urban and rural settings where the predominant wind velocity is minimal and consistent.
Author Contributions
All authors contributed to the study conception and design. Material preparation, data collection and analysis and also the first draft of the manuscript was written by M.K.R. Critical review and supervision were done by M.A., P.B., A.K.S., G.D. and P.V. and all authors commented on previous versions of the manuscript. All authors have read and agreed to the published version of the manuscript.
Funding
This research received no external funding.
Data Availability Statement
Not applicable.
Acknowledgments
The researchers are thankful to the assistance offered by the faculties of MANIT Bhopal for providing the support during this study.
Conflicts of Interest
The authors declare no conflict of interest.
Nomenclature
| CP | Coefficient of power |
| CT | Coefficient of torque |
| VAWT | Vertical Axis Wind Turbine |
| HAWT | Horizontal Axis Wind Turbine |
| cp | Specifc heat, (J/kg-c) |
| C1ε, C2ε, C3ε | Constant |
| g | Gravitational constant, 9.81 m/s2 |
| Gb | Generation of turbulent kinetic energy that arises from buoyancy |
| Gk | Generation of turbulent kinetic energy arises due to mean velocity |
| h | Heat transfer coefcient (W/m2–k) |
| Kf | Thermal conductivity (W/m–k) |
| AR | aspect ratio |
| OR | overlap ratio |
| TSR | Tip Speed Ratio |
| ṁ | Mass fow rate in kg/s |
| Pr | Turbulent Prandtl number |
| ρuiuj | Reynolds stress |
| Ti | Inlet temperature (K) |
| To | outlet temperature (K) |
| XM | The arithmetic average of observations |
| Xi | Number of observations |
References
- Patidar, H.; Shende, V.; Baredar, P.; Soni, A. Comparative study of offshore wind energy potential assessment using different Weibull parameters estimation methods. Environ. Sci. Pollut. Res. 2022, 29, 46341–46356. [Google Scholar] [CrossRef]
- Bp Statistical Review of World Energy. 2022. Available online: https://www.bp.com/en/global/corporate/energy-economics/statistical-review-of-worldenergy.html (accessed on 15 January 2023).
- Power Consumption to Triple by 2050′—McKinsey Report. Available online: https://www.modernpowersystems.com/news/newspower-consumption-to-triple-by-2050-mckinsey-report-9655086# (accessed on 8 January 2023).
- Amano, R.S. Review of Wind Turbine Research in 21st Century. J. Energy Resour. Technol. 2017, 139, 050801. [Google Scholar] [CrossRef]
- Prabhukhot, P.R.; Prabhukhot, A.R. Computer Analysis of S822 Aerofoil Section for Blades of Small Wind Turbines at Low Wind Speed. J. Sol. Energy Eng. 2017, 139, 051008–51011. [Google Scholar] [CrossRef]
- Global Energy Review 2020 by IEA. Available online: https://www.iea.org/reports/global-energy-review-2020 (accessed on 15 January 2023).
- Patidar, H.; Shende, V.; Baredar, P.; Soni, A. Comparative evaluation of optimal Weibull parameters for wind power predictions using numerical and metaheuristic optimization methods for different Indian terrains. Environ. Sci. Pollut. Res. 2023, 30, 30874–30891. [Google Scholar] [CrossRef]
- Patidar, H.; Shende, V.; Baredar, P.; Soni, A. Comparative analysis of wind potential and characteristics using metaheuristic optimization algorithms at different places in India. Int. J. Environ. Sci. Technol. 2022, 1–16. [Google Scholar] [CrossRef]
- Shende, V.; Patidar, H.; Baredar, P.; Agrawal, M. Estimation of wind characteristics at different topographical conditions using doppler remote sensing instrument—A comparative study using optimization algorithm. Environ. Sci. Pollut. Res. 2023, 1–17. [Google Scholar] [CrossRef]
- Shende, V.; Patidar, H.; Baredar, P.; Agrawal, M. A review on comparative study of Savonius wind turbine rotor performance parameters. Environ. Sci. Pollut. Res. 2022, 29, 69176–69196. [Google Scholar] [CrossRef]
- Sonawane, C.R.; Sasar, Y.; Shaikh, M.; Kokande, Y.; Mustafa, M.; Pandey, A. Numerical simulation of Savonius rotors used for low wind speed application. Mater. Today Proc. 2022, 49, 1610–1616. [Google Scholar] [CrossRef]
- Chaudhari, V.N.; Shah, S.P. Numerical investigation on the performance of an innovative Airfoil-Bladed Savonius Hydrokinetic Turbine (ABSHKT) with deflector. Int. J. Thermofluids 2023, 17, 100279. [Google Scholar] [CrossRef]
- Akwa, J.V.; da Silva Júnior, G.A.; Petry, A.P. Discussion on the verification of the overlap ratio influence on performance coefficients of a Savonius wind rotor using computational fluid dynamics. Renew. Energy 2012, 38, 141–149. [Google Scholar] [CrossRef]
- Akwa, J.V.; Vielmo, H.A.; Petry, A.P. A review on the performance of Savonius wind turbines. Renew. Sustain. Energy Rev. 2012, 16, 3054–3064. [Google Scholar] [CrossRef]
- Zemamou, M.; Aggour, M.; Toumi, A. Review of savonius wind turbine design and performance. Energy Procedia 2017, 141, 383–388. [Google Scholar] [CrossRef]
- Youssef, K.; El Kholy, A.M.; Hamed, A.M.; Mahmoud, N.A.; El Baz, A.M.; Mohamed, T.A. An innovative augmentation technique of savonius wind turbine performance. Wind. Eng. 2019, 44, 93–112. [Google Scholar] [CrossRef]
- Saha, U.; Thotla, S.; Maity, D. Optimum design configuration of Savanius rotor though wind tunnel experiments. J. Wind Eng. Ind. Aerodyn. 2008, 96, 1359–1375. [Google Scholar] [CrossRef]
- Fujisawa, N. On the torque mechanism of Savonius rotors. J. Wind. Eng. Ind. Aerodyn. 1992, 40, 277–292. [Google Scholar] [CrossRef]
- Oliveira, C.; Petry, A. Numerical study of a helical Savonius wind turbine. In Proceedings of the 15th Brazilian Congress of Thermal Sciences and Engineering, Belém, Brazil, 10–13 November 2014. [Google Scholar]
- Damak, A.; Driss, Z.; Abid, M. Experimental investigation of helical Savonius rotor with a twist of 180°. Renew. Energy 2013, 52, 136–142. [Google Scholar] [CrossRef]
- Zhao, Z.; Zheng, Y.; Xu, X.; Liu, W.; Zhou, D. Optimum Design Configuration of Helical Savonius Rotor via Numerical Study. In Proceedings of the ASME 2009 Fluids Engineering Division Summer Meeting, Vail, CO, USA, 2–6 August 2009; pp. 1273–1278. [Google Scholar] [CrossRef]
- Korprasertsak, N.; Leephakpreeda, T. Analysis and optimal design of wind boosters for Vertical Axis Wind Turbines at low wind speed. J. Wind. Eng. Ind. Aerodyn. 2016, 159, 9–18. [Google Scholar] [CrossRef]
- Jansuya, P.; Kumsuwan, Y. Design of MATLAB/Simulink Modeling of Fixed-pitch Angle Wind Turbine Simulator. Energy Procedia 2013, 34, 362–370. [Google Scholar] [CrossRef]
- Mohamed, M.H.; Janiga, G.; Pap, E.; Thévenin, D. Optimal blade shape of a modified Savonius turbine using an obstacle shielding the returning blade. Energy Convers. Manag. 2011, 52, 236–242. [Google Scholar] [CrossRef]
- Mao, Z.; Tian, W. Effect of the blade arc angle on the performance of a Savonius wind turbine. Adv. Mech. Eng. 2015, 7. [Google Scholar] [CrossRef]
- Alom, N.; Saha, U.K. Influence of blade profiles on Savonius rotor performance: Numerical simulation and experimental validation. Energy Convers. Manag. 2019, 186, 267–277. [Google Scholar] [CrossRef]
- Kothe, L.B.; Möller, S.V.; Petry, A.P. Numerical and experimental study of a helical Savonius wind turbine and a comparison with a two-stage Savonius turbine. Renew. Energy 2019, 148, 627–638. [Google Scholar] [CrossRef]
- Mandal, A.K.; Rana, K.B.; Tripathi, B. Experimental study on performance improvement of a Savonius turbine by equipping with a cylindrical cowling. Energy Sources Part A Recover. Util. Environ. Eff. 2020, 1–19. [Google Scholar] [CrossRef]
- Siddiqui, M.S.; Khalid, M.H.; Zahoor, R.; Butt, F.S.; Saeed, M.; Badar, A.W. A numerical investigation to analyze effect of turbulence and ground clearance on the performance of a roof top vertical–axis wind turbine. Renew. Energy 2020, 164, 978–989. [Google Scholar] [CrossRef]
- Al-Ghriybah, M.; Zulkafli, M.F.; Didane, D.H.; Mohd, S. The effect of inner blade position on the performance of the Savonius rotor. Sustain. Energy Technol. Assess. 2019, 36, 100534. [Google Scholar] [CrossRef]
- Chowdhury, A.M.; Akimoto, H.; Hara, Y. Comparative CFD analysis of Vertical Axis Wind Turbine in upright and tilted configuration. Renew. Energy 2016, 85, 327–337. [Google Scholar] [CrossRef]
- Ostos, I.; Ruiz, I.; Gajic, M.; Gómez, W.; Bonilla, A.; Collazos, C. A modified novel blade configuration proposal for a more efficient VAWT using CFD tools. Energy Convers. Manag. 2019, 180, 733–746. [Google Scholar] [CrossRef]
- Bhayo, B.A.; Al-Kayiem, H.H. Experimental characterization and comparison of performance parameters of S-rotors for standalone wind power system. Energy 2017, 138, 752–763. [Google Scholar] [CrossRef]
- Carraro, M.; De Vanna, F.; Zweiri, F.; Benini, E.; Heidari, A.; Hadavinia, H. CFD Modeling of Wind Turbine Blades with Eroded Leading Edge. Fluids 2022, 7, 302. [Google Scholar] [CrossRef]
- Mishnaevsky, L.; Hasager, C.B.; Bak, C.; Tilg, A.-M.; Bech, J.I.; Rad, S.D.; Fæster, S. Leading edge erosion of wind turbine blades: Understanding, prevention and protection. Renew. Energy 2021, 169, 953–969. [Google Scholar] [CrossRef]
- Chandrakant, S.; Panchal, H.; Sadasivuni, K.K. Numerical simulation of flow-through heat exchanger having helical flow passage using high order accurate solution dependent weighted least square based gradient calculations. Energy Sources Part A Recover. Util. Environ. Eff. 2021, 1–26. [Google Scholar] [CrossRef]
- Tian, W.; Song, B.; VanZwieten, J.H.; Pyakurel, P. Computational Fluid Dynamics Prediction of a Modified Savonius Wind Turbine with Novel Blade Shapes. Energies 2015, 8, 7915–7929. [Google Scholar] [CrossRef]
- Patel, A.; Soni, A.; Baredar, P.; Malviya, R. Analysis of temperature distribution over pipe surfaces of air-based cavity linear receiver for cross-linear concentration solar power system. Environ. Sci. Pollut. Res. 2022, 1–19. [Google Scholar] [CrossRef] [PubMed]
- Sandhiya, K.; Kaviya, B. Safe bus stop location in Trichy city by using gis. Int. J. Appl. Eng. Res. 2014, 9, 5686–5691. [Google Scholar]
- Jia, R.; Xia, H.; Zhang, S.; Su, W.; Xu, S. Optimal design of Savonius wind turbine blade based on support vector regression surrogate model and modified flower pollination algorithm. Energy Convers. Manag. 2022, 270, 116247. [Google Scholar] [CrossRef]
- Anbazhagan, R.; Satheesh, B.; Gopalakrishnan, K. Mathematical modeling and simulation of modern cars in the role of stability analysis. Indian J. Sci. Technol. 2013, 6, 4633–4641. [Google Scholar] [CrossRef]
- Laws, P. Validating the ideal configuration and mutual coupling effect among Savonius wind turbine clusters using free rotation analysis. Ocean Eng. 2022, 266, 112879. [Google Scholar] [CrossRef]
- Kianifar, A.; Anbarsooz, M. Blade curve influences on the performance of Savonius rotors: Experimental and numerical. Proc. Inst. Mech. Eng. Part A J. Power Energy 2010, 225, 343–350. [Google Scholar] [CrossRef]
- Roy, S.; Saha, U.K. Review of experimental investigations into the design, performance and optimization of the Savonius rotor. Proc. Inst. Mech. Eng. Part A J. Power Energy 2013, 227, 528–542. [Google Scholar] [CrossRef]
- Ohunakin, O.; Adaramola, M.S.; Oyewola, O. Wind energy evaluation for electricity generation using WECS in seven selected locations in Nigeria. Appl. Energy 2011, 88, 3197–3206. [Google Scholar] [CrossRef]
- Ohaji, D.E.; Musa, M.; Momoh, M.; Akpootu, D.O.; Bello, G. Construction and Performance Evaluation ff Two Staged Three Bladed Savonius Vertical Axis Wind Energy Conversion System. FUDMA J. Sci. 2022, 6, 76–88. [Google Scholar] [CrossRef]
- Blackwell, B.; Sheldahl, R.; Feltz, L. Wind Tunnel Performance Data for Two-and-Three-Bucket Savonius Rotors; US Sandia Laboratories Report SAND76-0131; Sandia Laboratories: Springfield, VA, USA, 1977. [Google Scholar]
- Chaurasiya, P.K.; Kumar, V.K.; Warudkar, V.; Ahmed, S. Evaluation of wind energy potential and estimation of wind turbine characteristics for two different sites. Int. J. Ambient. Energy 2019, 42, 1409–1419. [Google Scholar] [CrossRef]


Disclaimer/Publisher’s Note: The statements, opinions and data contained in all publications are solely those of the individual author(s) and contributor(s) and not of MDPI and/or the editor(s). MDPI and/or the editor(s) disclaim responsibility for any injury to people or property resulting from any ideas, methods, instructions or products referred to in the content. |
© 2023 by the authors. Licensee MDPI, Basel, Switzerland. This article is an open access article distributed under the terms and conditions of the Creative Commons Attribution (CC BY) license (https://creativecommons.org/licenses/by/4.0/).