Article

Robust Subsynchronous Damping Control of PMSG-Based Wind Farm †

1
Guangdong Key Laboratory of Electromagnetic Control and Intelligent Robots, Shenzhen University, Shenzhen 518060, China
2
College of Mechatronics and Control Engineering, Shenzhen University, Shenzhen 518060, China
*
Authors to whom correspondence should be addressed.
This paper is an extended version of our paper published in 2022 7th Asia Conference on Power and Electrical Engineering, Hangzhou, China, 15–17 April 2022; pp. 1495–1499.
Energies 2023, 16(7), 3144; https://doi.org/10.3390/en16073144
Submission received: 15 February 2023 / Revised: 27 March 2023 / Accepted: 28 March 2023 / Published: 30 March 2023

Abstract

:
This paper provides an H robust control strategy for a permanent magnet synchronous generator (PMSG)-based wind farm to realize subsynchronous resonance suppression (SSR) subject to uncertain system distortions and parameter perturbation. Firstly, an eighth-order state space mathematical model of a PMSG-based wind farm is established, including the grid-side converter (GSC), GSC controller, and phase-locked loop (PLL) model. Secondly, the SSR characteristics of a PMSG-based wind farm are analyzed through eigenvalue analysis. Thirdly, a robust subsynchronous damping controller is designed based on eigenvalue analysis of SSR. Finally, the designed robust subsynchronous damping controller is validated with case studies of wind farms. The results show that the controller can increase the stability of PMSG-based wind farm systems and restrain SSR.

1. Introduction

Large-scale power generation clusters based on wind power are widely integrated into power systems, which bring new challenges to the safe and stable operation of power systems. Wind power generators are often connected to power grids through power electronic converters, which are different from traditional power generation units. The interaction between power electronic converters and the power grid can easily lead to subsynchronous resonance (SSR) problems, causing shutdown of generator units and sometimes equipment damage [1,2,3].
SSR refers to a system resonance phenomenon when excitation frequency is between 5 Hz and 50 Hz. Reference [2] points out that wind turbine generators when coupled to a series capacitor compensated transmission system where the oscillatory energy interchange is lightly damped, are defined as SSR phenomena. SSR may occur when a doubly-fed induction-generator-based (DFIG) wind farm is connected to AC transmission systems compensated by series capacitors [4,5]. Since 2009, a number of DFIG wind farms, e.g., in Texas in the USA, Guyuan in Hebei Province, Baicheng in Jilin Province in China and some other areas, have experienced SSR phenomena [1,2,6]. Due to overcurrent, a large number of wind turbines (WTs) had to be cut off from the grid, and some were damaged, which resulted in significant economic losses. Similarly, a PMSG can directly form an equivalent inductance capacitance series resonance structure with weak AC power grids and cause an SSR phenomenon as well. For instance, a large-scale power oscillation event caused by SSR occurred in the Hami region of Xinjiang, China in 2015 [3]. The interaction between a PMSG and the regional power grid brings SSR phenomenon and triggers the torsional vibration of the nearby thermal power units, which can jeopardize the safe operation of the power system. Therefore, SSR has become an important hidden trouble affecting the safe and stable operation of power systems with high penetration of wind power [7,8,9,10,11,12].
The investigation of SSR in wind farms can be divided into three categories: system modeling, SSR mechanism analysis, and SSR suppression strategy. Model-order-reduction methods [13,14,15] and equivalent impedance methods [16,17,18,19] are the primary techniques employed in the study of DFIG or PMSG-based wind farm modeling. References [4,5] show that SSR of DFIG-based wind farms is caused by adding series compensation capacitors to LC resonance circuits or using unreasonable control parameters, which result in subsynchronous interaction between the controller and the AC grid. Recently, there were some papers specifically dealing with the impact of PMSG on SSR. Reference [20] mentioned that PMSGs can provide positive damping for the SSR mode. The work in [21] concluded that there was no apparent susceptibility for PMSGs to SSR, or PMSGs were favorable for SSR immunity. However, in [22], it was pointed out that there was a risk of SSR due to the negative damping induced by PMSGs. References [3,23,24,25,26,27] pointed out that the SSR of s PMSG was related to wind speed, control parameters, line impedance, and short circuit ratio (SCR).
It is worth noting that a lot of work studying SSR in wind farms is under specific conditions. However, in the practical wind farm operation process, there are many uncontrollable factors: line impedance parameters that are difficult to be evaluated accurately, time-varying wind speed, control parameters that can be further optimized, and nonlinear characteristics of power electronic devices. These factors are called uncertain factors. The existence of these uncertain factors makes the established wind farm model contain uncertainty and also makes the mechanism analysis and control strategy design of SSR more complex. Therefore, to solve the problems of uncertain factors, a better robust SSR suppression strategy is needed. One way is the H control strategy, which was proposed by Zames in 1981 and has been greatly developed ever since [28,29,30]. The H robust control strategy is a method to obtain a robust controller by optimizing the infinite norm of some performance indexes in H space. The unique advantage of the strategy is to establish robust control of uncertain models. It has been used in the control system of wind farms [31,32,33]. Therefore, in this paper, an H robust control strategy is developed for PMSG-based wind farms to realize SSR suppression subject to uncertain system distortions and parameter perturbation.
The rest of this paper is arranged as follows. In Section 2, an eighth-order uncertain model of the system is introduced. The relationship between parameters and subsynchronous modes is analyzed by the eigenvalue analysis method and the participatory factor analysis method, and the results are described in Section 3. In Section 4, a robust SSR damping controller is presented for SSR mitigation based on the H theory. The effectiveness of the SSR damping controller is verified by several case studies in Section 5. The conclusions are given in Section 6.

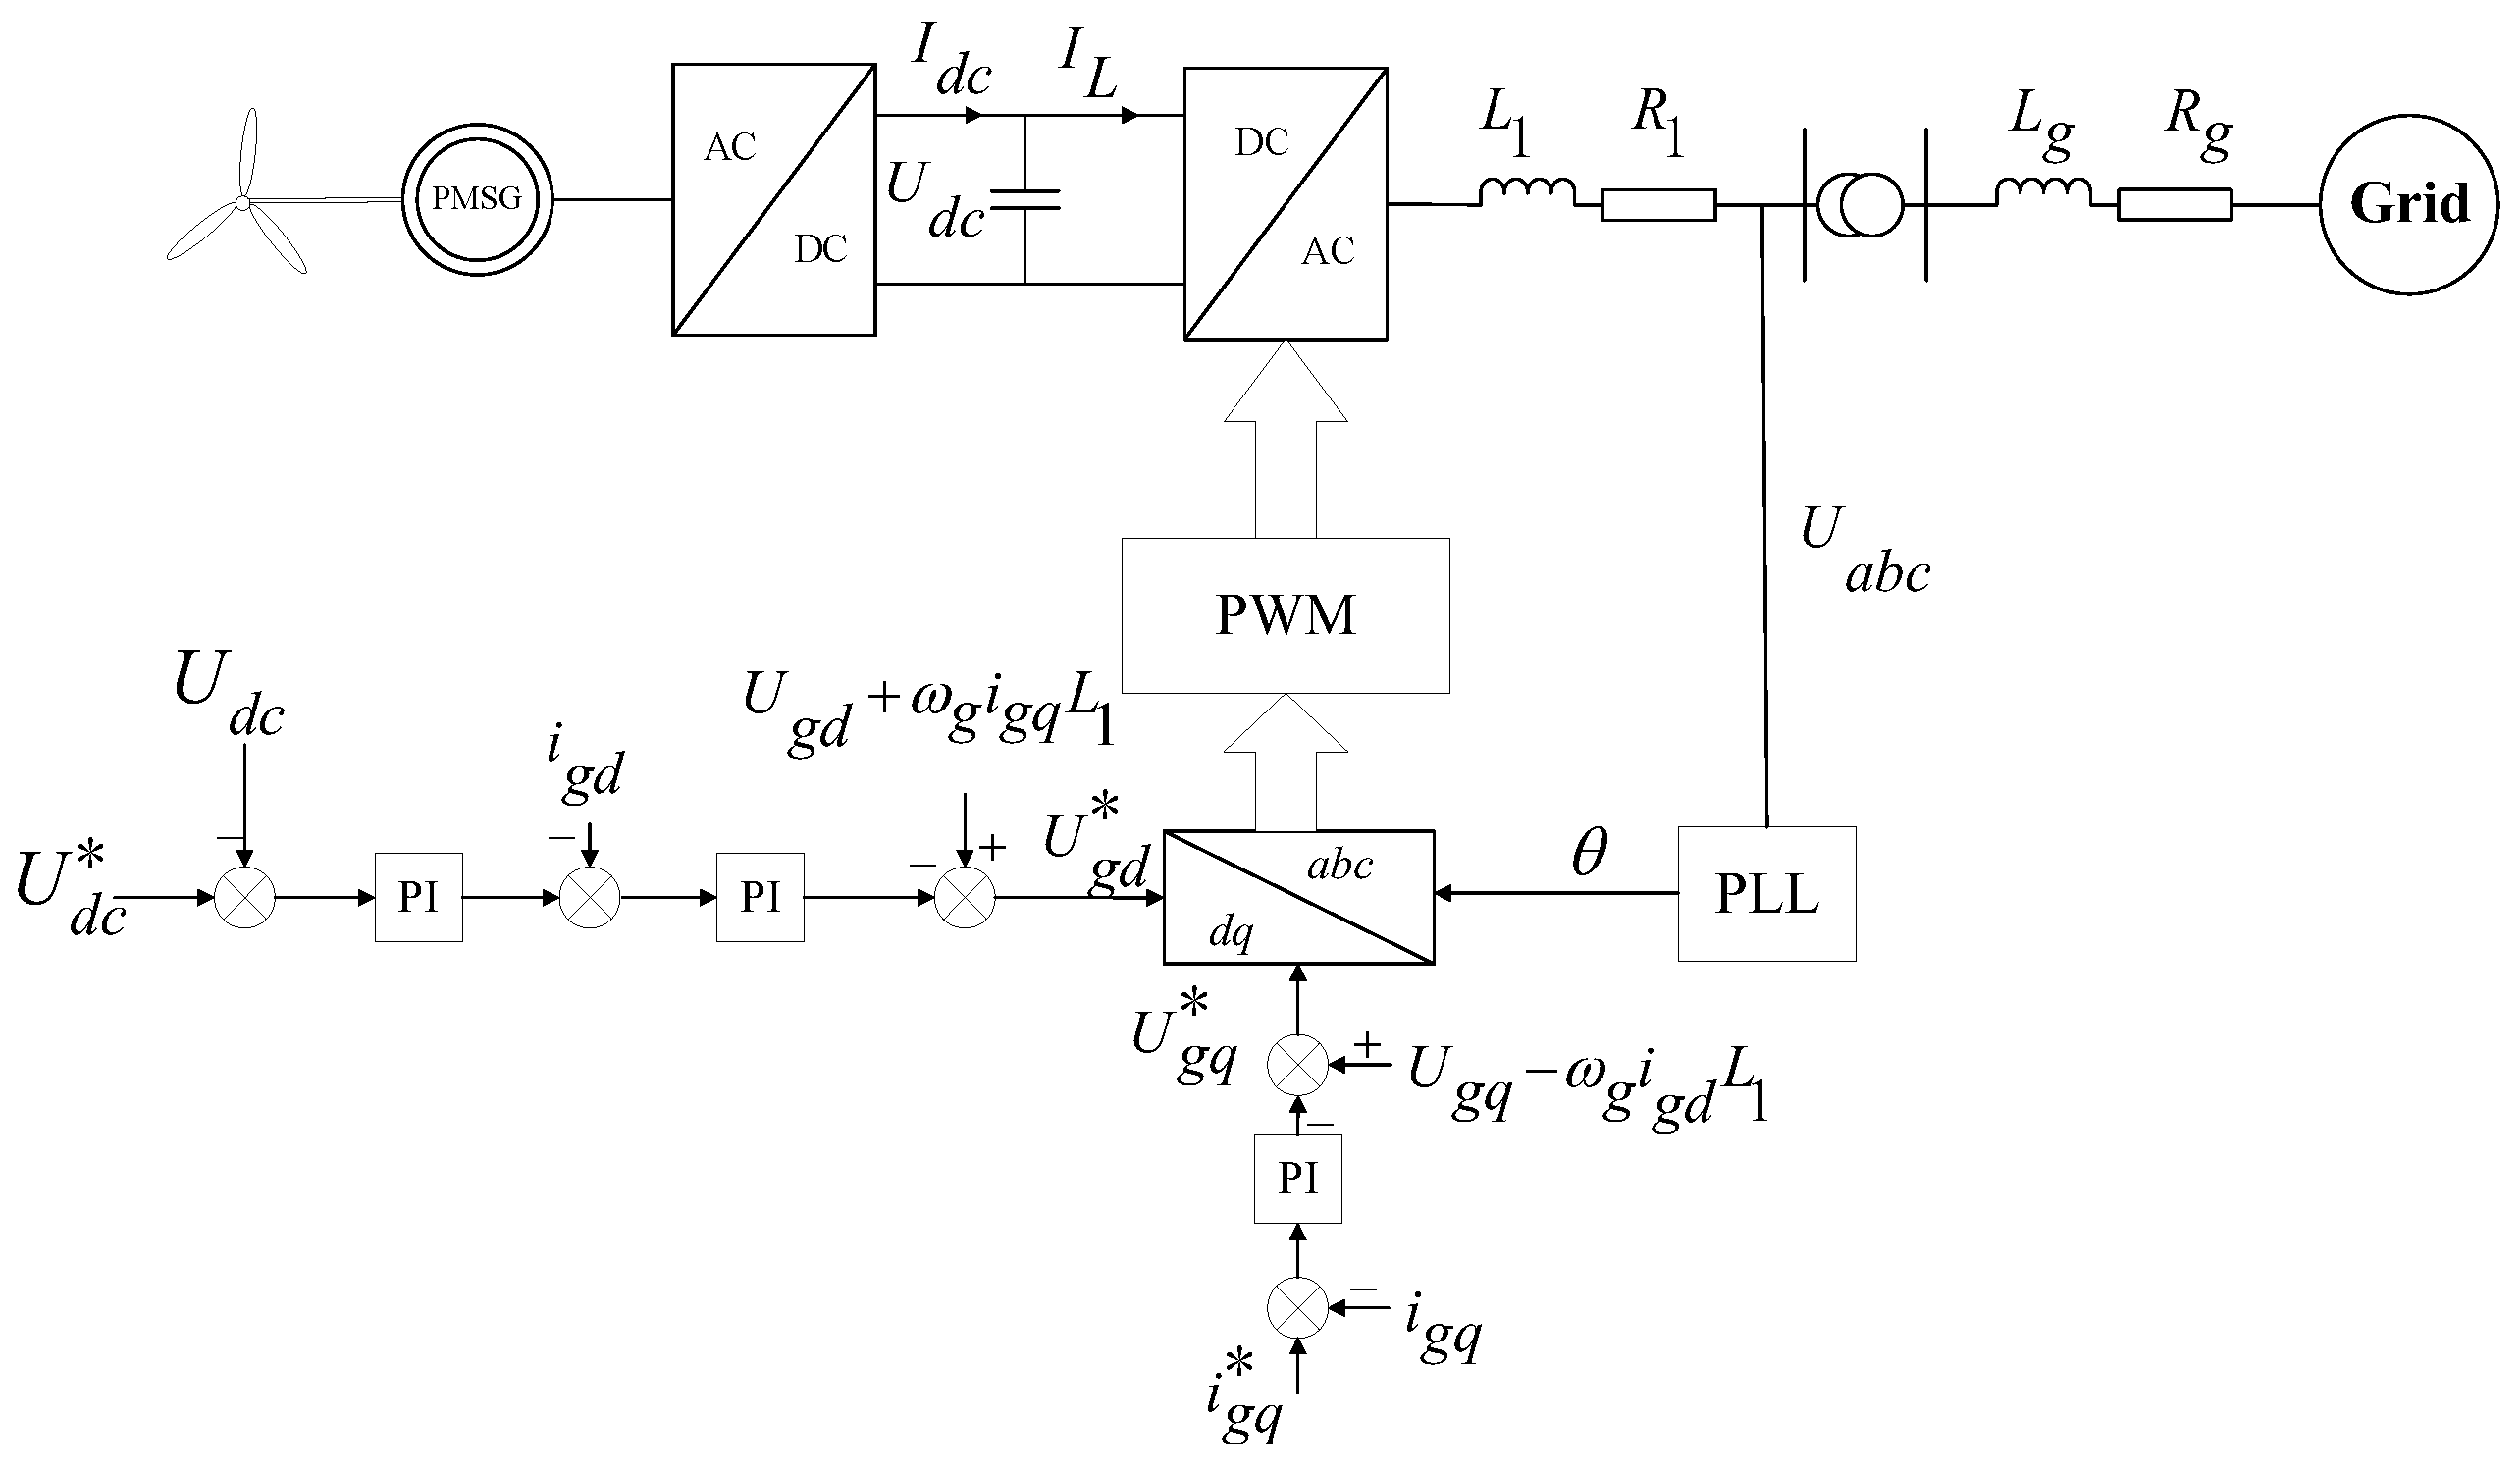
2. Modeling of Wind Power Systems

The IEEE benchmark model for wind farms is usually used in the study of SSR [3,8,9,10]. Figure 1 is the first IEEE benchmark model for a PMSG-based wind farm The system can be composed of a PMSG-based wind farm, rotor-side converter (RSC), RSC controller, grid-side converter (GSC), GSC controller, and PLL and transmission line. However, there are only three parts closely related to SSR characteristics, which are the GSC, full-scale controls (i.e., PLL, inner and outer control loops of GSC), and frequency-coupling effects.
To develop a mathematical model for studying SSR in PMSG-based wind farms, differential equation models for GSC, full-scale controls of GSC controller, and PLL must be established. Line current and DC bus voltage [igd, igq, Udc] can be used to form the GSC model (Equation (1)), while intermediate state variables [x1, x2, x3] can be selected for the GSC controller (Equation (2)). The PLL adopts a space vector transformation structure to provide orientation angle for GSC output voltage, The principal diagram of PLL of d axis orientation is shown in Figure 2 and its linearization can be expressed by Equation (3).
U g d = U p c c d R 1 i g d L 1 d i g d d t + ω g i g q L 1 U g q = U p c c q R 1 i g q L 1 d i g q d t + ω g i g d L 1 C d U d c d t = d d i g d + d d i g q i d c
d x 1 d t = U d c * U d c d x 2 d t = ( U d c * U d c ) ( k p 2 + k i 2 s ) i g d d x 3 d t = i g q * i g q U g d * = U p c c d + ω g i g q L 1 ( k p 2 k p 1 ( U d c * U d c ) + k p 1 k i 1 x 1 k p 2 i g d + k i 2 x 2 ) U g q * = U p c c q ω g i g d L 1 k p 1 ( i g q * i g q ) + k i 1 x 2 )
d x p l l d t = θ U p c c d d θ p l l d t = k i p l l x p l l + k p p l l d x p l l d t + ω g
According to Equations (1)–(3), the PMSG-based wind farm is modeled with state variable (x = (x1, x2, x3, xpll, θpll, igd, igq, Udc)) and input (u = (Vpccq , U d c * i g q * , idc)), and its state matrix is defined by Equation (4), using A and B matrices from Appendix B and parameters from Appendix A. These parameters are based on the 2 MW PMSG model parameters in MATLAB. The system uncertainties arise from PMSG parameter perturbation and grid voltage/DC bus current disturbance, which are organized into nominal and uncertain parts in Equation (5). Figure 3 shows the structure diagram of the uncertain system.
x ˙ = A x + B u y = C x
x ˙ = ( A + A 1 ) x + ( B + B 1 ) u y = C x

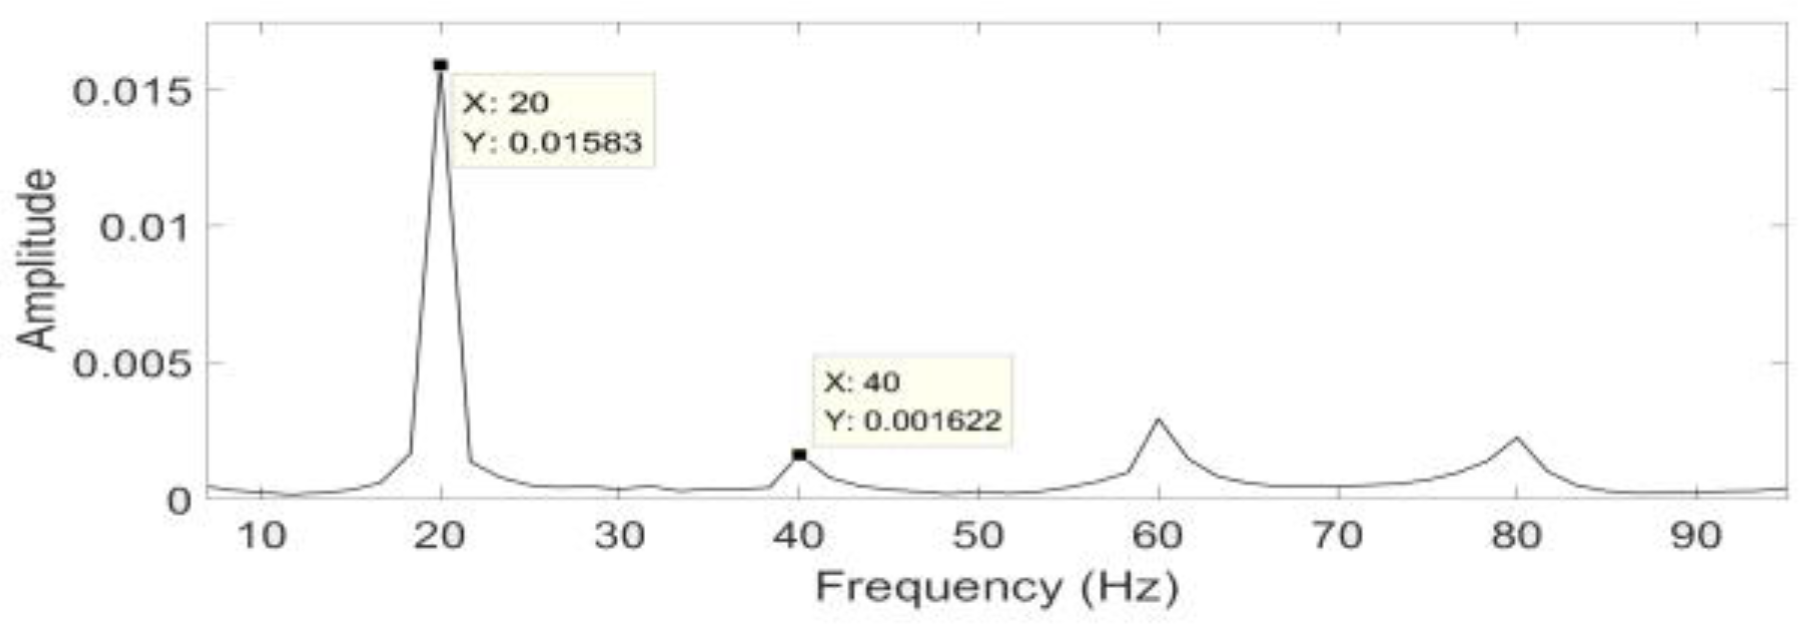
3. Analysis of Subsynchronous Resonance in a PMSG-Based Wind Farm

Eigenvalue analysis is used to evaluate SSR and its sensitivity to system parameters in PMSG-based wind farms. The eigenvalue loci under varying parameters are shown in the following graphs. The starting point of the eigenvalue loci is marked as ‘∗’, and the end point is marked as ‘o’. The physical meaning of the imaginary part i is explained as the frequency of oscillation ( i 2 π ). The real part’s physical meaning is related to system stability. Participation factor analysis can be used to quantify the participation of state variables in specific modes [30], with a maximum standardized to one and a minimum to zero.

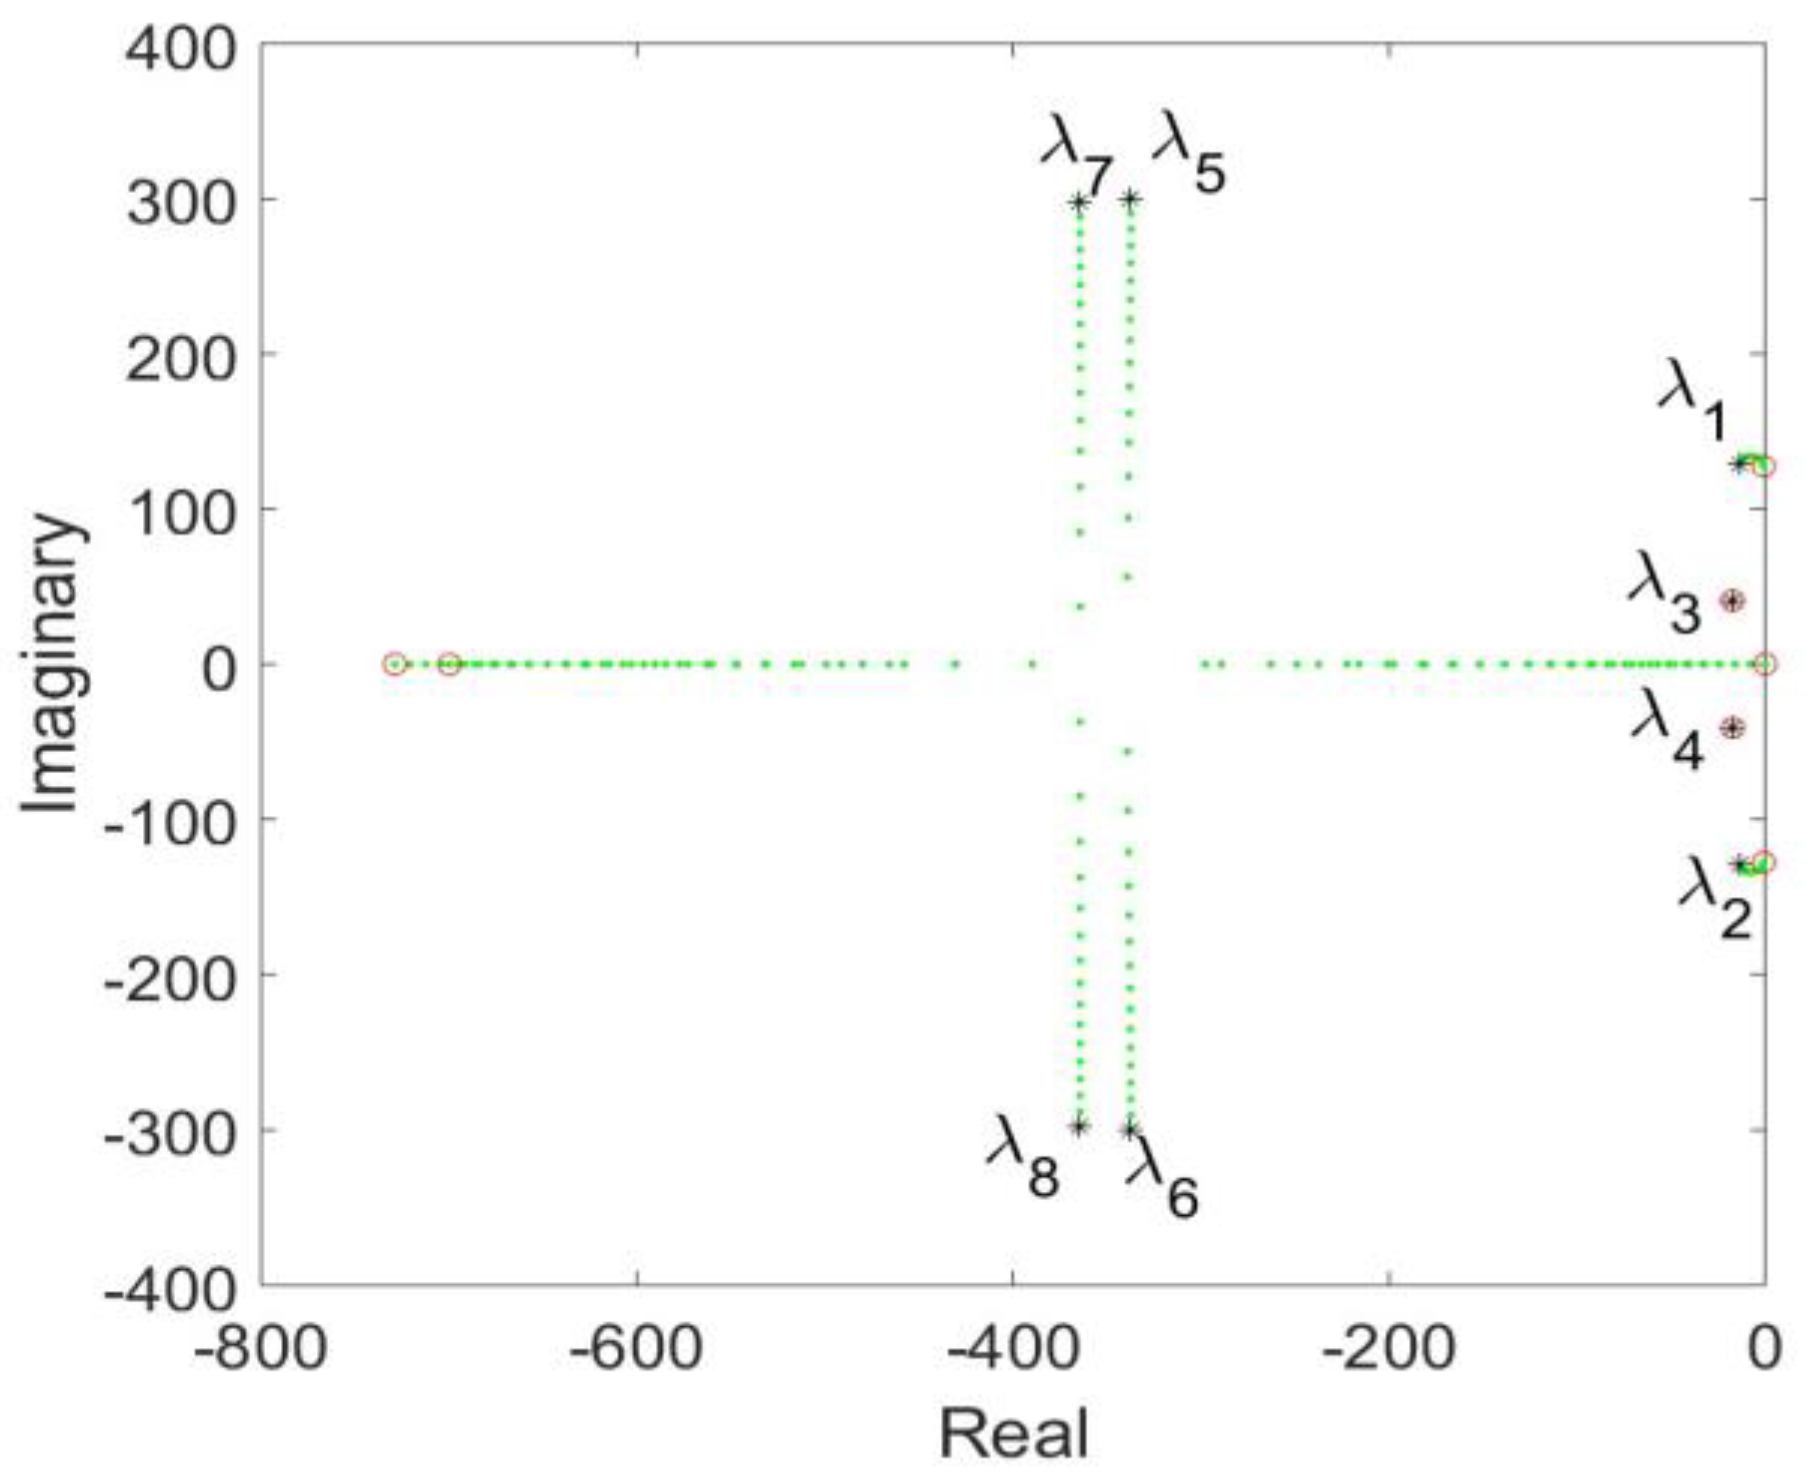
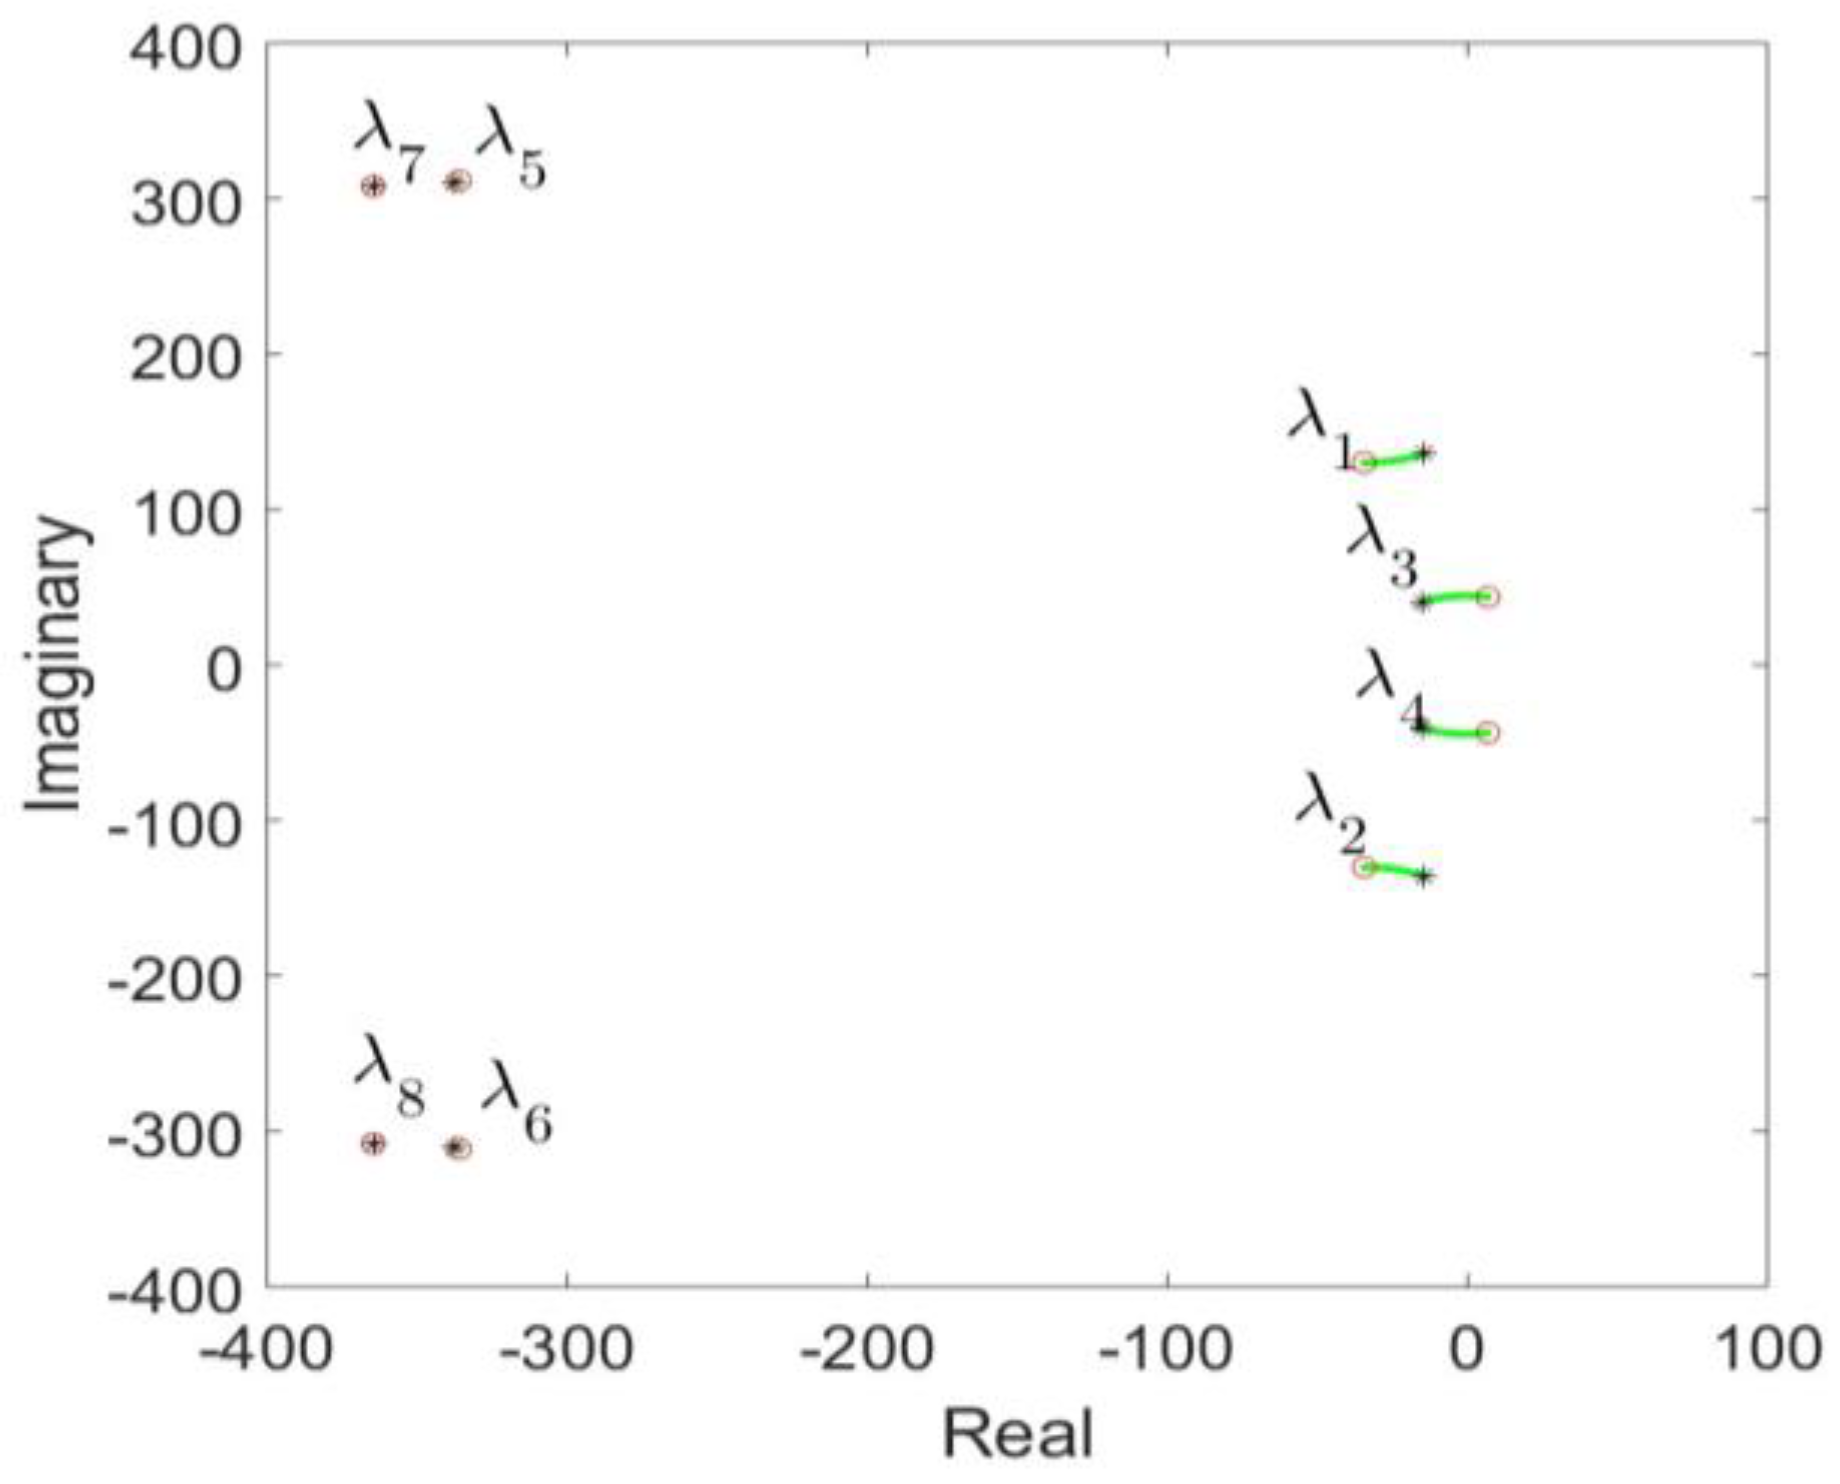
3.1. The Relationship between Current Inner Loop Control Parameters and SSR Characteristics

Reducing kp1 from 1 to 0.1 weakens the stability of the wind power system, as seen in Figure 4 where the SSR mode shifts from the left half plane to the right half plane. Figure 5 displays the participation factors of λ5,6,7,8 at kp1 = 0.1, revealing that x2 and igd are the main state variables that influence the change of mode λ5,6, while igq and x3 primarily affect the change of mode λ7,8.
Reducing ki1 brings a pair of SSR modes closer to the imaginary axis, increasing the risk of SSR as illustrated in Figure 6. Figure 7 displays the participation factors of λ5,6,7,8 at ki1 = 0.1, revealing that x2 and x3 are the main state variables influencing the change of mode λ5,6, while θppll and xppll primarily affect the change of mode λ7,8 due to their significant influence on system stability.

3.2. The Relationship between Voltage Outer Loop Control Parameters and SSR Characteristics

Increasing kp2 from one to two weakens the wind power system’s stability, as seen in Figure 8 where the SSR mode moves right. Figure 9 shows λ1,2’s participation factors for kp2 = 2, with Udc and x1 having the most significant impact on system stability. Figure 10 shows the wind power system’s SSR mode shifting to the right when ki2 is reduced from 1 to 0.1, indicating weakened stability. Figure 11’s participation factors for ki2 = 0.1 show Udc and x1 as the primary state variables affecting λ1,2 and system stability.

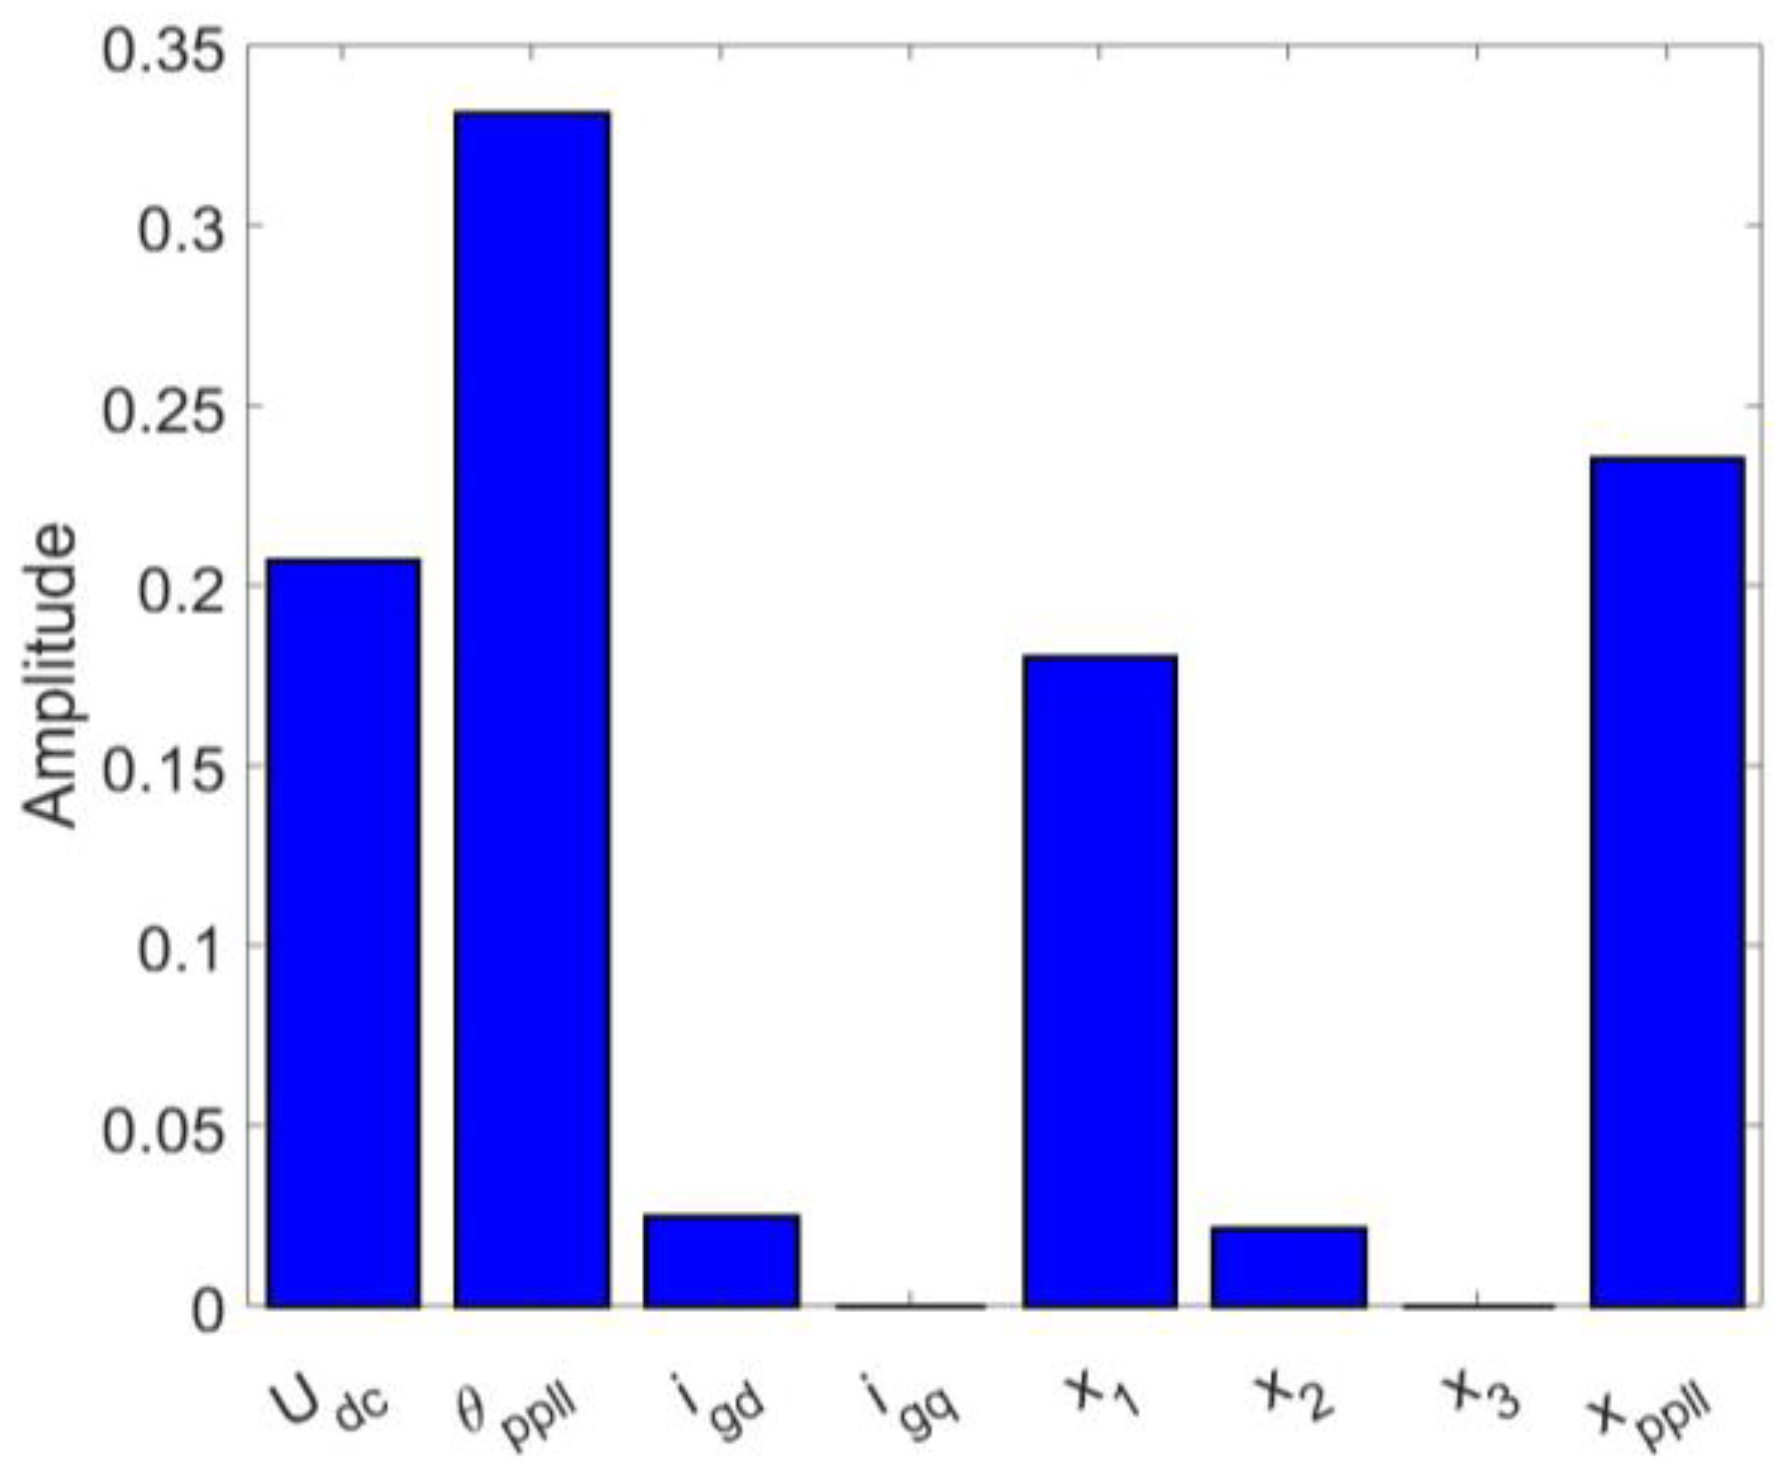
3.3. The Relationship between PLL Control Parameters and SSR Characteristics

As shown in Figure 12 and Figure 13, if either kipll or kppll increases, a pair of SSR modes will move from the left half plane to the right half plane, which means that SSR will occur in the wind power system. Figure 14 shows the participation factors of λ1,2 with kipll = 3. It can be seen that the main state variables affecting the change of mode λ1,2 are Udc, x1, θppll, xppll. Figure 15 shows the participation factors of λ1,2 with kppll = 3. It can be seen that the main state variables affecting the change of mode λ1,2 are Udc, x1, which have the greatest influence on the stability of the system.

3.4. The Relationship between SCR and SSR Characteristics

It is shown in [3] that SSR in a wind farm is related to SCR. SCR is an indicator of the power grid strength. Its calculation can be obtained by using Equation (6). In order to analyze the change of eigenvalue loci of a PMSG-based wind farm in a weak power grid, the value of L1 can be increased, which will weaken the power grid strength.
S C R = S g r i d / L Σ n S w i n d
where  L Σ L 1  +  L g  +  T g S g r i d  = 47 MW,  S w i n d  = 2 MW
Increasing L1 in weak power grids shifts SSR modes from the left to the right half plane in the S-domain, elevating the risk of SSR, as depicted in Figure 16. Figure 17 displays participation factors of λ1,2 (with SCR = 1.1), revealing Udc and x1 as primary state variables influencing λ1,2 modes.
In summary, the SSR of a PMSG-based wind farm is closely related to the control parameters, transmission line impedance, and SCR. However, in reality, some parameters are uncertain or irregular. The SSR characteristics of the PMSG-based wind farm are complex. For such a complex system, it is necessary to put forward high requirements for the robustness of the controller. Thus, it is necessary to design an effective robust SSR damping controller under the uncertain conditions of many factors. The design process of the controller will be described in Section 4.

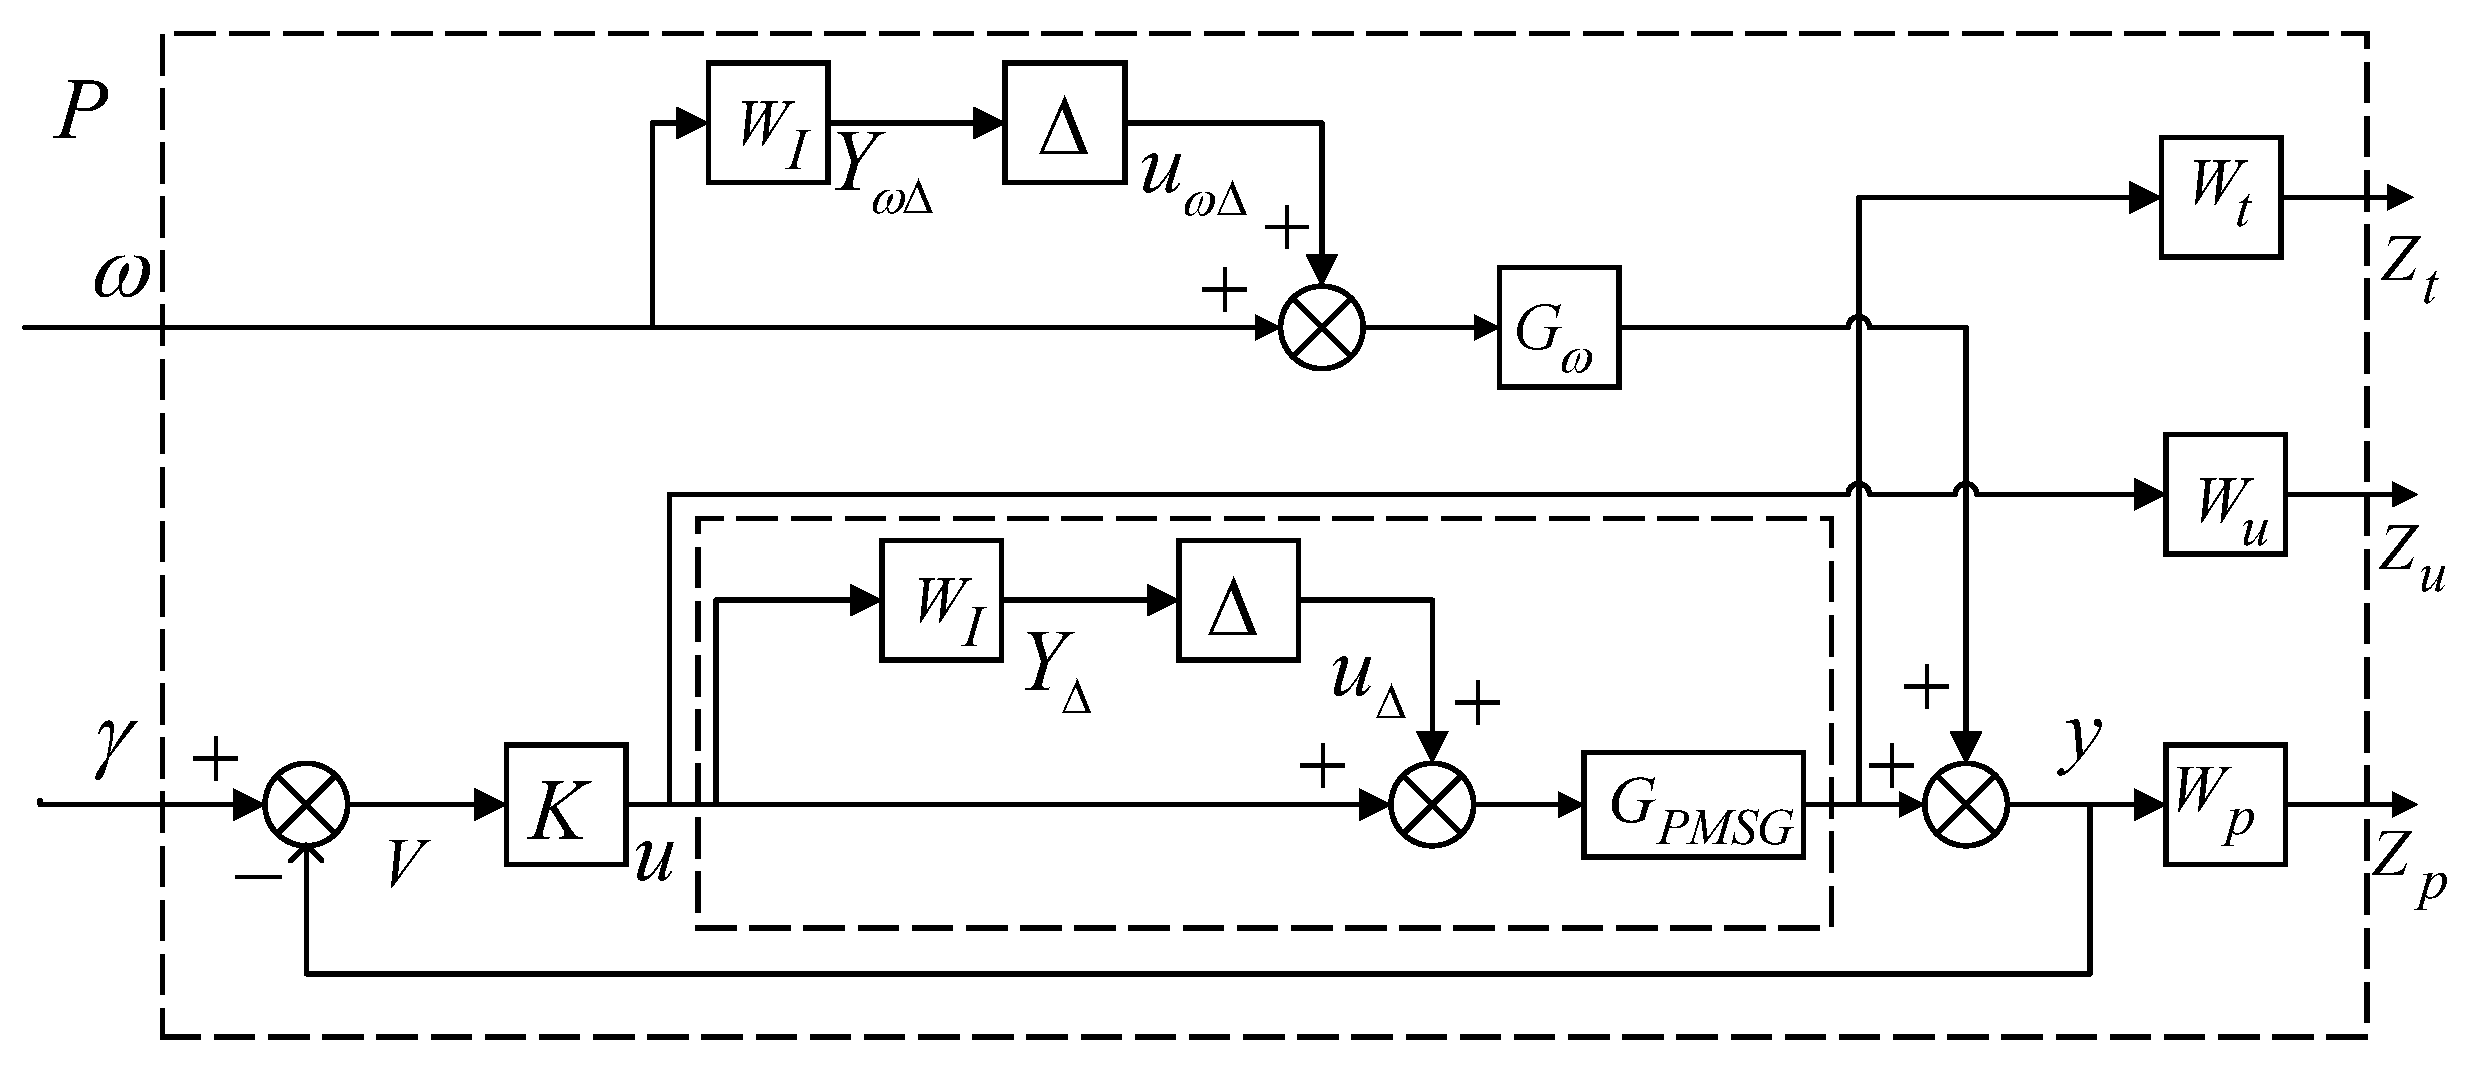
4. Designing of a Robust SSR Damping Controller

H robust control has unique advantages for uncertain system controller design. It ensures that the system remains stable under the worst conditions. The core of the idea of the robust controller is loop shaping, which makes the H norm of the transfer function of closed-loop control system optimal and meets the performance requirements of the robust control. H robust control design is similar to the baud chart design method in classical control theory, but it can be easily extended to the controller design of MIMO systems by introducing modern mathematical tools, such as H norm and µ norm. Thus, we design an SSR damping controller based on the H norm and µ norm theory. To design the SSR damping controller, the first step is to find the uncertain boundary of a PMSG-based wind farm. The second step is to design weighting functions related to control performance, output performance, and perturbation performance of a PMSG-based wind farm. The connection between the weight function and the system is shown in Figure 11. Finally, the stability of the system is verified, and the values of the designed parameters are listed in Table A2 (see Appendix A).

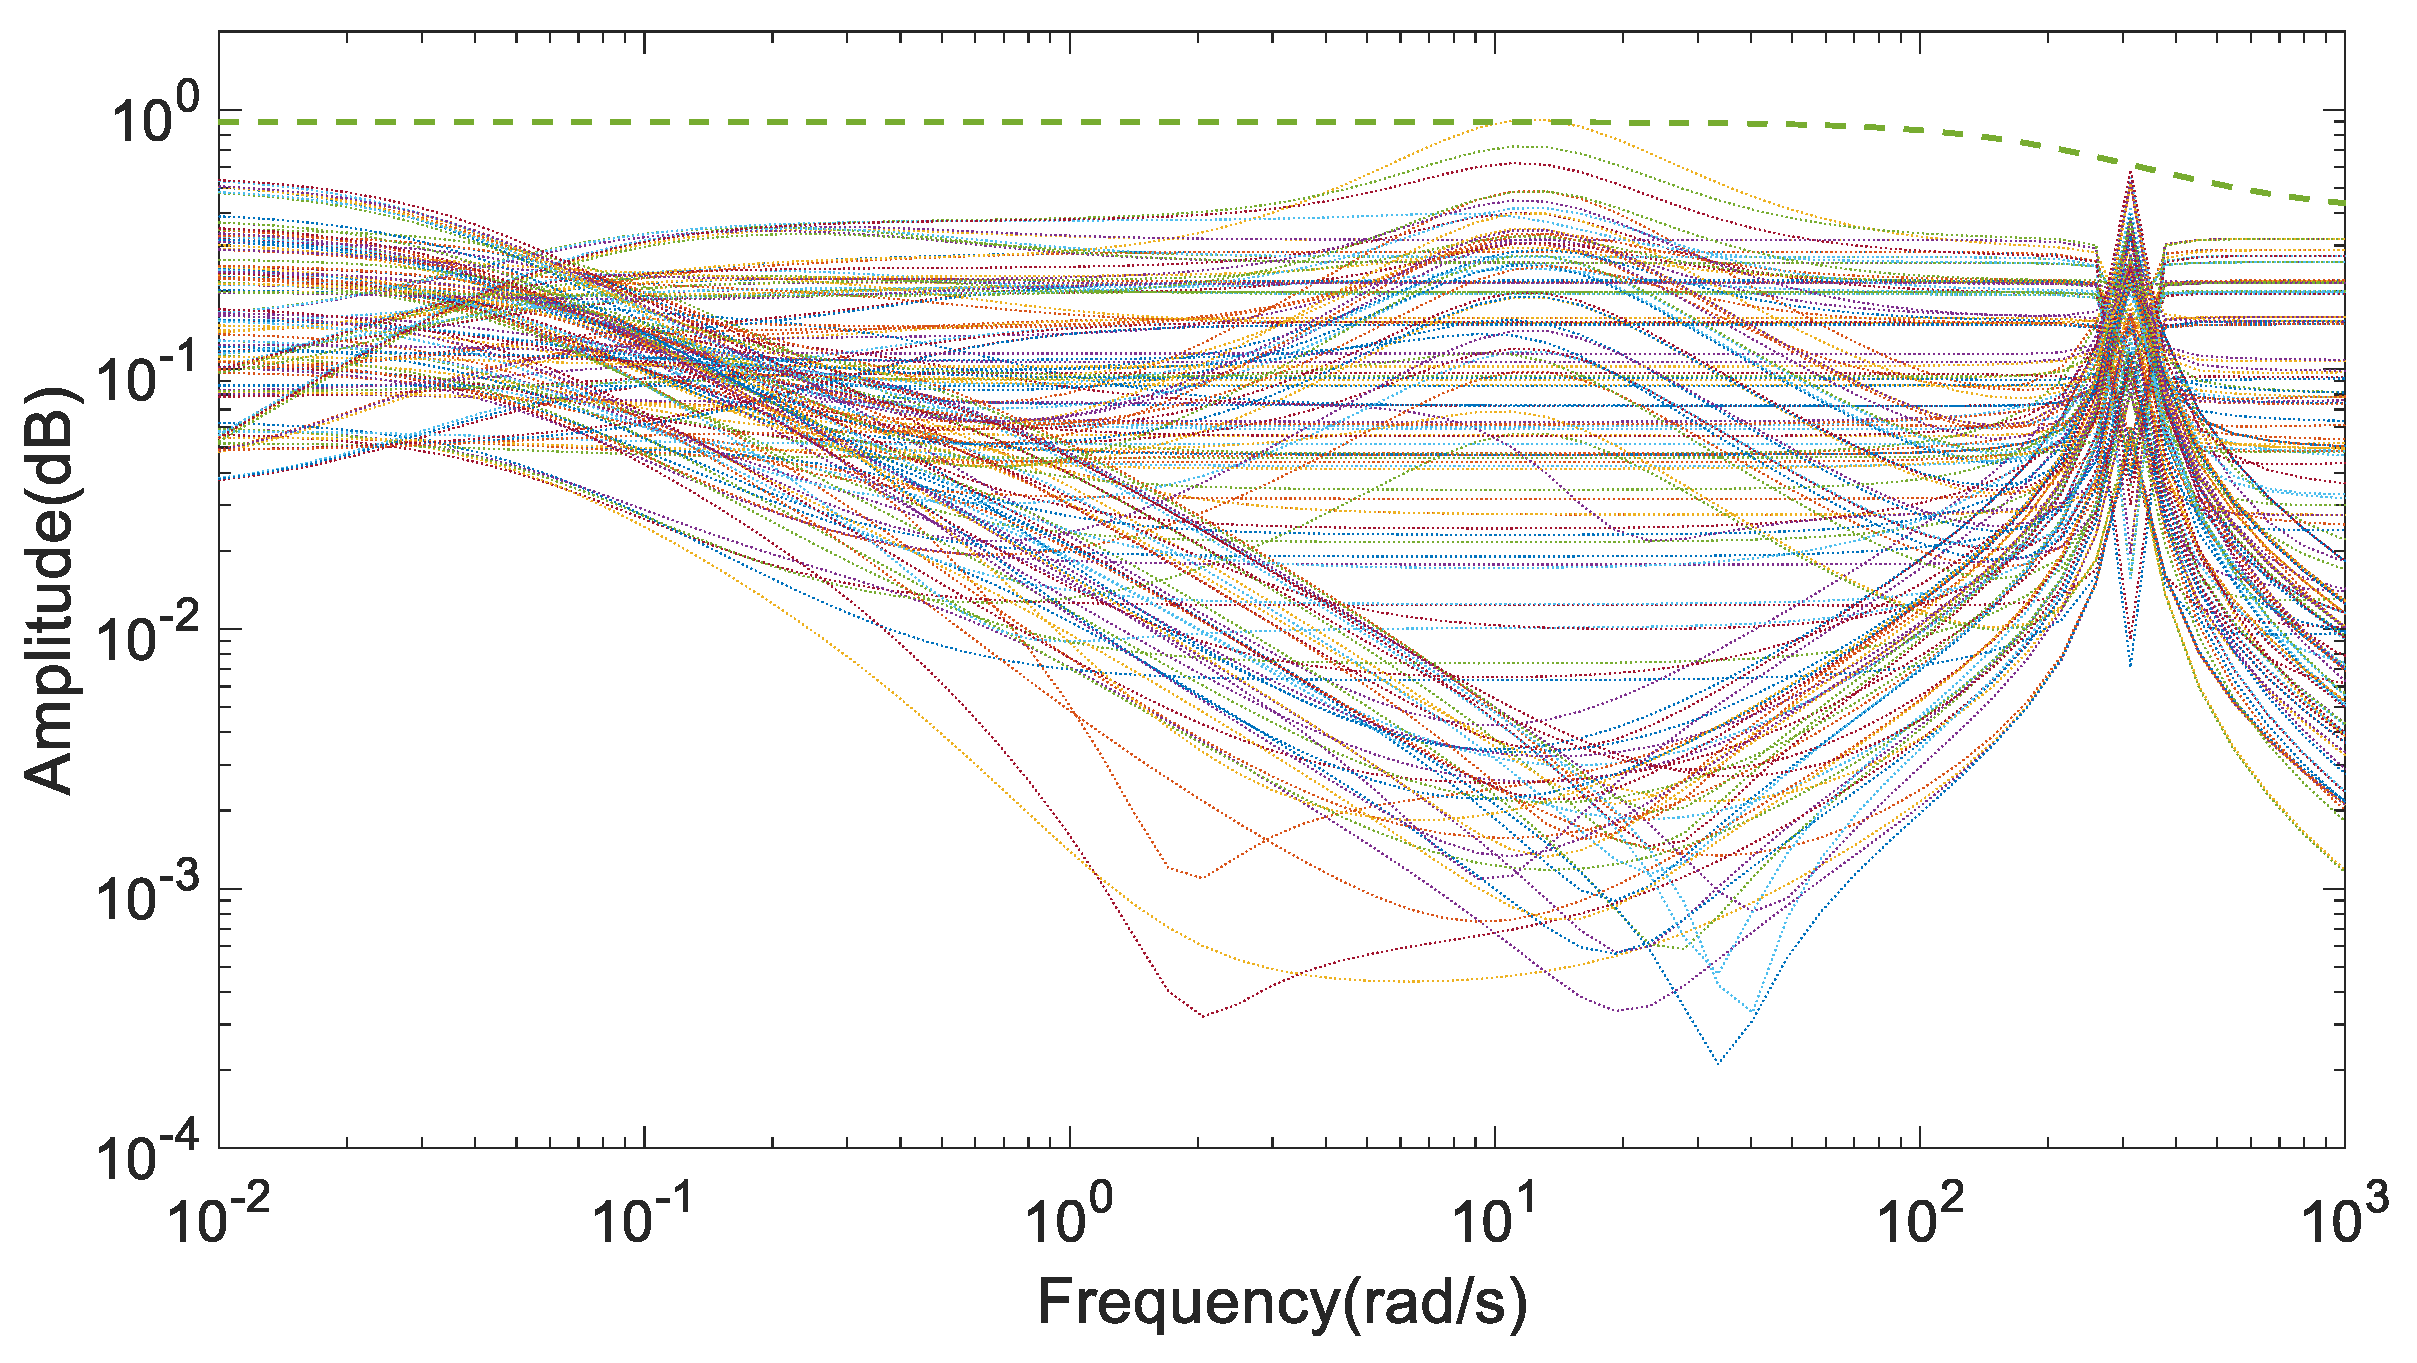
4.1. Finding Uncertainty Boundary

As shown in Figure 18, the uncertainty model of the system is divided into a deterministic model and an uncertain function. The uncertainty model can be expressed as  G s = ( W I + ) G , where  1 ; ∆ represents the set of all uncertainties in the system, and  l o ( j ω )  represents the boundary of the maximum uncertainty of the system. However,  l o ( j ω )  may be complex and difficult to be described mathematically, which is not conducive to the design of SSR damping controllers. Thus, a lower-order weight function  W I  can be used instead of  l o ( j ω ) . In addition, the singular value theory provides a description of the maximum gain for MIMO systems, and  σ  represents the upper bound of singular values. Thus, the function  W I  should satisfy Equation (7):
l o ( j ω ) = max G s Π σ ( ( G s G ) G 1 ( j ω ) ) W i ( j ω ) l o ( j ω ) ; ω
Assume that the system parameters R1, Rg, L1, and Lg have the uncertainty of ±30%. Within this range, these parameters are randomized. A total of 500 samples from uncertain set Gs are obtained. The maximum singular value curves of the samples are calculated by the method of singular value decomposition and plotted, as shown in Figure 19, and WI is shown in Equation (8).
W i = ( a 1 s + ω 1 ) ( a 2 s + ω 2 )

4.2. Designing Weight Function

The designing of the weighting function is important for the SSR damping controller. The suppression of high-frequency harmonics and specific SSR harmonics should be considered when designing the weight function. The designed weight function restricts the frequency signal of the system. In this part, three weight functions are determined, which are Wu, Wt, and Wp. The control signal weight Wu is designed to allow for a sufficient control effort. At the same time, filter harmonics may come from disturbances into the controller. Thus, Wu can be expressed as the following Equation (9):
W u = K 1
where K1 is used to provide sufficient gain for Wu.
The weight function Wp is selected to improve the performance of a PMSG-based wind farm, and  1 / W P  determines the upper bound of the system sensitivity function S. The main objective of Wp is to suppress low-frequency disturbances. Thus, Wp can be represented by Equation (10):
W p ( s ) = s / M p + ω p s + ω p A p
where Mp is the upper bound of |S| in the high-frequency band, Ap is the upper bound of |S| in the low-frequency band, and ωp is the bandwidth frequency of function S.
Wt is a complementary sensitivity weight function, which constrains the complementary sensitivity function T of the system, and |1/Wt| defines the upper bound of the sensitivity function of the system. Wt can be expressed as the following Equation (11):
W t = s + ω t A t s / M t + ω t ( s + ω 1 ) 2 s 2 + 2 ξ 1 ω 1 + ω 1 2
where At represents the upper bound of the complementary sensitivity function in the low-frequency band, and ωt represents the bandwidth of complementary sensitivity function.

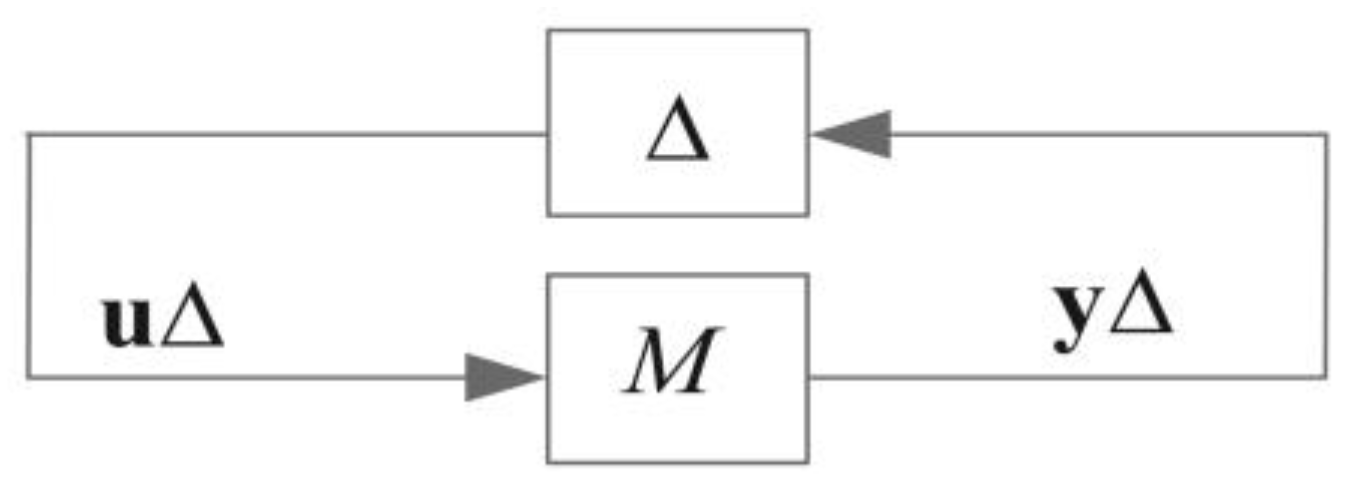
4.3. Designing an SSR Damping Controller

Without losing generality, the closed-loop system with uncertain disturbances can be represented as the standard structure shown in Figure 13. P(s) is a generalized or augmented control object, K(s) is a controller, w is interference signals, u is control input signals, z is control or evaluation signals, and y is observations. According to Figure 18 and Figure 20, the transfer function matrix from  [ u Δ T , w r T , w d c T , w d g T , u T ] T  to  [ y Δ T , Z u T , Z t T , Z p T , v T ] T  is established as Equation (12):
y Δ Z u Z t Z p v = P ( s ) u Δ ω r ω d c ω d g u = P 11 ( s ) P 12 ( s ) P 21 ( s ) P 22 ( s ) u Δ ω r ω d c ω d g u
The state space implementation of generalized plant P is expressed in Equation (13):
P = 0 0 W I 0 0 W u W t G 0 W t G W p G W p G ω W p G G G ω G
The upper linear fractional transformation (LFT) and the structured singular value (known as µ) are introduced as the unified tools for robust stability and performance analysis and synthesis. The transfer function from w to z can be given by a linear fractional transformation, expressed as Equation (14).
F l ( P , K ) P 11 + P 12 K ( I P 22 K ) 1 P 21
where
S = ( I + G K ) 1 T = I S R = K S
N = S K W u T W u G ω S K W u T W t G S W t G ω T W t T W p G S W p G ω S W p S K W i T W i G ω S K W i
The standard problem of H suboptimal control is to obtain a controller K, which makes the closed-loop system internally stable and minimizes  F l ( P , K ) γ , and  γ < 1 . Figure 21 and Figure 22 show the sensitivity and complementary sensitivity curves of the system, which are both below the 1/Wp and 1/Wt, weight functions.

4.4. Performance Evaluation
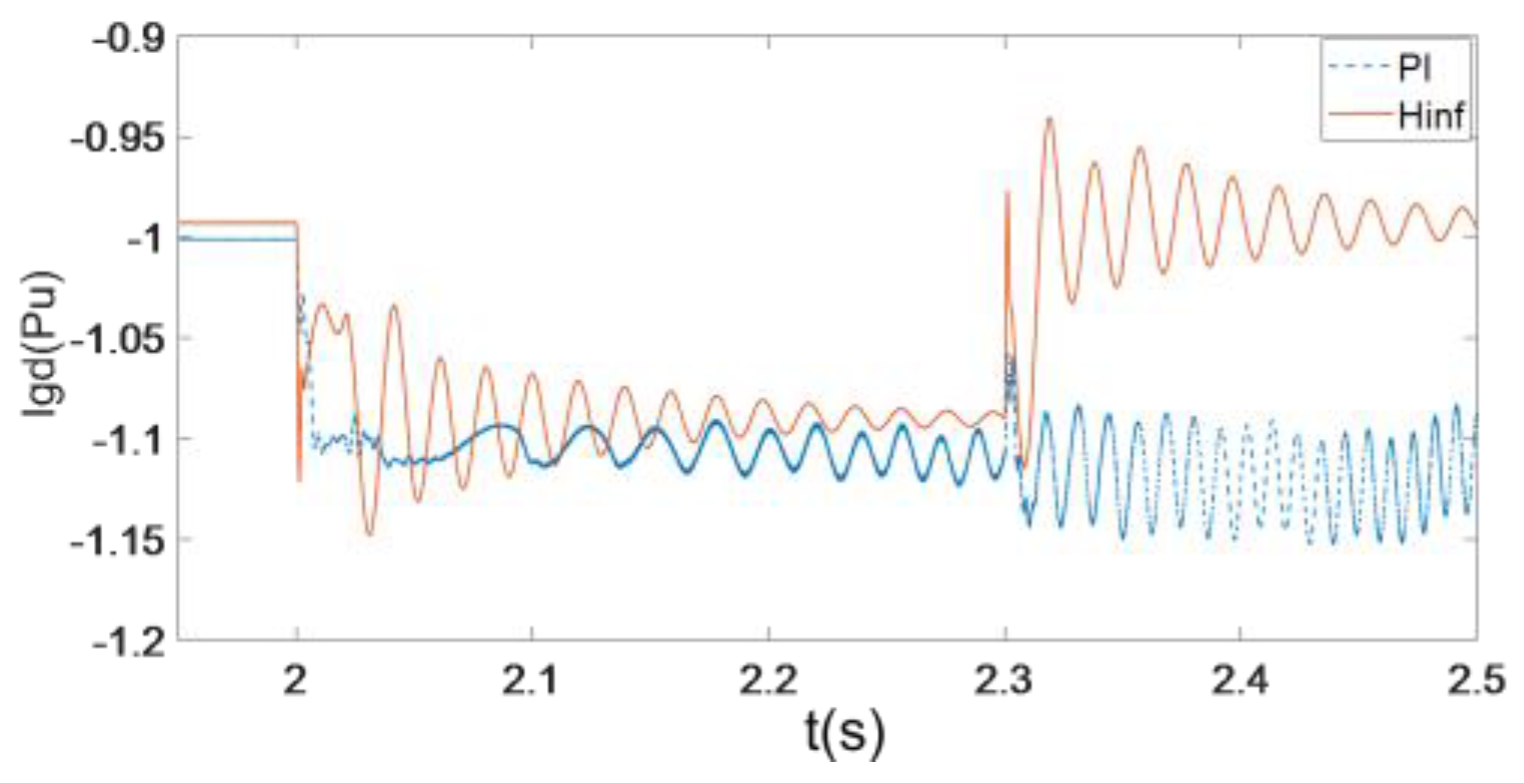
Structured singular values provide a general description of singular values and spectral radius and can be used to obtain sufficient and necessary conditions for robust stability (RS) and robust performance (RP) in MIMO systems, shown as Equations (17) and (18). RS describes the stable performance of input uncertainty to output uncertainty, as shown in Figure 23, where M = WIT.
R S µ ( M ( j ω ) ) σ ( ( j ω ) ) < 1 , ω
RP means that even in the worst case, performance requirements can be satisfied. A PMSG-based wind farm equivalent to N∆ structure for RP analysis is shown in Figure 24.
R P µ ( N ( j ω ) ) < 1 , ω
As shown in Figure 25, both RS and RP curves are under 0 dB. In other words, the maximum amplitude of the two curves is less than one; thus, RS and RP of the system satisfy the performance requirements. When RP(µ(N)) is less than one, the conditions required by NP will also be satisfied.

5. Simulation

This part verifies the performance of the H robust controller from five aspects. The test system is composed of 5 × 2 MW PMSGs, and the reactive power reference is set to zero. Since the direction of power flow from power grid to wind farm is defined as positive, the direction of power flow from wind farm to power grid is defined as negative.

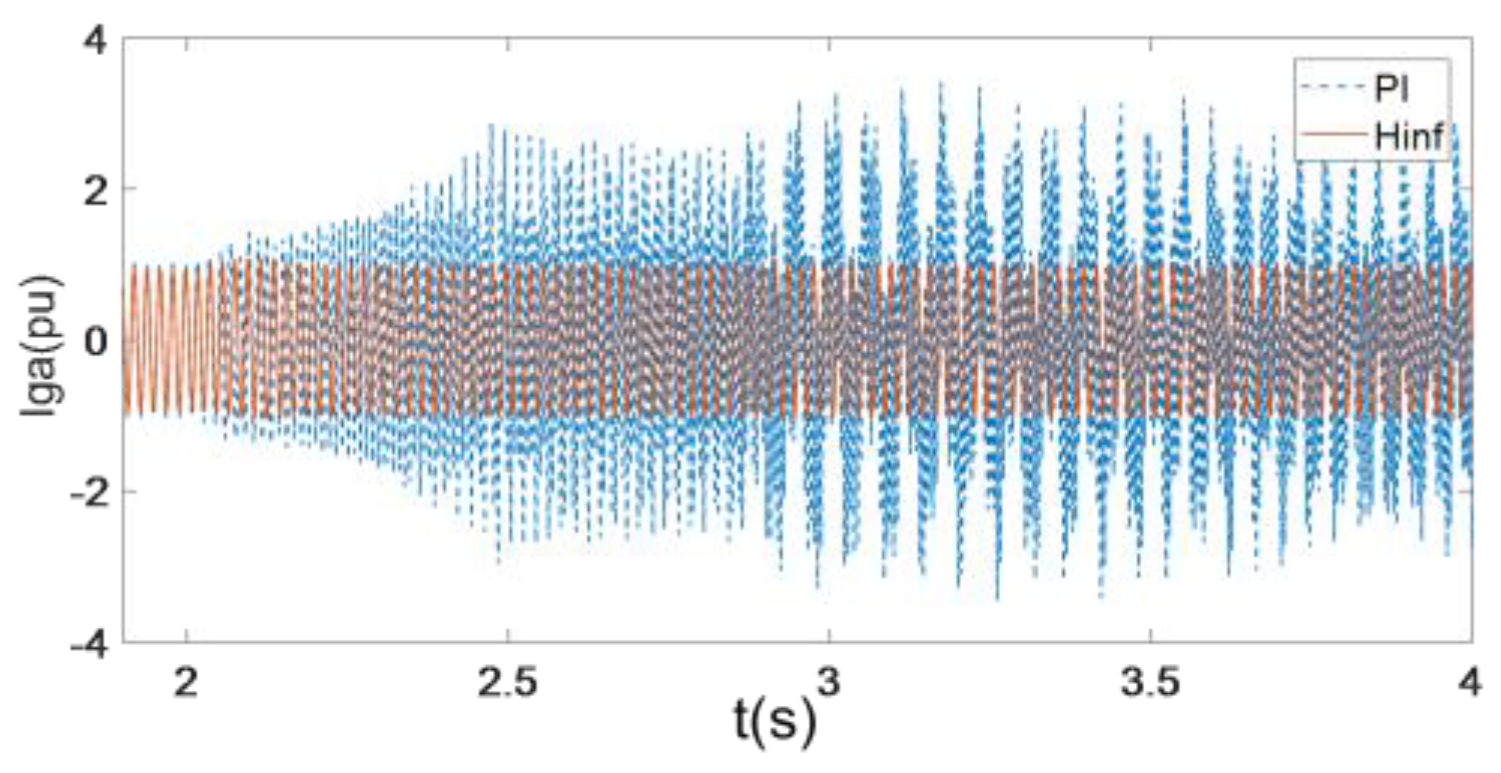
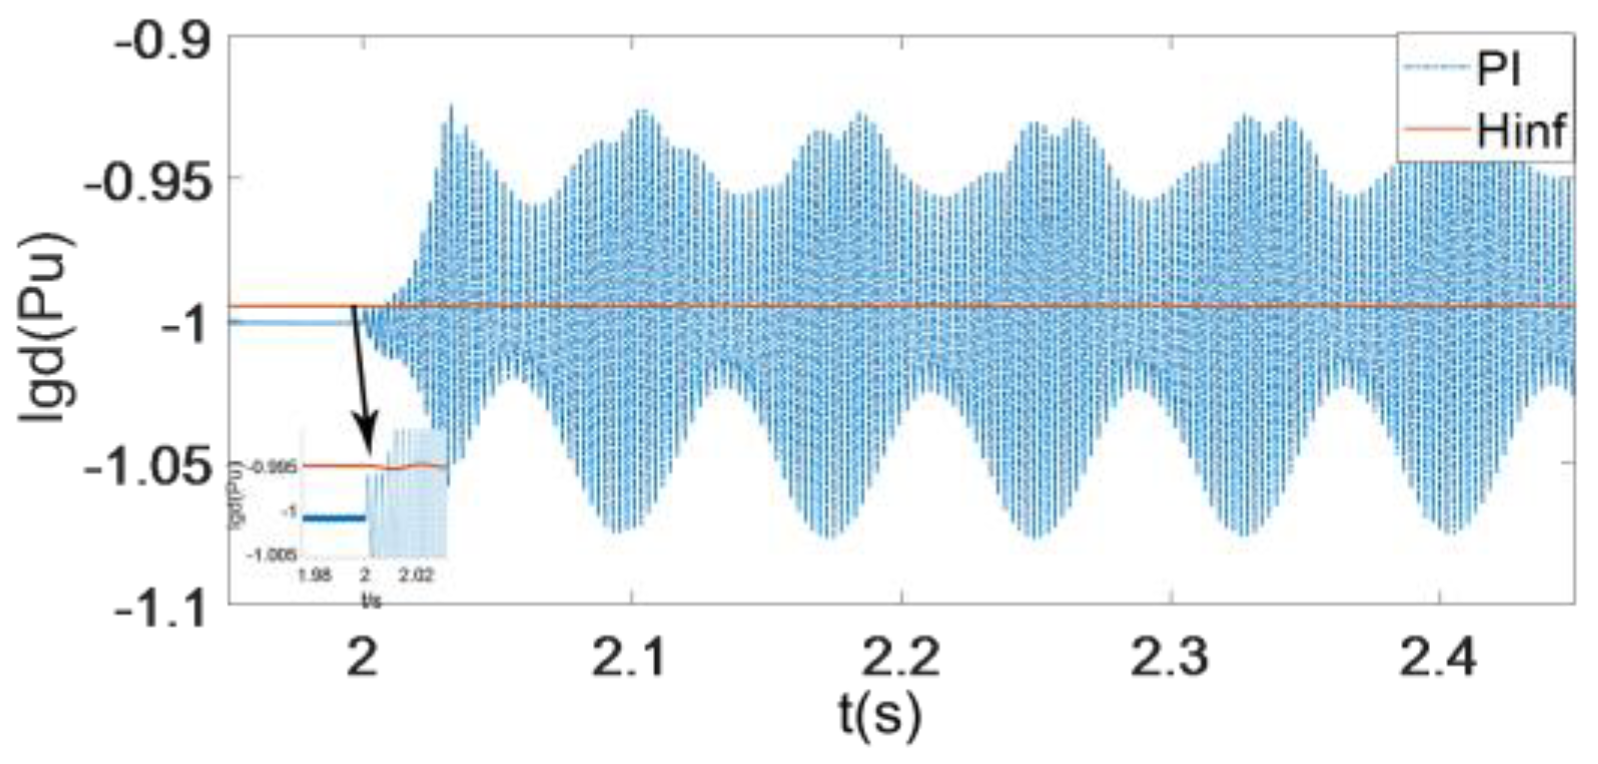
5.1. Stability Comparison with Grid Voltage Disturbance

As shown in Figure 26, current igd of the converter in the PI controller and the robust controller is represented as a dotted line and a solid line, respectively. Voltage drops from 1 to 0.45 in 2 s∼2.3 s. Since current igd in the PI controller is still oscillating with no convergence after voltage recovery, the oscillation signals from 2.3 s to 2.5 s are selected for FFT analysis to further observe the harmonics caused current oscillation. The analysis result is shown in Figure 27.
As shown in Figure 26 and Figure 27, the SSR damping controller can provide a higher stability margin than the PI controller at the same voltage drop point. After voltage restoration, current under the SSR damping controller can recover, while current iga under the PI controller is oscillating. Current iga of the PI control system has a 25 Hz subsynchronous harmonic component and some hypersynchronous components as shown in Figure 26. It can be seen that the instability of the system may be caused by the SSR and hypersynchronous oscillations. At the same time, it can be seen that the SSR damping controller can suppress high-frequency harmonics and specific low-frequency oscillations.

5.2. The Influence of Different Impedance of Transmission Line on SSR

In this case study, the main purpose is to verify the performance of the controller under different impedance. Transmission line impedance of the system is set to 0.04 pu before 2 s. We increase the impedance by 0.1 at 2 s, i.e., Lm equals 0.14 pu. Current iga under different impedance of the transmission line is shown in Figure 28. Current iga begins to diverge and oscillate after 2 s under the PI controller. The harmonic components of iga are analyzed by FFT from 2.5 s to 3.5 s. As shown in Figure 29, the current contains two harmonic components: 17.7 Hz and 23.4 Hz. However, current iga is stable in the SSR damping control system both before 2 s and after 2 s, which indicates that the SSR damping controller has better harmonic suppression than the PI controller.

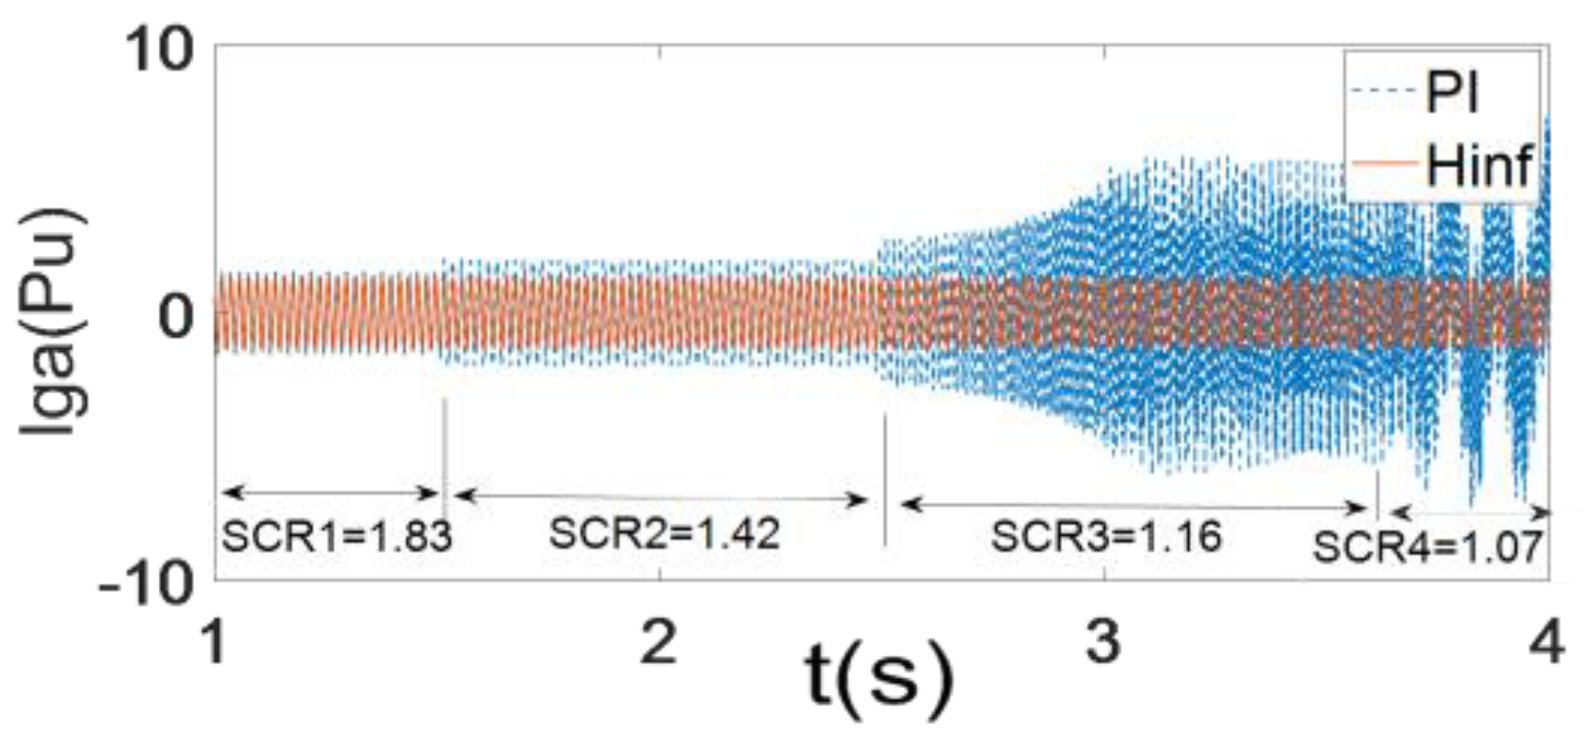
5.3. The Influence of Different SCR on SSR

In order to compare the contribution of the SSR damping controller and the PI controller to system stability under different SCR conditions, the number of wind turbines is increased, and they are connected to the grid at t = 1.5 s, t = 2.5 s, t = 3.5 s, respectively. At the same time, the output power of the wind farm is indirectly increased, and the short circuit ratio of the system has changed. Figure 30 shows the waveform of current iga under different SCR conditions. It can be seen that the current oscillation is low when SCR2 equals 1.42 in Figure 30.
As shown in Figure 31, the result of FFT analysis indicates that peak values appear at frequency points of 23.33 Hz, 45.56 Hz, 55.56 Hz, and 77.78 Hz, which means that current iga contains both SSR frequency and super synchronous resonance frequency. The comparison between different SCR is shown in Figure 32 and Figure 33. Compared with the PI controller, the output of current iga under the SSR damping controller is more stable without causing resonance, which proves that the SSR damping controller can achieve better performance for the system.

5.4. The Influence of Different Voltage Outer Loop Parameters on SSR

Figure 34 and Figure 35 compare the performance of the PI controller and the SSR damping controller with different voltage outer loop parameters, showing the latter has better SSR suppression ability. Figure 36 and Figure 37 are the FFT analysis results of current iga from 2.0 s to 2.5 s, showing the better robust performance of the SSR damping controller.

5.5. The Influence of Different PLL Control Parameters on SSR

Figure 38 shows that with the value of kppll changing from 1.1 to 3.3 at t = 1.5 s, the current with the SSR damping controller can keep stable, whereas the PI controller in Figure 39 caused subsynchronous oscillations at 30 Hz from 1.6 s to 2 s.
In Figure 40, when kipll is changed from 1.1 to 6.5, igd shows subsynchronous oscillations with both the PI controller and the SSR damping controller. The FFT analysis results of igd between 2.5 s and 3.5 s by the PI controller is shown in Figure 41, in which the SSR frequencies include 7.78 Hz, 15.56 Hz, 22.22 Hz, and 37.78 Hz.

6. Conclusions

In order to solve the problem of SSR of a grid-connected direct-drive wind farm, this paper considered the uncertainties of various factors in the system, analyzed the influencing factors of SSR, and designed a H damping filter controller, which aims at improving the system damping and suppressing the harmonics in the system. The controller has been validated by time domain simulations. The results show that: (1) The designed controller provides the system with a higher stability margin under SSR. (2) The control performance of the H damping filter controller is validated under changes of the voltage outer loop, PLL parameters, line impedance, and wind farm capacity. The results show that the H damping filter controller has better robust control performance. (3) By designing the weight function, the H damping filter controller can show excellent suppression performance at subsynchronous frequency harmonics.

Author Contributions

Conceptualization, Y.W. and R.Y.; methodology, Y.W. and R.Y.; software, G.T. and F.L.; validation, C.L. and F.L.; formal analysis, F.L.; investigation, C.L.; resources, Y.W. and Y.X.; data curation, G.T.; writing—original draft preparation, Y.W. and G.T.; writing—review and editing, F.L.; visualization, F.L.; supervision, Y.W.; project administration, Y.W.; funding acquisition, Y.W. and Y.X. All authors have read and agreed to the published version of the manuscript.

Funding

This research was funded in part by the Science and Technology Research and Development Foundation of Shenzhen, grant number JCYJ20190808112605503 and 20200813140339001.

Data Availability Statement

Not applicable.

Conflicts of Interest

The authors declare no conflict of interest.

Abbreviations

  L 1 , R 1 Filter resistance and inductance of GSC
  L g , R g Transmission line resistance, transmission line inductance
  C , U d c DC link capacitance, voltage of dc link capacitance
  U g d , U g q D-axis voltage and q-axis voltage of GSC in rotating dq reference frame
  U p c c d , U p c c q D-axis voltage and q-axis voltage in the point of common coupling (PCC) voltage
  ω g Grid frequency
  T g Transformer reactance
  i g d , i g q dq axis components of the grid-side converter’s injected currents
  θ p l l Angle of PCC voltage
  k i 1 , k p 1 Inner loop integral and proportional parameters of GSC controller
  k i 2 , k p 2 Outer loop integral and proportional parameters of GSC controller
  k i p l l , k p p l l Integral and proportional parameters of PLL controller
  d d , d q dq axis duty cycle of GSC converter
  d * Reference value of variable

Appendix A

Table A1. The parameters of a wind power system.
Parameter NameValueParameter NameValue
L10.05R10.005
Lg0.3Rg0.02
kp11.1ki150
kp21.1ki250
kppll28kipll1400
Wind Farm10 MWGrid47 MW
Table A2. The parameters of the weighting function.
Parameter NameValueParameter NameValue
  ω 1 600   ω 2 670
  a 1 1.2   a 2 3
  ξ 1 0.092   ω 1 150
  M p 2   M t 20
  ω p 1500   ω t 1584
  A p 0.001   A t 0.01

Appendix B

A = [ 0 0 0 0 0 0 0 a 18 a 21 0 0 0 0 a 26 0 a 28 0 0 0 0 0 0 a 37 0 0 0 0 0 a 45 0 0 0 0 0 0 a 54 a 55 a 56 a 57 0 a 61 a 62 0 0 a 65 a 66 0 a 68 0 0 a 73 0 a 75 0 a 77 0 0 0 0 0 a 85 a 86 a 87 0 ]
a 18 = 1 , a 21 = k i 2 , a 26 = 1 , a 28 = k i 2 , a 37 = 1 , a 45 = Δ θ U g d 0 , a 54 = k i p l l , a 55 = Δ θ U g d 0 k p p l l , a 56 = Δ θ ω g L g k p p l , a 57 = R g k p p p l , a 61 = k p 1 k p 2 L g , a 62 = k i 1 L g , a 65 = Δ θ ( i g d 0 i g q 0 ) , a 66 = k p c + R 1 L g , a 68 = k p 1 k p 2 L g , a 73 = k i 1 L g , a 75 = Δ θ ( i g d 0 + i g q 0 ) , a 77 = k p 1 + R g L g , a 85 = Δ θ ( i g d 0 i g q 0 ) d d c + ( i g d 0 + i g q 0 ) d q c , a 86 = d d c , a 87 = d q c .
B = [ 0 0 1 0 0 0 k p 2 0 0 0 0 1 0 1 0 0 0 k p p l l 0 0 1 0 k p 1 k p 2 L g 0 0 1 0 k i 2 L g 0 0 0 0 ] x = [ x 1 x 2 x 3 x p p l l θ p l l i g d i g q U d c ] T u = [ V p c c q V p c c q U r e f d c   i r e f g q ] T

References

  1. Janhunen, O.-P.; Korhonen, R.; Linnamaa, L.; Kuusela, A.; Rauhala, T. Experiences on studies for subsynchronous oscillation risks of wind power plants connected in the vicinity of finnish series compensated network. In Proceedings of the 20th International Workshop on Large-Scale Integration of Wind Power into Power Systems as Well as on Transmission Networks for Offshore Wind Power Plants (WIW 2021), Hybrid Conference, Berlin, Germany, 29–30 September 2021; pp. 414–422. [Google Scholar] [CrossRef]
  2. IEEE Subsynchronous Resonance Working Group of the System Dynamic Performance Subcommittee Power System Engineering Committee. Terms, Definitions and symbols for subsynchronous oscillations. IEEE Trans. Power Appar. Syst. 1985, PAS-104, 1326–1334. [Google Scholar] [CrossRef]
  3. Liu, H.; Xie, X.; He, J.; Xu, T.; Yu, Z.; Wang, C.; Zhang, C. Subsynchronous interaction between direct-drive PMSG based wind farms and weak AC networks. IEEE Trans. Power Syst. 2017, 32, 4708–4720. [Google Scholar] [CrossRef]
  4. Shair, J.; Xie, X.; Yang, J.; Li, J.; Li, H. Adaptive damping control of subsynchronous oscillation in DFIG-based wind farms connected to series-compensated network. IEEE Trans. Power Deliv. 2022, 37, 1036–1049. [Google Scholar] [CrossRef]
  5. Gu, K.; Wu, F.; Zhang, X.; Ju, P.; Zhou, H.; Luo, J.; Li, J. SSR analysis of DFIG-based wind farm with VSM control strategy. IEEE Access 2019, 7, 118702–118711. [Google Scholar] [CrossRef]
  6. Beza, M.; Bongiorno, M. On the risk for subsynchronous control interaction in Type 4 based wind farms. IEEE Trans. Sustain. Energy 2019, 10, 1410–1418. [Google Scholar] [CrossRef]
  7. Ren, B.; Li, Q.; Zhou, Q.; Wang, C.; Sun, R.; Jia, Y.; Li, H. Analysis and comparison of multi-parameter factors affecting the stability of subsynchronous oscillation of grid-connected PMSG. Energy Rep. 2022, 8, 51–58. [Google Scholar] [CrossRef]
  8. Feng, S.; Wang, K.; Lei, J. Influences of DC bus voltage dynamics in modulation algorithm on power oscillations in PMSG-based wind farms. Int. J. Electr. Power Energy Syst. 2021, 124, 106387. [Google Scholar] [CrossRef]
  9. Yuan, L.; Meng, K.; Huang, J. Investigating subsynchronous oscillations caused by interactions between PMSG-based wind farms and weak AC systems. Int. J. Electr. Power Energy Syst. 2020, 115, 105477. [Google Scholar] [CrossRef]
  10. Shao, B.; Xiao, Q.; Meng, X.; Han, P.; Ma, W.; Miao, Z.; Blaabjerg, F.; Chen, Z. Medium-frequency and sub-synchronous oscillation analysis of direct-drive wind farms connected to the parallel-compensated AC grid. Electr. Power Syst. Res. 2023, 216, 109061. [Google Scholar] [CrossRef]
  11. Jiang, H.; Ma, S.; Song, R. Subsynchronous control interaction analysis between PMSG-based offshore wind farm and SVGs. Energy Rep. 2023, 9, 938–945. [Google Scholar] [CrossRef]
  12. Li, P.; Xiong, L.; Ma, M. Energy-shaping L2-gain controller for PMSG wind turbine to mitigate subsynchronous interaction. Int. J. Electr. Power Energy Syst. 2022, 135, 107571. [Google Scholar] [CrossRef]
  13. Ma, J.; Song, Z.; Zhang, Y.; Shen, Y.; Thorp, J.S. Model order reduction analysis of DFIG integration on the power system small-signal stability considering the virtual inertia control. IET Gener. Trans. Distrib. 2017, 11, 4087–4095. [Google Scholar] [CrossRef]
  14. Ali, H.R.; Kunjumuhammed, L.P.; Pal, B.C.; Adamczyk, A.G.; Vershinin, K. Model order reduction of wind farms: Linear approach. IEEE Trans. Sustain. Energy 2019, 10, 1194–1205. [Google Scholar] [CrossRef] [Green Version]
  15. Ali, H.R.; Kunjumuhammed, L.P.; Pal, B.C.; Adamczyk, A.G.; Vershinin, K. A trajectory piecewise-linear approach to nonlinear model order reduction of wind farms. IEEE Trans. Sustain. Energy 2020, 11, 894–905. [Google Scholar] [CrossRef]
  16. Xie, X.; Zhang, X.; Liu, H.; Liu, H.; Li, Y.; Zhang, C. Characteristic analysis of subsynchronous resonance in practical wind farms connected to series-compensated transmissions. IEEE Trans. Energy Convers. 2017, 32, 1117–1126. [Google Scholar] [CrossRef]
  17. Liu, H.; Xie, X. Comparative studies on the impedance models of VSC-based renewable generators for SSI stability analysis. IEEE Trans. Energy Convers. 2019, 34, 1442–1453. [Google Scholar] [CrossRef]
  18. Liu, W.; Xie, X.; Shair, J.; He, J. Frequency-coupled impedance model based subsynchronous oscillation analysis for direct-drive wind turbines connected to a weak AC power system. J. Eng. 2019, 18, 4841–4846. [Google Scholar] [CrossRef]
  19. Liu, W.; Xie, X.; Shair, J.; Liu, H.; He, J. Frequency-coupled impedance model-based sub-synchronous interaction analysis for direct-drive wind turbines connected to a weak AC grid. IET Renew. Power Gener. 2019, 13, 2966–2976. [Google Scholar] [CrossRef]
  20. Luo, C.; Guo, Q.; Xiao, X.; Gole, A.M.; Liao, M. Study on subsynchronous resonance damping control for series-compensated DFIG-based wind farm. In Proceedings of the 2019 IEEE Sustainable Power and Energy Conference (iSPEC), Beijing, China, 21–23 November 2019; pp. 419–424. [Google Scholar] [CrossRef]
  21. Ma, Z.; Wang, D.; Zhao, L.; Li, Z.; Hu, H.; Tang, Z. Research on the subsynchronous oscillation characteristics of different wind farms connected to the grid via VSC-HVDC. In Proceedings of the 2021 4th International Conference on Advanced Electronic Materials, Computers and Software Engineering (AEMCSE), Changsha, China, 26–28 March 2021; pp. 366–375. [Google Scholar] [CrossRef]
  22. Alawasa, K.M.; Mohamed, A.R.I.; Xu, W. Modeling, analysis, and suppression of the impact of full-scale wind power converters on subsynchronous damping. IEEE Syst. J. 2013, 7, 700–712. [Google Scholar] [CrossRef]
  23. Shair, J.; Xie, X.; Li, H. A grid-side multi-modal adaptive damping control of super-/sub-synchronous oscillations in type-4 wind farms connected to weak AC grid. Electr. Power Syst. Res. 2023, 215, 108963. [Google Scholar] [CrossRef]
  24. Du, W.; Wang, X.; Wang, H. Subsynchronous interactions caused by the PLL in the grid-connected PMSG for the wind power generation. Int. J. Electr. Power Energy Syst. 2019, 98, 331–341. [Google Scholar] [CrossRef]
  25. Bi, T.; Li, J.; Zhang, P.; Mitchell-Colgan, E.; Xiao, S. Study on response characteristics of grid-side converter controller of PMSG to subsynchronous frequency component. IET Renew. Power Gener. 2017, 11, 966–972. [Google Scholar] [CrossRef]
  26. Cao, Y.; Xu, Y. Research on mechanism of sub/super-synchronous oscillation caused by GSC controller of direct-drive permanent magnetic synchronous generator. Power Syst. Technol. 2018, 42, 174–185. [Google Scholar]
  27. Shao, B.; Zhao, S.; Gao, B. An equivalent model for sub-synchronous oscillation analysis in direct-drive wind farms with VSC-HVDC systems. Int. J. Electr. Power Energy Syst. 2021, 125, 106498. [Google Scholar] [CrossRef]
  28. Zames, G. Feedback and optimal sensitivity: Model reference transformations, multiplicative semi-norms, and approximate inverses. IEEE Trans. Autom. Control 1981, 26, 301–320. [Google Scholar] [CrossRef]
  29. Francis, B.A.; Zames, G. On optimal min-max servos. In Proceedings of the 1981 20th IEEE Conference on Decision and Control including the Symposium on Adaptive Processes, San Diego, CA, USA, 16–18 December 1981; pp. 188–189. [Google Scholar] [CrossRef]
  30. Zames, G.; Francis, B.A. A new approach to classical frequency methods: Feedback and minimax sensitivity. In Proceedings of the 1981 20th IEEE Conference on Decision and Control including the Symposium on Adaptive Processes, San Diego, CA, USA, 16–18 December 1981; pp. 867–874. [Google Scholar] [CrossRef]
  31. Davari, M.; Mohamed, Y.A.I. Robust DC-link voltage control of a full-scale PMSG wind turbine for effective integration in DC grids. IEEE Trans. Power Electron. 2016, 32, 4021–4035. [Google Scholar] [CrossRef]
  32. Wang, Y.; Wu, Q.; Gong, W.; Gryning, M.P.S. H robust current control for DFIG-based wind turbine subject to grid voltage distortions. IEEE Trans. Sustain. Energy 2017, 8, 816–825. [Google Scholar] [CrossRef] [Green Version]
  33. Surinkaew, T.; Ngamroo, I. Robust power oscillation damper design for DFIG-based wind turbine based on specified structure mixed H 2/H control. Renew. Energy 2014, 66, 15–24. [Google Scholar] [CrossRef]
Figure 1. The PMSG-based wind farm diagram.
Energies 16 03144 g001
Figure 2. The principle diagram of PLL.
Energies 16 03144 g002
Figure 3. The uncertainty block diagram of the wind power system.
Energies 16 03144 g003
Figure 4. Eigenvalue loci of closed loop system with kp1 from 1 to 0.1.
Energies 16 03144 g004
Figure 5. Participation factors of SSR modes with kp1 = 0.1.
Energies 16 03144 g005
Figure 6. Eigenvalue loci of the system with ki1 from 1 to 0.1.
Energies 16 03144 g006
Figure 7. Participation factors of λ5,6,7,8 with ki1 = 0.1.
Energies 16 03144 g007
Figure 8. Eigenvalue loci of closed loop system with kp2 from 1 to 2.
Energies 16 03144 g008
Figure 9. Participation factors of SSR modes with kp2 = 2.
Energies 16 03144 g009
Figure 10. Eigenvalue loci of closed loop system with ki2 from 1 to 0.1.
Energies 16 03144 g010
Figure 11. Participation factors of SSR modes with ki2 = 0.1.
Energies 16 03144 g011
Figure 12. Eigenvalue loci of closed loop system with kipll from 1 to 3.
Energies 16 03144 g012
Figure 13. Eigenvalue loci of closed-loop system with kppll from 1 to 3.
Energies 16 03144 g013
Figure 14. Participation factors of SSR modes with kipll = 3.
Energies 16 03144 g014
Figure 15. Participation factors of SSR modes with kppll = 3.
Energies 16 03144 g015
Figure 16. Eigenvalue loci of closed-loop system with SCR from 3 to 1.1.
Energies 16 03144 g016
Figure 17. Participation factors of SSR modes with SCR = 1.1.
Energies 16 03144 g017
Figure 18. Structural block diagram of uncertain systems of a PMSG-based wind farm.
Energies 16 03144 g018
Figure 19. Maximum singular value set for uncertain systems.
Energies 16 03144 g019
Figure 20. H Control Standard Problem.
Energies 16 03144 g020
Figure 21. Sensitivity curves.
Energies 16 03144 g021
Figure 22. Complementary sensitivity curves.
Energies 16 03144 g022
Figure 23. M∆ structure for RS analysis.
Energies 16 03144 g023
Figure 24. N∆ structure for RP analysis.
Energies 16 03144 g024
Figure 25. Performance curve.
Energies 16 03144 g025
Figure 26. Current igd in voltage drop condition.
Energies 16 03144 g026
Figure 27. FFT of current igd in voltage drop condition.
Energies 16 03144 g027
Figure 28. Current iga at different impedance of the transmission line in PI.
Energies 16 03144 g028
Figure 29. FFT of current iga at different impedance of the transmission line in PI.
Energies 16 03144 g029
Figure 30. Current iga at different SCR.
Energies 16 03144 g030
Figure 31. SCR = 1.42 in PI control system.
Energies 16 03144 g031
Figure 32. SCR = 1.16 in PI control system.
Energies 16 03144 g032
Figure 33. SCR = 1.07 in PI control system.
Energies 16 03144 g033
Figure 34. The influence of different voltage kp2 on igd.
Energies 16 03144 g034
Figure 35. The influence of ki2 on igd.
Energies 16 03144 g035
Figure 36. FFT analysis of igd in PI control system.
Energies 16 03144 g036
Figure 37. FFT analysis of igd in the PI controller.
Energies 16 03144 g037
Figure 38. The influence of kppll on igd.
Energies 16 03144 g038
Figure 39. FFT analysis of igd in PI controller (change kppll).
Energies 16 03144 g039
Figure 40. The influence of kipll on igd.
Energies 16 03144 g040
Figure 41. FFT analysis of igd in PI controller (change kipll).
Energies 16 03144 g041
Disclaimer/Publisher’s Note: The statements, opinions and data contained in all publications are solely those of the individual author(s) and contributor(s) and not of MDPI and/or the editor(s). MDPI and/or the editor(s) disclaim responsibility for any injury to people or property resulting from any ideas, methods, instructions or products referred to in the content.

