Article

Experimental Study of Oxygen Depletion Effects on Soot Morphology and Nanostructure in Coflow Diffusion Aviation Fuel (RP-3) Flames

1
Research Institute of Aero-Engine, Beihang University, Beijing 100191, China
2
National Key Laboratory of Science and Technology on Aero-Engine Aero-Thermodynamics, Beihang University, Beijing 100191, China
3
Department of Energy and Power Engineering, Beihang University, Beijing 100191, China
*
Author to whom correspondence should be addressed.
Energies 2023, 16(7), 3166; https://doi.org/10.3390/en16073166
Submission received: 3 February 2023 / Revised: 22 March 2023 / Accepted: 27 March 2023 / Published: 31 March 2023
(This article belongs to the Special Issue Thermal Fluids and Energy Systems)

Abstract

:
Oxygen concentration is a significant factor affecting soot formation and oxidation. However, there are few studies that have focused on the morphology and nanostructure characteristics of soot in aviation kerosene, oxygen-depleted combustion flames. In the present paper, five coflow flames under initial oxygen volume concentrations of 18.5%, 19%, 20%, 21%, and 23.5% were studied. The pneumatic probe sampling method and high-resolution transmission electron microscopy (HRTEM) analysis were conducted to quantify the morphology and nanostructure parameters, and laser extinction (LE) was applied to determine the soot volume fraction. Among the cases of different oxidizer oxygen concentrations (23.5% to 18.5%), the change in soot volume fraction was quantified, and the degree of graphitization of soot particles, i.e., the maturity, were compared. The results show that the peak value of soot volume fraction of the flames increased by 0.73 ppm as the oxygen concentration increased from 21% to 23.5%, and decreased by 1.25 ppm as the oxygen concentration decreased from 21% to 18.5%. When the oxygen concentration decreased from 23.5% to 18.5%, the soot primary particle diameter at the same dimensionless height decreased and then increased, which was attributed to the competition between the changes in the residence time and the growth rate of the soot particles. The quantitative analysis results of the soot nanostructure suggested that reduced oxygen concentration inhibited the graphitization process of carbon lattices and decreased the maturity and oxidation resistance of soot. When the oxygen concentration decreased from 23.5% to 18.5% at the same dimensionless height, the mean fringe length decreased by an average of 0.18 nm, and the mean value of fringe tortuosity and spacing increased by an average of 0.053 and 0.035 nm.

1. Introduction

Soot is one of the major pollutants in industrial burners as a product of pyrolysis or incomplete combustion from hydrocarbon fuels. Soot emissions into the atmosphere have an adverse effect on the environment [1] and human health [2,3]. They have also been proven to reduce the overall thermal efficiency of internal combustion engines [4]. Oxygen-depleted combustion is a kind of combustion behavior that occurs in an environment with an oxygen concentration (OC, i.e., oxygen volume fraction of the oxidant) lower than 21%. The ambient oxygen concentration of combustion significantly affects soot formation and the oxidation process; therefore, flames under such oxygen-depleted conditions generate soot differently compared to that produced in normal or oxygen-enriched air. Other than water-based fire suppression [5] processes, oxygen-depleted combustion also exists during the working period of exhaust gas recirculation [6]. Therefore, investigating the effect of reduced oxygen concentrations on soot formation and oxidation characteristics is essential to further controlling soot emissions.
Traditionally, investigations into the effects of oxygen concentration on soot formation characteristics in laminar flames focused on combusting in normal or oxygen enriched air. When the OC is reduced, on the rich side of the reaction zone, the flame temperature decreases, which, in turn, reduces the fuel pyrolysis, inception, surface growth, and the soot oxidation. These two competing mechanisms both influence soot formation in jet flames. The former dominates in oxygen-enriched flames and the latter in oxygen-depleted flames [7]. Lee et al. [8] used a laminar diffusion methane jet flame and subjected it to air with an OC = 21%, 50% and 100%. They observed a reduction in soot yield for the two oxygen-enriched cases with a greater reduction for the case of OC = 100% and a higher degree of agglomeration under both oxygen-enriched conditions. To distinguish the chemical, thermal, and dilution effects of oxygen addition, further numerical studies were carried out by Leusden and Peters [9] in a counterflow laminar flame with acetylene. For the case of oxygen addition to the oxidizer stream, they found that the higher flame temperature was the main cause of the increased soot concentration. Seong and Boehman [10] studied a coflow laminar n-Heptane flame for OCs = 21%, 27%, 30%, and 35%, and they observed that the increase in oxygen concentration in the oxidizer stream enhanced the soot oxidation process, which further reduced soot oxidative reactivity. In order to investigate the effects of variable OC on soot formation and soot oxidation more in-depth, experimental and numerical studies were conducted under a much wider range of OCs. Jain et al. [11] studied a series of coflow laminar diffusion methane flames to investigate the effects of variable OCs (from 21% to 76.3%) on soot yield and distribution. They observed that increasing the OC (from 21% to 36.8%) first resulted in an increase in the peak value of soot concentration, but a further increase in OC led to a decrease in the soot yield. The authors concluded that increasing the OC led to higher flame temperature, which resulted in a stronger soot production rate while reducing soot residence times in flame regions, which allowed less time for soot production. These competing effects caused the initial increase and subsequent decrease in the peak soot yield and the shift in the peak soot yield location with increasing OCs. A range of increasing OCs also exacerbates the formation of soot precursors in the flame, which, in turn, leads to an increase in the soot yield [12].
Recently, several experimental and numerical studies were carried out in the literature to investigate soot behavior in internal combustion engines under oxygen-depleted conditions with variable initial OCs in a constant volume chamber. Bi et al. [13] investigated the effect of ambient OCs (21%, 18%, 15%, 12%) on the soot formation and soot oxidation process during European low-sulfur diesel combustion in a constant volume chamber with the injection pressure controlled at 134 MPa. They found that, as the OC decreased, the soot mass concentration increased first and then decreased before reaching the peak at an OC = 15%. They concluded that the increase in soot mass concentration was attributed to the relatively strong soot formation mechanism and the suppressed oxidation mechanism, while the decrease was due to the suppressed soot inception reaction from precursor species. Zhao et al. [14] also described the nonmonotonic behavior [13] of soot formation with decreasing OC in the numerical simulation of acetone−butanol−ethanol (ABE) spray combustion in a constant volume chamber. According to their results, this nonmonotonic behavior was related to the shift in the dominant role of the soot oxidation mechanism and the formation mechanism. Vo et al. [15] and Zhu et al. [16] also observed this nonmonotonic behavior under the oxygen-depleted conditions of diesel combustion and offered a similar explanation [16] to Bi et al. [13] and Zhao et al. [14]. Although the above works have yield considerable data on soot yield from oxygen-depleted combustion, due to the complex soot generation environment in the combustion chamber, the detailed mechanism research is generally carried out in a simpler flame.
A coflow flame is an axisymmetric diffusion flame whose simple structure can be beneficial to soot formation and oxidization characteristic explorations. Several studies have worked on the effects of oxygen depletion in the oxidizer streams of coflow burners. Sun et al. [17] investigated parameters in the coflow flames of pure ethylene, such as soot volume fraction, soot primary particle diameter, etc., with variable OCs ranging from 16.8% to 36.8%. They found that the primary particle diameter decreased with an increase in the OC, while the soot volume fraction increased. They pointed out that the distribution of the soot primary particle diameter was dominated by the residence time. Ashraf et al. [18] utilized a coflow burner similar to that employed by Sun et al. [17] and formed 40%N2/60%C2H4 jet flames. They varied the OC from 19% to 40% and discussed the morphology of precursor nanoparticles. They also quantified the effects of the OC in terms of three variables: soot volume fraction, soot primary particle diameter, and the concentration of precursor nanoparticles. It was found that the volume fraction and primary particle diameter of mature soot initially increased with an increase in the OC, followed by a reversal trend when the OC = 27%, and the concentration of precursor nanoparticles increased while aromatization (aliphatic to aromatization transformation) shifted towards lower flame heights with an increase in the OC. The existing studies on the behavior of soot in the coflow flames at different oxygen concentrations give substantial parameters for soot characteristics, but further insight is required into the formation and oxidation characteristics of soot under oxygen-depleted combustion.
The experimental studies on the behavior of soot at different oxygen concentrations have provided extensive relevant information (see Table 1). However, most studies focus on the properties associated with soot under oxygen-enriched combustion, while relatively little research has been done on the morphology and nanostructure of soot under oxygen-depleted combustion. In addition, most of these studies have focused on simple gaseous hydrocarbons, such as methane [8,11], ethylene [17,18,19,20,21], propane [20], butane [20], and heptane [10]. Although many studies have used aviation kerosene as fuel, their subjects are not the same as this paper. Mao et al. [22,23,24] developed a kinetic model for RP-3 kerosene over a wide range of oxygen concentrations (6.96–20.88 mol%), but their study focused on the zero-dimensional flames and did not investigate soot formation. Xue et al. [25] studied soot formation in Jet-A, JP-8, and JP-5 flames of aviation kerosene, but their study focused on one-dimensional counterflow flames and did not investigate oxygen-depletion combustion. Saffaripour et al. [26] studied the characteristics of soot formation in a Jet A-1 coflow diffusion flame, but the study was under oxygen-enriched combustion conditions. There is little information about soot formation and oxidation characteristics of such a complex transportation fuel as aviation kerosene in oxygen-depleted combustion in the literature.
In this paper, the quantitative measurement of soot particles in a coflow diffusion aviation kerosene (RP-3) flame under oxygen-depleted conditions is the main focus. This is the first experimental measurement of soot particle nanostructure parameters and soot yield for an aviation kerosene RP-3 coflow diffusion flame under oxygen-depleted combustion. The effect of oxygen concentration in the oxidant on soot morphology and nanostructure is investigated for five different coflow oxygen concentrations, including three oxygen-reduced air flows, one normal air flow, and one oxygen-enriched air flow. The effects of oxygen concentrations on soot yield for diffusion aviation kerosene RP-3 flames are also analyzed. Furthermore, the degree of graphitization of soot particles is assessed for both oxygen-depleted and oxygen-enriched intake air. The fundamental soot characteristics offered in this paper can provide more basic experimental data for the development and validation of quantitative soot prediction models for oxygen-depleted combustion.

2. Experimental Setup

2.1. Burner, Vaporizer, and Flames

An axisymmetric laminar jet coflow burner was used in the present experimental study. The schematic of the experimental rig is shown in Figure 1. Further details can be found in the previous work [27]. The experimental rig is briefly described as follows. The coflow burner consists of two concentric stainless-steel tubes with inner diameters of 5 mm and 25 mm, respectively. The fuel flows through the central tube, and the oxidizer is injected through the outer tube. The chamber has a stainless-steel outer wall with an internal diameter of 500 mm and a height of 600 mm to ensure that the sampling system operates properly inside. The outer wall can also protect the flame from air movements in the room.
The test fuel was Chinese aviation kerosene fuel (RP-3), and its main specification properties are listed in Table 2. The fuel supply system in Figure 1 enables the delivery of stable gaseous RP-3 to the coflow burner. It uses a stepper motor to drive a 28mm inner diameter syringe, which, in turn, drives the liquid fuel into the vaporizer below the burner. The components in RP-3 aviation kerosene have fairly high and different boiling points. To produce a non-smoking laminar diffusion flame and to ensure that all components of the liquid fuel are vaporized at a relatively low temperature of around 543K (lowering the required temperature for vaporization) [26,28], the fuel was heavily diluted with nitrogen (99.999% purity). In addition, nitrogen (at 543K) was also used as a carrier gas so that the vaporized fuel could be transported to the burner. Meanwhile, to avoid fuel condensation and significant temperature drop in the fuel tube inside the burner, the coflow air was heated to 543K. Eventually, the fuel, which had been heated and evaporated into the gaseous phase, was mixed with nitrogen and injected from the fuel tube to form a steady and reproducible flame. For the gaseous mixture of the fuel and nitrogen under 543K, the volume fraction of the fuel was 14.5%.
A series of five flames were generated in this study to explore the effects of varying the coflow oxygen concentrations, as listed in Table 3. The oxygen concentration in the oxidizer was changed from 23.5 vol.% to 18.5 vol.% by varying the volume ratio of N2/O2 mixed with air. For the case where the oxygen concentration was below 18.5%, the coflow flame flickered violently and lifted off. To ensure reliable sampling, the lower limit of oxygen concentration was 18.5% in the present study. The upper limit of oxygen concentration was set at 23.5% as a control so that the step size of the change in oxygen concentration was maintained at 2.5%. For quantitative investigation of the effects on variations in oxygen concentration, the flow rate of the coflow air was held constant at 6.00 SLM (standard liters per minute) for all cases. All gas flow rates were metered and regulated by mass flow controllers (MFC, Brooks 5850 e). The fuel and carrier gas (N2) flow rates were fixed at 3.09 mL/min (at liquid state, 293 K) and 0.11 SLM, respectively.

2.2. Sampling and Electron Microscope Image Analysis

A probe pneumatic sampling technique was used in the current work, which was successfully applied in earlier works [27,28,29,30]. As shown in Figure 1, the sampling system consists of a sampling probe, a three-dimensional translation stage, a motor drive system, a TEM grid (copper, with a grid size of 200 mesh, 3.05 mm diameter, and 5 nm thickness of film), a pumping device, and a programmable control unit. The material of the probe is quartz to avoid chemical reactions with the gases inside the probe. As shown in Figure 2a, the inner diameter varies from 1 mm to 10 mm to ensure minimal interference with the flame without blocking the probe. In addition, the position of the probe in the flame can be adjusted by means of a three-dimensional translation stage, thereby enabling sampling at different heights. As shown in Figure 2b, the gas in the probe flows through the TEM grid, which is a carbon-supported grid equivalent to a filter to collect the soot particles in the gas. Once sampling is completed, the TEM grid with soot particles is removed, and the morphology and microstructure of the soot particles on the grid is then obtained using transmission electron microscopy.
Table 3 shows the sampling point distributions for these five flames. This study focused on the soot oxidation process along the central axis of the flames; therefore, the sampling positions were selected based on the location of the soot oxidation zones. For all the sampling positions, the sampling flow rate for each case was controlled to 46.75 sccm [27] in order to minimize flame disturbance, and was kept consistent at different HABs (heights above the burner). The sampling durations ranged from 8 to 30 s to ensure that enough soot samples were collected at each sampling point.
The intrusive sampling method used in this work has a negligible effect on the flame structure and soot reaction mechanism. On the one hand, by optimizing the size of the probe and the sampling speed, pneumatic probe sampling interferes relatively little with the flame structure. Although quantifying the disturbance to the flame structure is difficult, at least visually the disturbance to the flame structure is minimal (as shown in Figure 3). Previous studies have also shown relatively little effect on flame structure from this intrusive sampling method [27,28,29,30,31,32]. Although this small disturbance also slightly changes the appearance of the flame, the flow field of the flame is stable for the duration of the sampling compared to thermophoretic sampling. Furthermore, as shown in Figure 3, the disturbance has little effect on the flow field upstream of the flame, which ensures that the thermal history of the soot is minimally affected by the sampling. Subsequently, by sampling at a constant sampling speed over a long period, the sample is relatively uniformly distributed on the TEM grid, which reduces the uncertainty of the measurement. On the other hand, the material of the probe is quartz. This material prevents the probe from chemically reacting with the gas inside it. It had also been used by other researchers to collect samples from flames [33]. In addition, previous studies comparing TEM images of soot from direct probe sampling and thermophoretic sampling methods found that direct sampling did not affect the morphology of the soot [31]. Ávila et al. [34] comparatively assessed the effectiveness of collecting particulate matter from the exhaust of automotive diesel engines using a thermophoretic probe and a vacuum pump with a polytetrafluoroethylene filter (the same method as was used in this study for pneumatic extraction sampling). Their Raman spectroscopy results showed that the method of sampling by vacuum pump did not affect the nanostructure of soot [34].
A Talos F200S G2 S transmission electron microscope (TEM), with operational voltage of 200 kV was utilized to take bright field images of low and high resolution. TEM images were taken with a magnification of 46,000× for primary particle size measurement and 630,000× for soot nanostructure parameters analysis. For LRTEM study, the soot primary particle size (dp) distribution was obtained by manually fitting circles around the particles on each TEM image in ImageJ [35] v1.8.0 (Washington, USA), with at least 500 particle diameters being measured at each sampling position. For the HRTEM study, soot nanostructure parameters, which include fringe length (La), fringe tortuosity (τ), and fringe spacing (d), also could be obtained by ImageJ following the method proposed in [36]. These three parameters can be used to characterize the degree of graphitization of carbon lattices. The HRTEM digital image processing was composed of the following operations: (1) negative transformation, (2) region of interest (ROI) selection, (3) contrast enhancement, (4) Gaussian lowpass filter, (5) top-hat transformation (used to correct uneven illumination across an image), (6) thresholding to obtain a binary image, (7) morphological modification, (8) clearing fringes on the ROI border, (9) skeletonization, and (10) removing short fringes that lacked physical meaning. The measurement of the fringe parameters in the skeletonized image is shown in Figure 4, which also refers to [26]. It should be noted here that. in step (10), all fringes shorter than 0.483 nm (naphthalene) were discarded, because they were non-physical [37]. Moreover, fringe spacings from 0.3345 nm (which is the 002-graphite distance) to 0.6 nm (after which Van der Waals forces are negligible) were accounted for, as fringes with this spacing were considered to be stacked [38].

2.3. Soot Volume Fraction Measurements

Figure 5 shows a schematic of the LE setup used to measure soot volume fraction (SVF) distribution in the flame. The illumination source was a 50 mW helium–neon laser with a wavelength of 532 ± 1 nm. The laser beam first passed through an iris to further attenuate the laser beam intensity and then passed through a beam splitter into two channels. The extinction channel monitored the attenuated laser beam intensity and the reference channel for detection of the laser power drift. The former laser beam was focused by a lens with a 500 mm focal length and then directed horizontally into the flame. In each channel, there was a bandpass filter, which was used to filter out any wavelengths outside of 532 ± 1 nm, and a 30 mm lens to refocus the beam to the photodiode. The local extinction coefficient was then calculated by Abel inversion of the path-integrated light intensity using the cubic spline function algorithm [39]. According to the Rayleigh limit, it was assumed that the scattering contribution from soot and absorption interference from molecules [40] could be neglected in the calculation of soot volume fraction. With the given assumptions, the relationship between the SVF and the extinction coefficient can be established [41]:
SVF = λ 6 π · K e x t E ( m )
where λ is the wavelength of light, Kext is the extinction coefficient, and E(m) = −Im [(m2 − 1)/(m2 + 2)] is the soot absorption function. The refractive index of m = 1.57−0.56i (i.e., E (m) = 0.2595) was adopted for the current measurement. This value of refractive index has been validated against a wide range of fuels and flame environments [42].

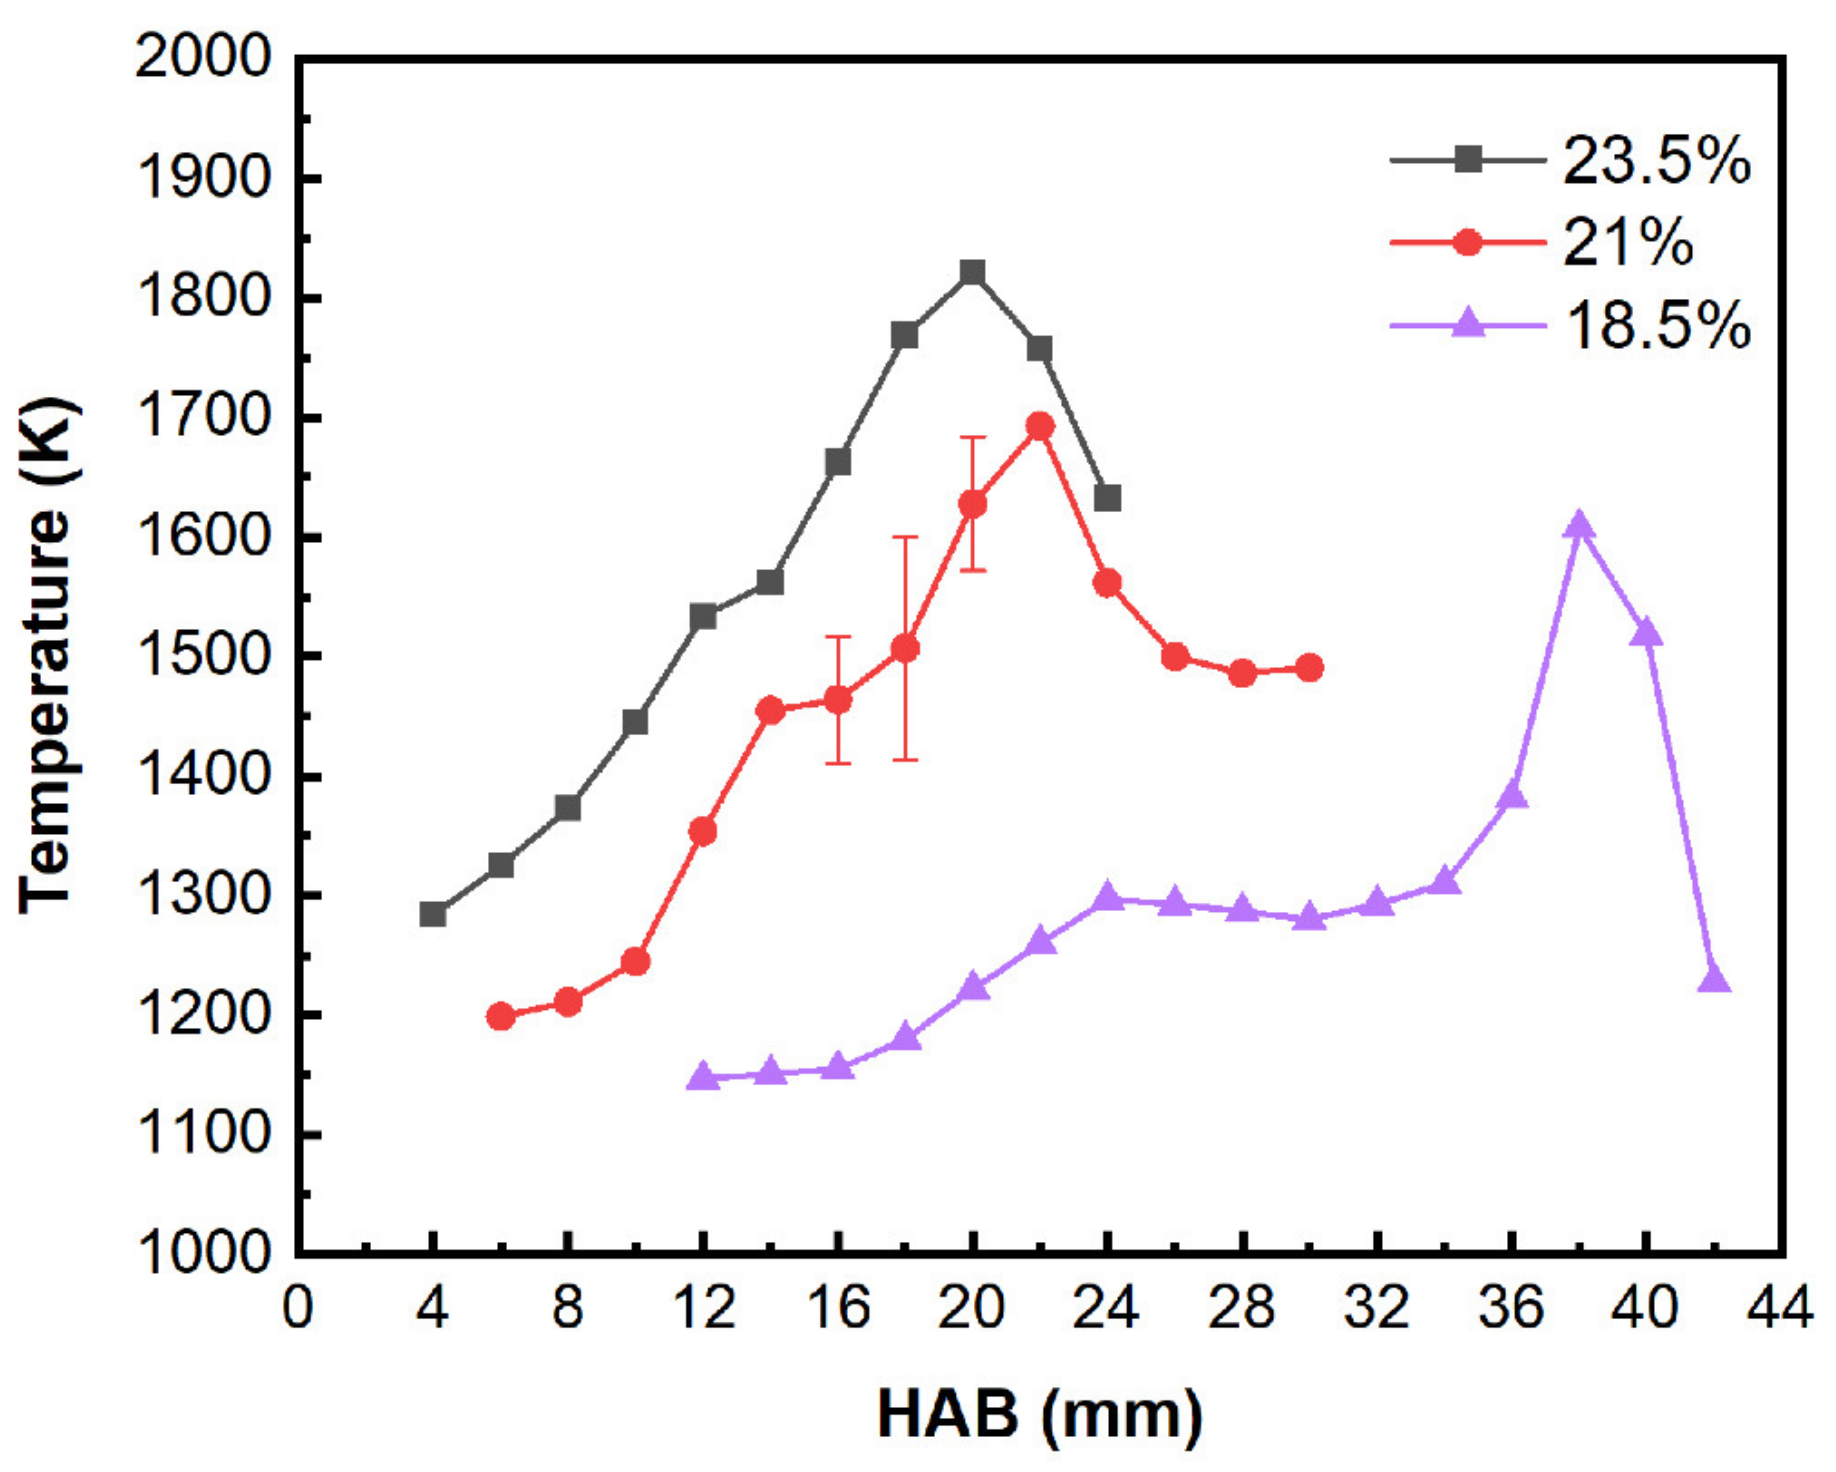
2.4. Temperature Measurements

In Figure 6, an uncoated B-type thermocouple with a wire diameter of 0.3 mm was used to measure temperature profiles of the RP-3 jet flames. The thermocouple was assembled with a three-dimensional translation stage that had been used in the soot particle sampling to adjust the sampling position. In order to mitigate soot deposits on the junction, the thermocouple was rapidly inserted into the correct position in the flame, and the temperature was recorded. At the end of each temperature measurement cycle (extension/retraction), any soot deposited on the thermocouple was removed with a near stochiometric propane flame. The temporal resolution of the temperature data acquisition setup was 80 ms, and the temperature reproducibility was 68 K. The thermocouple was held in the flame for 10 s. Radiation losses from the surface of the thermocouple were calculated using the modified method developed by Kholghy et al. [43]. Catalytic effects and wire conduction effects were assumed to be negligible. The uncertainty in the measured temperatures was around 5.4%. The thermoelectric signals were compensated by ice bath and collected by ADAM-4118 (a signal collector) and computer. Measured temperature profiles of the flames are presented in Figure 7.

3. Results and Discussion

In this section, the soot yield, morphology, and nanostructure of the RP-3 coflow flames are investigated. The main steps of the soot formation in RP-3 flames can be summarized in the following steps [44]: (1) formation of soot precursors or small PAHs through the growth of small aromatics, (2) soot nucleation, (3) soot surface growth, particle coalescence, agglomeration, (4) soot oxidation, and fragmentation. The thermal effect of variation in oxygen concentration affects the entire soot formation mechanism, thereby resulting in changes in the rate of chemical reactions and particle collisions. Secondly, changes in oxygen concentration gradients also affect soot formation. By varying the reaction rate in these four steps, the oxygen concentration has a significant influence on the final soot yield, morphology, and soot particle nanostructure.

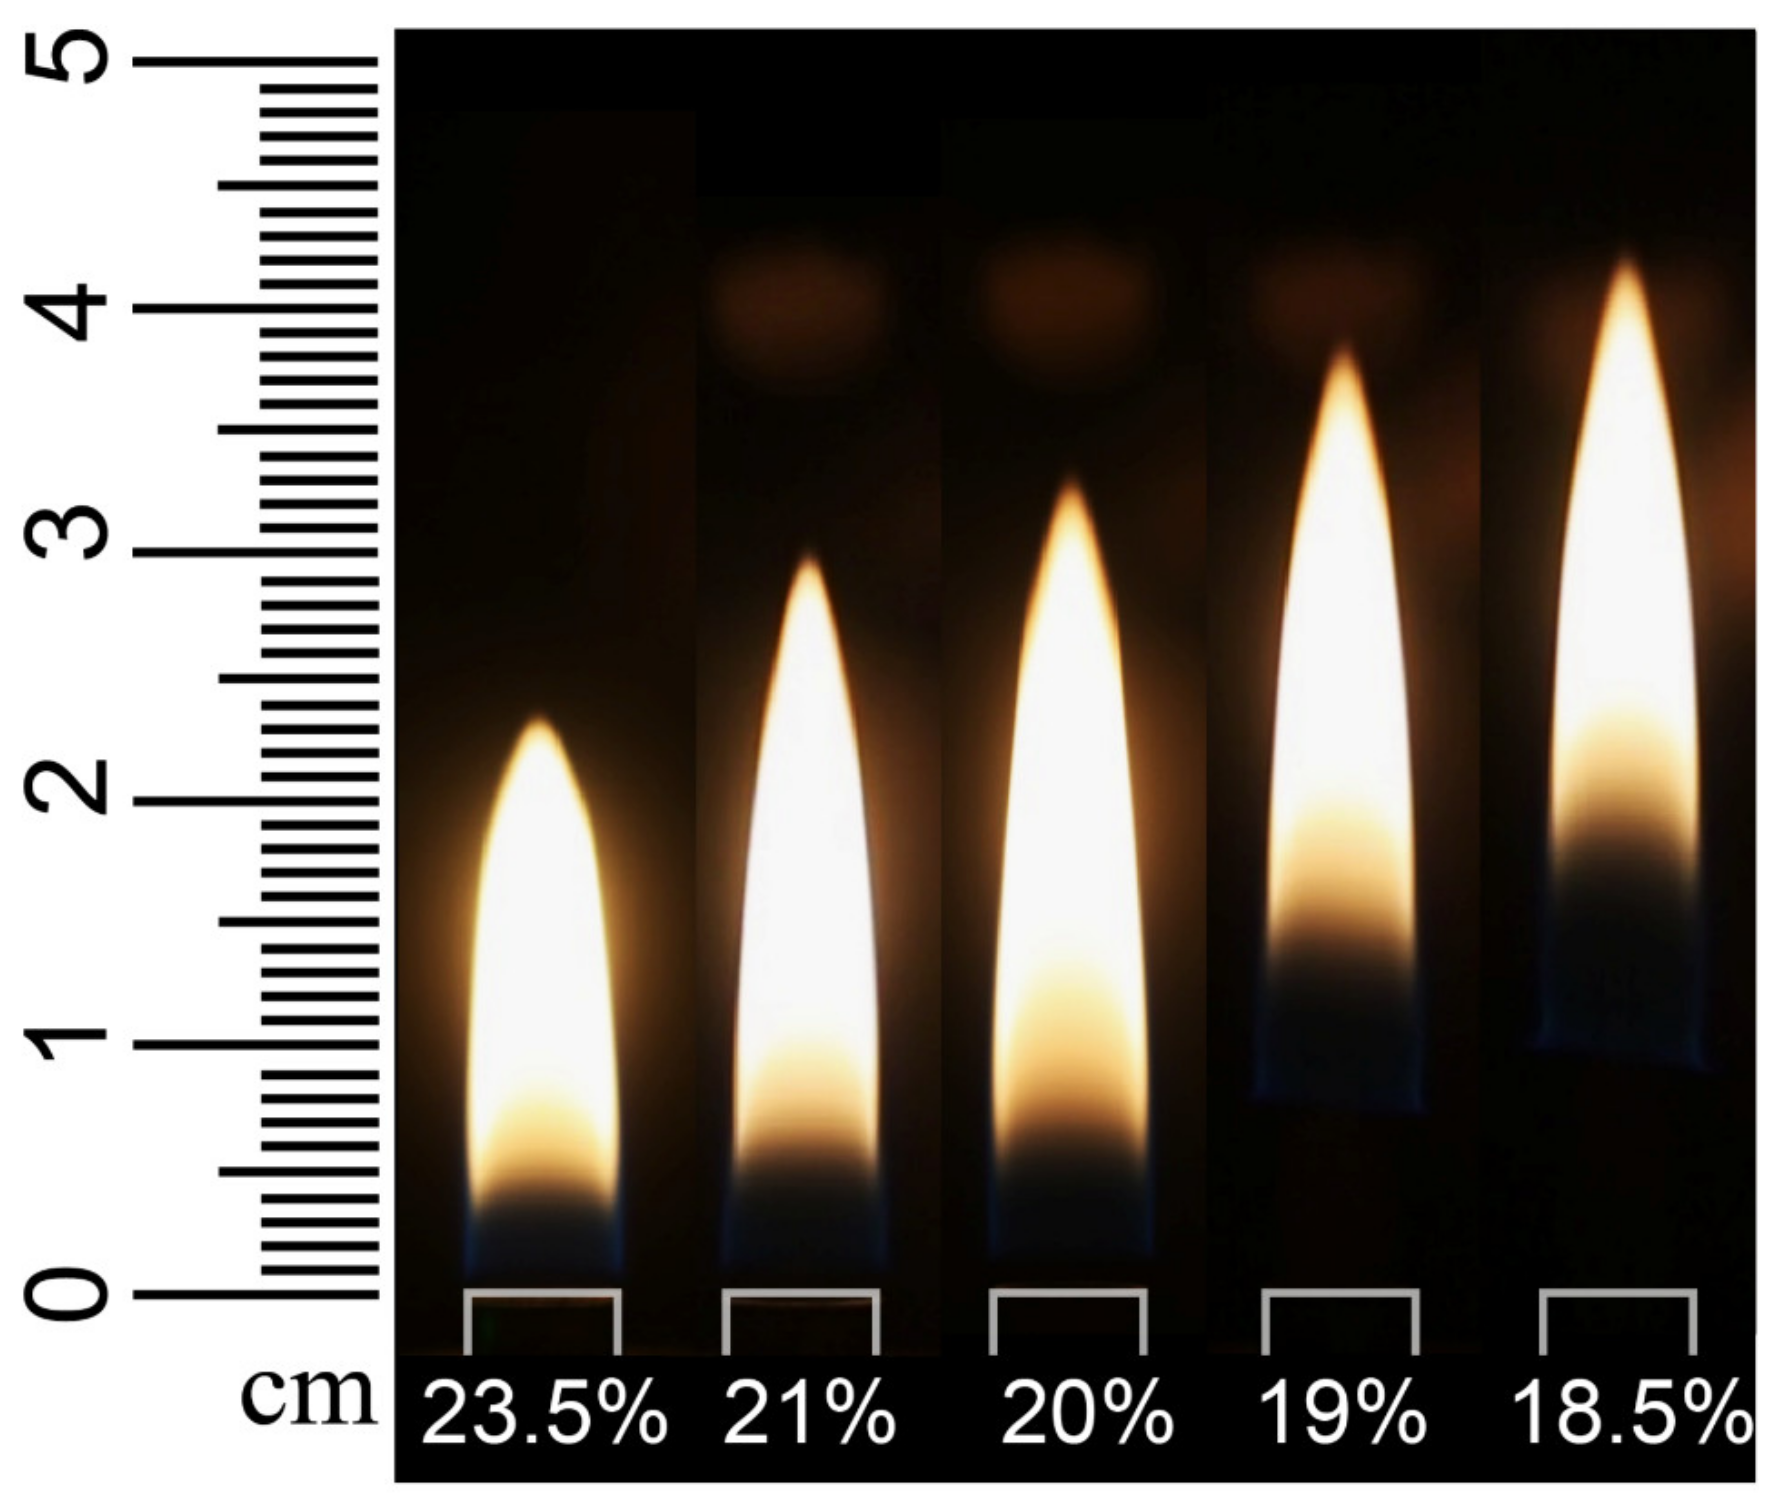
3.1. Flame Appearance

Figure 8 displays the visible appearance of RP-3 flames as the OC decreased from 23.5% to 18.5% in the coflow stream. The images were taken using a Canon EOS 5D Mark III camera with constant settings of ISO 250, f/3.5, fluorescent light white balancing, and exposure of 1/90 s. The distances between the flame tip and the burner outlet (i.e., the visible height of the flame) were 23 mm, 30 mm, and 33 mm for the three cases of 23.5%, 21%, and 20% OC of the coflow air, respectively. In addition, the lift-off heights were all lower than 2 mm. In the cases of OC = 19% and 18.5%, the visible heights of the flames were 38 mm and 41 mm, respectively. However, the lift-off distances of the two flames were 7 mm and 9 mm, respectively. The visible height (Lvis) of the flame increased as the ambient oxygen concentration decreased, and, at the same time, the lift-off height increased. The tendency of the Lvis was consistent with the theoretic analysis and experimental results in [11,12,17,18]. Glassman et al. attributed this trend in the Lvis to the decrease in the oxygen concentration gradient [7]. Ashraf et al. [18] reported that flame lift-off occurs after reducing the oxygen concentration. As shown in Figure 7, lower oxygen concentrations resulted in lower flame temperatures, which causes the auto-ignition-driven stabilization to be delayed [45]. Consequently, the ignition point moved away from the jet exit plane, thereby leading to a higher lift-off height.

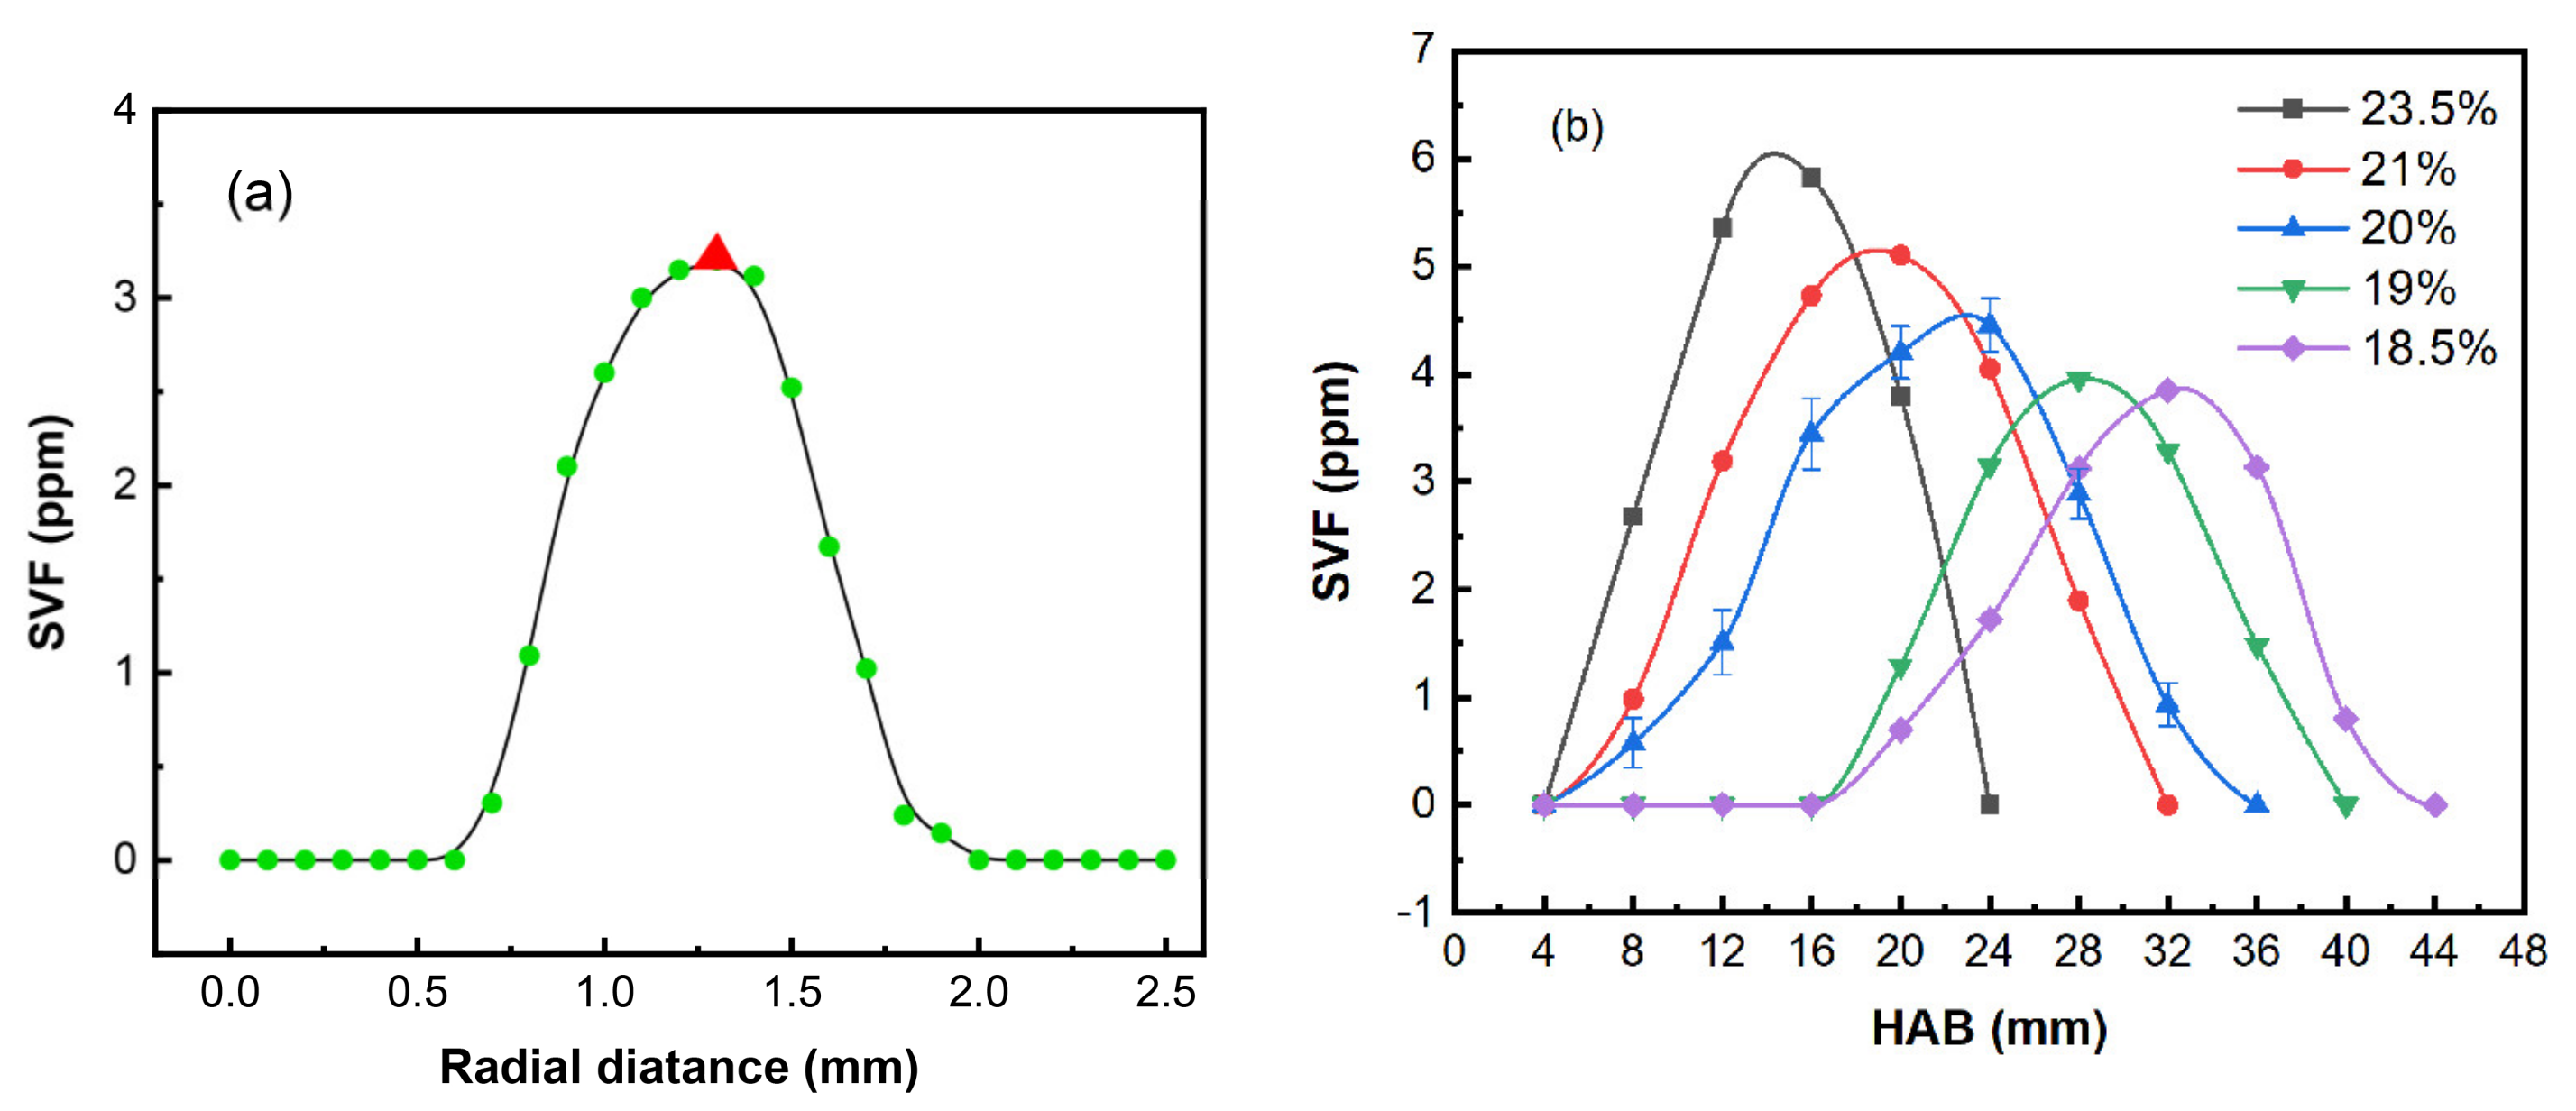
3.2. Soot Volume Fractions

The soot volume fractions for the cases of 18.5% ≤ OC ≤ 23.5% were measured through laser extinction by scanning along the horizontal direction at different axial positions. Figure 9a shows the scanning results of the radial SVF for the case of the OC = 21% and the HAB = 12 mm, where the red triangle represents the peak value of the radial SVF at this position. Figure 9b shows the axial distribution of the peak values of the radial SVF from all test conditions. The error bar of the soot volume fraction is the standard deviation of the measured value in each point. The maximum soot volume fraction showed a dependence on coflow oxygen concentration in the five flames. Measured results of the SVF showed that, with the decrease in oxygen concentration, an obvious decrease in the SVF peak value occurred in the coflow flames. The SVF peak value increased by 0.73 ppm as the OC increased from 21% to 23.5% (a variation of 2.5), and it decreased by 1.25 ppm as the OC decreased from 21% to 18.5% (a variation of 2.5). At the same time, the sooting region expanded in the axial direction, and the change in the sooting region length corresponded to that of the flame height (Figure 8). In addition, it could be observed that the minimum axial position where the laser signal started to attenuate increased with the decreasing OC. The principle of laser extinction is that the signal received from the LE originates from solid mature soot particles [43]. This means that the conversion of soot from non-solid precursor particles to solid particles was delayed.
Reducing the oxygen concentration in the oxidizer affects the soot concentration in the flame through two competing mechanisms. On the one hand, decreasing the OC causes the overall temperature to drop (see Figure 7), which will result in the suppression of soot production. This mechanism is reflected in the fact that the overall temperature drops inhibited fuel pyrolysis and reduced the production of soot precursors. In addition, the temperature drop also reduced the concentration of hydrogen radicals (H2-O2 chemistry) [46], which are active in soot surface growth [9,47]. On the other hand, a reduced OC results in a higher flame height (see Figure 8), which means that the residence time for soot formation and oxidation increases. However, the oxidation of soot precursors and soot particles is inhibited, thereby resulting in a tendency for soot concentrations to increase [8].
As shown in Figure 7, the overall temperature dropped with decreasing oxygen concentration, most significantly in the lower half of the flame. Nevertheless, the overall temperature drops reduced the rate of inception and nucleation of soot in the flames, which inhibited the soot formation. This reduction in the soot production rate was reflected in the reduced slope in the ascending part of the SVF curve (Figure 9b). On the other hand, the temperature drop due to the reduced oxygen concentration also reduced the soot oxidation rate. This oxidation inhibition effect was reflected in the reduced slope of the descending part of the SVF curve (Figure 9b). Under the coordinated effects of the two mechanisms, the SVF declined with the decrease in the OC, which indicated that the soot formation mechanism dominated in the RP-3 kerosene flames within the range of OCs = 23.5~18.5%.
Table 4 shows the maximum soot volume fraction in the coflow diffusion flames fueled by methane, propane, and RP-3 kerosene for two different OCs (23.5% and 21%). For convenience, the carbon mass flow rate of methane and propane was corrected to that in the present work. Therefore, the SVF displayed in Table 4 is the corrected value under the same carbon mass flow rate. Through the comparison of the peak value of the SVF in flames fueled by different fuels under the same OC, some similar behavior can be observed in the three flames. Methane flame tended to produce the lowest quantities of soot among the three fuels. The soot volume fraction in the propane flame was slightly higher than that in the methane flames, while the RP-3 produced the most. Lowering the OC decreased the peak value of soot concentration in all three flames.

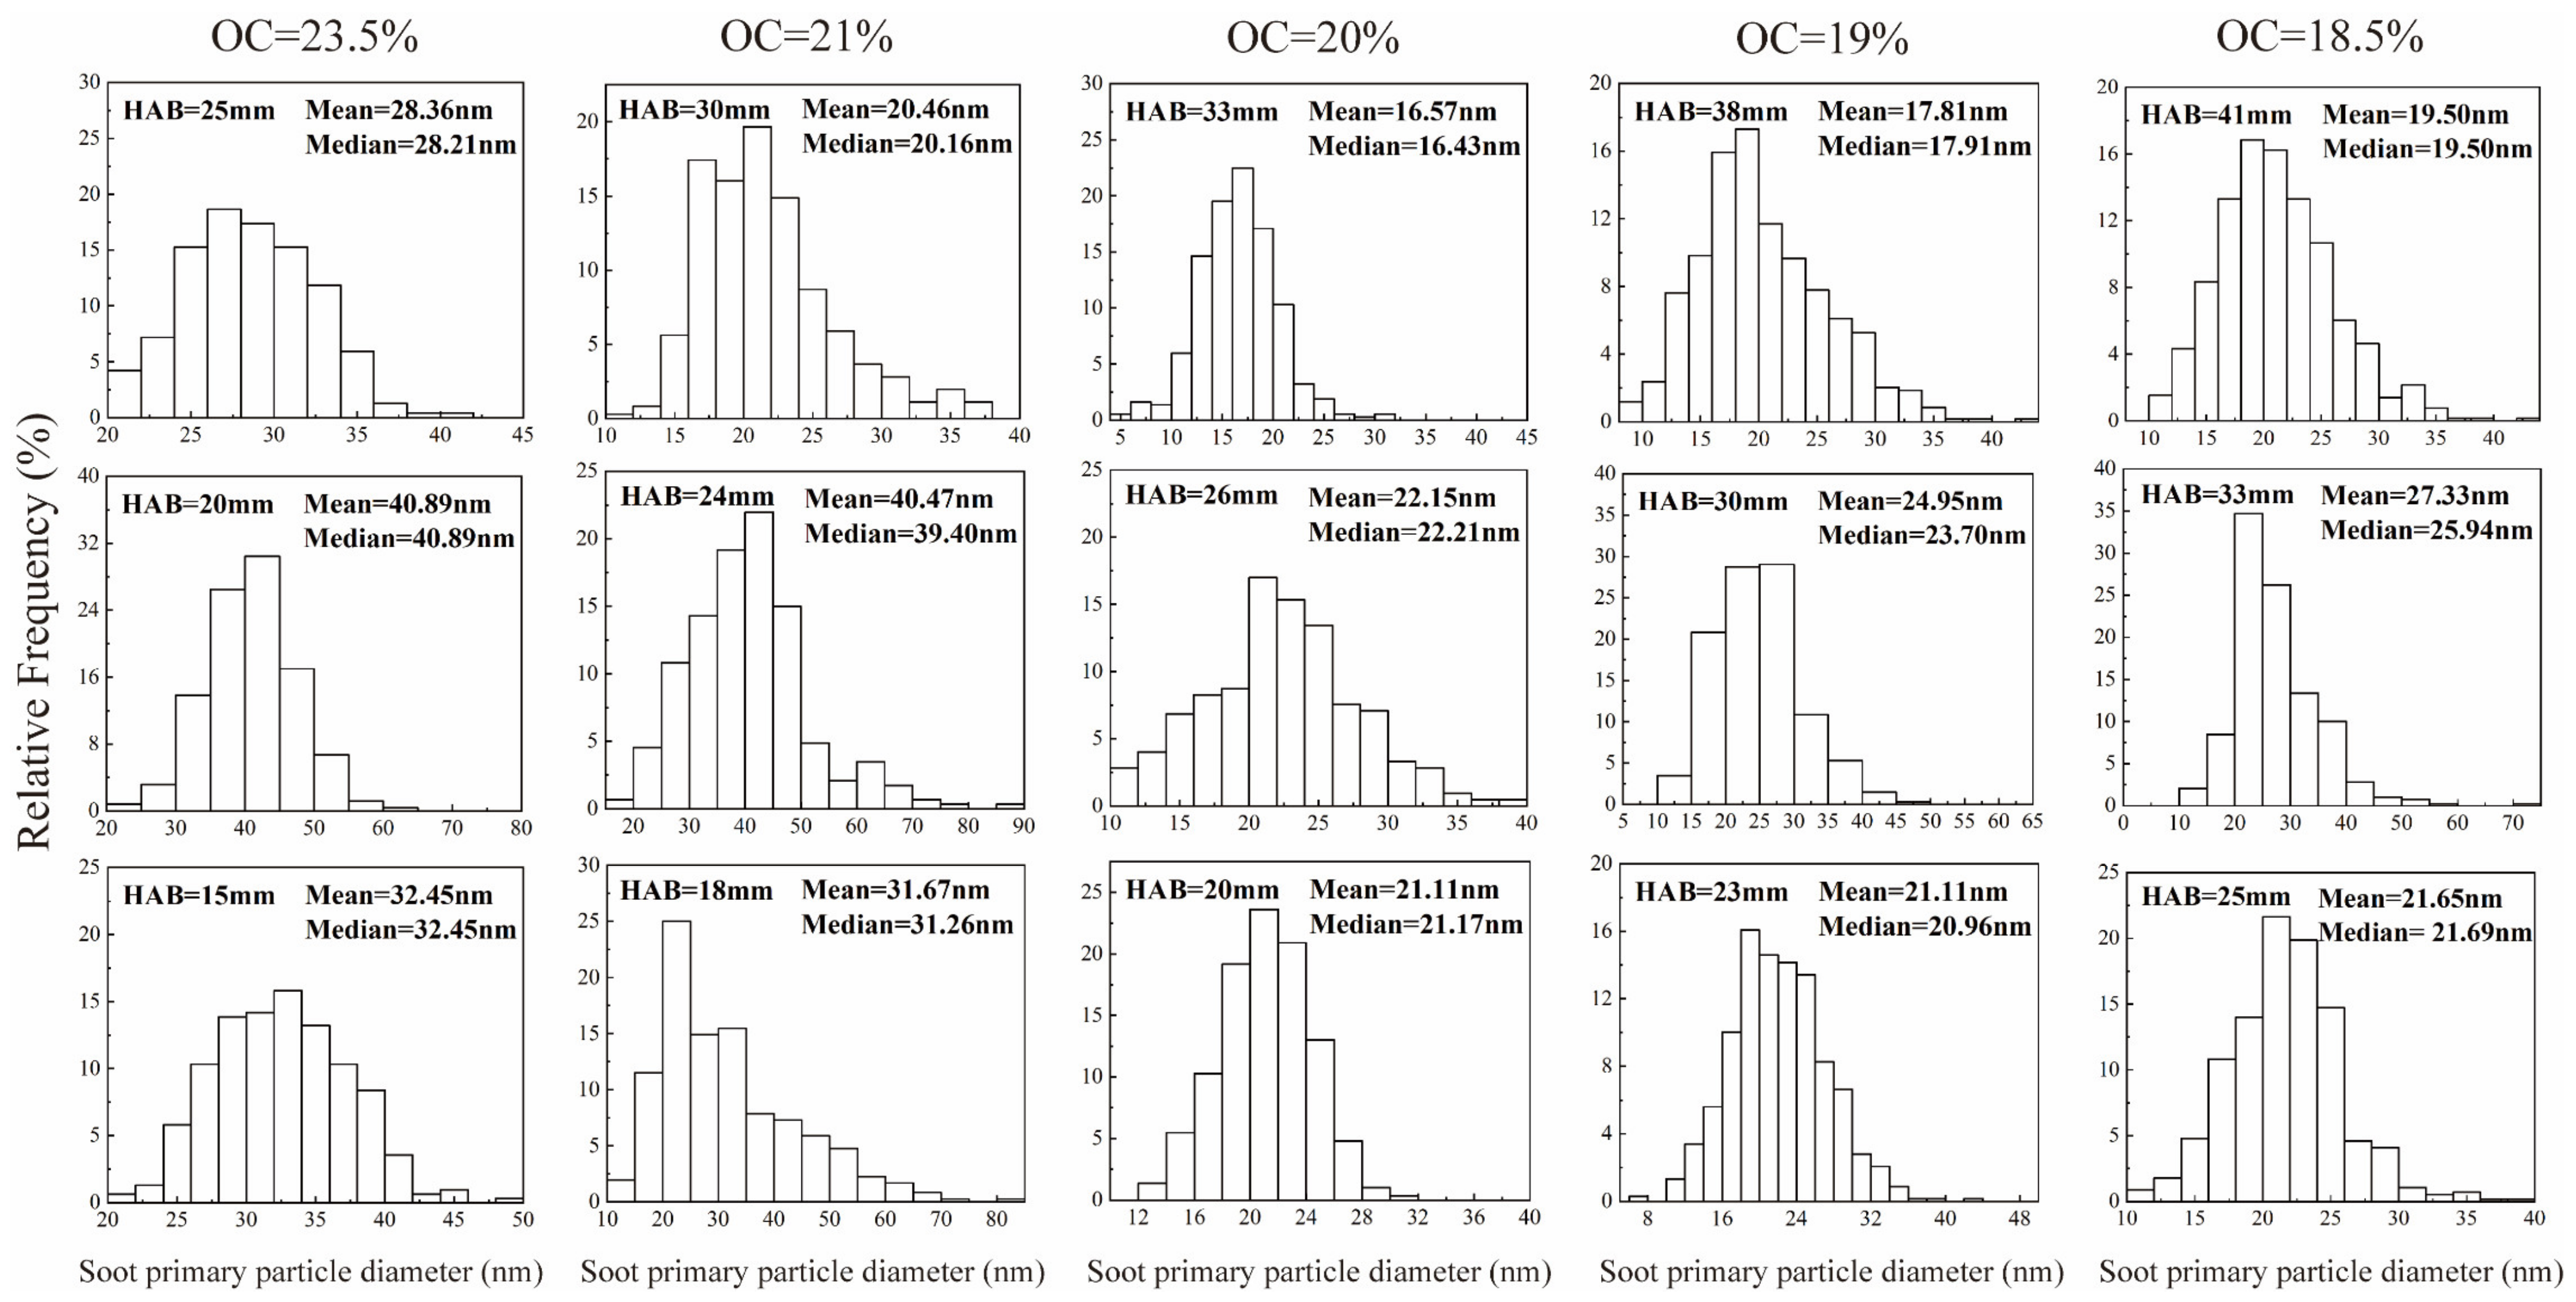
3.3. Soot Primary Particle Diameter

In the previous work [27,30], it was found that soot primary particle size increased with the HAB until a peak was reached, which was followed by a decrease in the oxidation region. According to the literature [17,18], the maximum SVF and dp occur at similar HABs. Based on the measurements, it was found that the SVF reached the peak near a HAB/Lvis = 0.8 for each flame at the centerline. This study focused on the soot oxidation process along the central axis of the flames. Therefore, three sample positions were chosen, which were at a HAB/Lvis = 0.6, 0.8, and 1, respectively. The frequency distribution histograms of the soot primary particle diameters (dp) in the flames at different oxygen concentrations are shown in Figure 10. In the current work, the diameters of 500 soot particles were measured at the same sampling point, and the mean and median were calculated for those 500 data, whose difference was 0.34 nm on average. It was shown that the mean and median of the soot particles from each sampling point were close, thus indicating few extreme values in the tested diameter data. The measured mean soot primary particle diameters ranged from 16.57 nm to 40.47 nm. The size range is in good agreement with the primary particles frequently observed in the literature [28]. Figure 10 shows that, among all cases, the soot particle size tended to increase and then decrease with an increase in the HAB, thereby indicating that most of the soot particles on the flame centerline entered the oxidation-rate-dominated phase in the region above a HAB/Lvis = 0.8.
Figure 11 shows the change in the mean soot primary particle diameters (dp) at different dimensionless heights (HAB/Lvis) with changing OCs. It could be observed that dp appeared to be significantly dependent on the OC. At all sampling heights, the dp showed the same trend that decreased first and then increased as the OC decreased, and they reached a minimum value at OC = 20%. At a HAB/Lvis = 0.6, as the OC dropped from 20% to 18.5%, the average dp at the local height rose by 0.54 nm, while, when the OC ascended from 20% to 23.5%, the average dp at the local height rose by 11.34 nm. At a HAB/Lvis = 0.8, the former was 5.18 nm and the latter was 18.74 nm. At a HAB/Lvis = 1, the two values were 2.93 nm and 11.79 nm, respectively. This nonmonotonic relationship between particle size and oxygen concentration is consistent with the measurements of Sun et al. [17]. They attributed this negative-correlation phenomenon of the dp versus the OC in oxygen-depleted flames to the increased residence time of soot in flames caused by the increased flame length. When the OC exceeded 21%, the dp tended to grow larger with a rising oxygen concentration, which was attributed to higher soot production rates [17]. The results suggest that the variation in oxygen concentration led to competition between two mechanisms: one is the change in residence time, and the other is the change in the growth rate of the soot particles. The trend of these two mechanisms changing with oxygen concentration is inconsistent. Therefore, if the oxygen concentration changes by the same value, the diameter change of primary soot particles will not be linear.

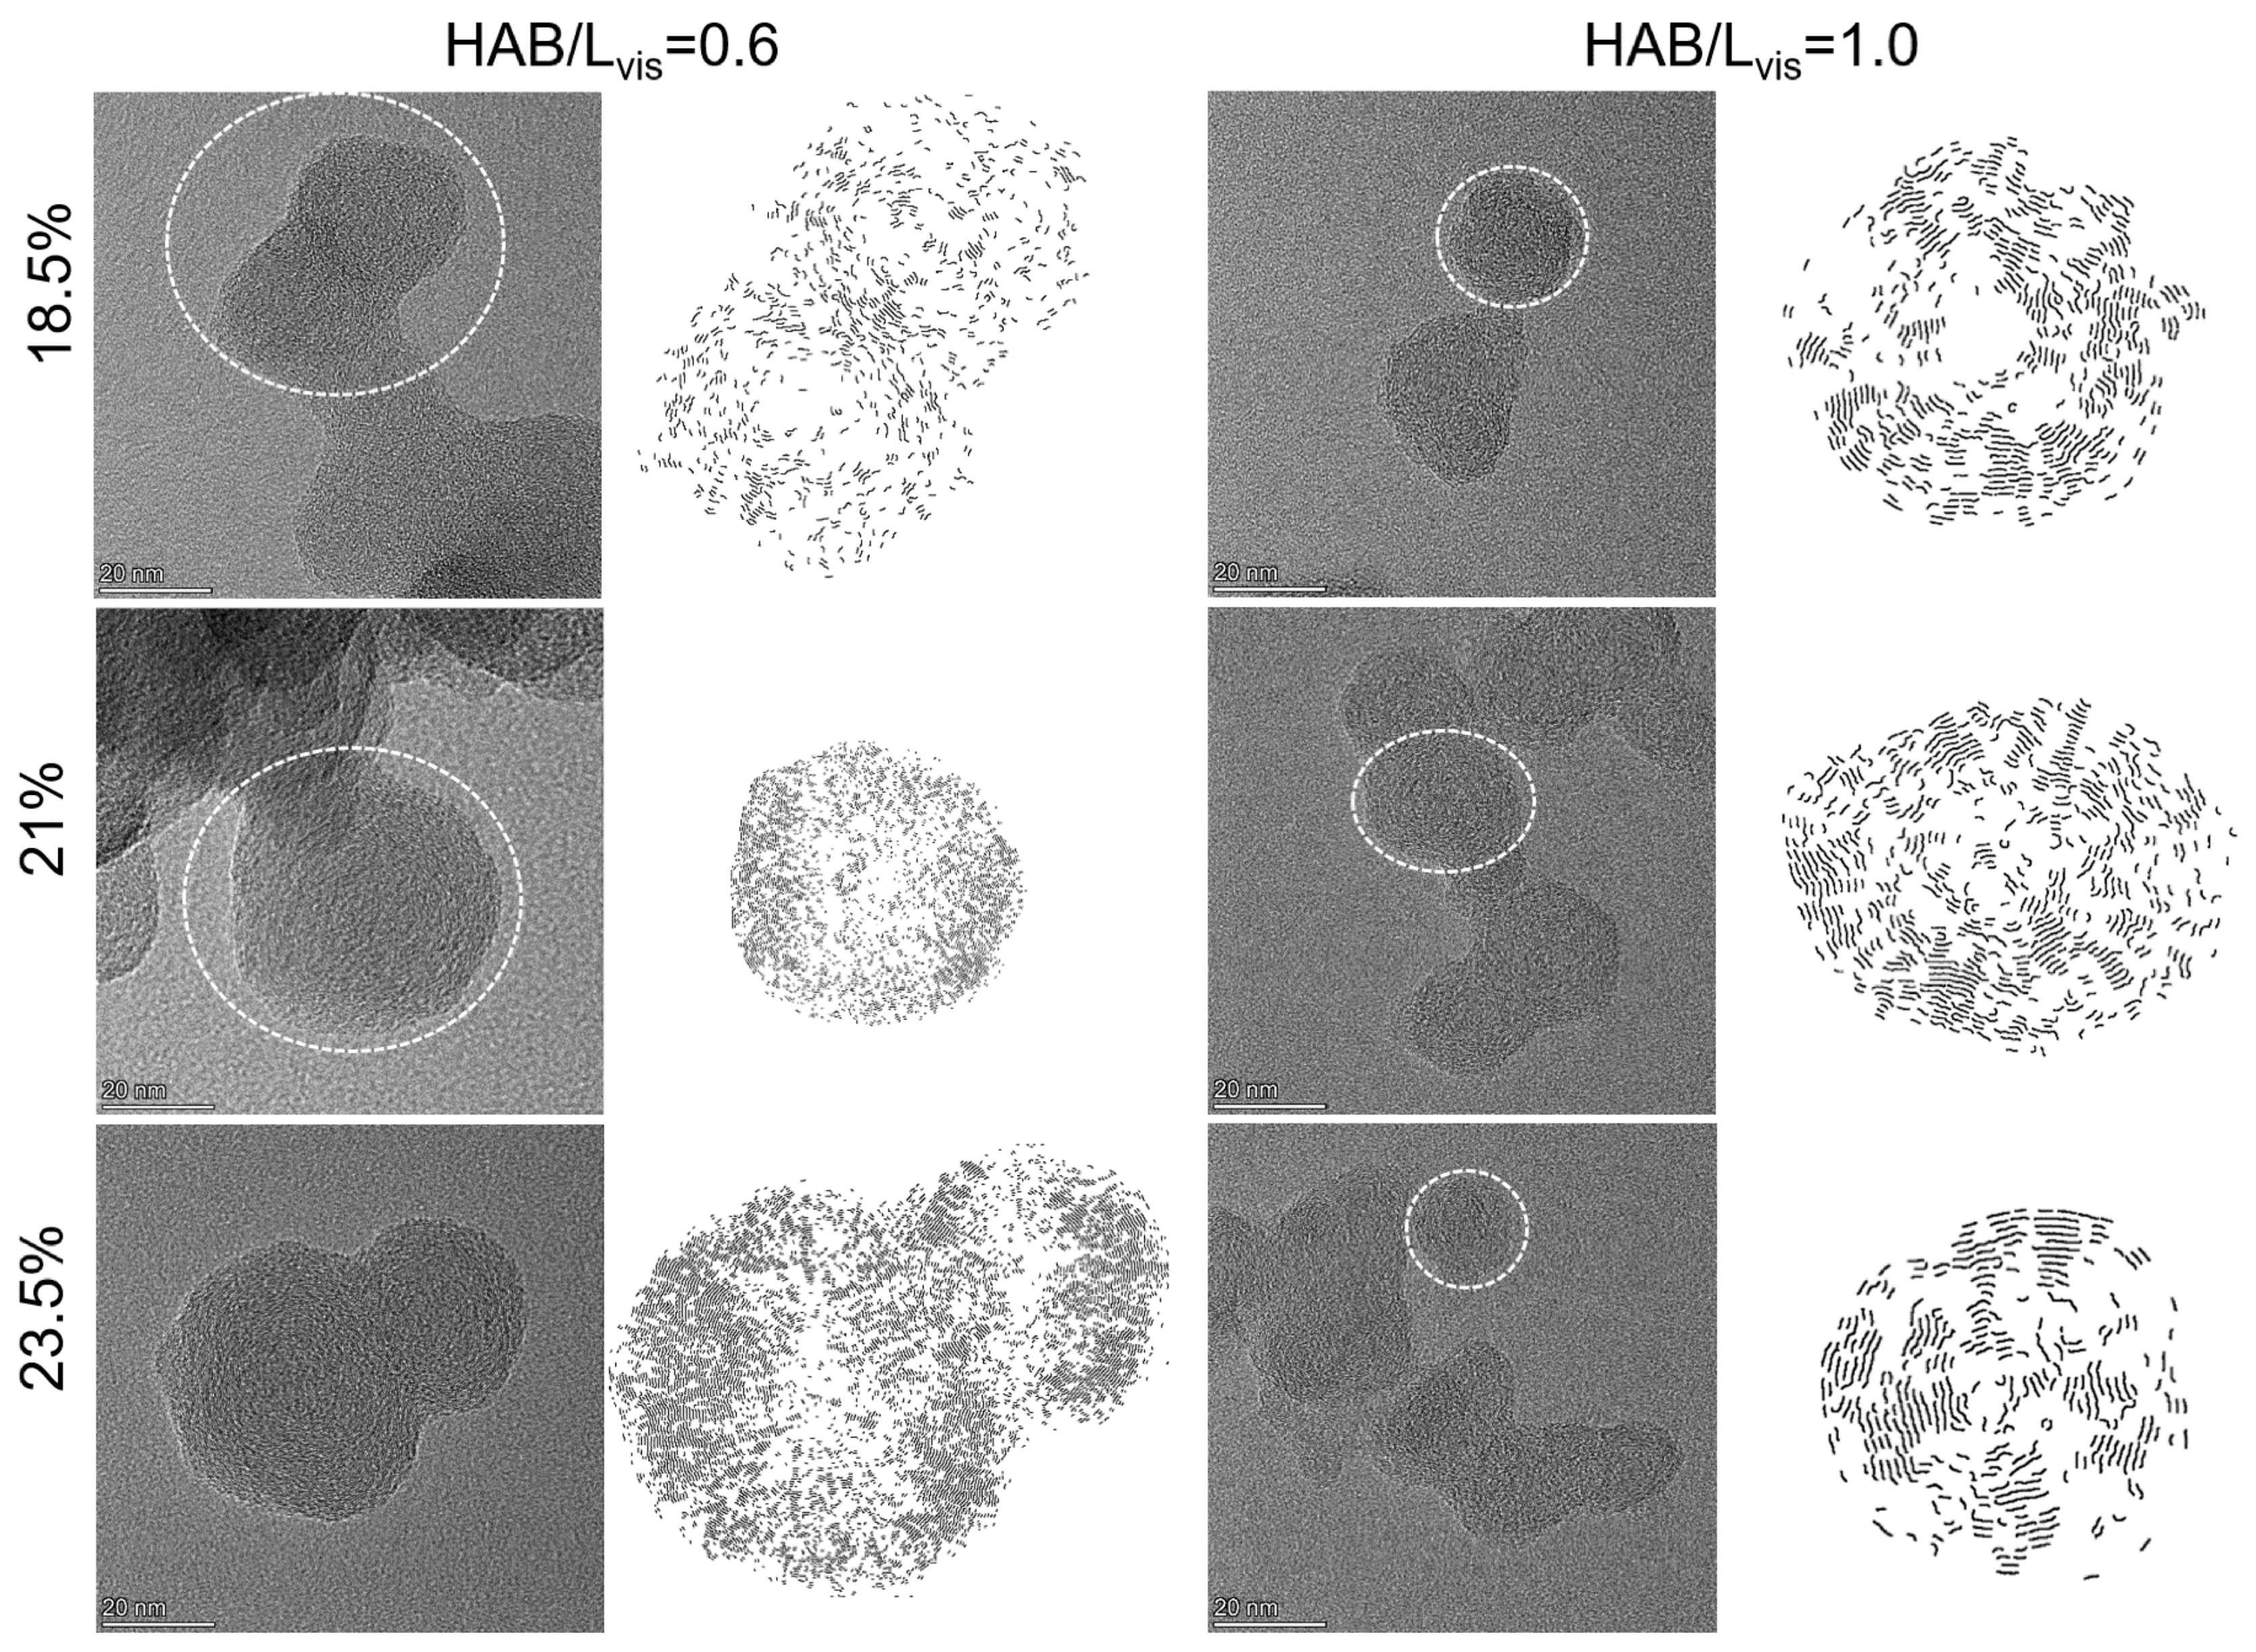
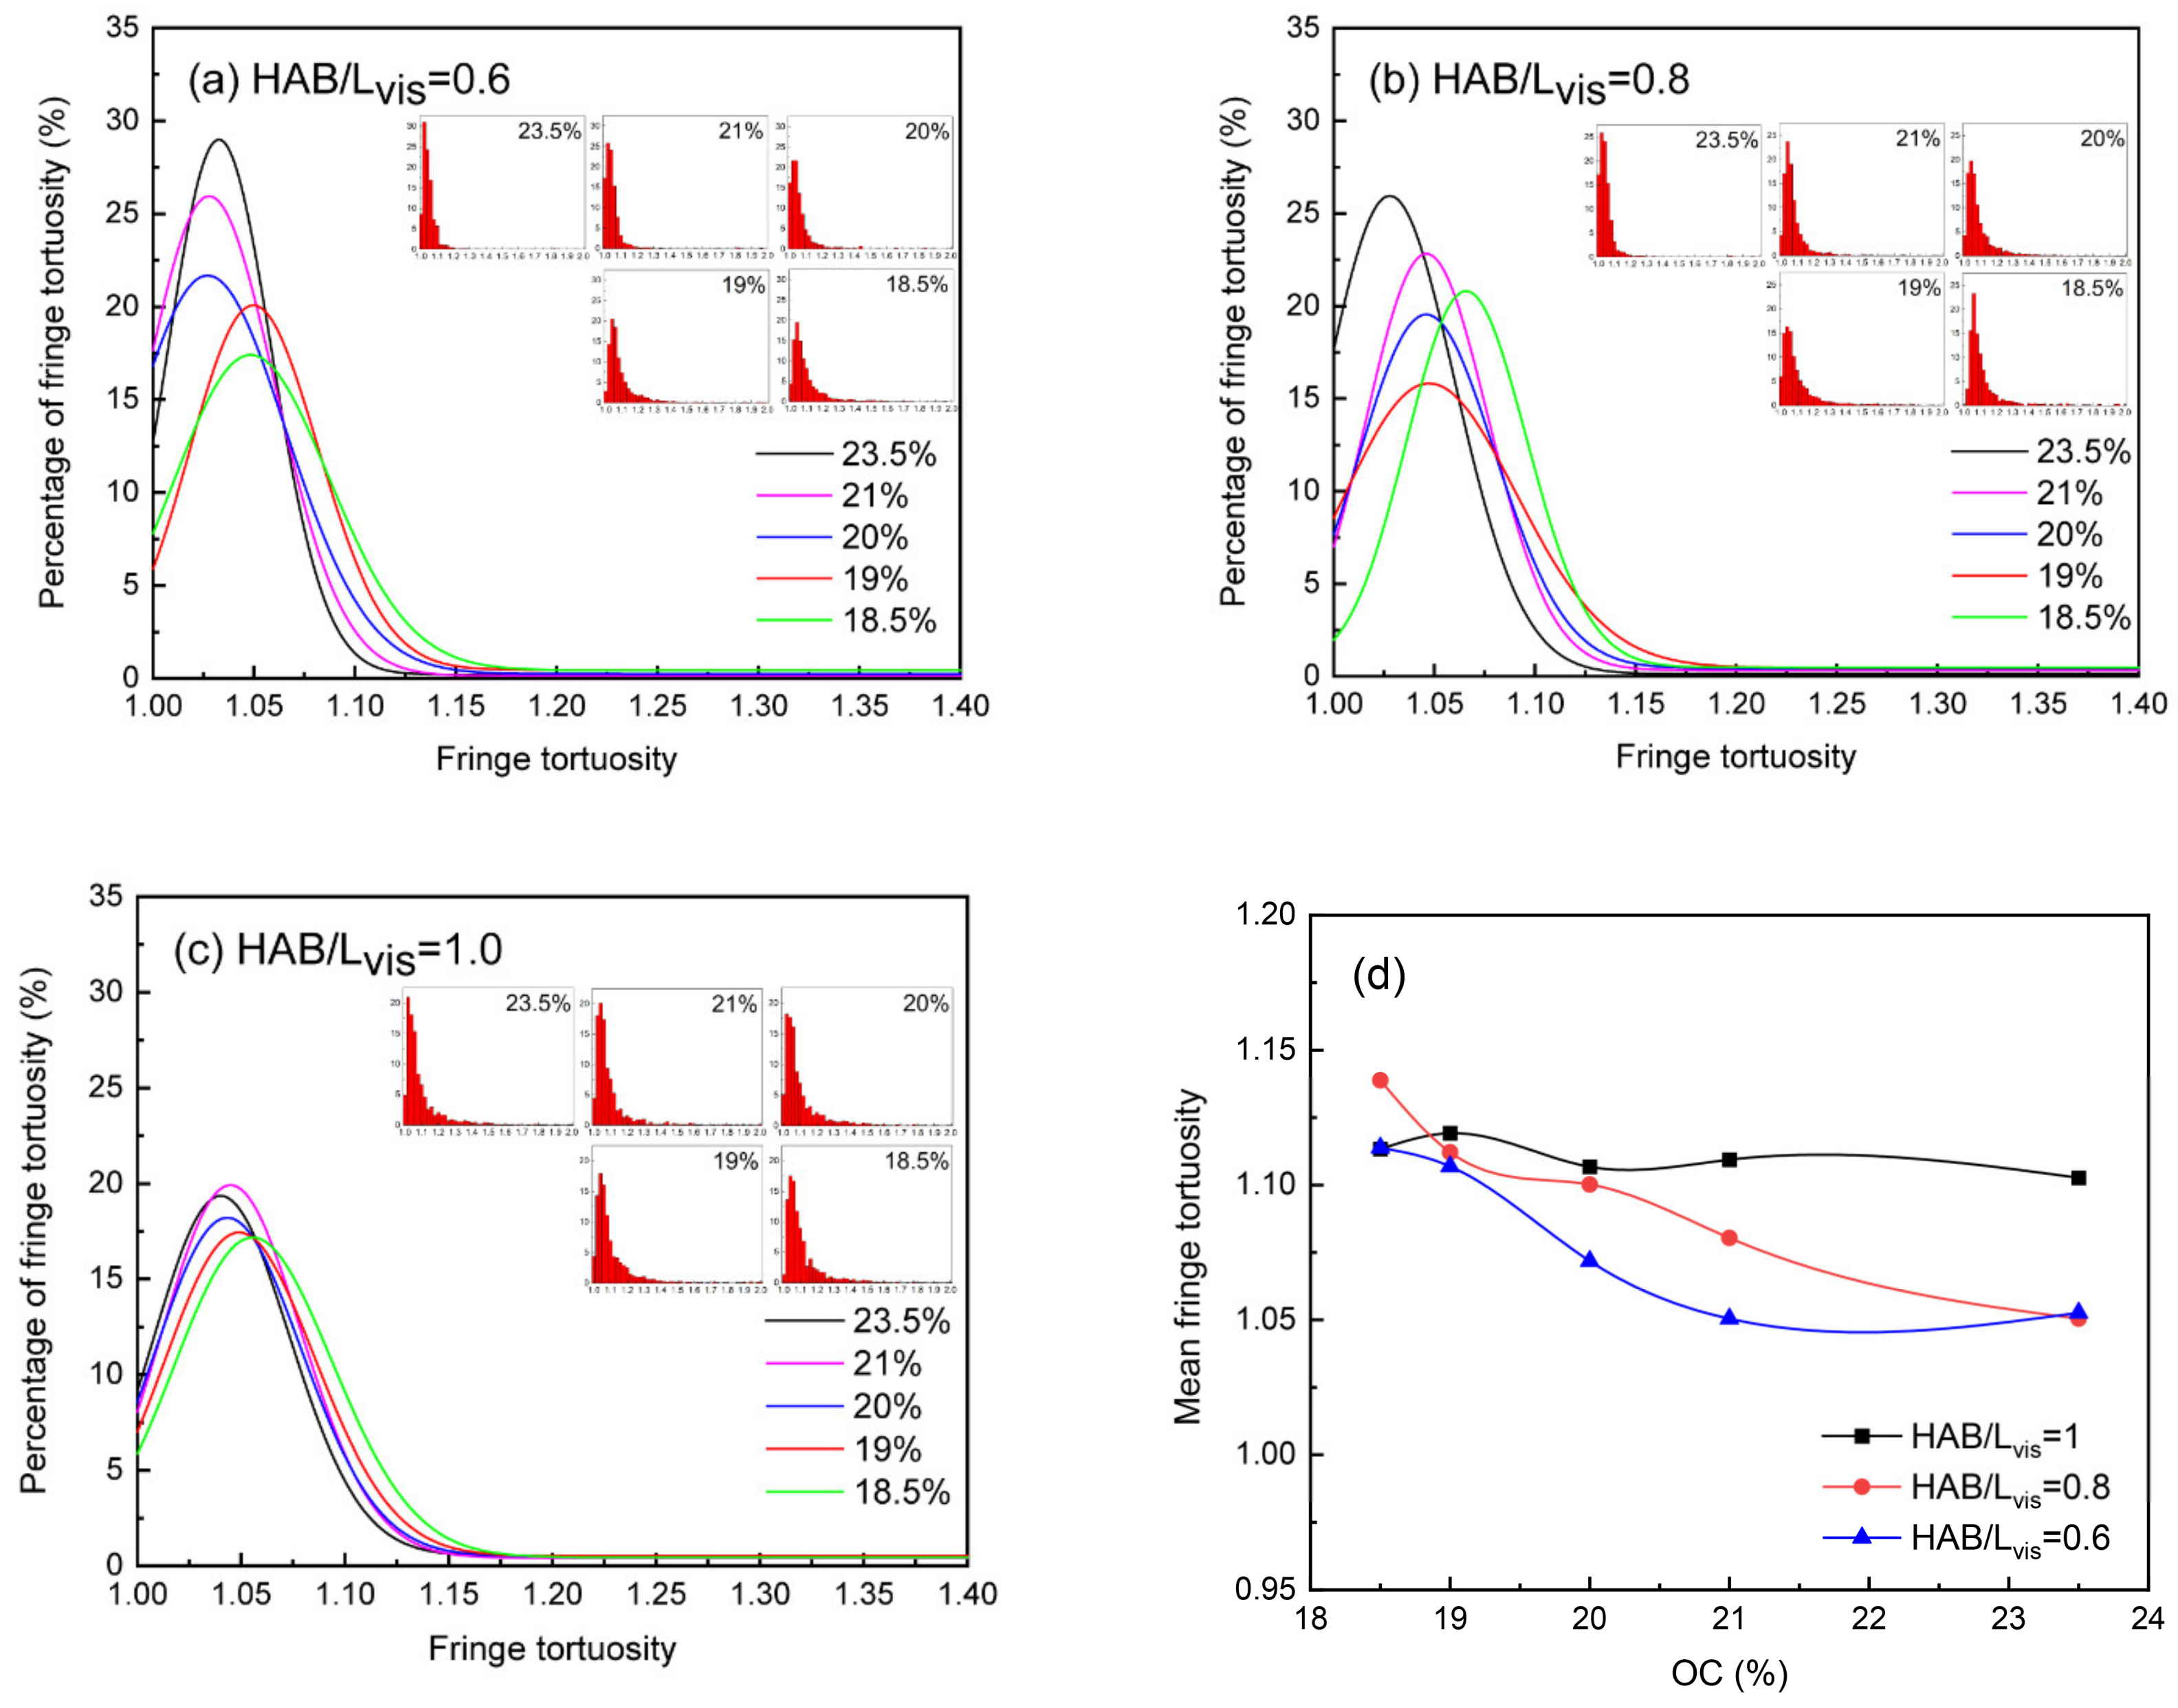
3.4. Soot Nanostructure

HRTEM images were analyzed by lattice fringe analysis as described in Figure 12, which presents some representative high-resolution images at oxygen-depleted (OC = 18.5%), normal air (OC = 21%) and oxygen-enriched (OC = 23.5%) conditions. The graphitization process was an orderly transformation of the carbonaceous material from a disordered layer structure to a graphite crystal structure. The HRTEM images allow the internal structure of the soot particles to be visualized and, thus, the degree of graphitization to be analyzed qualitatively. At a HAB/Lvis = 0.6, the soot particles showed a certain degree of graphitization. An ‘onion-like’ distribution of fringes can be observed in the HRTEM images for the OC = 18.5% with a major pattern of concentrically arranged carbon lattices in the particles. However, for the OC = 21% and OC = 23.5%, the ‘shell-core’ structure was observed, with the particles consisting of a disordered core and a graphitized outer shell of fringes running parallel to the perimeter of the particle. This indicates that soot particles at a HAB/Lvis = 0.6 in oxygen-depleted flames had not yet formed an orderly graphitized shell, and were still in the transition state between an amorphous carbon (carbon lattices with higher reactivity towards oxygen) structure to a more mature ‘shell-core’ structure. Besides, it can be seen that, as the oxygen concentration decreased, the distribution of particle fringes at the same dimensionless height became looser, and the disordered core region occupied a larger area of the entire particle. At a HAB/Lvis = 1, the ‘shell-core’ structure of soot particles was observed under all conditions (OC = 18.5~23.5%).
Compared with the soot particles at a HAB/Lvis = 0.6, the particles at the tip of the flame can be observed to have a smaller disordered core region. This means that the maturity or graphitization degree of the soot particles increased in the axial height direction of the flame. In a word, the fringe of particles in the oxygen-depleted flame was significantly more loosely distributed and had a larger disordered core than that in soot particles in normal air and oxygen-enriched air. This result suggests that reducing the oxygen concentration in the air inhibits the oxidation process of soot, which leads to a reduction in the maturity of the soot.
Fringe analysis of the HRTEM images can provide quantitative statistical indicators for describing the nanostructure of soot particles. In order to quantify the degree of graphitization of the soot particles at different oxygen concentrations, the distribution of fringe length (La), tortuosity (τ), and fringe spacing (d) was measured. Soot particles usually present a higher degree of graphitization and a lower reactivity with longer fringe length, lower fringe tortuosity, and the smaller fringe spacing.
Figure 13a–c shows the distribution of fringe lengths for the five cases of OC = 18.5%~23.5%. The distributions were similar for all samples at different oxygen concentrations, but the distribution peaks were different. In Figure 13a–c, the fringe length distributions mainly concentrated in the range of 0.4 to 1.6 nm, and the peak values were 30%~45% and occurring in the vicinity of 0.7 nm. The peak of the curve for the case of the OC of 18.5% had the largest peak value and corresponded to the shortest fringe length, thereby indicating that the case contained the majority of soot particles with short fringes. Therefore, the OC of 18.5% had the shortest fringes. The variation in the mean fringe length with oxygen concentration is shown in Figure 13d. The overwhelming majority of the data show that the fringe length decreased with decreasing oxygen concentration at all sampling points. As the oxygen concentration decreased from 23.5% to 18.5%, the mean fringe lengths of the soot primary particles decreased by an average of 0.18 nm at each HAB/Lvis. Notably, the value of the fringe length is a function of the number of aromatic rings (M), which can be expressed in Equation (2).
M = ( 5.8076 × L a 1.4787 ) 2 .
Therefore, the experimental results show that the microcrystalline layer in the soot particles from oxygen-depleted combustion contained a much lower number of aromatic rings. At the same dimensionless height, soot particles from the 18.5% oxygen concentration had fewer aromatic rings in the microcrystalline layer than the particles from the 23.5% oxygen concentration. The difference was 0.518 rings on average. Therefore, shorter fringe lengths suggest that the oxygen-depleted environment causes carbon lattices to have fewer aromatic rings and less graphitization.
The fringe tortuosity is a measure of the curvature of the fringes. The smaller fringe tortuosity indicates that the soot primary particles have more tightly arranged carbon lattices and higher maturity. Figure 14 shows the distribution of fringe tortuosity from the five cases of OC = 18.5%~23.5%. Most of the fringes in the samples were almost straight (τ < 1.15, considered flat) or showed a low degree of curvature (1.15 < τ < 1.35). This indicates the presence of at most one or two five-membered rings in the PAHs [48]. Furthermore, due to the curvature effect of the five-membered rings, the C–C bond weakens [49]. Therefore, the bigger the tortuosity of the soot fringe is, the more reactive sites there are on the carbon layers, and the weaker the oxidation resistance is. At a HAB/Lvis = 0.6 and 0.8 (Figure 14a,b), the proportion of fringe with low tortuosity decreased with a decreasing OC. However, at a HAB/Lvis = 1 (Figure 14c), the fringe tortuosity of the soot particles in all cases was essentially the same. The variation in the mean fringe tortuosity with changing oxygen concentration is shown in Figure 14d. As the oxygen concentration decreased from 23.5% to 18.5%, the mean fringe tortuosity increases by an average of 0.053 at each dimensionless height (HAB/Lvis). It means that a lower ambient oxygen concentration helps to preserve more reactive sites on carbon lattices during the stage when soot is not fully carbonized. These reactive sites are the sites which may be accessible to H-atom abstraction, followed by molecular addition, potential rearrangement and/or bonding with adjacent layer planes (graphitization), or reactivity with O2 or OH (oxidation) [50]. Therefore, soot oxidization resistance decreased under oxygen-depleted combustion, but it was not significant at the flame tip.
The fringe spacing represents the distance between adjacent graphene layers within the soot particles. The smaller fringe spacing indicates that the soot primary particles have a higher graphitization degree and maturity. Figure 15a–c show the distribution of fringe spacing for all soot samples. As can be observed from Figure 15a–c, the fringe spacing of soot generated from the cases of 18.5% ≤ OC < 21% (oxygen-depleted combustion) was larger than that of OC ≥ 21%, but the variation pattern was similar. With the decrease in the OC, the peak value of fringe spacing gradually shifted to a higher interval, while the peak value increased from 0.36 nm to 0.40 nm, which deviated from the 002-graphite distance (0.3345 nm). The variation in the mean fringe spacing with oxygen concentration is shown in Figure 15d. As the oxygen concentration decreased from 23.5% to 18.5%, the mean fringe spacing increased by an average of 0.035 nm at each dimensionless height (HAB/Lvis). The observed negative correlation relationship between the OC and fringe spacing indicated the loosening trend of the soot particle internal structures. It is probable that decreasing the OC led to more reactive sites that generated greater repulsive force between the electrons, which increased the fringe spacing. This indicates that reducing the oxygen concentration in the oxidizer generally decreases the graphitization degree of soot particles.
According to the above results, reducing the oxygen concentration in the oxidizer affected the morphological and nanostructure characteristics. With the decrease in the OC, the formation of graphite structures was inhibited, the fringe length of soot particles was shortened, the planar structure was reduced, and the interlayer spacing was increased. This indicates that the maturity of soot was reduced, and the oxidation resistance was weakened under the oxygen-depleted environment.

4. Conclusions

In this paper, five coflow flames, including one in normal air, one in oxygen-enriched air with an oxygen concentration of 23.5%, and three in oxygen-depleted air with oxygen concentrations of 20%, 19%, and 18.5%, respectively, were studied at atmospheric pressure to investigate the relevant characteristics of soot. The soot volume fraction and soot primary particle diameter were obtained through light extinction and quantitative TEM analysis, respectively. Three characterization parameters for the nanostructure of soot particles (i.e., fringe length, fringe tortuosity, and fringe spacing) were obtained through quantitative HRTEM analysis. These parameters can be used to characterize the yield, morphology, and nanostructure of soot. Among the cases of different oxidizer oxygen concentrations (23.5% to 18.5%), the change in the soot volume fraction was quantified, and the degree of graphitization of soot particles, i.e., the maturity, was compared. The following conclusions can be drawn:
(1)
The peak value of the soot volume fraction of the RP-3 coflow flames increased by 0.73 ppm as the oxygen concentration increased from 21% to 23.5% (a variation of 2.5), and it decreased by 1.25 ppm as the oxygen concentration decreased from 21% to 18.5% (a variation of 2.5).
(2)
The soot primary particle diameters in all RP-3 coflow flames showed a trend of increasing and then decreasing in the axial direction. However, when the oxygen concentration decreased from 23.5% to 18.5%, the soot primary particle diameter at the same dimensionless height did not vary linearly. This nonmonotonic trend can be attributed to competition between the two mechanisms. The variation in oxygen concentration leads to the competition between these two mechanisms: one is the change in residence time, and the other is the change in the growth rate of the soot particles. The trend of these two mechanisms changing with oxygen concentration is inconsistent. Therefore, if the oxygen concentration changes by the same value, the diameter change of the primary soot particles will not be linear.
(3)
The soot particles in all RP-3 coflow flames showed a trend towards an increased degree of graphitization along the axial direction. In particular, when the oxygen concentration decreased from 23.5% to 18.5%, the graphitization process of soot particles located at the same dimensionless height was slowed down, which can be quantified by a decrease of 0.18 nm in the mean fringe length, an increase of 0.053 in the mean fringe tortuosity, and an increase of 0.035 nm in the mean fringe spacing.
Eventually, the behavior of soot in RP-3 coflow oxygen-depleted combustion flames was explored in terms of morphology and nanostructure parameters. These results indicate that changes in the oxygen concentration in the oxidizer affect the graphitization process of soot in the flames, thereby influencing the maturity of the soot in the flame. The fundamental soot characteristics offered in this paper can provide more basic experimental data for the development and validation of quantitative soot prediction models for oxygen-depleted combustion.

Author Contributions

Conceptualization, Z.G. and J.G.; methodology, J.G.; validation, J.G.; formal analysis, J.G.; investigation, J.G., J.L., H.L., B.F. and X.X.; writing—original draft preparation, J.G.; writing—review and editing, Z.G.; visualization, J.G.; supervision, Z.G.; project administration, Z.G.; funding acquisition, Z.G. All authors have read and agreed to the published version of the manuscript.

Funding

This research was funded by the Science Center for Gas Turbine Project, grant number P2022-B-II-015-001.

Data Availability Statement

All relevant data have been presented in this manuscript.

Conflicts of Interest

The authors declare no conflict of interest.

Nomenclature

OCoxygen concentration, oxygen volume fraction of the oxidant
TEMtransmission electron microscopy
HRTEMhigh-resolution transmission electron microscopy
LRTEMlow-resolution transmission electron microscopy
LElaser extinction
SLMstandard liters per minute, equivalent to 1 L/min under 273.15 K and 1 atm
sccmstandard cubic centimeter per minute
SVFsoot volume fraction
ppmparts per million
λthe wavelength of light
Kextextinction coefficient
E(m)soot absorption function
Lvisvisible height
HABheight above the burner
Mthe number of aromatic rings
Lafringe length
τfringe tortuosity
dfringe spacing

References

  1. Bond, T.C.; Doherty, S.J.; Fahey, D.W.; Forster, P.M.; Berntsen, T.; DeAngelo, B.J.; Flanner, M.G.; Ghan, S.; Karcher, B.; Koch, D.; et al. Bounding the role of black carbon in the climate system: A scientific assessment. J. Geophys. Res. Atmos. 2013, 118, 5380–5552. [Google Scholar] [CrossRef]
  2. Wang, H. Formation of nascent soot and other condensed-phase materials in flames. Proc. Combust. Inst. 2011, 33, 41–67. [Google Scholar] [CrossRef]
  3. Oberdorster, G.; Sharp, Z.; Atudorei, V.; Elder, A.; Gelein, R.; Kreyling, W.; Cox, C. Translocation of inhaled ultrafine particles to the brain. Inhal. Toxicol. 2004, 16, 437–445. [Google Scholar] [CrossRef] [PubMed]
  4. Haynes, B.S.; Wagner, H.G. Soot formation. Prog. Energy Combust. Sci. 1981, 7, 229–273. [Google Scholar] [CrossRef]
  5. Zhigang, L.; Kim, A.K. A Review of Water Mist Fire Suppression Systems—Fundamental Studies. J. Fire Prot. Eng. 1999, 10, 32–50. [Google Scholar] [CrossRef] [Green Version]
  6. Palash, S.M.; Kalam, M.A.; Masjuki, H.H.; Masum, B.M.; Rizwanul Fattah, I.M.; Mofijur, M. Impacts of biodiesel combustion on Nox emissions and their reduction approaches. Renew. Sustain. Energy Rev. 2013, 23, 473–490. [Google Scholar] [CrossRef]
  7. Glassman; Yaccarino, P. The Effect of Oxygen Concentration on Sooting Diffusion Flames. Combust. Sci. Technol. 1980, 24, 107–114. [Google Scholar] [CrossRef]
  8. Lee, K.O.; Megaridis, C.M.; Zelepouga, S.; Saveliev, A.V.; Kennedy, L.A.; Charon, O.; Ammouri, F. Soot formation effects of oxygen concentration in the oxidizer stream of laminar coannular nonpremixed methane/air flames. Combust. Flame 2000, 121, 323–333. [Google Scholar] [CrossRef]
  9. Leusden, C.P.; Peters, N. Experimental and numerical analysis of the influence of oxygen on soot formation in laminar counterflow flames of acetylene. Proc. Combust. Inst. 2000, 28, 2619–2625. [Google Scholar] [CrossRef]
  10. Seong, H.J.; Boehman, A.L. Studies of soot oxidative reactivity using a diffusion flame burner. Combust. Flame 2012, 159, 1864–1875. [Google Scholar] [CrossRef]
  11. Jain, A.; Das, D.D.; McEnally, C.S.; Pfefferle, L.D.; Xuan, Y. Experimental and numerical study of variable oxygen index effects on soot yield and distribution in laminar co-flow diffusion flames. Proc. Combust. Inst. 2019, 37, 859–867. [Google Scholar] [CrossRef]
  12. Demarco, R.; Jerez, A.; Liu, F.; Chen, L.; Fuentes, A. Modeling soot formation in laminar coflow ethylene inverse diffusion flames. Combust. Flame 2021, 232, 111513. [Google Scholar] [CrossRef]
  13. Bi, X.; Liu, H.; Huo, M.; Shen, C.; Qiao, X.; Lee, C.-F.F. Experimental and numerical study on soot formation and oxidation by using diesel fuel in constant volume chamber with various ambient oxygen concentrations. Energy Convers. Manag. 2014, 84, 152–163. [Google Scholar] [CrossRef]
  14. Zhao, Z.C.; Wu, H.; Wang, M.Z.; Lee, C.F.; Liu, J.P.; Fu, J.Q.; Chang, W. Computational Investigation of Oxygen Concentration Effects on a Soot Mechanism with a Phenomenological Soot Model of Acetone-Butanol-Ethanol (ABE). Energy Fuels 2015, 29, 1710–1721. [Google Scholar] [CrossRef]
  15. Vo, C.; Charoenphonphanich, C.; Karin, P.; Susumu, S.; Hidenori, K. Effects of variable O-2 concentrations and injection pressures on the combustion and emissions characteristics of the petro-diesel and hydrotreated vegetable oil-based fuels under the simulated diesel engine condition. J. Energy Inst. 2018, 91, 1071–1084. [Google Scholar] [CrossRef]
  16. Zhu, J.; Huang, H.; Zhu, Z.; Lv, D.; Pan, Y.; Wei, H.; Zhuang, J. Effect of intake oxygen concentration on diesel–n-butanol blending combustion: An experimental and numerical study at low engine load. Energy Convers. Manag. 2018, 165, 53–65. [Google Scholar] [CrossRef]
  17. Sun, Z.; Dally, B.; Alwahabi, Z.; Nathan, G. The effect of oxygen concentration in the co-flow of laminar ethylene diffusion flames. Combust. Flame 2020, 211, 96–111. [Google Scholar] [CrossRef]
  18. Ashraf, M.A.; Ahmed, H.A.; Steinmetz, S.; Dunn, M.J.; Masri, A.R. On the effects of varying coflow oxygen on soot and precursor nanoparticles in ethylene laminar diffusion flames. Fuel 2021, 300, 120913. [Google Scholar] [CrossRef]
  19. Fuentes, A.; Henríquez, R.; Nmira, F.; Liu, F.; Consalvi, J.-L. Experimental and numerical study of the effects of the oxygen index on the radiation characteristics of laminar coflow diffusion flames. Combust. Flame 2013, 160, 786–795. [Google Scholar] [CrossRef] [Green Version]
  20. Escudero, F.; Fuentes, A.; Consalvi, J.L.; Liu, F.; Demarco, R. Unified behavior of soot production and radiative heat transfer in ethylene, propane and butane axisymmetric laminar diffusion flames at different oxygen indices. Fuel 2016, 183, 668–679. [Google Scholar] [CrossRef]
  21. Jerez, A.; Consalvi, J.-L.; Fuentes, A.; Liu, F.; Demarco, R. Soot production modeling in a laminar coflow ethylene diffusion flame at different Oxygen Indices using a PAH-based sectional model. Fuel 2018, 231, 404–416. [Google Scholar] [CrossRef]
  22. Mao, Y.; Yu, L.; Wu, Z.; Tao, W.; Wang, S.; Ruan, C.; Zhu, L.; Lu, X. Experimental and kinetic modeling study of ignition characteristics of RP-3 kerosene over low-to-high temperature ranges in a heated rapid compression machine and a heated shock tube. Combust. Flame 2019, 203, 157–169. [Google Scholar] [CrossRef]
  23. Mao, Y.; Xia, J.; Ruan, C.; Wu, Z.; Feng, Y.; Zhu, J.; Wang, S.; Yu, L.; Lu, X. An experimental and kinetic modeling study of a four-component surrogate fuel for RP-3 kerosene. Proc. Combust. Inst. 2021, 38, 555–563. [Google Scholar] [CrossRef]
  24. Mao, Y.; Yu, L.; Qian, Y.; Wang, S.; Wu, Z.; Raza, M.; Zhu, L.; Hu, X.; Lu, X. Development and validation of a detailed kinetic model for RP-3 aviation fuel based on a surrogate formulated by emulating macroscopic properties and microscopic structure. Combust. Flame 2021, 229, 111401. [Google Scholar] [CrossRef]
  25. Xue, X.; Hui, X.; Singh, P.; Sung, C.-J. Soot formation in non-premixed counterflow flames of conventional and alternative jet fuels. Fuel 2017, 210, 343–351. [Google Scholar] [CrossRef]
  26. Saffaripour, M.; Veshkini, A.; Kholghy, M.; Thomson, M.J. Experimental investigation and detailed modeling of soot aggregate formation and size distribution in laminar coflow diffusion flames of Jet A-1, a synthetic kerosene, and n-decane. Combust. Flame 2014, 161, 848–863. [Google Scholar] [CrossRef]
  27. Li, J.; Gan, Z.; Liang, Y. An experimental investigation of soot morphology and nanostructure in high-pressure co-flow laminar methane diffusion flames. Exp. Therm. Fluid Sci. 2022, 136, 110676. [Google Scholar] [CrossRef]
  28. Abdalla, A.O.G.; Ying, Y.Y.; Jiang, B.; He, X.M.; Liu, D. Comparative study on characteristics of soot from n-decane and RP-3 kerosene normal/inverse diffusion flames. J. Energy Inst. 2020, 93, 62–75. [Google Scholar] [CrossRef]
  29. Sun, M.; Gan, Z.; Yang, Y. A Comparison Study of Soot Precursor and Aggregate Property Between Algae-Based Aviation Biofuel and Aviation Kerosene RP-3 in Laminar Flame. J. Energy Resour. Technol. 2021, 143, 112304. [Google Scholar] [CrossRef]
  30. Sun, M.; Gan, Z.; Yang, Y. Numerical and experimental investigation of soot precursor and primary particle size of aviation fuel (RP-3) and n-dodecane in laminar flame. J. Energy Inst. 2021, 94, 49–62. [Google Scholar] [CrossRef]
  31. Yang, Y.; Gan, Z. In Soot Morphological Differences between Laminar Diffusion Flames of Traditional Aviation Kerosene and Bio-kerosene. In Proceedings of the Global Power and Propulsion Society, Beijing, China, 16–18 September 2019. [Google Scholar]
  32. Chang, D.; Li, J.; Yang, Y.; Gan, Z. Soot Morphology and Nanostructure Differences between Chinese Aviation Kerosene and Algae-Based Aviation Biofuel in Free Jet Laminar Diffusion Flames. ACS Omega 2022, 7, 11560–11569. [Google Scholar] [CrossRef] [PubMed]
  33. Vargas, A.M.; Gülder, Ö.L. A multi-probe thermophoretic soot sampling system for high-pressure diffusion flames. Rev. Sci. Instrum. 2016, 87, 055101. [Google Scholar] [CrossRef] [PubMed] [Green Version]
  34. Ávila, C.D.; Botero, M.L.; Agudelo, A.F.; Agudelo, J.R. An assessment on how different collection methods impact thermal properties, surface functional groups, nanostructure and morphology of diesel particulate matter. Combust. Flame 2021, 225, 74–85. [Google Scholar] [CrossRef]
  35. Rasband, W.S. ImageJ; U.S. National Institutes of Health: Bethesda, MD, USA, 1997. Available online: https://imagej.net/ij/index.html (accessed on 1 February 2022).
  36. Yehliu, K.; Vander Wal, R.L.; Boehman, A.L. Development of an HRTEM image analysis method to quantify carbon nanostructure. Combust. Flame 2011, 158, 1837–1851. [Google Scholar] [CrossRef]
  37. Botero, M.L.; Adkins, E.M.; González-Calera, S.; Miller, H.; Kraft, M. PAH structure analysis of soot in a non-premixed flame using high-resolution transmission electron microscopy and optical band gap analysis. Combust. Flame 2016, 164, 250–258. [Google Scholar] [CrossRef] [Green Version]
  38. Botero, M.L.; Sheng, Y.; Akroyd, J.; Martin, J.; Dreyer, J.A.H.; Yang, W.; Kraft, M. Internal structure of soot particles in a diffusion flame. Carbon 2019, 141, 635–642. [Google Scholar] [CrossRef] [Green Version]
  39. Wang, J.; Li, H.; Li, X.; Zhang, L.; Li, X. Investigation on the Characteristic of Laser Induced Plasma by Abel Inversion. Spectroscopy and Spectral Analysis. Spectrosc. Spectr. Anal. 2019, 39, 250–256. [Google Scholar]
  40. Simonsson, J.; Olofsson, N.-E.; Török, S.; Bengtsson, P.-E.; Bladh, H. Wavelength dependence of extinction in sooting flat premixed flames in the visible and near-infrared regimes. Appl. Phys. B 2015, 119, 657–667. [Google Scholar] [CrossRef]
  41. Yan, F.; Zhou, M.; Xu, L.; Wang, Y.; Chung, S.H. An experimental study on the spectral dependence of light extinction in sooting ethylene counterflow diffusion flames. Exp. Therm. Fluid Sci. 2019, 100, 259–270. [Google Scholar] [CrossRef] [Green Version]
  42. Singh, P.; Hui, X.; Sung, C.-J. Soot formation in non-premixed counterflow flames of butane and butanol isomers. Combust. Flame 2016, 164, 167–182. [Google Scholar] [CrossRef] [Green Version]
  43. Kholghy, M.R.; Afarin, Y.; Sediako, A.D.; Barba, J.; Lapuerta, M.; Chu, C.; Weingarten, J.; Borshanpour, B.; Chernov, V.; Thomson, M.J. Comparison of multiple diagnostic techniques to study soot formation and morphology in a diffusion flame. Combust. Flame 2017, 176, 567–583. [Google Scholar] [CrossRef]
  44. Wang, Y.; Chung, S.H. Soot formation in laminar counterflow flames. Prog. Energy Combust. Sci. 2019, 74, 152–238. [Google Scholar] [CrossRef]
  45. De, S.; De, A.; Jaiswal, A.; Dash, A. Stabilization of lifted hydrogen jet diffusion flame in a vitiated co-flow: Effects of jet and coflow velocities, coflow temperature and mixing. Int. J. Hydrog. Energy 2016, 41, 15026–15042. [Google Scholar] [CrossRef]
  46. Mehta, R.S.; Haworth, D.C.; Modest, M.F. Composition PDF/photon Monte Carlo modeling of moderately sooting turbulent jet flames. Combust. Flame 2010, 157, 982–994. [Google Scholar] [CrossRef]
  47. Du, D.X.; Axelbaum, R.L.; Law, C.K. The influence of carbon dioxide and oxygen as additives on soot formation in diffusion flames. Symp. (Int.) Combust. 1991, 23, 1501–1507. [Google Scholar] [CrossRef]
  48. Apicella, B.; Pre, P.; Alfe, M.; Ciajolo, A.; Gargiulo, V.; Russo, C.; Tregrossi, A.; Deldique, D.; Rouzaud, J.N. Soot nanostructure evolution in premixed flames by High Resolution Electron Transmission Microscopy (HRTEM). Proc. Combust. Inst. 2015, 35, 1895–1902. [Google Scholar] [CrossRef]
  49. Ebbesen, T.W. Carbon Nanotubes: Preparation and Properties; CRC Press: Boca Raton, FL, USA, 1996; pp. 42–49. [Google Scholar]
  50. Vander Wal, R.L.; Tomasek, A.J. Soot oxidation: Dependence upon initial nanostructure. Combust. Flame 2003, 134, 1–9. [Google Scholar] [CrossRef]
Figure 1. The schematic of the experimental rig [27].
Energies 16 03166 g001
Figure 2. (a) The sampling probe dimensions; (b) Internal structure of the TEM grid fixing flange [27].
Energies 16 03166 g002
Figure 3. Probe pneumatic sampling (a) shows the appearance of coflow diffusion flame and the sampling probe. (b) shows the sampling process for the case of OC = 21%).
Energies 16 03166 g003
Figure 4. (a) Measurement of fringe length and tortuosity; (b) Measurement of fringe spacing.
Energies 16 03166 g004
Figure 5. An illustration of the laser extinction.
Energies 16 03166 g005
Figure 6. An illustration of the temperature measurement system.
Energies 16 03166 g006
Figure 7. Centerline temperature profiles of flames for the cases of OC = 23.5%, 21%, 18.5%.
Energies 16 03166 g007
Figure 8. The appearance of the coflow diffusion flame. White lines denote the position of fuel nozzle of each flame case.
Energies 16 03166 g008
Figure 9. (a) Radial soot volume fraction (SVF) profiles; (b) soot volume fraction peak value distribution. The red triangle represents the peak value of the radial SVF at this position. The error bars indicate the standard deviation. In order to avoid clutter, values of 20% OC are presented to represent all data points.
Energies 16 03166 g009
Figure 10. Soot primary particle diameter distribution in RP-3 flames at OC = 23.5%, 21%, 20%, 19%, 18.5%.
Energies 16 03166 g010
Figure 11. Mean soot primary particle diameters at different oxygen concentrations. (a) dp profiles vs. HAB for 18.5~23.5% coflow oxygen concentrations; (b) dp profiles vs. OC and HAB/Lvis = 0.6, 0.8, 1. The error bars indicate the standard deviation.
Energies 16 03166 g011
Figure 12. Representative HRTEM images (630,000× magnification) of soot particles for OC = 23.5%, 21%, and 18.5%.
Energies 16 03166 g012
Figure 13. Fringe length for OC of 23.5%, 21%, 20%, 19%, and 18.5%: (a) HAB/Lvis = 0.6, (b) HAB/Lvis = 0.8, (c) HAB/Lvis = 1; (d) mean fringe length of OC at HAB/Lvis = 0.6, 0.8, 1.
Energies 16 03166 g013
Figure 14. Fringe tortuosity for OC of 23.5%, 21%, 20%, 19%, and 18.5%: (a) HAB/Lvis = 0.6, (b) HAB/Lvis = 0.8, (c) HAB/Lvis = 1; (d) mean fringe tortuosity of OC at HAB/Lvis = 0.6, 0.8, 1.
Energies 16 03166 g014
Figure 15. Fringe spacing for OC of 23.5%, 21%, 20%, 19%, and 18.5%: (a) HAB/Lvis = 0.6, (b) HAB/Lvis = 0.8, (c) HAB/Lvis = 1; (d) mean fringe spacing of OC at HAB/Lvis = 0.6, 0.8, 1.
Energies 16 03166 g015
Table 1. Summary of the literature.
Year/Author/RefOxygen Concentration RangeFuel/Flame TypeObject of Study
2000, Lee et al. [8]21%, 50%, 100%Methane coflowsoot yield, fractal dimensions
2012, Seong and Boehman [10]21%, 27%, 30%, 35%N-heptane coflowsoot oxidative reactivity
2019, Jain et al. [11]21%~76.3%Methane coflowflame height, soot yield, and soot distribution
2014, Bi et al. [13]15%, 18%, 21% (134 Mpa)Diesel fuel constant volume chambersoot mass concentration
2020, Sun et al. [17]16.8%~36.8%Ethylene coflowsoot volume fraction, soot primary particle diameter
2021, Ashraf et al. [18]19%~40%Ethylene coflowsoot volume fraction, soot primary particle diameter, and precursor nanoparticle concentration
2019, Mao et al. [22]6.96%~20.88%RP-3 shock tubekinetic model
Table 2. Properties and compositions of RP-3 jet fuel.
Chemical
Formula
Lower
Heating Value (MJ/kg)
Alkane (wt%)Aromatics (wt%)Cycloalkanes (wt%)Olefin (wt%)Naphthalenes (wt%)Other
Compounds (wt%)
C15.06H30.3243.1452.44%18.53%15.54%7.64%4.39%1.46%
Table 3. Summary of flames investigated in this study.
Flame No.Oxidant Stream
Total Flow Rate = 6.00 SLM 1
The Flow Rate of Air (SLM 1)The Flow Rate of N2 (SLM 1)The Flow Rate of O2 (SLM 1)Oxygen
Concentration (OC) in the Oxidant Stream (Vol. Frac.)
Visible Flame Height (mm)Sampling Points (Central Line) (mm)
15.8100.1923.5%2314, 18, 23
26.000021.0%3018, 24, 30
35.720.28020.0%3320, 26, 33
45.440.56019.0%3823, 30, 38
55.280.72018.5%4125, 33, 41
1 SLM stands for standard liters per minute, equivalent to 1 L/min under 273.15 K and 1 atm.
Table 4. Comparison of maximum soot concentrations of methane, propane, and RP-3 kerosene flames at varying oxygen concentrations.
RefsOxygen ConcentrationFuel TypeMaximum Soot
Volume Fraction (ppm)
[11]24%CH40.17
[20]23%C3H81.90
This work23.5%RP-3(C15.06H30.32)5.83
[11]21%CH40.12
[20]21%C3H81.79
This work21%RP-3(C15.06H30.32)5.10
Disclaimer/Publisher’s Note: The statements, opinions and data contained in all publications are solely those of the individual author(s) and contributor(s) and not of MDPI and/or the editor(s). MDPI and/or the editor(s) disclaim responsibility for any injury to people or property resulting from any ideas, methods, instructions or products referred to in the content.

