Article

Experimental Investigation on Velocity Fluctuation in a Vaned Diffuser Centrifugal Pump Measured by Laser Doppler Anemometry

1
School of Energy and Power Engineering, Jiangsu University, Zhenjiang 212013, China
2
Shanghai Marine Equipment Research Institute (SMERI), Shanghai 200031, China
*
Author to whom correspondence should be addressed.
Energies 2023, 16(7), 3223; https://doi.org/10.3390/en16073223
Submission received: 17 February 2023 / Revised: 21 March 2023 / Accepted: 28 March 2023 / Published: 3 April 2023

Abstract

:
Turbulent flow, mainly originating from the rotor-stator interaction (RSI), is closely associated with the normal and safe operation of the centrifugal pump. In the current research, to clarify turbulent flow in the centrifugal pump with a vaned diffuser, the non-intrusive LDA (Laser Doppler Anemometry) system is applied to measure velocity pulsation signals at different regions when the pump operates at various flow rates. Time and frequency domain analysis methods are combined to investigate the velocity signals, and the velocity distribution around the volute tongue region is reconstructed from twenty measuring points. Results show that the velocity spectrum is characterized by the discrete components at the blade passing frequency and its higher harmonics, and it is caused by the RSI between the impeller and the diffuser. For the points in the volute spiral and diffusion sections, due to the significantly reduced RSI effect, the velocity spectrum shows an evident difference from comparison with the points between the impeller and diffuser, and the blade passing frequency is not always the dominant frequency. The comparison of velocity amplitudes and RMS* (root mean square of velocity) values at different points proves that the measuring position and flow rate affect velocity pulsations. As observed from velocity distribution reconstructed by LDA signals, high velocity regions are developed downstream of the diffuser channel for all the measured flow rates.

1. Introduction

Centrifugal pumps are the most important equipment in every field to transport fluid under pressure and have been empirically proven that their operation consumes a lot of power [1]. So, pump efficiency is one of the most important parameters considered during the pump design to save energy. Furthermore, ensuring a normal and stable operation of the centrifugal pump is also very important to eliminate the negative effect of the pump on the entire running system [2]. To improve the centrifugal pump’s stability, turbulence within the flow must be addressed, as these induce internal flow pulsation aside from those generated from the shaft and other vibration sources [3,4]. Therefore, the subject matter of turbulence has been extensively researched [5,6].
Pressure pulsations are the most important manifestation of turbulence in the pump, and many types of research have been conducted to clarify pressure pulsations through numerical simulation and experiment. Based on the fast response pressure transducers, Gao et al., measured the pressure pulsation of an impeller/volute-matched centrifugal pump [7]. The pressure spectra are analyzed in detail, and the effects of the measuring position and flow rate on the pressure spectrum are clarified. Minimum pressure pulsations are generated at the rated flow rate. Wang et al. analyzed transient pressure pulsations in a nuclear pump with a vaned diffuser [8]. Emphasis is laid on the clocking effect of pressure pulsations relative to changing position of the vaned diffuser. Ni et al. investigated pressure pulsations of a mixed flow nuclear pump. Results show that due to the typical combination of rotor/stator, the dominant frequencies are the blade passing frequency and its higher harmonics [9]. Some investigations have been conducted to arrive at an effective method of alleviating pressure pulsations. Specifically designed volute, impeller and design optimization of key parameters have been adopted to reduce pressure pulsation [10,11,12,13,14].
Turbulent flow originates from the complex flow structure within the pump, which has attracted attention over the years. Posa et al., used the LES (Large Eddy Simulation) to investigate internal complex flow structures in a vaned diffuser mixed flow pump [15,16]. Attention is laid on the unsteady wake flow evolution and its striking with the diffuser blade. Similar work was carried out by Kye et al. [17]. Zhang et al. used the DDES method (Delayed Detached Eddy Simulation) to analyze the transient flow within a centrifugal pump [18,19]. Different vortex identification methods were proposed to reveal the large-scale vortices in the pump. The internal flow structure is measured by the non-intrusive measure technique PIV (particle image velocimetry). Keller et al. obtained the flow distributions in a centrifugal pump under 1.4 Qd, and the interaction between the shedding flow structures and the stationary volute tongue was established [20]. Similar work done by Zhang et al., is extended to include various flow rates [21]. Though many types of research using PIV measurement have been carried out, most of the study only concentrates on the time-averaged flow field due to the limitation of the PIV technique.
Compared with pressure pulsations investigated by many scholars, velocity fluctuations are rarely analyzed, which are also the important manifestation of turbulent flow. Feng et al. used the LDA system to measure velocity distributions of the radial flow pump, and velocity signals at different regions [22]. Similar studies have been carried out by Pedersen et al. [23] and Wuibaut et al. [24]. By use of LDA, Ni et al. revealed typical flow distributions at different flow rates of a nuclear pump [9]. Zhang et al., measured velocity pulsations of a centrifugal pump by LDA, meanwhile simultaneously sampling pressure pulsations [25]. Evidently, velocity pulsations in pumps were rarely discussed, and only a few papers used the LDA system to capture velocity signals. Therefore, it is necessary to study internal turbulent flow fields from the velocity pulsation aspect in the pump, which can contribute to a better understanding of the internal turbulent flow within the centrifugal pump from the time-frequency analysis.
In the current research, to clarify velocity fluctuations in the centrifugal pump with a vaned diffuser, the LDA experiment is conducted to acquire velocity fluctuation signals at different regions. Monitoring points in the intense RSI area between the impeller and the diffuser and the volute spiral and diffusion sections are analyzed. The time and frequency domain analysis methods are used to investigate the complex velocity signals for the pump under different working conditions. The discrete components in the velocity spectrum and RMS* values are combined to clarify and illustrate the velocity pulsation characteristics with respect to the effects of measuring point and flow rate on velocity pulsation.

2. Experimental Setup of LDA Experiment

2.1. The Investigated Model Pump with a Vaned Diffuser
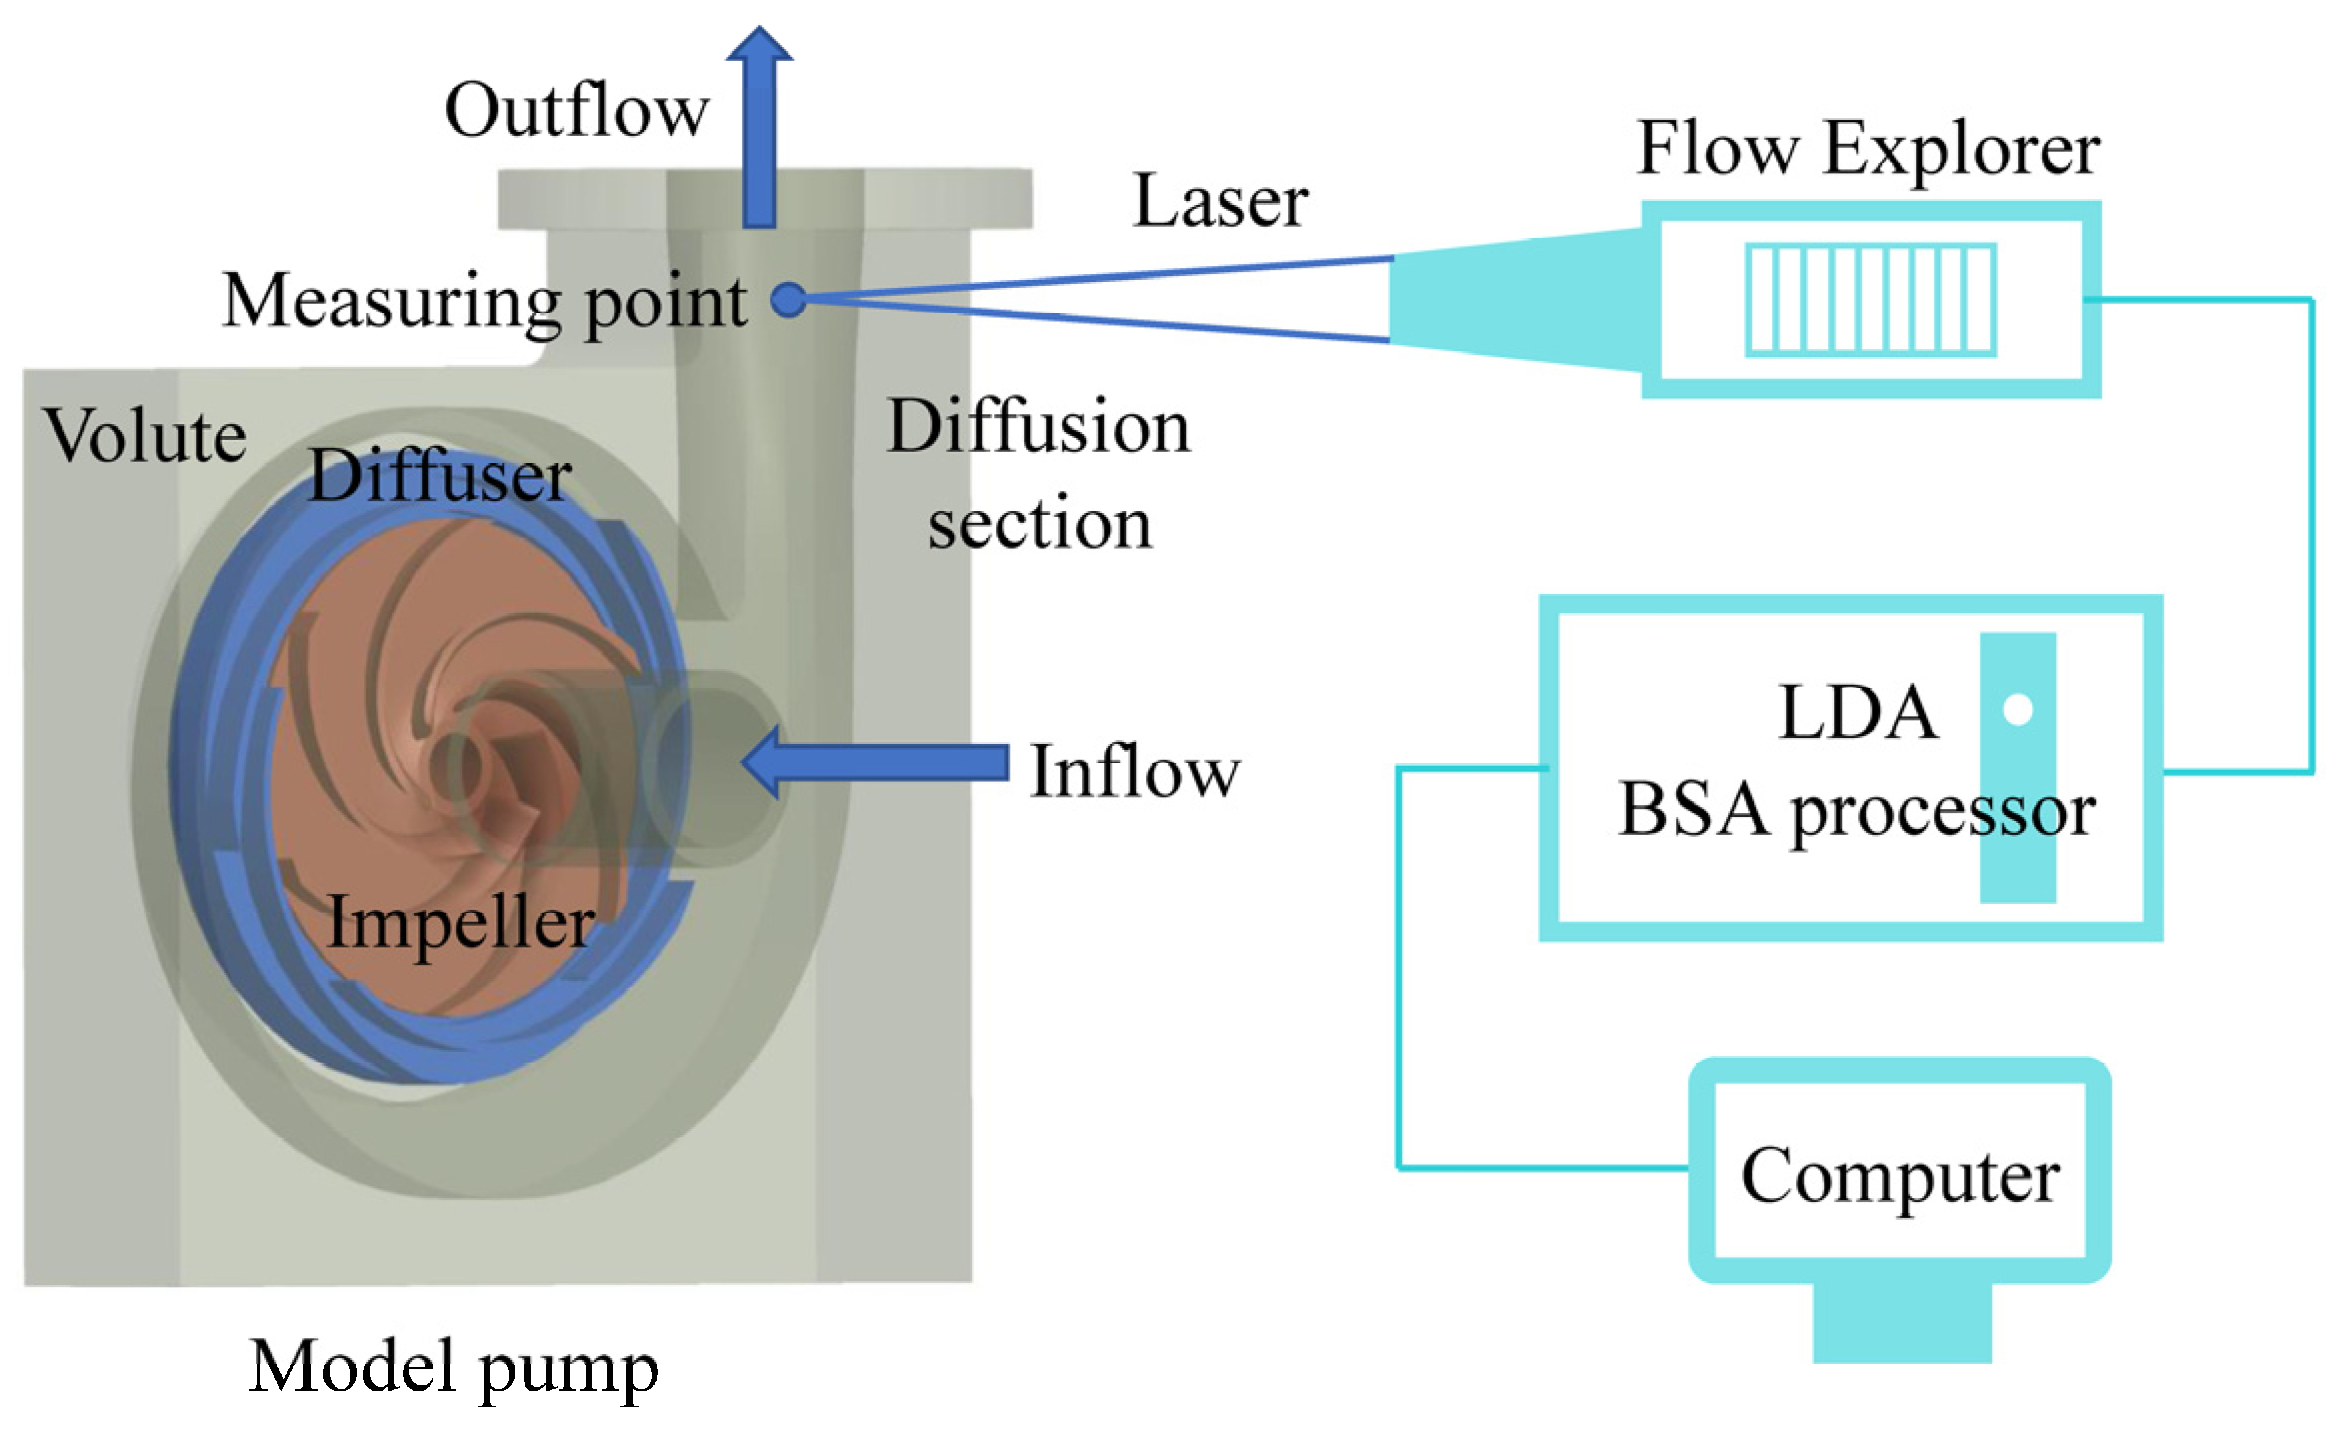
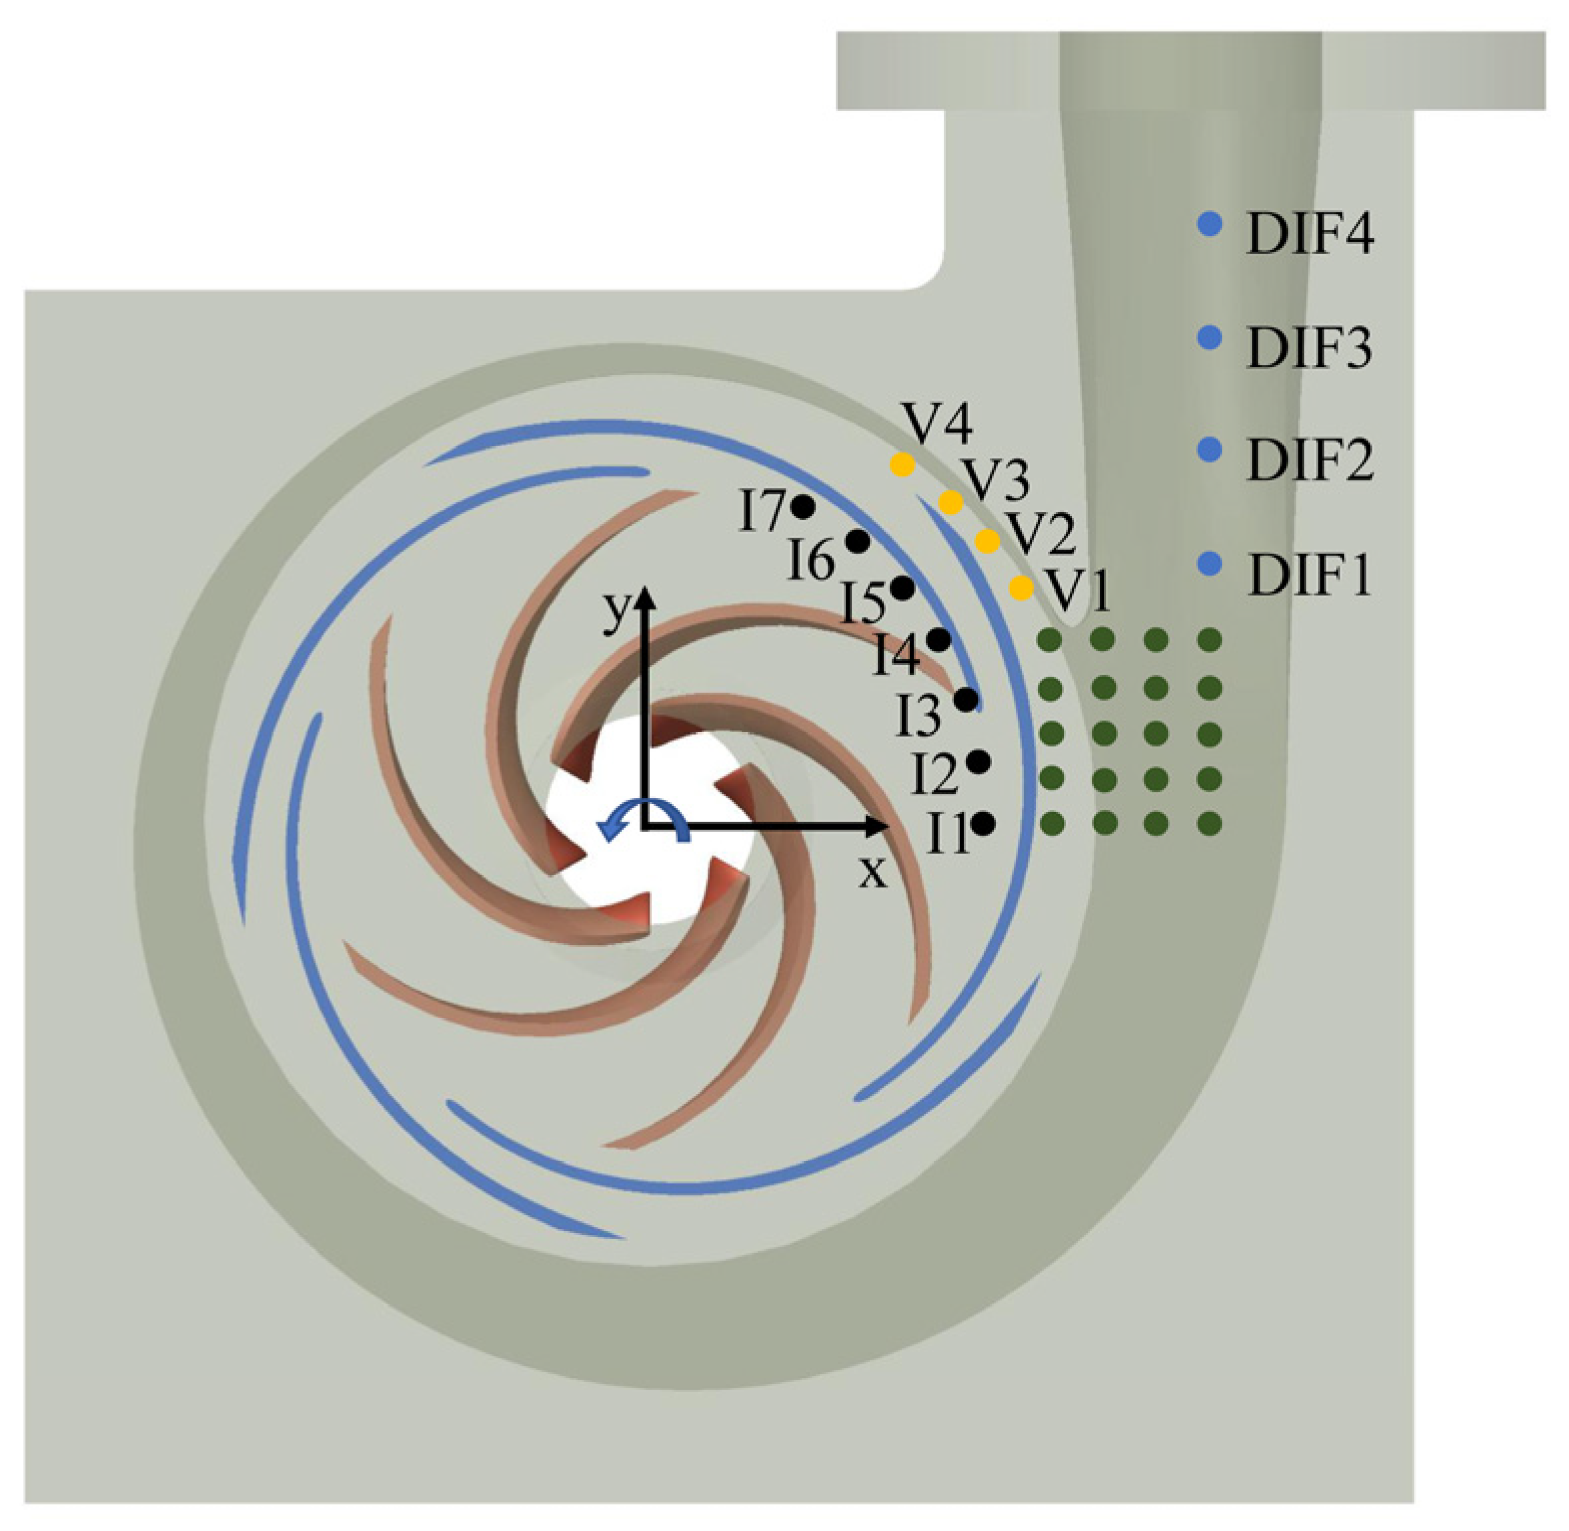
In the current paper, to analyze velocity pulsations induced by the RSI effect, a centrifugal pump with a vaned diffuser is designed for investigation and the corresponding pump geometrical parameters are listed in Table 1. The blade number of the impeller are set as Zr = 6, while the blade number of the diffuser is defined as Zs = 5. The twisted blade shape and 2D cylindrical blade shape are used to generate the impeller and the diffuser. To obtain velocity signals at different working conditions, the LDA measuring technique was applied in this paper. To ensure the emitted laser from the LDA reaches the internal measuring point, the model pump was made with transparent plexiglass. The front chamber of the model pump was designed in the vertical plane without any arc, and it will guarantee the LDA laser entering into the model pump without any obvious refraction. The structure of the transparent tested pump is shown in Figure 1.
The pump performance and LDA experiments were completed on the test rig with two water tanks. The adopted closed test loop meets the requirement of the national standard grade 1, and the measuring uncertainty of the pump head is ±1.5%. The simplified structure of the closed loop is drawn in Figure 2. A detailed description of the experimental platform, including the facilities, the control of the rotating speed, and the flow rate, is given in the previous research [26].

2.2. LDA Setup

In the current research, the 2D A/S LDA system produced by the Dantec dynamics is employed to sample the velocity fluctuation signals under different points at various operating conditions to reveal the transient turbulent flow characteristics. By using the 2D LDA system, velocities along two directions in a plane will be acquired, and it means that the velocity in the axial direction can not be obtained by the current LDA system. As for the centrifugal pump, it is accepted that the velocity usually has a small component along the axial direction, so the emphasis is usually laid on the velocity components in the plane perpendicular to the shaft. For the LDA system, the optical system (FlowExplorer) generates the laser beams to measure the velocity signals, while the signal processing system (BSA) is used to acquire the signals for analysis. The measuring diagram of the LDA system is given in Figure 3.
The FlowExplorer probe integrates the transmitting and receiving modules, and the backscatter signal-receiving mode is adopted for the measuring system. During the experiment, the probe will generate two red laser lights, and the corresponding wavelength is 650 nm. Meanwhile, two laser lights are also transmitted by the probe, which is invisible with a wavelength of 785 nm. The measuring volume with a focal length of 500 mm is generated by the four laser beams. When the tracing particle moves through the measuring volume, the velocity is measured and calculated. The size of the measuring volume is 0.17 mm × 0.17 mm × 2.8 mm for the used LDA system. For the LDA measurements, the tracing particles are essential, which are used to reflect the laser light. Therefore, the tracing particles’ density, size, and flow characteristics are strictly specified according to the LDA measurement. In the experiment, the hollow glass ball is selected as the tracing particle, the diameter is 20 μm, and the density is 1050 kg/m3.
To illustrate velocity pulsations, measuring points are placed within the model pump, mainly in four regions. Region Ⅰ at the outlet of the impeller, seven points named I1–I7 are placed. Region Ⅱ at the downstream at the volute tongue, four points V1–V4, used to obtain velocity signals. Region Ⅲ in the diffuser section, four points DIF1–DIF4 are selected. Besides, twenty points upstream of the tongue are also placed to reconstruct the flow fields by averaging the transient velocity signals at different flow rates, defined as region Ⅳ. Figure 4 shows the measuring points for LDA in different regions within the model pump. During LDA measurements, the traversing frame moves the probe precisely to measure velocity signals at different points, and the displacement resolution is about 1 mm.
During the LDA measurement, the maximum sampling number is set as 100,000, and the sampling time is set as 15 s to obtain adequate data for spectral analysis. The sampling frequency of the velocity signal is 10 kHz, and the effective data rate is controlled to be larger than 90% during the experiment to capture the precise velocity signals. According to the velocity calibration data, the LDA measuring uncertainty is about 0.11%. When the velocity signals are acquired, they are transferred to the BAS processor. The velocity spectrum can be obtained using the FFT method (Fast Fourier Transform), which will be calculated by the power spectral density algorithm [27].

3. Results and Discussions

3.1. Performance of the Model Pump

Flow rate and head are dimensionless treated using the equations [28].
Φ N = Q d u 2 R 2 2
Ψ N = g H d u 2 2
The pump performance is presented in Figure 5. As noted by the pump head, with the flow rate increasing, the head shows a decreasing trend. The pump head is H = 19.5 m at the rated flow rate, 2.5% lower than the design value. The hump phenomenon of the pump head does not occur for the model pump due to the small blade exit angle used for the blade [26]. From the efficiency curve, it is evident that the highest efficiency point is located around the 1.2ΦN. The centrifugal pump often operates within the range of 0.8~1.2ΦN. So, to obtain the velocity pulsations, velocity signals will be measured and analyzed at four working conditions, 0.6ΦN, 0.8ΦN, 1.0ΦN, 1.2ΦN, by the LDA system.

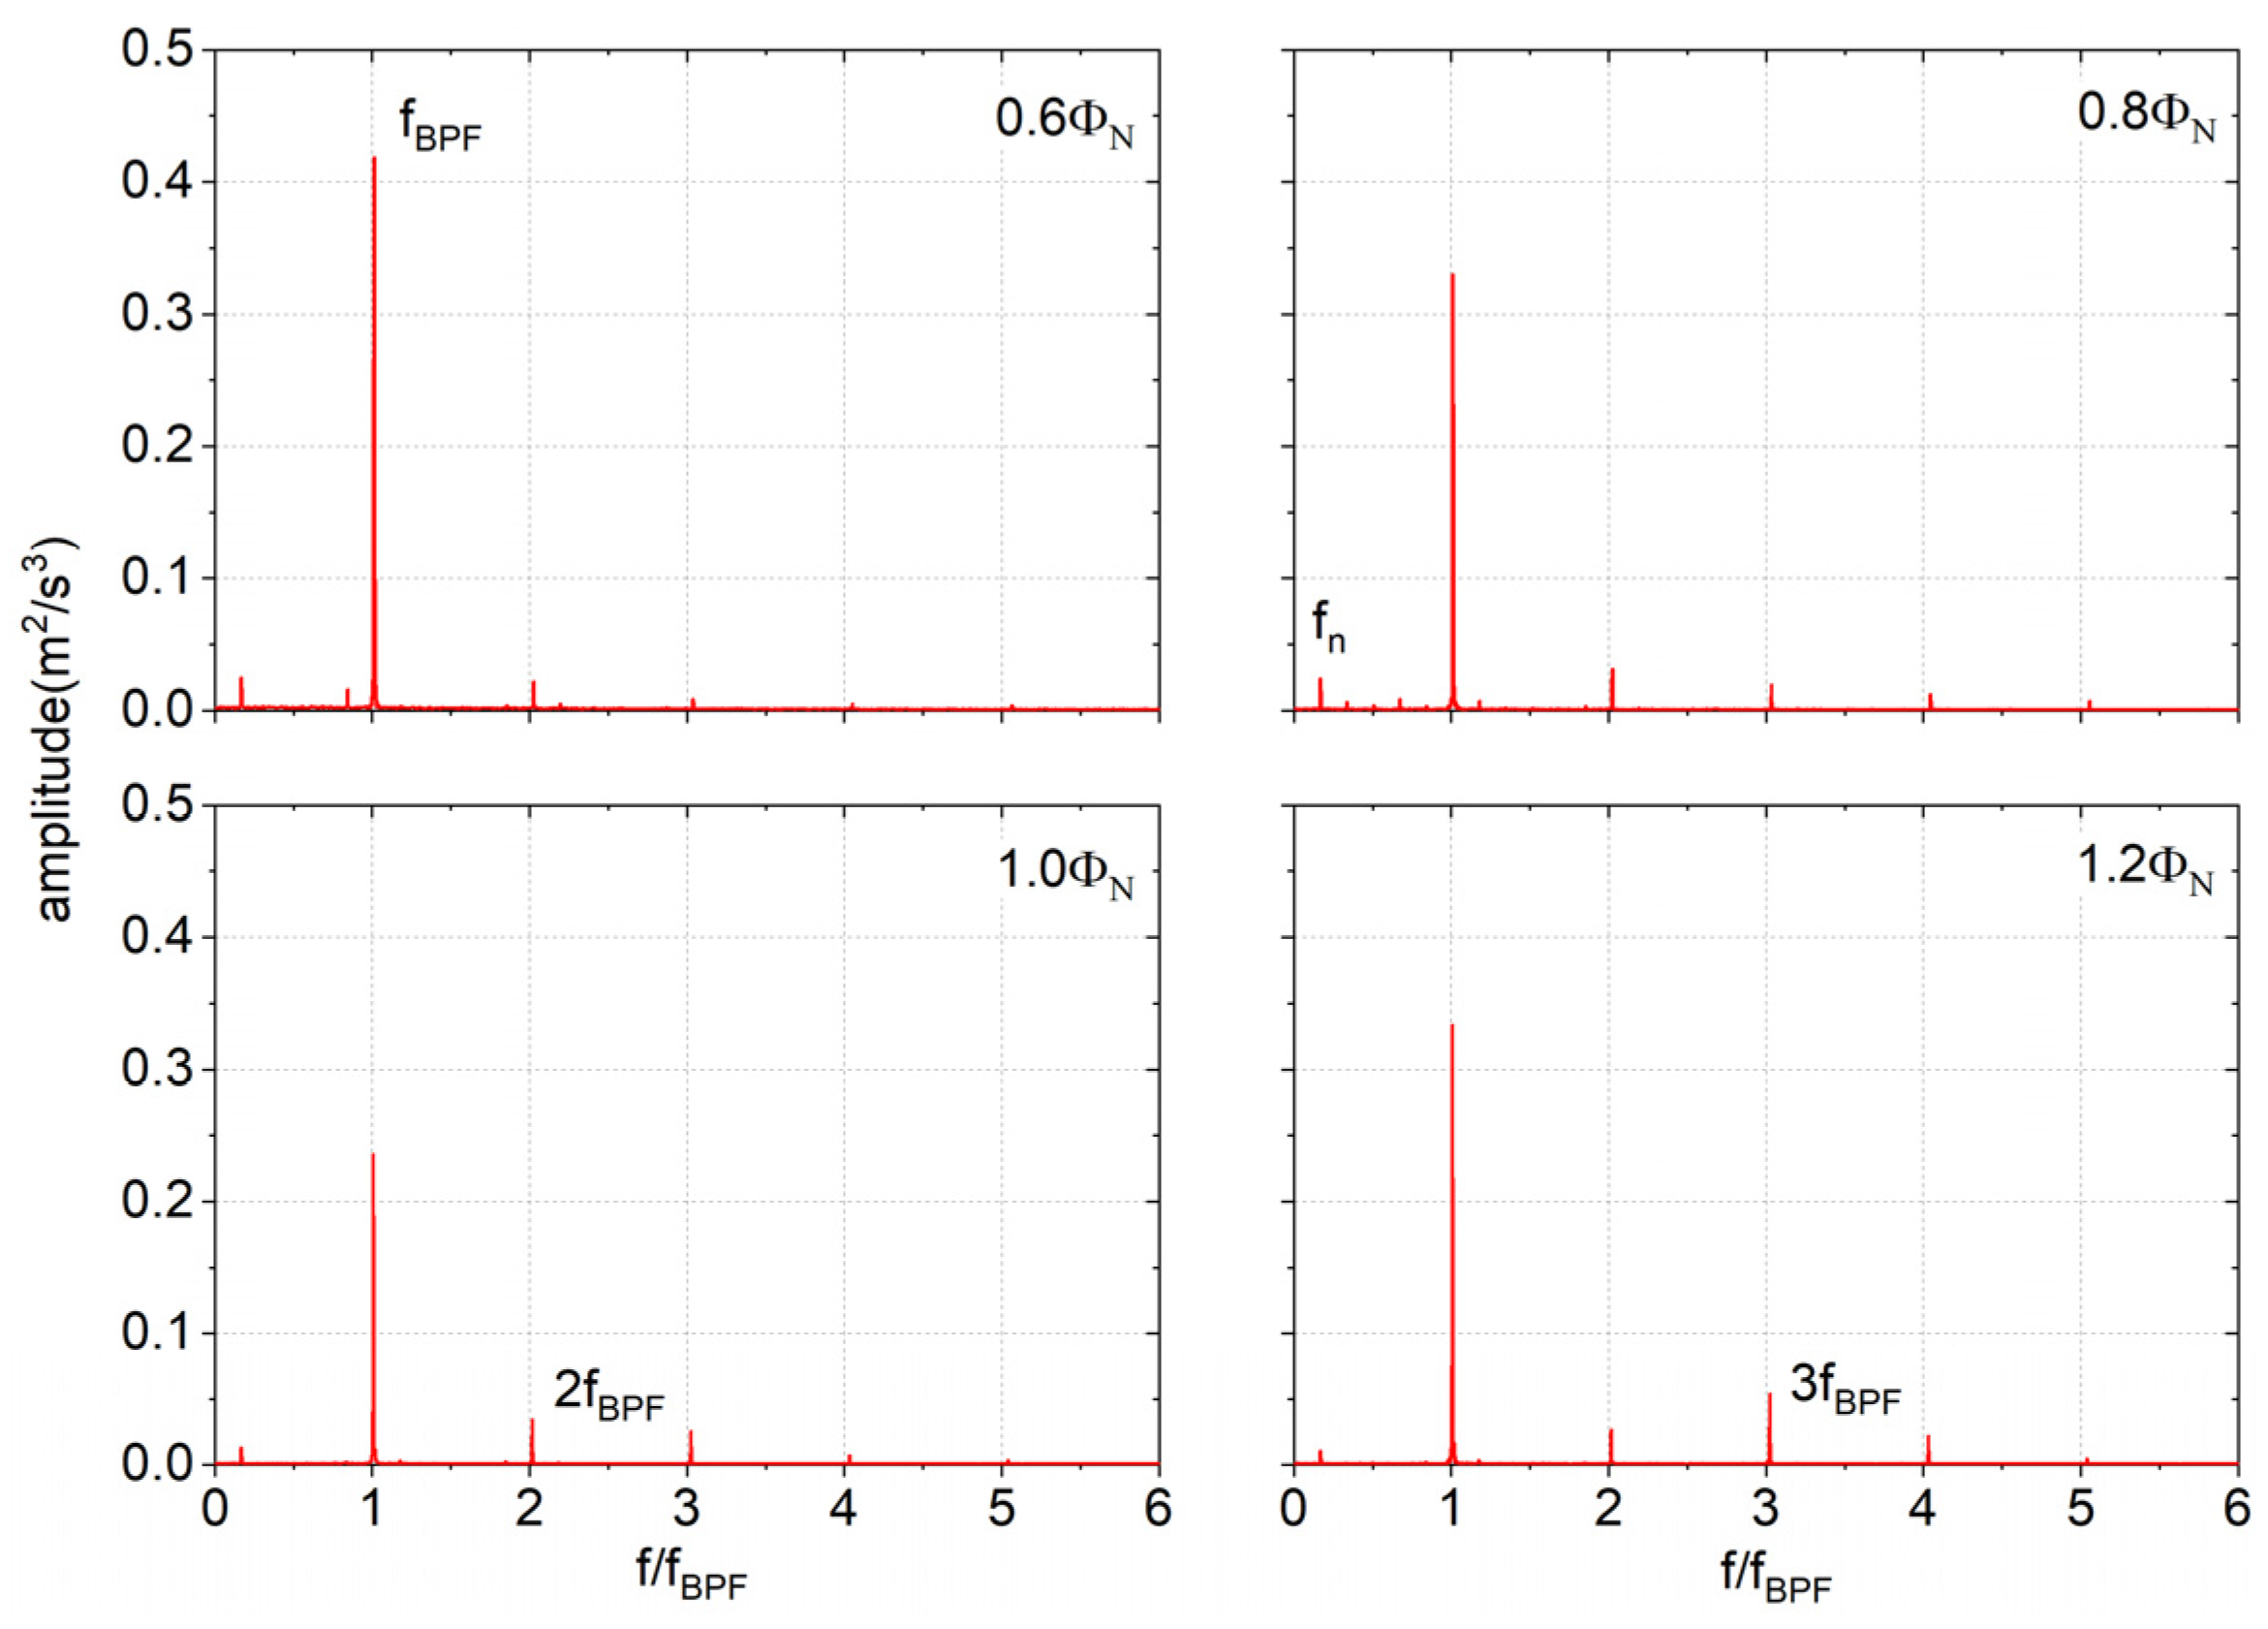
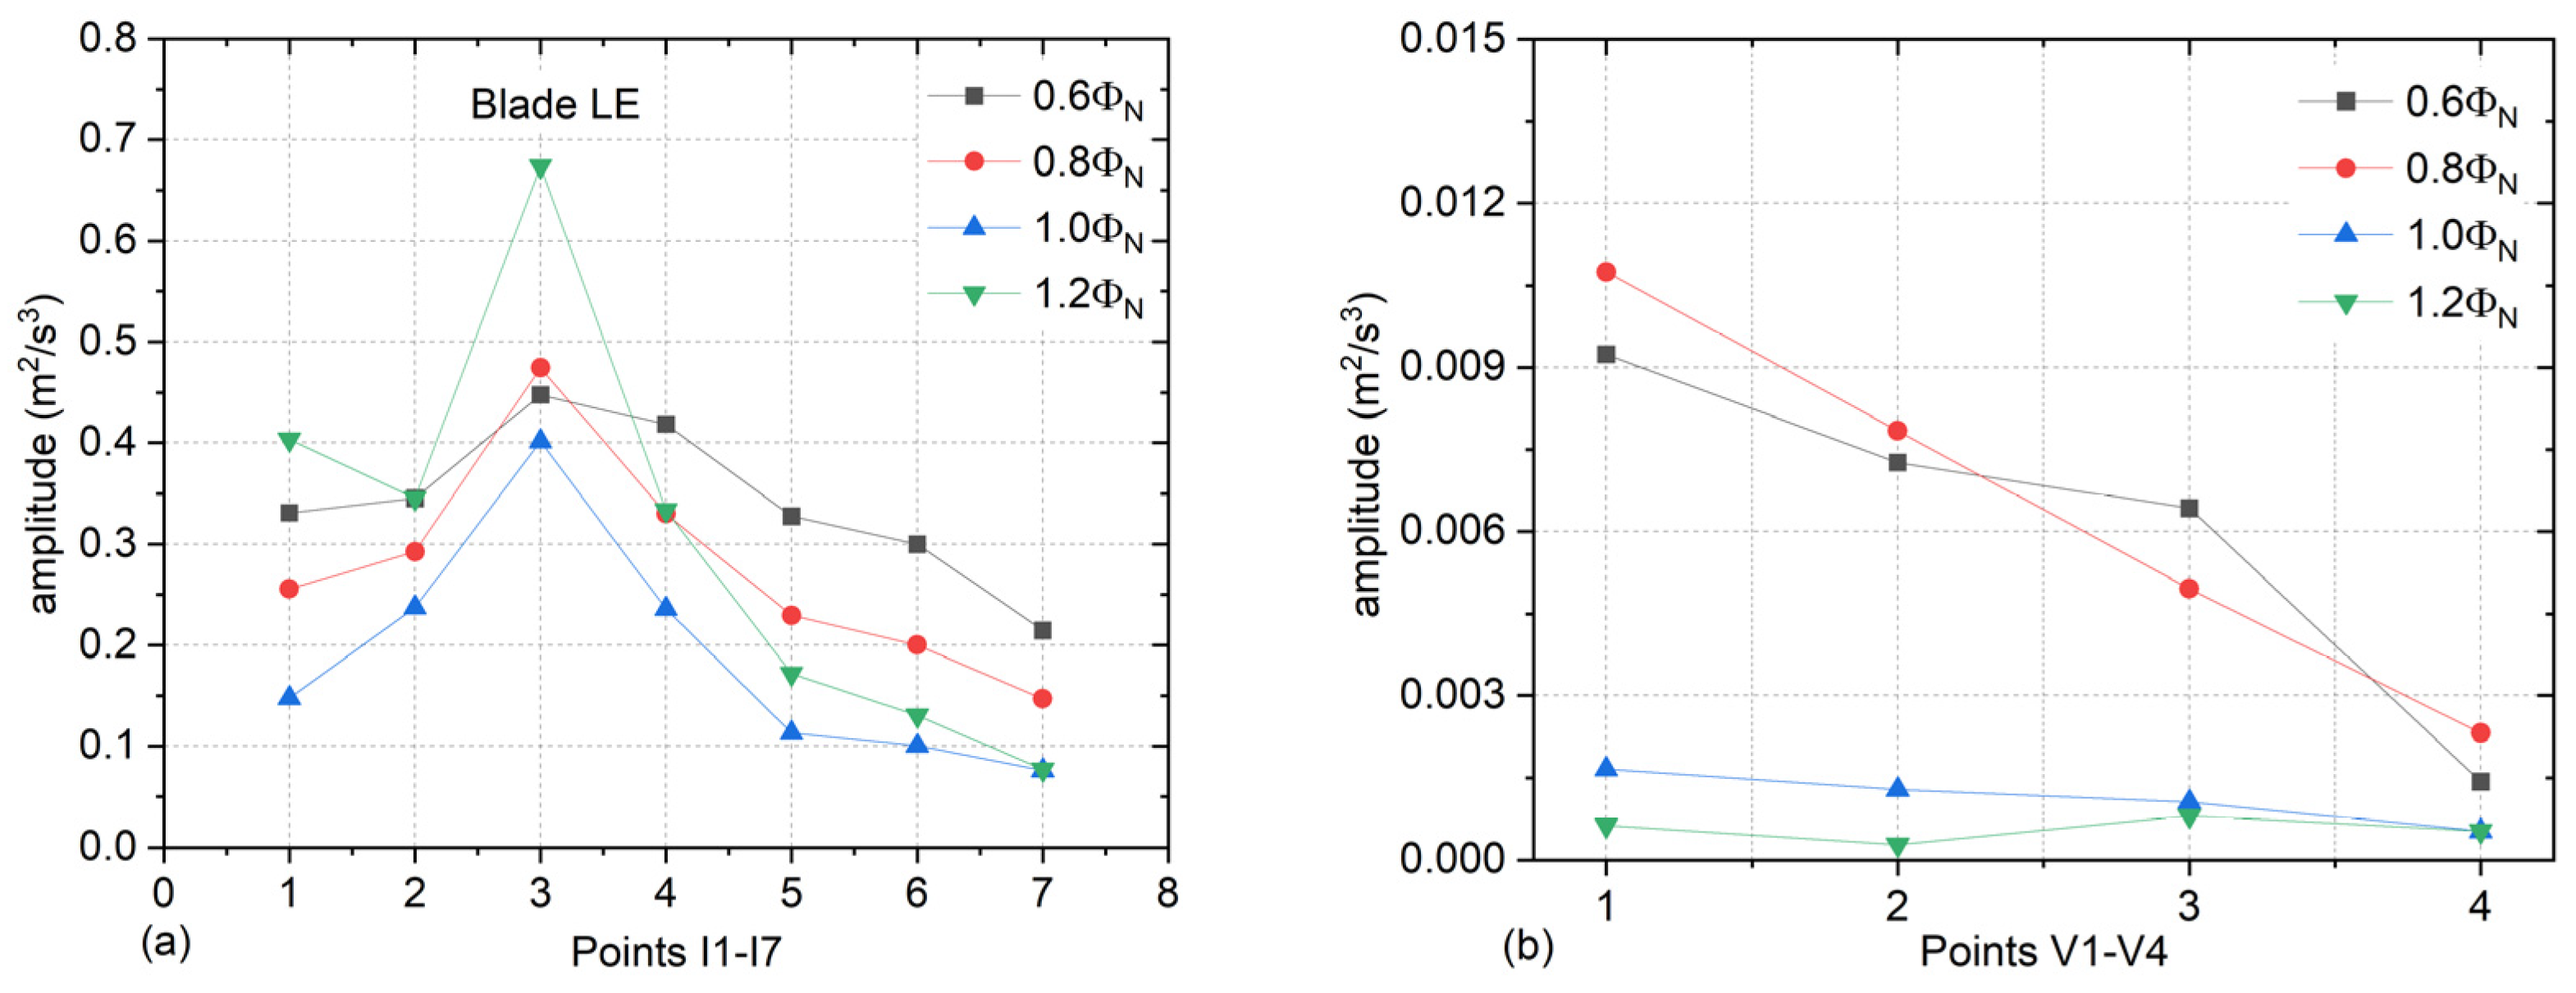
3.2. Velocity Fluctuations within the Model Pump

In this section, velocity fluctuations will be analyzed both for time domain signals and the velocity frequency spectrum. Equation (3) is applied to obtain the dimensionless velocity v*.
v * = v u 2
Figure 6 shows velocity pulsating signals at point I4 located at the impeller exit for the pump under four typical working conditions. Here, the velocity component along the y direction (as seen in Figure 4) is analyzed. As for the centrifugal pump, due to the RSI effect induced by the impeller periodically sweeping the diffuser blade, a high turbulent flow will be generated, as manifested by velocity pulsating signals. As observed in Figure 6, velocity signals pulsate intensely. The rotating cycle of the impeller is about T = 41.4 ms. During one impeller rotating cycle, peak and valley are observed for velocity signal due to the RSI effect. Taking the rated flow rate, for instance, the averaged velocity is v* = 0.602, and the mean pulsation amplitude of the obtained velocity signals can reach 8.9%. As accepted by the researchers, the turbulent intensity will be increased at the off-design flow rate, which is caused by the flow separation at a low flow rate and a stronger RSI effect under high working conditions. It is obtained that the pulsation amplitude at 0.6ΦN, 0.8ΦN, 1.2ΦN reaches 13.0%, 10.1%, and 10%, respectively, compared to the nominal flow rate, which validates the increase of turbulent intensity caused by the deterioration of the flow field within the pump.
For the centrifugal pump, the impeller rotating frequency is calculated using Equation (4).
f n = n 60
The resulting blade passing frequency due to the blade sweeping the diffuser blade is calculated by Equation (5).
f B P F = f n × Z r
The shaft rotating speed of the pump is 1450 r/min leading to fn = 24.2 Hz and fBPF = 145 Hz. For the impeller/diffuser matched pump, the main peak in the velocity spectrum caused by the strong RSI can be predicted by Equation (6) from the theoretical analysis. In Equation (6), usually at the small diametric mode m, a significant frequency will be generated in the spectrum. Here, for Zr = 6 and Zs = 5, when a = 1 and b = 1 are given, m = 1 is expected. Namely, the frequency f = 1 × Zr × fn = fBPF will be excited in the velocity spectrum, and the highest velocity amplitude will be generated at the component fBPF.
a Z r ± m = b Z s
where a, b and m are integers.
To clarify the velocity spectrum of the model pump by using the power spectral density algorithm, Figure 7 shows velocity spectra at point I4 at four flow rates. From Figure 7, by using the LDA system, the perfect velocity spectrum is obtained, and in the spectrum, only some discrete components are captured. The other broadband signals are not generated within the spectrum. In the velocity spectrum, it is observed that the dominant component is characterized by the blade passing frequency fBPF for the pump running at each flow rate, which is consistent with the theoretical analysis as predicted by Equation (6). Meanwhile, the higher harmonics of fBPF, 2fBPF, 3fBPF, and even 4fBPF can also be identified in the velocity spectrum. The corresponding amplitude at the higher harmonic of fBPF is much smaller than the fBPF. It means that the main velocity pulsation energy is distributed at fBPF. As discussed in Figure 6, velocity pulsations show an evident difference at various flow rates, which is more intense at off-design working conditions. Such a conclusion is also validated in Figure 7. The comparison shows that velocity amplitude at the fBPF maintains a minimum at the design working condition. At 0.6ΦN, the increment reaches 80% compared with the rated flow rate, while reaching about 40% at 0.8ΦN and 1.2ΦN. In the velocity spectrum, the impeller rotating frequency fn can also be captured due to the slight unbalance of the pump shaft system, but the resulting amplitude is quite lower than the peak at fBPF.
In Figure 7, point I4 located between the vaned diffuser and the rotating impeller, intense velocity pulsations are excited due to the RSI effect as manifested by the high amplitude at the fBPF. To clarify velocity pulsations at the other regions within the model pump, Figure 8 further presents velocity spectra at point V3 downstream of the volute tongue and DIF1 within the diffusion section. Figure 8a shows that the blade passing frequency fBPF is also generated in the velocity frequency spectrum under the rated flow rate. Compared with Figure 7, it is evident that the amplitude at fBPF of point V3 is pretty smaller than that at point I4, and the reduction is more than 90%. It indicates that the RSI effect is attenuated significantly for the measuring points in the spiral region of the volute. Usually, it is accepted that the turbulent flow is caused by the shedding fluid striking the diffuser blade. Using the diffuser, the turbulent flow will be suppressed when the fluid approaches the diffuser downstream. Finally, low turbulent flow is observed within the volute region. For point DIF1 in the diffusion section, only the impeller rotating frequency fn is observed in the velocity spectrum, and the fBPF cannot be captured. However, the amplitude at fn is close to the results in Figure 7. It proves that the RSI effect is sharply weakened for the points in the diffusion section.
Figure 7 and Figure 8 identify an evident discrete peak at the fBPF in the velocity spectrum for the points at the impeller outlet and spiral section of the volute. To illustrate the effect of flow rate and measuring position on the component at fBPF, Figure 9 presents velocity amplitudes at different points. From Figure 9a, for the points, I1–I7 located within the strong RSI region, velocity amplitudes show a minimum at the rated flow rate. This is consistent with the classical theory; the RSI effect is weakest at the rated flow rate. However, for points I1–I7, an interesting phenomenon about velocity amplitude is generated. A local maximum is observed at point I3, located downstream of the diffuser blade. The reason is related to the intensive RSI effect.
Along with the discharged fluid from the impeller striking the diffuser, a high turbulent flow is developed at the blade leading edge region, especially around the area downstream of the blade leading edge. Such a phenomenon is also found for the impeller/volute matched pump, as discussed in the previous work [7]. High turbulent flow is generated at a similar area downstream of the volute tongue. As for the measuring points I4–I7 at the region away from the diffuser blade leading edge, velocity amplitudes decrease obviously. Taking point I7, for instance, the averaged decrement of velocity amplitudes at different flow rates reaches about 60% compared to point I3. From Figure 9b, similar, varying characteristics could be found for points V1–V4. Also, a significant decrease is generated for the measuring points at the area away from the tongue, especially at low working conditions, 0.6ΦN and 0.8ΦN. As observed from Figure 9, a high turbulent flow is generated around the diffuser blade. Also, high velocity fluctuations are induced due to the fluid interacting with the stationary blade and tongue.
Figure 7 and Figure 8 show that for the measuring points in the spiral and diffusion sections, the blade passing frequency is not always dominant in the velocity spectrum. To quantitatively evaluate velocity pulsations at the weak RSI region, the time-domain velocity signals are further analyzed by using the RMS method. The following equations calculate the RMS value of velocity signals [25]. The RMS represents the global pulsation amplitude of the velocity signals. Here, velocity along the y direction is calculated and discussed.
v ¯ = i = 0 N 1 κ i v i
κ i = 1 N
R M S = i = 0 N 1 κ i ( v i v ¯ ) 2
R M S * = R M S u 2
Here, N is the number of velocity samples obtained by the LDA experiments, and vi is the velocity at any moment and v ¯ represents the mean magnitude of all the sampled signals.
Figure 10 shows RMS* values of all the concerned measuring points under different flow rates. For points I1–I7, similar varying trends are observed, as discussed in Figure 9a. The local maximum of RMS* is generated at point I3, and for the points far from the diffuser blade leading edge, RMS* exhibits a decreasing trend. Besides, RMS* reaches a minimum at the rated flow rate for all the measured seven points. For points I1–I7 located in the intense RSI region, major pulsation energy peaks at fBPF. So varying characteristics of RMS* and velocity amplitude at fBPF are similar.
From Figure 10b, for points V1–V4 in the spiral section of the volute, it is evident that for the measuring points at the downstream region of the tongue, RMS* shows a gradually decreasing trend from points V1–V4. The reason is caused by the gradually increasing clearance between the diffuser and the volute casing wall. The gap is enlarged for the point away from the volute, leading to the weaker RSI effect. Finally, the velocity pulsation is attenuated significantly for the point away from the tongue. Comparing points I1–I7, RMS* values of V1–V4 are much smaller. It is also validated that the RSI effect is gradually weakened along with the fluid moving through the diffuser into the volute region [29,30,31].
Figure 10c shows RMS* values within the diffusion section. It is found that from point DIF1 to DIF4, a significant decrease is generated. It demonstrates that for the measuring point towards the volute outlet, velocity pulsations will be reduced. At the concerned working conditions, the RMS* value is increased from 0.6ΦN to 1.2ΦN, which is inconsistent with the result in Figure 10a. The reason is caused by the typical flow distributions within the diffusion section. Usually, the RSI effect is greatly affected by the pump flow rate. As noted in Figure 8b, the RSI effect is very weak for the measuring points within the volute diffusion section. It is characterized by the disappearance of fBPF in the velocity spectrum. It means that the velocity fluctuations in the volute diffusion section are minimally affected by the RSI effect, so it does not show a rapid increase at partial flow rates. Usually, in the diffusion section, a higher turbulent flow will be induced with the velocity increasing, leading to intense velocity pulsations at high flow rates. As discussed in the research, such flow phenomenon is also validated by pressure pulsation measurement [25]. If the flow rate is reduced further, it is inferred that velocity pulsations will be reinforced at extremely low flow rates due to flow separation on a large scale [32,33,34].
The averaged velocity is further used to analyze the absolute velocity distribution of points I1–I7 and DIF1–DIF4, defined in Equation (7). For points, I1–I7, the resultant velocity is used as defined in Equation (11). For the measuring points DIF1–DIF4 in the volute diffusion section, the velocity along the y direction will be discussed. The velocity along the x direction vx is ignored due to the small value.
v ¯ t o t a l * = v ¯ x 2 + v ¯ y 2 u 2
Figure 11 presents the averaged velocity for the measuring points. Usually, the flow field is not uniform for the centrifugal pump at the impeller outlet. Such phenomenon is validated by the LDA measurement, and it is observed that velocity distribution at the impeller outlet region surely exhibits uneven characteristics. Around the diffuser blade leading edge, namely, point I4, a low velocity magnitude is generated, which is caused by the blocking influence of the diffuser blade on the unsteady flow. Taking the rated flow rate, for instance, the difference between the points I2 and I4 reaches about 13%. A similar phenomenon is also found for other flow rates. From Figure 11b, for points in the diffusion section, the cross-section area is enlarged towards the volute outlet, so velocity magnitude is reduced from point DIF1 to DIF4. Besides, with the flow rate increasing, the velocity magnitude in the diffusion section increases gradually, consistent with the theoretical analysis.

3.3. Reconstruction of Velocity Field

From the above analysis, velocity pulsation characteristics are illustrated in detail for measured points in different regions. During the LDA experiments, twenty measuring points are placed at the tongue area, as shown in Figure 4, which are applied to reconstruct the time-averaged velocity field in the typical region. Velocity distribution is obtained for three flow rates, namely, 0.8ΦN, 1.0ΦN and 1.2ΦN, and velocity along the y direction is used for reconstruction of the velocity field.
Here, non-dimensional distance is used to depict the velocity field. From point S1 to point S4, the dimensionless distance is set as x = 1, and from point S1 to point S20, the dimensionless distance is set as y = 1, as presented in Figure 12. Besides, velocities along x = 0.3, x = 0.7, y = 0.1, y = 0.5, and y = 0.9 are extracted to obtain the quantitative velocity magnitudes at different positions.
Figure 13 presents the model pump’s velocity distribution by LDA results at the rated working condition. From Figure 13, a high velocity region between x = 0 and x = 0.5 is generated, stretching to the volute tongue region, as seen in the blue square marked in the figure. The velocity in this typical region is much larger than in the others. Taking y = 0.5, for instance, the difference between the high velocity and low velocity can reach about 100%. The high velocity sheet is caused by the fluid discharged from the diffuser channel. Due to the existence of the diffuser with 5 blades, the fluid will be confined in the blade channels. Finally, a high-velocity region is generated downstream of the diffuser channel. Except for the high velocity region, velocity magnitude in the other area shows little difference, as seen in the results along y = 0.1 and y = 0.5. For the measuring points at the right side of the tongue, the velocity magnitude gradually decreases towards the diffusion section, as seen in the results at x = 0.7, which is caused by the increase of the cross-section area.
Figure 14 shows the velocity field at the volute tongue area under 0.8ΦN. Compared with 1.0ΦN, a significant difference could be observed. The high velocity is also generated, but the corresponding scale and the velocity magnitude are smaller than the rated flow rate. Besides, the significant low velocity region is generated between x = 0 to x = 0.15 and y = 0 to y = 0.6. With the flow rate decreasing, a low velocity region will be formed near the diffuser blade surface. Within the range of x = 0.6 to x = 0.8, the velocity magnitude is also smaller than the rated flow rate due to the reduced flow capacity. From velocity values of x = 0.3 and x = 0.7, it is also found that the velocity difference between the high and low velocity regions can reach beyond 100%.
Figure 15 further presents a reconstruction of velocity distribution at high working condition 1.2ΦN. From the velocity contour, it is evident that the distribution is consistent with 0.8ΦN and 1.0ΦN. A high velocity region is developed, and its scale expands. As noted, the high velocity region extends to x = 0.5, and around the tongue region, the high velocity stretches to x = 0.3. It demonstrates that the fluid speed in the diffuser channel will be increased at the high flow rate, leading to a larger velocity region within the volute downstream of the diffuser channel. Between x = 0.6 and x = 1.0, the uniform velocity distribution is formed. Besides, from a comparison between x = 0.3 and x = 0.7, the velocity magnitude within the high region is much larger than in the lower region, and the difference at some points can reach about 100%.

4. Conclusions

This paper investigates unsteady velocity fluctuations in the centrifugal pump with the vaned diffuser, and the non-intrusive LDA measuring technique is used to acquire velocity pulsation signals. The velocity signals are analyzed in detail by the time and frequency domain spectral analysis. Also, the reconstruction of velocity distribution around the tongue region is conducted using twenty measuring points. The main conclusions are as follows.
Caused by the RSI effect, the velocity spectrum of the point between the impeller and diffuser, namely in the intense RSI region, is characterized by the significant component of the fBPF and its resulting higher harmonics. On the other hand, for the points in the volute spiral section and diffusion section, due to the weakened RSI effect, the component at fBPF does not always dominate the velocity spectrum.
From a comparison of velocity magnitudes at fBPF and RMS* values, it is concluded that the working condition and measuring position surely affect the velocity of pulsation energy. For points I1–I7 in the intense RSI region, velocity pulsation energy is minimized at the rated flow rate. However, the effects are not consistent for the measured points in different regions within the model pump, namely points in the spiral and diffusion sections of the volute, which are caused by the significant reduction of the RSI effect.
The averaged velocity distributions at three flow rates are reconstructed by velocity pulsation signals. It is evident that the high velocity region is developed downstream of the diffuser channel and expands to the volute tongue under three measured working conditions. Significant velocity difference is generated for the point in the high and low-velocity regions.
Turbulent flow in the centrifugal pump is a key research issue due to how it is closely related to the operational stability of the pump. Most studies rely on pressure pulsations using the CFD or experiments to investigate the above-mentioned problem. This research emphasises velocity pulsations obtained by the LDA system to clarify turbulent flow from a velocity pulsation perspective, which is rarely conducted. The velocity spectrum shows that at different flow rates, the spectrum is dominated by the blade passing frequency. Even in off-design working conditions, the RSI effect is still the main reason for high-velocity pulsation. The obtained results are consistent with the results measured by pressure pulsation. So, to improve the pump stability, controlling the RSI effect is a vital problem that should be focused on during the pump design. We believe that the obtained results in this research contribute to a deeper understanding of turbulent flow in the pump, which is also a good substitute for pulsation analysis besides pressure pulsations.

Author Contributions

Investigation, J.J., D.N. and A.A.A.; data curation, D.L.; writing—original draft, N.Z.; writing—review & editing, B.G.; supervision, W.Z. All authors have read and agreed to the published version of the manuscript.

Funding

This work is supported by the Natural Science Foundation of China, No: 51706086, and the Research Foundation of Excellent Young Teachers of Jiangsu University.

Institutional Review Board Statement

This article contains no studies with human participants or animals performed by any authors.

Informed Consent Statement

Informed consent was obtained from all individual participants included in the study.

Data Availability Statement

The data are available from the corresponding author upon reasonable request.

Conflicts of Interest

The authors declare no conflict of interest.

Nomenclature

QdRated pump capacity, m3/h
HdRated pump head, m
ndRated rotating speed, r/min
nsSpecific speed
ΦNFlow coefficient
ΨNHead coefficient
ZrImpeller blade number
ZsDiffuser blade number
ηEfficiency
D1Impeller suction diameter, mm
D2Impeller exit diameter, mm
D3Diffuser outlet diameter
D4Volute exit diameter, mm
b2Impeller exit width, mm
b3Diffuser inlet width, mm
ϕWrap angle, °
u2Speed at the impeller exit, m/s
β2Blade exit angle, °
β4Diffuser outlet angle, °
ρWater density, m3/h
fnRotating frequency of the shaft, Hz
fBPFBlade passing frequency of the rotor, Hz
vVelocity magnitude, m/s
v*Non-dimensional velocity
v ¯ Mean velocity magnitude, m/s
RMSRoot mean square of velocity, m/s
RMS*Non-dimensional RMS
LELeading edge
RSIRotor-stator interaction
tMeasuring time, ms

References

  1. Shankar, V.K.A.; Umashankar, S.; Paramasivam, S.; Hanigovszki, N. A comprehensive review on energy efficiency enhancement initiatives in centrifugal pumping system. Appl. Energy 2016, 181, 495–513. [Google Scholar] [CrossRef]
  2. Jiang, W.; Li, G.; Liu, P.F.; Fu, L. Numerical investigation of influence of the clocking effect on the unsteady pressure fluctuations and radial forces in the centrifugal pump with vaned diffuser. Int. Commun. Heat Mass Transf. 2016, 71, 164–171. [Google Scholar] [CrossRef]
  3. Barrio, R.; Fernandez, J.; Blanco, E.; Parrondo, J. Estimation of radial load in centrifugal pumps using computational fluid dynamics. Eur. J. Mech. B Fluids 2011, 30, 316–324. [Google Scholar] [CrossRef]
  4. Posa, A.; Lippolis, A. A LES investigation of off-design performance of a centrifugal pump with variable-geometry diffuser. Int. J. Heat Fluid Flow 2018, 70, 299–314. [Google Scholar] [CrossRef]
  5. Lu, Y.G.; Zhu, R.S.; Wang, X.L.; Wang, Y.; Fu, Q.; Ye, D.X. Study on the complete rotational characteristic of coolant pump in the gas-liquid two-phase operating condition. Ann. Nucl. Energy 2019, 123, 180–189. [Google Scholar]
  6. Long, Y.; An, C.; Zhu, R.S.; Chen, J.P. Research on hydrodynamics of high velocity regions in a water-jet pump based on experimental and numerical calculations at different cavitation conditions. Phys. Fluids 2021, 33, 045124. [Google Scholar] [CrossRef]
  7. Gao, B.; Guo, P.M.; Zhang, N.; Li, Z.; Ni, D. Unsteady Pressure pulsation measurements and analysis of a low specific speed centrifugal pump. ASME J. Fluids Eng. 2017, 139, 071101. [Google Scholar] [CrossRef]
  8. Wang, W.; Pei, J.; Yuan, S.; Yin, T. Experimental investigation on clocking effect of vaned diffuser on performance characteristics and pressure pulsations in a centrifugal pump. Exp. Therm. Fluid Sci. 2018, 90, 286–298. [Google Scholar] [CrossRef]
  9. Ni, D.; Zhang, N.; Gao, B.; Li, Z.; Yang, M.G. Dynamic measurements on unsteady pressure pulsations and flow distributions in a nuclear reactor coolant pump. Energy 2020, 198, 117305. [Google Scholar] [CrossRef]
  10. Yang, S.S.; Liu, H.L.; Kong, F.Y.; Xia, B.; Tan, L.W. Effects of the radial gap between impeller tips and volute tongue influencing the performance and pressure pulsations of pump as turbine. ASME J. Fluids Eng. 2014, 136, 054501. [Google Scholar] [CrossRef]
  11. Zeng, Y.S.; Yao, Z.F.; Wang, F.J.; Xiao, R.F.; He, C.L. Experimental investigation on pressure fluctuation reduction in a double suction centrifugal pump: Influence of impeller stagger and blade geometry. ASME J. Fluids Eng. 2020, 142, 041202. [Google Scholar] [CrossRef]
  12. Gao, B.; Zhang, N.; Li, Z.; Ni, D.; Yang, M.G. Influence of the blade trailing edge profile on the performance and unsteady pressure pulsations in a low specific speed centrifugal pump. ASME J. Fluids Eng. 2016, 138, 051106. [Google Scholar] [CrossRef]
  13. Zhang, J.; Li, G.; Mao, J.; Yuan, S.; Qu, Y.; Jia, J. Numerical investigation of the effects of splitter blade deflection on the pressure pulsation in a low specific speed centrifugal pump. Proc. Inst. Mech. Eng. Part A 2019, 234, 420–432. [Google Scholar] [CrossRef]
  14. Zhang, N.; Yang, M.G.; Gao, B.; Li, Z.; Ni, D. Experimental investigation on unsteady pressure pulsation in a centrifugal pump with special slope volute. ASME J. Fluids Eng. 2015, 137, 061103. [Google Scholar] [CrossRef]
  15. Posa, A.; Lippolis, A.; Balaras, E. Investigation of separation phenomena in a radial pump at reduced flow rate by large-eddy simulation. ASME J. Fluids Eng. 2016, 138, 121101. [Google Scholar] [CrossRef] [Green Version]
  16. Posa, A.; Lippolis, A. Effect of working conditions and diffuser setting angle on pressure fluctuations within a centrifugal pump. Int. J. Heat Fluid Flow 2019, 75, 44–60. [Google Scholar] [CrossRef]
  17. Kye, B.; Park, K.; Choi, H.; Lee, M.; Kim, J.H. Flow characteristics in a volute type centrifugal pump using large eddy simulation. Int. J. Heat Fluid Flow 2018, 72, 52–60. [Google Scholar] [CrossRef]
  18. Zhang, N.; Liu, X.; Gao, B.; Xia, B. DDES analysis of the unsteady wake flow and its evolution of a centrifugal pump. Renew. Energy 2019, 141, 570–582. [Google Scholar] [CrossRef]
  19. Zhang, N.; Jiang, J.; Gao, B.; Liu, X.; Ni, D. Numerical analysis of the vortical structure and its unsteady evolution of a centrifugal pump. Renew. Energy 2020, 155, 748–760. [Google Scholar] [CrossRef]
  20. Keller, J.; Blanco, E.; Barrio, R.; Parrondo, J. PIV measurements of the unsteady flow structures in a volute centrifugal pump at a high flow rate. Exp. Fluids 2014, 55, 1820. [Google Scholar] [CrossRef]
  21. Zhang, N.; Gao, B.; Li, Z.; Ni, D.; Jiang, Q.F. Unsteady flow structure and its evolution in a low specific speed centrifugal pump measured by PIV. Exp. Therm. Fluid Sci. 2018, 97, 133–144. [Google Scholar] [CrossRef]
  22. Feng, J.J.; Benra, F.K.; Dohmen, H.J. Investigation of periodically unsteady flow in a radial pump by CFD simulations and LDV measurements. ASME J. Turbomach. 2011, 133, 011004. [Google Scholar] [CrossRef]
  23. Pedersen, N.; Larsen, P.S.; Jacobsen, C.B. Flow in a centrifugal pump impeller at design and off-design conditions—Part I: Particle image velocimetry (PIV) and laser Doppler velocimetry (LDV) measurements. ASME J. Fluids Eng. 2003, 125, 61–72. [Google Scholar] [CrossRef]
  24. Wuibaut, G.; Bois, G.; Hajem, M.E.; Akhras, A.; Champagne, J.Y. Optical PIV and LDV comparisons of internal flow investigations in SHF impeller. Int. J. Rotating Mach. 2006, 20006, 069521. [Google Scholar] [CrossRef] [Green Version]
  25. Zhang, N.; Zheng, F.K.; Liu, X.K.; Gao, B.; Li, G. Unsteady flow fluctuations in a centrifugal pump measured by laser Doppler anemometry and pressure pulsation. Phys. Fluids 2020, 32, 125108. [Google Scholar] [CrossRef]
  26. Zhang, N.; Gao, B.; Ni, D.; Liu, X. Coherence analysis to detect unsteady rotating stall phenomenon based on pressure pulsation signals of a centrifugal pump. Mech. Syst. Signal Process. 2021, 148, 107161. [Google Scholar] [CrossRef]
  27. Dantec Dynamics. BSA Flow Software Users Guide; Dantec Dynamics: Skovlunde, Denmark, 2019. [Google Scholar]
  28. Zhang, N.; Gao, B.; Xia, B.; Jiang, Q.F. Effect of the volute tongue cut on pressure pulsations of a low specific speed centrifugal pump. J. Hydrodyn. 2020, 32, 758–770. [Google Scholar] [CrossRef]
  29. Posa, A. LES investigation on the dependence of the flow through a centrifugal pump on the diffuser geometry. Int. J. Heat Fluid Flow 2021, 87, 108750. [Google Scholar] [CrossRef]
  30. Zhang, F.; Adu-Poku, K.A.; Hu, B.; Appiah, D.; Chen, K. Flow theory in the side chambers of the radial pumps: A review. Phys. Fluids 2020, 33, 041301. [Google Scholar]
  31. Zhang, Z.C.; Chen, H.X.; Yin, J.L.; Ma, Z.; Gu, Q.; Lu, J.Q.; Liu, H. Unsteady flow characteristics in centrifugal pump based on proper orthogonal decomposition method. Phys. Fluids 2021, 33, 075122. [Google Scholar] [CrossRef]
  32. Long, Y.; Lin, B.; Fang, J.; Zhu, R.S.; Fu, Q. Research on the transient hydraulic characteristics of multistage centrifugal pump during start-up process. Front. Energy Res. 2020, 8, 00076. [Google Scholar] [CrossRef]
  33. Li, D.; Zhang, N.; Jiang, J.; Gao, B.; Alubokin, A.A.; Zhou, W.; Shi, J. Numerical investigation on the unsteady vortical structure and pressure pulsations of a centrifugal pump with the vaned diffuser. Int. J. Heat Fluid Flow 2022, 98, 109050. [Google Scholar] [CrossRef]
  34. Zhang, N.; Li, D.L.; Gao, B.; Ni, D.; Li, Z. Unsteady pressure pulsations in pumps—A review. Energies 2023, 16, 150. [Google Scholar] [CrossRef]
Figure 1. The transparent model pump was used for investigation.
Energies 16 03223 g001
Figure 2. The experimental loop for the LDA measurement.
Energies 16 03223 g002
Figure 3. LDA experiments of the transparent pump.
Energies 16 03223 g003
Figure 4. Measuring points for LDA in different regions within the model pump.
Energies 16 03223 g004
Figure 5. Performance of the model pump.
Energies 16 03223 g005
Figure 6. Velocity signals at point I4 at four typical working conditions.
Energies 16 03223 g006
Figure 7. Velocity spectra at point I4 under four typical working conditions.
Energies 16 03223 g007
Figure 8. Velocity spectra at points V3 and DIF1 at the rated operation condition, (a) velocity spectrum at point V3 and (b) velocity spectrum at the DIF1.
Energies 16 03223 g008
Figure 9. Velocity amplitude at fBPF of different measuring points under four typical flow rates, (a) velocity amplitudes at points I1–I7 and (b) velocity amplitudes at points V1–V4.
Energies 16 03223 g009
Figure 10. RMS* values for the measuring points by LDA experiments, (a) RMS values at points I1–I7, (b) RMS values at points V1–V4 and (c) RMS values at points DIF1–DIF4.
Energies 16 03223 g010aEnergies 16 03223 g010b
Figure 11. Averaged velocities of the points I1–I7 and DIF1–DIF4 at different flow rates, (a) averaged velocities at points I1–I7 and (b) averaged velocities at points DIF1–DIF4.
Energies 16 03223 g011
Figure 12. Diagram of the twenty measuring points.
Energies 16 03223 g012
Figure 13. Reconstruction of the flow field at the tongue area under the rated flow rate.
Energies 16 03223 g013
Figure 14. Reconstruction of the flow field around the volute tongue region under 0.8ΦN.
Energies 16 03223 g014
Figure 15. Reconstruction of flow field under 1.2ΦN.
Energies 16 03223 g015
Table 1. The model pump parameters.
Parameters Value
Flow rate Qd55 m3/h
Head Hd20 m
Rotation speed nd1450 r/min
Specific speed n s = 3.65 n d Q d / H d 0.75 69
Blade number Zr6
Diffuser blade number Zs5
Impeller suction diameter D180 mm
Impeller exit diameter D2250 mm
Volute exit diameter D4100 mm
Impeller exit angle β225°
Impeller wrap angle ϕ125°
Diffuser inlet width b321 mm
Diffuser outlet diameter D3320 mm
Diffuser outlet angle β417°
Speed at the impeller exit u218.9 m/s
Rotating frequency fn24.2 Hz
Blade passing frequency fBPF145 Hz
Disclaimer/Publisher’s Note: The statements, opinions and data contained in all publications are solely those of the individual author(s) and contributor(s) and not of MDPI and/or the editor(s). MDPI and/or the editor(s) disclaim responsibility for any injury to people or property resulting from any ideas, methods, instructions or products referred to in the content.

