Abstract
Performance decay of direct methanol fuel cells hinders technology competitiveness. The cathode electrochemical surface area loss is known to be a major reason for performance loss and it is mainly affected by cathode potential and dynamics, locally influenced by water and methanol crossover. To mitigate such phenomenon, novel materials and components need to be developed and intensively tested in relevant operating conditions. Thus, the development of representative accelerated stress tests is crucial to reduce the necessary testing time to assess material stability. In the literature, the most diffused accelerated stress tests commonly enhance a specific degradation mechanism, each resulting in limited representativeness of the complex combination and interaction of mechanisms involved during real-life operation. This work proposes a novel accelerated stress test procedure permitting a quantifiable and predictable acceleration of cathode degradation, with the goal of being representative of the real device operation. The results obtained with a 200 h accelerated stress test are validated by comparing both in situ and post mortem measurements with those performed during a 1100 h operational test, demonstrating an acceleration factor equal to 6.25x and confirming the development of consistent cathode degradation.
1. Introduction
Direct methanol fuel cells (DMFCs) are a promising technology for both remote stationary and portable applications, mainly due to the direct use of a high-energy-density liquid fuel. However, the commercialization of this technology is still hindered by some technological issues, among which severe performance degradation is one of the most relevant [1].
The literature proposes several experimental investigations on DMFC degradation, mainly based on post mortem ex situ characterizations of the membrane electrode assemblies (MEAs) before and after a long-term degradation test (LTT) [1,2,3,4,5,6,7,8,9]. In particular, in a preceding work, the authors [10] combined in situ and post mortem analyses to a 1100 h LTT, highlighting the loss of the electrochemical surface area (ECSA) at the cathode as the major reason for performance loss. As reported in [11], in which electrode operating potentials were measured through local hydrogen reference electrodes (RHE), DMFC operating cathode potential is higher compared to that of hydrogen-fed polymer electrolyte membrane fuel cells (PEMFCs), since the sluggish methanol oxidation reaction taking place at the anode electrode [12] forces operation at a lower current density. This enhances potential-dependent degradation mechanisms, such as platinum dissolution and Ostwald’s ripening [1], known as the major degradation mechanisms in PEMFC [13] technologies.
In order to mitigate such phenomena, novel materials and components need to be developed and intensively tested in relevant operating conditions [14,15,16] and therefore the development of representative accelerated stress tests (ASTs) is crucial to reduce the required testing time. Typically, AST protocols are developed to enhance under specific operating conditions one single degradation mechanism at a time [17,18] (e.g., catalyst dissolution and/or agglomeration, membrane degradation, etc.), rather than replicating the complex interaction between several physical phenomena occurring during device operation. Hence, they are useful to assess the stability of single MEA components but limited in representativity and quantifiability of real-life degradation.
In the literature, a few research laboratories and industries worldwide have already started to develop and harmonize AST protocols for PEMFC that are representative of a real-life operation for different applications such as automotive, stationary, or portable [19,20,21]. Validation of such AST protocols is normally supported by both in situ and ex situ characterizations to compare performance decay and degradation mechanisms between AST and LTT. Instead, for DMFC technology, limited effort has been dedicated to the development of AST protocols [22]. Very recently, in [23], Wan discussed the effectiveness of a novel DMFC AST protocol involving high temperature, high current density, and dry–wet cycles to resemble real-life operating conditions, and obtained an accelerated degradation mostly addressing cathode ECSA loss. Accelerated degradation of Pt catalysts was mainly attributed to DMFC water and methanol crossover fluxes toward the cathode, highlighting the importance of their effect on a DMFC cathode operation. However, the work, still testifying the literature’s actual interest toward the development of representative AST protocols for DMFC, did not validate the AST results with a corresponding LTT.
This work proposes the development and validation of an AST procedure for DMFC cathode degradation, which has been highlighted as the main degradation mechanism occurring during a real operation [1,10]. The representativeness of the proposed AST is demonstrated by comparing both in situ and ex situ measurements obtained during a real-life LTT.
As known from the literature [19,20,24], load cycles are the most investigated candidate tools in PEMFC for the development of cathode real-life ASTs, which are usually composed of a sequence of periods at high and low cathode potential. However, some peculiarities of DMFC technology make the estimation of cathode potential more complex:
- In contrast to hydrogen-fed PEMFC, which generally presents negligible anode overpotential, DMFC has a significant anode overpotential already at low current density [25,26]. This leads to an unknown cathode potential during fuel cell operation and particularly during load cycling.
- Temporary degradation is a recoverable performance loss usually mitigated by adopting discontinuous operational protocols: while PEMFC presents limited temporary degradation effects, in DMFC, it contributes significantly to both anode and cathode voltage loss [11,26,27]. This further complicates the evaluation of DMFC’s actual operating cathode potential during operation and, therefore, needs to be minimized for the development of reliable cathode potential cycles. Bae et al. [22] already proposed the continuous DMFC operation as an AST, but the effect of temporary degradation was not distinguished from the permanent one, limiting the reliability of the results.
- During nominal operation, the DMFC cathode is subject to water and methanol crossover fluxes, which affects local oxygen consumption and concentration and leads to high-RH and water content operation, and enhances catalyst dissolution [28,29].
Therefore, the development of a representative AST needs to take into account the issues related to the estimation of cathode potential from the cell voltage and the complex effects induced by water and methanol crossover [1] fluxes, further complicated by a non-negligible temporary degradation.
2. Experimental Methodology
2.1. DMFC Samples and Operating Conditions
A detailed description of the experimental setup and methodology used for DMFC degradation tests is reported in [10,27]. The DMFC MEAs were commercial 25 cm2 manufactured by IRD Fuel Cell A/S: membrane was Nafion® 115, anode catalyst loading was 1.8 mg cm−2 (Pt-Ru), and cathode catalyst loading was 1.2 mg cm−2 (Pt). Both anode and cathode diffusion layers were Sigracet® SGL35DC: thickness 325 µm, 20% PTFE content, with microporous layer (MPL).
Nominal current density and cell temperature were 0.25 A cm−2 and 75 °C, respectively. Anode and cathode were fed with 1M methanol solution and saturated air at ambient temperature, respectively. The resulting stoichiometry at 0.25 A cm−2 was 6 at the anode and 3 at the cathode. Triple serpentine graphite distributors were used in a co-flow orientation.
Prior to the operation (consistently with [10]) all the pristine MEAs are conditioned following a break-in procedure indicated by the manufacturer, consisting of a sequence of galvanostatic steps at gradually increasing current density up to the nominal value (0.25 A cm−2), performed at constant stoichiometries.
2.2. Long-Term Reference Degradation Test
The LTT taken as reference for AST validation was performed and thoroughly discussed in a previous work by the authors [10], as already mentioned. It consisted of 1100 h galvanostatic operation at 0.25 A cm−2, in which operation was discontinuously performed to mitigate temporary degradation effects as commonly performed in DMFC. In particular, operation was interrupted every 20 min by a refresh cycle [10], consisting of a sequence of 30 s of high-potential OCV and 30 s of low-potential cathode air feeding interruption. Moreover, interruption for diagnostics was performed about every 100 h to periodically evaluate and quantify permanent degradation, by means of the same diagnostic techniques adopted in this work and described in Section 2.3.
2.3. Diagnostic Techniques
2.3.1. Cyclic Voltammetry
Cyclic voltammetry (CV) was used to estimate cathode ECSA. Hydrogen (3.5 Nml min−1) and fully humidified nitrogen (0.6 Nl min−1 saturated at 80 °C) were fed to anode and cathode, respectively. Anode is taken as reference and counter electrode, while cathode is taken as the working one; its potential was continuously scanned back and forth between 0.08 and 0.6 V with a scan rate of 25 mV s−1. The cathode ECSA was estimated considering the positive current density peak related to the hydrogen desorption [30]. The estimation was performed assuming that the cathode catalyst is covered by a monolayer of hydrogen with a charge density of 210 μC cm−2.
2.3.2. Polarization Curve
The polarization curve (i-V curve) was evaluated at 9 current density values (0.01, 0.05, 0.1, 0.15, 0.2, 0.25, 0.3, 0.35, 0.4 A cm−2), collected following one-way curves increasing current. Each single measurement point was performed in galvanostatic operation, acquiring voltage value for 600 s, and then elaborating the data as explained in [10]. Polarization curves were performed with reactants at constant flow rates (equal to the nominal feedings as in Section 2.1), in order to ensure the steady-state operation.
2.3.3. Electrochemical Impedance Spectroscopy
Electrochemical impedance spectra (EIS) were performed during the polarization curves at 0.25 A cm−2, using a Potentiostat/Galvanostat (Autolab PGSTAT 30) provided with a frequency response analysis (FRA) module [10]. The impedance was measured at 50 frequency values between 10 kHz and 50 mHz with a logarithmic distribution. To provide a trade-off between the linear response in voltage and acceptable measurement quality, the amplitude of the imposed sinusoidal current signal was adjusted to obtain a voltage amplitude lower than 10 mV.
2.3.4. Linear Sweep Voltammetry
Linear sweep voltammetry (LSV) was adopted in this work to quantify membrane short circuit current. During this measurement, hydrogen was supplied to the anode (3.5 Nml min−1), and 80 °C saturated nitrogen was supplied to the cathode (0.6 Nl min−1), as performed for the CV.
The LSV consists of a linear rise of the cathode potential over that of anode, from 0.085 V up to 0.55 V with a speed rate of 1 mV s−1, so that the hydrogen adsorbed on the cathode catalyst is progressively oxidized. Hence, the short circuit current across the membrane was estimated considering the Ohmic law between current and voltage while increasing current.
2.3.5. X-Ray Photoelectron Spectroscopy
The X-ray photoelectron spectroscopy (XPS) measurements were performed using a Thermo Scientific ESCALAB 250 ultra-high vacuum (UHV) facility with a base pressure of 10−9 mbar. As X-ray source, a non-monochromated and non-focused Al/Mg twin-anode (Thermo Scientific XR4, Waltham, MA, USA) was used, operated at 300 W electrical power, in order to obtain statistically reliable information from large surface areas. The used detector is a hemispherical electron energy analyzer operated in a large area mode with an analyzed surface area of 50 mm2.
The concentrations of elements (given in atomic percent, at%) occurring in the studied samples were quantified using sensitivity factors provided by Thermo Scientific and Shirley algorithm for peak background correction.
For sample preparation the MEAs were kept in de-ionized water for several days; after this process, the MEAs could be disassembled by pulling the gas diffusion layer (GDL) off the catalyst layer.
3. AST Development
In this section, the issues related to the estimation of cathode potential from the cell voltage, the presence of not negligible temporary degradation effects at both the anode and cathode, and the importance of maintaining water and methanol fluxes to the cathode are considered simultaneously in order to design a reliable and representative AST for cathode degradation, which is mainly based on cathode potential cycling.
3.1. Analysis of OCV Dynamic
As reported in [12], in OCV, despite the high membrane electric resistance, a small short circuit current passes through the membrane due to the high voltage. The membrane electric resistance is evaluated by means of LSV and is found to be equal to 1.1 kΩ cm2, leading to a short circuit current in OCV of nearly 20 mA.
The OCV behavior in time is reported in Figure 1 [12]: at 0 min, the DMFC is taken in OCV conditions by activating the air supply, while always keeping a constant anode flow rate. Suddenly, the voltage increases quickly and reaches a peak in a few seconds, then it sensibly declines and approaches a stable OCV value after about 5 min [31], which is nearly 0.2 V lower than the initial peak. This initial overshoot behavior is known to be caused by the electrolytic cell operation occurring in a poor oxygen region, which induces anode hydrogen evolution [12,26,27,31,32,33].
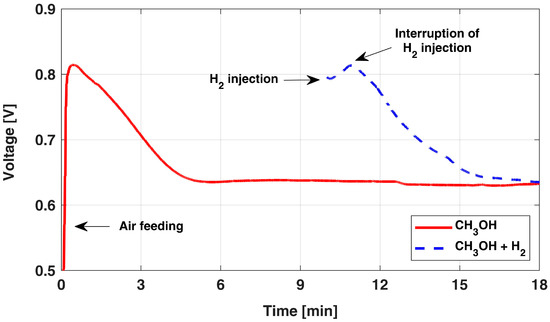
Figure 1.
OCV overshoot behavior after the start of airflow and after H2 injection. The data are adapted from [12] with authors’ permission.
Indeed, the sluggish methanol electro-oxidation leads to an overpotential of around 0.2 V already at currents as low as those due to membrane short circuit (i.e., 20 mA); instead, when hydrogen evolution occurs, its presence at the anode electrode suddenly leads to negligible anode overpotential. Thus, considering the possible hydrogen accumulation at the anode side and the value of the short circuit current, it is reasonable to assume that the anode acts as an internal dynamic reference electrode (DHE) until the OCV voltage starts to decay (in about 1 min). The progressive consumption of the cumulated hydrogen, gradually replaced back by methanol, is thus identified as the reason for this decreasing behavior for the cell voltage during OCV, hindering the estimation of actual cathode potential [12].
A confirmation of this interpretation is obtained by injecting, for a few seconds, hydrogen at the anode side during OCV; the corresponding behavior is reported in Figure 1 (dashed line): a very similar behavior and dynamic are observed. In this condition, both anode and membrane overpotentials are negligible and the measured cell voltage value directly corresponds to the cathode potential.
Therefore, the AST protocol development could benefit from this peculiar OCV behavior to operate the cathode at its maximum potential while being able to measure its actual value, without having to introduce any local reference electrode. Moreover, as reported and measured in previous publications by the authors [11,12], the cathode potential during OCV is slightly higher compared to the one during a nominal DMFC galvanostatic operation. For this reason, adopting the OCV condition in the development of a representative AST protocol should result in a consistent acceleration of cathode degradation mechanisms compared to the LTT.
3.2. Analysis of DMFC Temporary Degradation
As already discussed, the DMFC operation is conventionally performed discontinuously in order to mitigate temporary degradation both at the anode and cathode electrodes. In particular, during the reference LTT [10], a refresh cycle, composed of a sequence of 30 s of OCV and 30 s of air feeding interruption periods, was adopted every 20 min of operation. This led to a significant and systematic recovery of the cell voltage when restarting the operation after the refresh cycle.
Anode degradation has been demonstrated [25,26,27] to have a relevant temporary contribution mainly related to CO2 accumulation in porous media, but a discontinuous operation adopting OCV interruption leads to drastically limiting its effect on voltage loss. In [25,26,27], it is shown that the duration of the OCV period strongly affects temporary degradation: the longer the OCV period, the lower the temporary voltage loss.
Afterward, air-feeding interruptions determine a cell voltage drop to values lower than 0.2 V [11,27] due to oxygen consumption at the cathode electrode, promoted by the oxidation of methanol crossover. A cathode potential below 0.5 V vs. RHE is known to significantly enhance the reduction of Pt oxides, which are generated during a high-potential operation [27,34]. This layer of oxidized platinum, despite being detrimental to ORR reaction catalysis, is suspected to have a protective effect on Pt [35,36,37], showing a higher stability to dissolution compared to the reduced Pt form. However, it is worthwhile to consider that in [11], it has been shown with local RHE measurements that during a 30 s air interruption period of the refresh cycle adopted in LTT, cathode potential does not always lead to values lower than 0.5 V vs. RHE; hence, to promote Pt oxides’ complete reduction, the duration of the air-break period should be properly increased.
Thus, the AST protocol should limit cathode surface oxidation by means of an extended air-break period, while promoting cathode ECSA loss by means of high-potential OCV periods, reproducing the voltage sweep continuously occurring during a DMFC operation while ensuring representative water and methanol fluxes.
3.3. AST Protocol Development
The development of an AST able to representatively enhance cathode ECSA loss in relevant conditions with respect to a real operation is hereby described, depicting an exemplificatory single AST cycle in Figure 2.
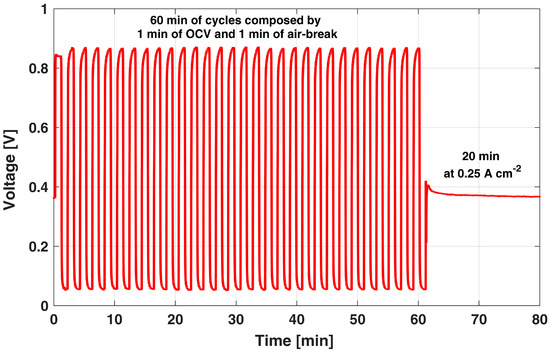
Figure 2.
Sample of the OCV and air-break cycles used as AST.
It is composed of alternating periods of high and low cathode potential. Considering the analyses of Section 3.1 and Section 3.2, an extended duration of both the OCV and air-break period is suggested to (i) effectively keep cathode potential at high values, while eliminating anode overpotential and limiting anode temporary degradation and (ii) remove the protective Pt oxide layer formed during the high cathode potential operation. After a sensitivity analysis, here not reported for the sake of brevity, a 1 min duration was identified as a consistent value for both OCV and air-break periods. Indeed, a 1 min high-potential OCV period quickly leads to a cathode potential up to values of 0.87 V, enhancing the dissolution of catalyst particles, while promoting the surface oxidation conflicting reaction. Cathode potential is hence directly measurable since it is indicated directly from the cell voltage, as discussed in Section 3.1, due to spontaneous hydrogen evolution at the anode side. This OCV period is also supported by the observed dynamics during OCV and hydrogen injection tests, which showed that the voltage is almost constant for 1 min, suggesting that the hydrogen cumulated at the anode side is sufficient to keep the anode overpotential to negligible values for this period. Then, a 1 min air-break period lowers the cell voltage to values lower than 0.1 V, during which Pt oxide reduction occurs, as already discussed in Section 3.2, permitting Pt particles to be exposed back again to dissolution in the next high-potential period, by removing any protective effect of surface oxidation.
After 30 of such cycles, i.e., 60 min in Figure 2, a 20 min reference galvanostatic operation at 0.25 A cm−2 is performed in order to periodically monitor the actual DMFC performance degradation from the cell voltage. Thus, if excluding the latter period at 0.25 A cm−2, the DMFC cathode is always cycled from high to low potential values, while the anode is continuously fed with the nominal flow rate. The anode liquid feed ensures water and methanol crossover fluxes consistent with the ones occurring during nominal operation and a continuous potential sweep consistent with real discontinuous operation.
4. Results and Discussion
4.1. In Situ Analysis
Figure 3 reports the voltage decay at 0.25 A cm−2 during the execution of the proposed AST for 200 h (OCV/no-air cycles are not reported for the sake of figure readability). It shows a severe performance drop in the first 80 h of operation, while a slighter decrease is present later on.
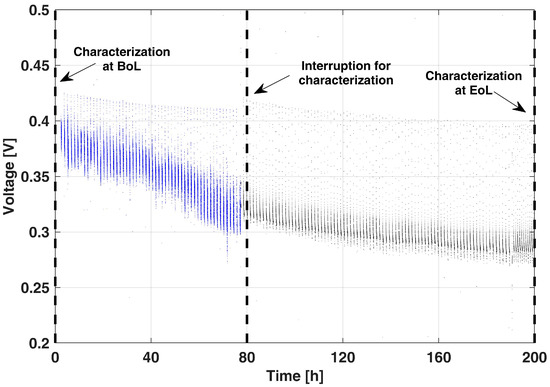
Figure 3.
Voltage decay in the proposed AST during the 0.25 A cm−2 operation period.
The AST was interrupted when the cell operative voltage reached values comparable to those of the End-of-Life (EoL) condition during the reference LTT [10]. It is worthwhile to stress that with the interruptions for diagnostics, performed at 80 h and 200 h, almost no performance recovery is observed, confirming the effectiveness of the AST in limiting DMFC temporary degradation during the actual operation.
To validate the expected impact of the AST operation on cathode ECSA loss, Figure 4A reports the cathode voltammograms periodically acquired along the AST diagnostics: a severe cathode ECSA loss is foreseeable in the sensible reduction of the hydrogen desorption peak, stronger in the first 80 h of operation.
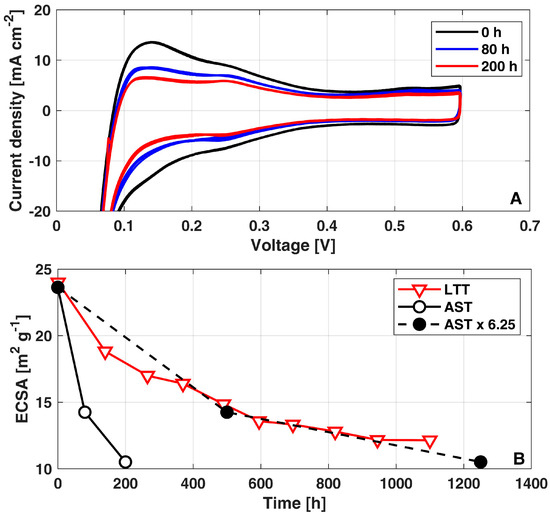
Figure 4.
(A) Voltammograms measured during the AST; (B) Evolution of cathode ECSA loss during AST, AST multiplied by acceleration factor of 6.25x and LTT. The data of LTT have been already reported in [10].
Figure 4B quantifies the corresponding cathode ECSA values (solid black curve): A 50% ECSA loss is reached in just 200 h of operation, confirming the stronger decay occurring during the first 80 h. This trend is consistent with the progressive reduction in the ECSA measured during the LTT (red solid curve) [10], where a cathode ECSA loss of 50% was reached after 1100 h of operation. Interestingly, such consistency between LTT [10] and AST demonstrates a quantitative correspondence when considering for the latter an acceleration factor of x6.25 (black dashed curve) over the testing time. The acceleration factor of AST is calculated by fitting the trend of ECSA loss vs. testing time of the AST (solid black curve in Figure 4) to meet that of LTT (red curve in Figure 4).
Figure 5A reports the i-V curves at the Begin-of-Life (BoL, 0 h) and EoL for both the AST (200 h) and the reference LTT (1100 h) [10]. A sensible similarity is clear between the two tests, confirming that the consistency just discussed between the cathode ECSA loss also leads to a consistent performance loss. The permanent degradation rate can be calculated as the ratio between the voltage difference in i-V curves at BoL and EoL at 0.25 A cm-2 and the test duration between the two i-V curves measurements (200 h). A permanent degradation of 500 μVh−1 is obtained from the polarization curves at 0.25 A cm−2: by comparing this value with the 80 μVh−1 obtained during the reference LTT [10], the degradation accelerating factor equal to 6.25x is consistently confirmed.
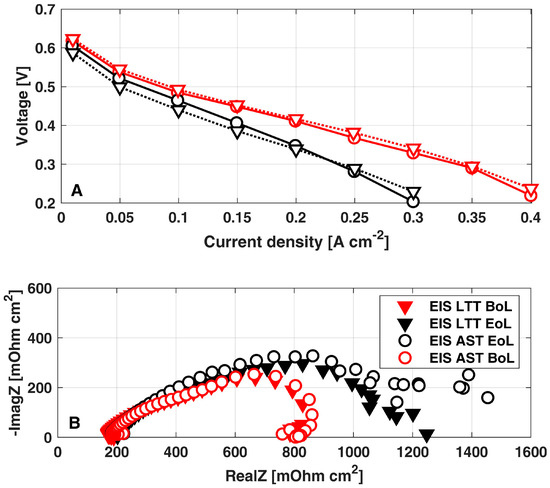
Figure 5.
Comparison between AST and LTT at both BoL and EoL: (A) polarization curves; (B) EIS at 0.25 A cm−2. The data of LTT have been already reported in [10].
Moreover, the comparison between the EIS at 0.25 A cm−2 at BoL and EoL (Figure 5B) confirms the consistency between AST and LTT [10] degradation mechanisms: both the tests comparably determine a minor increase in membrane ionic resistance together with a relevant growth in the impedance feature at low frequency. The latter effect points out the increase in mass transport losses, which are just slightly larger in the EIS of AST: considering that cathode ECSA loss is the main degradation mechanism in both the AST protocol and the LTT [10], it is reasonable to address the increased mass transport losses to the cathode. Coherently with the physical-based impedance analysis reported by the authors in [38], a reduction in the cathode ECSA results in higher oxygen local fluxes at active sites, leading to an increased impedance feature at low frequencies. Hence, EIS analysis further confirms the consistency between performance loss mechanisms enhanced by the proposed AST with respect to those of reference LTT [10].
In addition, LSV measurements, here not reported for the sake of shortness, confirm that the membrane is not subject to significant deterioration during AST, nor during LTT, keeping similar trends to those presented in [10].
In order to finally confirm the consistency between aging mechanisms occurring in AST and LTT operations, post mortem measurements were performed on both the MEAs and compared in the next section.
4.2. Post mortem Surface Analysis
In this section, the XPS analysis of the anode and cathode CL of a pristine MEA (0 h), an activated MEA (i.e., a pristine MEA right after the break-in procedure described in Section 2.1), the LTT-aged MEA (1100 h) [10], and the AST-aged MEA (200 h) is presented. During the LTT reported in [10], Ru dissolution at the anode and crossover to the cathode were highlighted as the major anode degradation mechanisms, mostly happening during cell activation, even though it was concluded that the resulting contribution to overall performance loss was minor. The anode degradation obtained during the AST is not expected to be significantly higher than the one occurring in the LTT, since during the OCV/no-air cycles, the anode remains at very low potential due to hydrogen evolution, limiting Ru dissolution. However, Ru dissolution at the anode and crossover to the cathode can impact cathode CL degradation. For this reason, both anode and cathode CLs were analyzed.
For each of the MEAs, the CL at CL/MPL interface was analyzed. It is known that the obtained XPS signal stems from thickness up to a few nm only; therefore, the following section represents a surface analysis of the samples, i.e., conclusions regarding bulk information (e.g., overall loss of carbon or Pt and Ru concentrations) are not straightforward.
The C1s detailed spectra of the anode and cathode CL are shown in Figure 6. A considerable ionomer content decrease is observed in both anode and cathode CLs of LTT (1100 h aged) [10] and AST (200 h AST) samples, contributing to ionic conductivity and ECSA loss. For comparison, data of an activated MEA is added to show that the observed effects can be attributed to changes due to the DMFC operation and are not dominated by effects due to sample preparation. Generally, the C1s spectra of anodic CL do not exhibit significant differences after LTT and AST. The tiny peak at 280 eV is due to Ru (Ru3d5/2 peak), compared to the supporting information in [39].
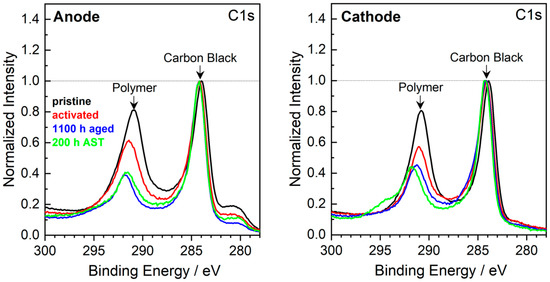
Figure 6.
XPS detailed spectra of the C1s region of pristine, activated, 1100 h aged [10] and 200 h AST MEAs. The spectra are normalized with respect to the intensity of the 284 eV peak.
A slight difference between the AST and the LTT-aged samples can be found in the shoulder at 295 eV detected in the spectra of the cathodic CL; this shoulder is assigned to an electrically charged polymer [40,41]. The charging of polymers in MEA components occurs when the contact with conducting components, here carbon, becomes worse. Hence, during AST, a de-mixing of polymer and carbon black may have occurred, possibly leading to the agglomeration of a large polymer cluster.
In order to address catalyst degradation, the atomic surface concentrations were analyzed using the Ru3p and Pt4f signals. In advance, it is recalled that on the pristine anode, CL Pt (0.6 at%) and Ru (0.4 at%) are observed as catalysts [10]. On the cathode pristine CL, on the other hand, 1.6 at% Pt is observed as the only catalytically active element. After the operation, however, the Ru3p signal is clearly visible and indicates Ru migration from the anode CL to the cathode CL, as shown in Figure 7. The concentrations of surface Ru are in the range ~0.1 at% and exhibit considerable errors due to the low signal-to-noise ratio. The concentration of Ru observed on the anode does not show significant changes upon DMFC operation, in agreement with the literature [39,42].
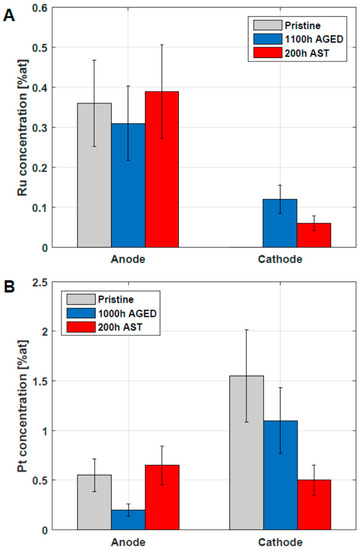
Figure 7.
Verification of Ru (A) and Pt (B) in anode and cathode CL of pristine, 1100 h aged and 200 h AST MEAs. The analysis was carried out using XPS and the concentration is related to total concentration of analyzed elements (Pt, Ru, C, F, O). The uncertainty of the data is around 30% [43].
The occurrence of Pt in the anodic and cathodic CL, verified using XPS, is presented in Figure 7B. The cathodic Pt surface concentrations in the CL are reduced for the 200 h AST and the 1100 h LTT-aged MEA, which can be considered to be in agreement with the ECSA loss reported in Figure 5B. It is important to note that the values reported in Figure 7 are surface concentrations accessible by XPS and should not be mixed up with bulk Pt and Ru concentrations available in the CL.
The post mortem surface analysis of this section highlighted good consistency between the AST and LTT samples, confirming the representativeness of the developed AST protocol.
5. Conclusions
This work discussed the development and application of an AST protocol for DMFC cathode degradation, known as the main cause of DMFC performance loss, able to representatively accelerate aging mechanisms with respect to real-life operation. The developed AST is based on alternating periods of high and low cathode potential, obtained with 1 min OCV and a subsequent 1 min of air break. The OCV/air-break cycles permit the minimization of the contribution of temporary degradation and, thanks to the electrolytic anode operation during the OCV period, make possible the actual cathode potential from cell voltage value to be directly measured.
After 200 h of proposed AST, both (i) in situ and (ii) post mortem experimental results were compared against a 1100 h reference LTT [10], confirming its representativeness toward real operation aging. In particular, (i) both the evolution of i-V curves and EIS of the developed AST quite well resemble those of the reference LTT; an acceleration factor equal to 6.25x is calculated consistently from both the cathode ECSA loss and voltage degradation rate (estimated from i-V curves). Regarding (ii) post mortem surface analysis, good consistency between XPS spectra of both the anode and cathode catalyst layers was highlighted. In particular, the developed AST protocol induced a similar Ru crossover from anode to cathode with respect to the LTT, and comparable Ru concentration at the anode and cathode was measured between the AST and LTT.
Hence, having demonstrated its consistency toward cathode degradation with respect to real-life operations, the proposed AST protocol is foreseen as a valid tool to reduce the testing time of innovative DMFC cathode catalyst layers under real-life conditions.
Author Contributions
Conceptualization, C.R. and M.Z.; Formal analysis, M.Z.; Investigation, C.R., F.B. and P.G.; Data curation, F.B.; Writing—original draft, C.R. and M.Z.; Writing—review & editing, P.G.; Supervision, A.C.; Funding acquisition, A.C. All authors have read and agreed to the published version of the manuscript.
Funding
This work was funded by FCH-JU in the frame of FP7 projects Second Act (EC Grant Agreement n°621216) and Premium Act (EC Grant Agreement 256776).
Data Availability Statement
The data presented in this study are available on request from the corresponding author.
Acknowledgments
The authors acknowledge Giuseppe Fares for his helpful support in the experimental measurements.
Conflicts of Interest
The authors declare no conflict of interest.
References
- Mehmood, A.; Scibioh, M.A.; Prabhuram, J.; An, M.G.; Ha, H.Y. A review on durability issues and restoration techniques in long-term operations of direct methanol fuel cells. J. Power Sources 2015, 297, 224–241. [Google Scholar] [CrossRef]
- Cha, H.C.; Chen, C.Y.; Shiu, J.Y. Investigation on the durability of direct methanol fuel cells. J. Power Sources 2009, 192, 451–456. [Google Scholar] [CrossRef]
- Park, J.-Y.; Scibioh, M.A.; Kim, S.-K.; Kim, H.-J.; Oh, I.-H.; Lee, T.G.; Ha, H.Y. Investigations of performance degradation and mitigation strategies in direct methanol fuel cells. Int. J. Hydrogen Energy 2009, 34, 2043–2051. [Google Scholar] [CrossRef]
- Wongyao, N.; Therdthianwong, A.; Therdthianwong, S.; Kumar, S.M.S.; Scott, K. A comparison of direct methanol fuel cell degradation under different modes of operation. Int. J. Hydrogen Energy 2013, 38, 9464–9473. [Google Scholar] [CrossRef]
- Park, J.Y.; Kim, J.H.; Seo, Y.; Yu, D.J.; Cho, H.; Bae, S.J. Operating temperature dependency on performance degradation of direct methanol fuel cells. Fuel Cells 2012, 12, 426–438. [Google Scholar] [CrossRef]
- Wang, Z.B.; Rivera, H.; Wang, X.P.; Zhang, H.X.; Feng, P.X.; Lewis, E.A.; Smotkin, E.S. Catalyst failure analysis of a direct methanol fuel cell membrane electrode assembly. J. Power Sources 2008, 177, 386–392. [Google Scholar] [CrossRef]
- Sarma, L.S.; Chen, C.H.; Wang, G.R.; Hsueh, K.L.; Huang, C.P.; Sheu, H.S.; Liu, D.G.; Lee, J.F.; Hwang, B.J. Investigations of direct methanol fuel cell (DMFC) fading mechanisms. J. Power Sources 2007, 167, 358–365. [Google Scholar] [CrossRef]
- Park, J.-Y.; Lee, J.-H.; Sauk, J.; Son, I. The operating mode dependence on electrochemical performance degradation of direct methanol fuel cells. Int. J. Hydrogen Energy 2008, 33, 4833–4843. [Google Scholar] [CrossRef]
- Tian, Y.; Sun, G.; Mao, Q.; Wang, S.; Liu, H.; Xin, Q. In situ analysis on water transport in a direct methanol fuel cell durability test. J. Power Sources 2008, 185, 1015–1021. [Google Scholar] [CrossRef]
- Bresciani, F.; Rabissi, C.; Zago, M.; Gazdzicki, P.; Schulze, M.; Guétaz, L.; Escribano, S.; Bonde, J.L.; Marchesi, R.; Casalegno, A. A combined in-situ and post-mortem investigation on local permanent degradation in a direct methanol fuel cell. J. Power Sources 2016, 306, 49–61. [Google Scholar] [CrossRef]
- Rabissi, C.; Brightman, E.; Hinds, G.; Casalegno, A. In operando measurement of localised cathode potential to mitigate DMFC temporary degradation. Int. J. Hydrogen Energy 2018, 43, 9797–9802. [Google Scholar] [CrossRef]
- Zago, M.; Bisello, A.; Baricci, A.; Rabissi, C.; Brightman, E.; Hinds, G.; Casalegno, A. On the actual cathode mixed potential in direct methanol fuel cells. J. Power Sources 2016, 325, 714–722. [Google Scholar] [CrossRef]
- Borup, R.; Meyers, J.; Pivovar, B.; Kim, Y.S.; Mukundan, R.; Garland, N.; Myers, D.; Wilson, M.; Garzon, F.; Wood, D.; et al. Scientific Aspects of Polymer Electrolyte Fuel Cell Durability and Degradation. Chem. Rev. 2007, 107, 3904–3951. [Google Scholar] [CrossRef]
- de Sá, M.H.; Moreira, C.S.; Pinto, A.M.F.R.; Oliveira, V.B. Recent Advances in the Development of Nanocatalysts for Direct Methanol Fuel Cells. Energies 2022, 15, 6335. [Google Scholar] [CrossRef]
- Antolini, E. Pt-Ni and Pt-M-Ni (M = Ru, Sn) anode catalysts for low-temperature acidic direct alcohol fuel cells: A review. Energies 2017, 10, 42. [Google Scholar] [CrossRef]
- Leo, T.J.; Raso, M.A.; Navarro, E.; Mora, E. Long Term Performance Study of a Direct Methanol Fuel Cell Fed with Alcohol Blend. Energies 2013, 6, 282–293. [Google Scholar] [CrossRef]
- Yuan, X.Z.; Li, H.; Zhang, S.; Martin, J.; Wang, H. A review of polymer electrolyte membrane fuel cell durability test protocols. J. Power Sources 2011, 196, 9107–9116. [Google Scholar] [CrossRef]
- Garland, N.; Benjamin, T.; Kopasz, J. DOE Fuel Cell Program: Durability Technical Targets and Testing Protocols. ECS Trans. 2007, 11, 923–931. [Google Scholar] [CrossRef]
- Colombo, E.; Baricci, A.; Bisello, A.; Guetaz, L.; Casalegno, A. PEMFC performance decay during real-world automotive operation: Evincing degradation mechanisms and heterogeneity of ageing. J. Power Sources 2023, 553, 232246. [Google Scholar] [CrossRef]
- Mukundan, R.; Borup, R.L. AST Development in M2FCT (ASTWG and iDWG) Update to 21CTP. 2022. Available online: https://www.osti.gov/biblio/1841890/ (accessed on 30 March 2023).
- ID-FAST (Call H2020-JTI-FCH-2017-1), Grant Agreement No: 779565, ID-FAST—D4.3—Analysis of Coupling between Mechanisms and Definition of Combined ASTs, 2021. Available online: https://www.id-fast.eu/uploads/media/ID-FAST_D4-3_Analysis_of_coupling_between_mechanisms_and_definition_of_combined_ASTs_OK.pdf (accessed on 9 March 2023).
- Bae, S.J.; Kim, S.J.; Park, J.I.; Lee, J.H.; Cho, H.; Park, J.Y. Lifetime prediction through accelerated degradation testing of membrane electrode assemblies in direct methanol fuel cells. Int. J. Hydrogen Energy 2010, 35, 9166–9176. [Google Scholar] [CrossRef]
- Wan, N. Durability study of direct methanol fuel cell under accelerated stress test. J. Power Sources 2023, 556, 232470. [Google Scholar] [CrossRef]
- Bisello, A.; Colombo, E.; Baricci, A.; Rabissi, C.; Guetaz, L.; Gazdzicki, P.; Casalegno, A. Mitigated Start-Up of PEMFC in Real Automotive Conditions: Local Experimental Investigation and Development of a New Accelerated Stress Test Protocol. J. Electrochem. Soc. 2021, 168, 054501. [Google Scholar] [CrossRef]
- Bresciani, F.; Casalegno, A.; Zago, M.; Marchesi, R. A parametric analysis on DMFC anode degradation. Fuel Cells 2014, 14, 386–394. [Google Scholar] [CrossRef]
- Rabissi, C.; Brightman, E.; Hinds, G.; Casalegno, A. In operando investigation of anode overpotential dynamics in direct methanol fuel cells. Int. J. Hydrogen Energy 2016, 41, 18221–18225. [Google Scholar] [CrossRef]
- Bresciani, F.; Rabissi, C.; Casalegno, A.; Zago, M.; Marchesi, R. Experimental investigation on DMFC temporary degradation. Int. J. Hydrogen Energy 2014, 39, 21647–21656. [Google Scholar] [CrossRef]
- Olesen, A.C.; Kær, S.K.; Berning, T. A Multi-Fluid Model for Water and Methanol Transport in a Direct Methanol Fuel Cell. Energies 2022, 15, 6869. [Google Scholar] [CrossRef]
- Casalegno, A.; Bresciani, F.; Zago, M.; Marchesi, R. Experimental investigation of methanol crossover evolution during direct methanol fuel cell degradation tests. J. Power Sources 2014, 249, 103–109. [Google Scholar] [CrossRef]
- Wu, J.; Yuan, X.; Wang, H.; Blanco, M.; Martin, J.; Zhang, J. Diagnostic tools in PEM fuel cell research: Part I Electrochemical techniques. Int. J. Hydrogen Energy 2008, 33, 1735–1746. [Google Scholar] [CrossRef]
- Ye, Q.; Zhao, T.S.; Liu, J.G. Effect of transient hydrogen evolution/oxidation reactions on the OCV of direct methanol fuel cells. Electrochem. Solid-State Lett. 2005, 8, A549–A553. [Google Scholar] [CrossRef]
- Ye, Q.; Zhao, T.S. Electrolytic Hydrogen Evolution in DMFCs Induced by Oxygen Interruptions and Its Effect on Cell Performance. Electrochem. Solid-State Lett. 2005, 8, A211. [Google Scholar] [CrossRef]
- Rabissi, C.; Zago, M.; Grahl-Madsen, L.; Odgaard, M.; Casalegno, A. Local durability optimization of a large-scale direct methanol fuel cell: Catalyst layer tuning for homogeneous operation and in-operando detection of localized hydrogen evolution. J. Power Sources 2021, 506, 230218. [Google Scholar] [CrossRef]
- Eickes, C.; Piela, P.; Davey, J.; Zelenay, P. Recoverable Cathode Performance Loss in Direct Methanol Fuel Cells. J. Electrochem. Soc. 2006, 153, A171. [Google Scholar] [CrossRef]
- Redmond, E.L.; Setzler, B.P.; Alamgir, F.M.; Fuller, T.F. Elucidating the oxide growth mechanism on platinum at the cathode in PEM fuel cells. Phys. Chem. Chem. Phys. 2014, 16, 5301–5311. [Google Scholar] [CrossRef]
- Topalov, A.A.; Cherevko, S.; Zeradjanin, A.R.; Meier, J.C.; Katsounaros, I.; Mayrhofer, K.J.J. Towards a comprehensive understanding of platinum dissolution in acidic media. Chem. Sci. 2014, 5, 631–638. [Google Scholar] [CrossRef]
- Jahnke, T.; Futter, G.A.; Baricci, A.; Rabissi, C.; Casalegno, A. Physical modeling of catalyst degradation in low temperature fuel cells: Platinum oxidation, dissolution, particle growth and platinum band formation. J. Electrochem. Soc. 2020, 167, 013523. [Google Scholar] [CrossRef]
- Baricci, A.; Zago, M.; Casalegno, A. Modelling analysis of heterogeneity of ageing in high temperature polymer electrolyte fuel cells: Insight into the evolution of electrochemical impedance spectra. Electrochim. Acta 2016, 222, 596–607. [Google Scholar] [CrossRef]
- Chung, Y.; Pak, C.; Park, G.S.; Jeon, W.S.; Kim, J.R.; Lee, Y.; Chang, H.; Seung, D. Understanding a degradation mechanism of direct methanol fuel cell using TOF-SIMS and XPS. J. Phys. Chem. C 2008, 112, 313–318. [Google Scholar] [CrossRef]
- Sanchez, D.G.; Ruiu, T.; Biswas, I.; Schulze, M.; Helmly, S.; Friedrich, K.A. Local impact of humidification on degradation in polymer electrolyte fuel cells. J. Power Sources 2017, 352, 42–55. [Google Scholar] [CrossRef]
- Sanchez, D.G.; Ruiu, T.; Biswas, I.; Friedrich, K.A.; Sanchez-Monreal, J.; Vera, M. Effect of the Inlet Gas Humidification on PEMFC Behavior and Current Density Distribution. ECS Trans. 2014, 64, 603–617. [Google Scholar] [CrossRef]
- Park, G.S.; Pak, C.; Chung, Y.S.; Kim, J.R.; Jeon, W.S.; Lee, Y.H.; Kim, K.; Chang, H.; Seung, D. Decomposition of Pt–Ru anode catalysts in direct methanol fuel cells. J. Power Sources 2008, 176, 484–489. [Google Scholar] [CrossRef]
- Gazdzicki, P.; Biswas, I.; Schulze, M. Methodic aspects of XPS depth profiling for investigations of fuel cell components. Surf. Interface Anal. 2014, 46, 350–356. [Google Scholar] [CrossRef]


Disclaimer/Publisher’s Note: The statements, opinions and data contained in all publications are solely those of the individual author(s) and contributor(s) and not of MDPI and/or the editor(s). MDPI and/or the editor(s) disclaim responsibility for any injury to people or property resulting from any ideas, methods, instructions or products referred to in the content. |
© 2023 by the authors. Licensee MDPI, Basel, Switzerland. This article is an open access article distributed under the terms and conditions of the Creative Commons Attribution (CC BY) license (https://creativecommons.org/licenses/by/4.0/).