

Effect of Concrete Mix Composition on Greenhouse Gas Emissions over the Full Life Cycle of a Structure

Abstract
:1. Introduction
2. Materials and Methods
2.1. Specifications of Concretes and Structures under Analysis
- Ordinary concrete of normal strength class—NSC according to [43];
- Self-compacting concrete based on slug cement (CEM III)—SCC 1, fly-ash cement (CEM II)—SCC 2, and Portland cement (CEM I)—SCC 3 according to [43];
- High-performance concrete—HPC according to [43];
- High-performance self-compacting concrete—HPSCC according to [43];
- Concrete with 50% of recycled aggregate—RAC 1 and 100% of recycled aggregate—RAC 2 according to [44];
- Geopolymer concrete—GPC according to [45];
- Lightweight concrete—LC according to [46];
- Fiber-reinforced concrete with steel fibers—FBS 1-3 [47];
- Fiber-reinforced concrete with glass fibers—FSG according to [48];
- Reactive powder concrete—RPC [49].
- I—fcm ≤ 30 MPa;
- II—30 MPa < fcm ≤ 80 MPa;
- III—80 MPa < fcm.

| Ingredients | CF | Concrete [kg/m3] | ||||||||||||||||
|---|---|---|---|---|---|---|---|---|---|---|---|---|---|---|---|---|---|---|
| kgCO2e/kg | Source | NSC | SCC 1 | SCC 2 | SCC 3 | HPC | HPSCC | RAC 1 | RAC 2 | GPC | LC | FBS 1 | FBS 2 | FBS 3 | FSG | RPC | ||
| Cement | CEM I | 0.8890 | [50] | 380 | - | - | 310 | - | - | 335 | 335 | - | 400 | 255 | 330 | 475 | 616 | 905 |
| CEM II | 0.7040 | - | - | 350 | - | 455 | 500 | - | - | - | - | - | - | - | - | - | ||
| CEM III | 0.4820 | - | 370 | - | - | - | - | - | - | - | - | - | - | - | - | - | ||
| GGBS | GGBS | 0.0020 | [50] | - | - | - | - | - | - | - | - | 40 | - | - | - | - | - | - |
| Aggregate | Sand 0–2 mm | 0.0031 | [43] | 580 | 700 | 713 | 700 | 668 | 840 | - | - | 655 | 700 | - | - | - | 1355 | - |
| Sand max. 4.75 mm | 0.0031 | - | - | - | - | - | - | 865 | 865 | - | - | 859 | 790 | 643 | - | - | ||
| Gravel 2–8 mm | 0.0031 | 400 | 468 | 477 | 375 | - | - | - | - | - | - | - | - | - | - | - | ||
| Gravel 8–16 mm | 0.0031 | 860 | 468 | 477 | 375 | - | - | - | - | - | - | - | - | - | - | - | ||
| Quartz Sand | 0.0200 | [56] | - | - | - | - | - | - | - | - | - | - | - | - | - | - | 987 | |
| Crushed limestone | 0.0630 | [50] | - | - | - | - | - | - | 538 | - | - | - | 1069 | 1069 | 1069 | - | - | |
| Basalt 2–8 mm | 0.0064 | [57] | - | - | - | - | 1240 | 990 | - | - | - | - | - | - | - | - | - | |
| Basalt 8–16 mm | 0.0064 | [57] | - | - | - | - | - | - | - | - | 1216 | 608 | - | - | - | - | - | |
| Granite 4–8 mm | 0.0064 | [57] | - | - | - | - | - | - | - | - | - | 267 | - | - | - | - | - | |
| Lightweight expanded clay | 0.1270 | [58] | - | - | - | - | - | - | - | - | - | 67.8 | - | - | - | - | - | |
| Concrete waste | 0.0047 | [59] | - | - | - | - | - | - | 490 | 980 | - | - | - | - | - | - | - | |
| Water | Water | 0.0006 | [43] | 190 | 170 | 161 | 200 | 160 | 160 | 182 | 182 | 8 | 110.4 | 180 | 180 | 180 | 254 | 260 |
| Additives | Silica fume | 0.0039 | [43] | - | - | - | - | 45 | - | - | - | - | 40 | - | - | - | 53.6 | 230 |
| Fly ash | 0.0020 | [50] | - | 180 | 200 | 190 | - | - | - | - | 360 | - | - | - | - | - | - | |
| Steel fibres | 1.2800 | [60] | - | - | - | - | - | - | - | - | - | - | 39 | 39 | 39 | - | 233 | |
| Glass fibres | 1.4400 | [61] | - | - | - | - | - | - | - | - | - | - | - | - | - | 13.5 | - | |
| Superplasticizer | 1.5300 | [62] | 3.8 | 2.59 | 2.45 | 6.5 | 4.05 | 5.55 | - | - | 6 | 8.8 | 0.89 | 1.16 | 1.66 | 3.84 | 29.6 | |
| Na2SiO3 (solution) | 0.823 | [63] | - | - | - | - | - | - | - | - | 84 | - | - | - | - | - | - | |
| NaOH | 0.070 | [64] | - | - | - | - | - | - | - | - | 56 | - | - | - | - | - | - | |
| Mechanical compaction | YES | NO | NO | NO | YES | NO | YES | YES | YES | YES | YES | YES | YES | YES | YES | |||
| Average compressive strength fcm [MPa] | 41.2 | 42 | 47 | 37 | 91.1 | 90.5 | 31 | 28 | 27 | 88.3 | 25.5 | 37 | 55 | 83 | 106 | |||
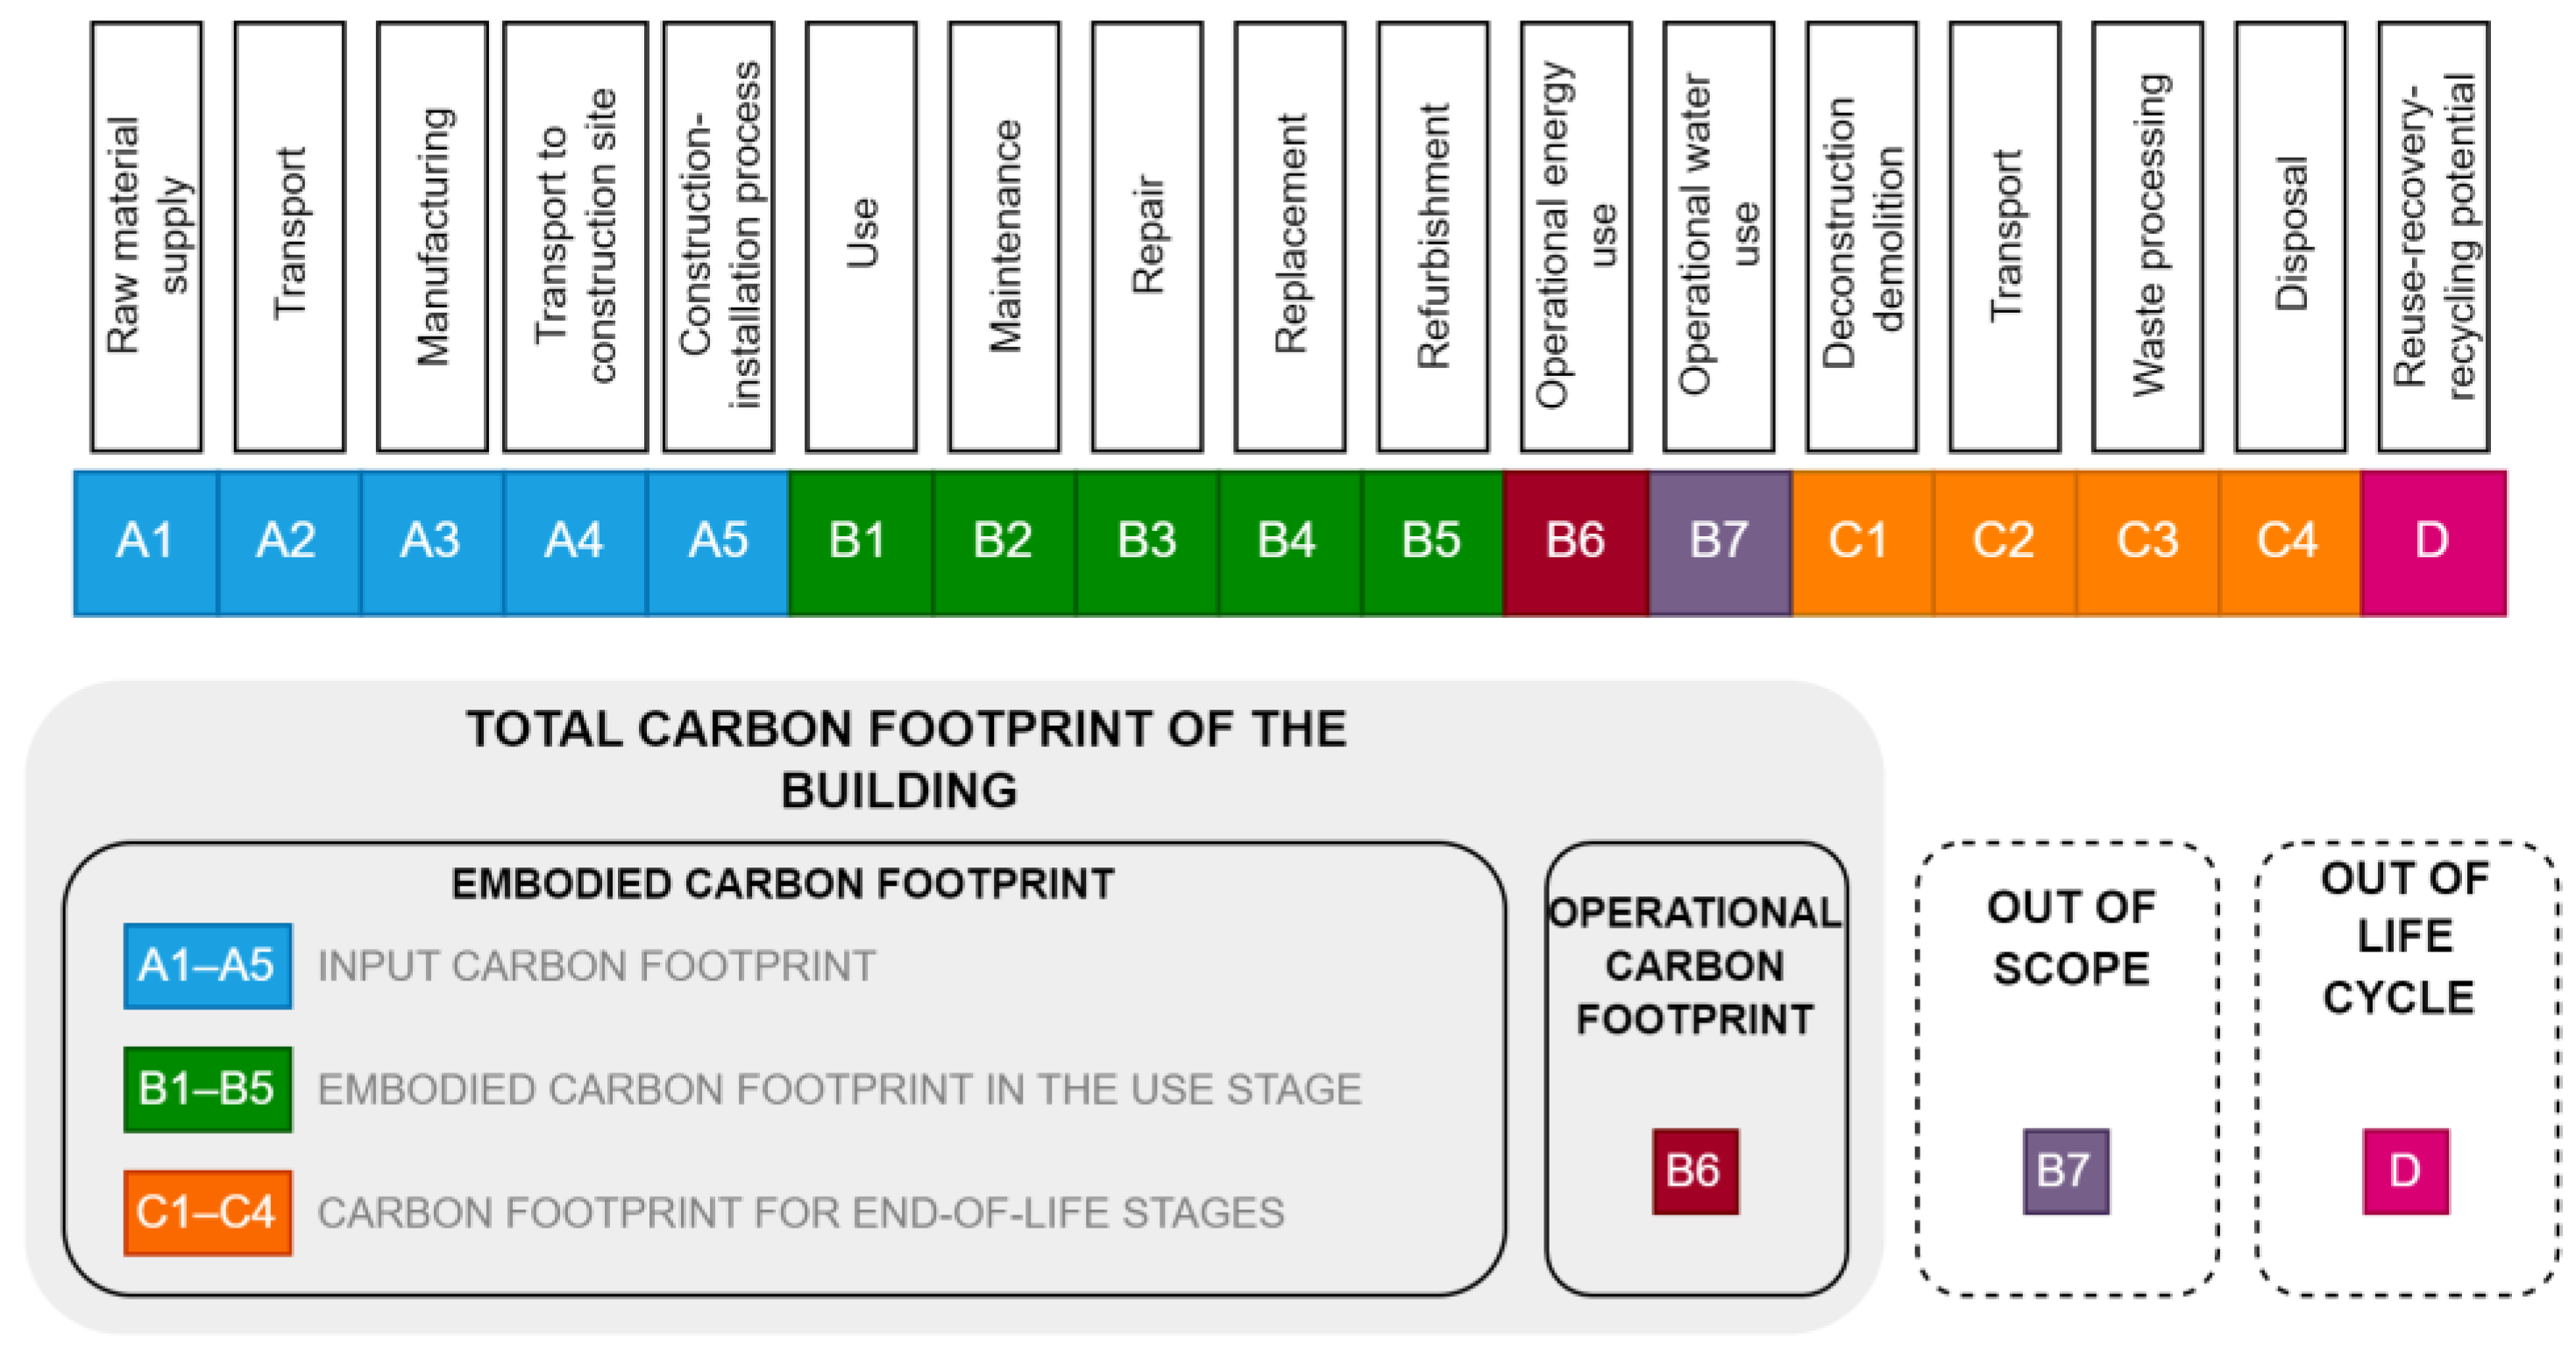
2.2. Carbon Footprint of Concrete—Calculation Method
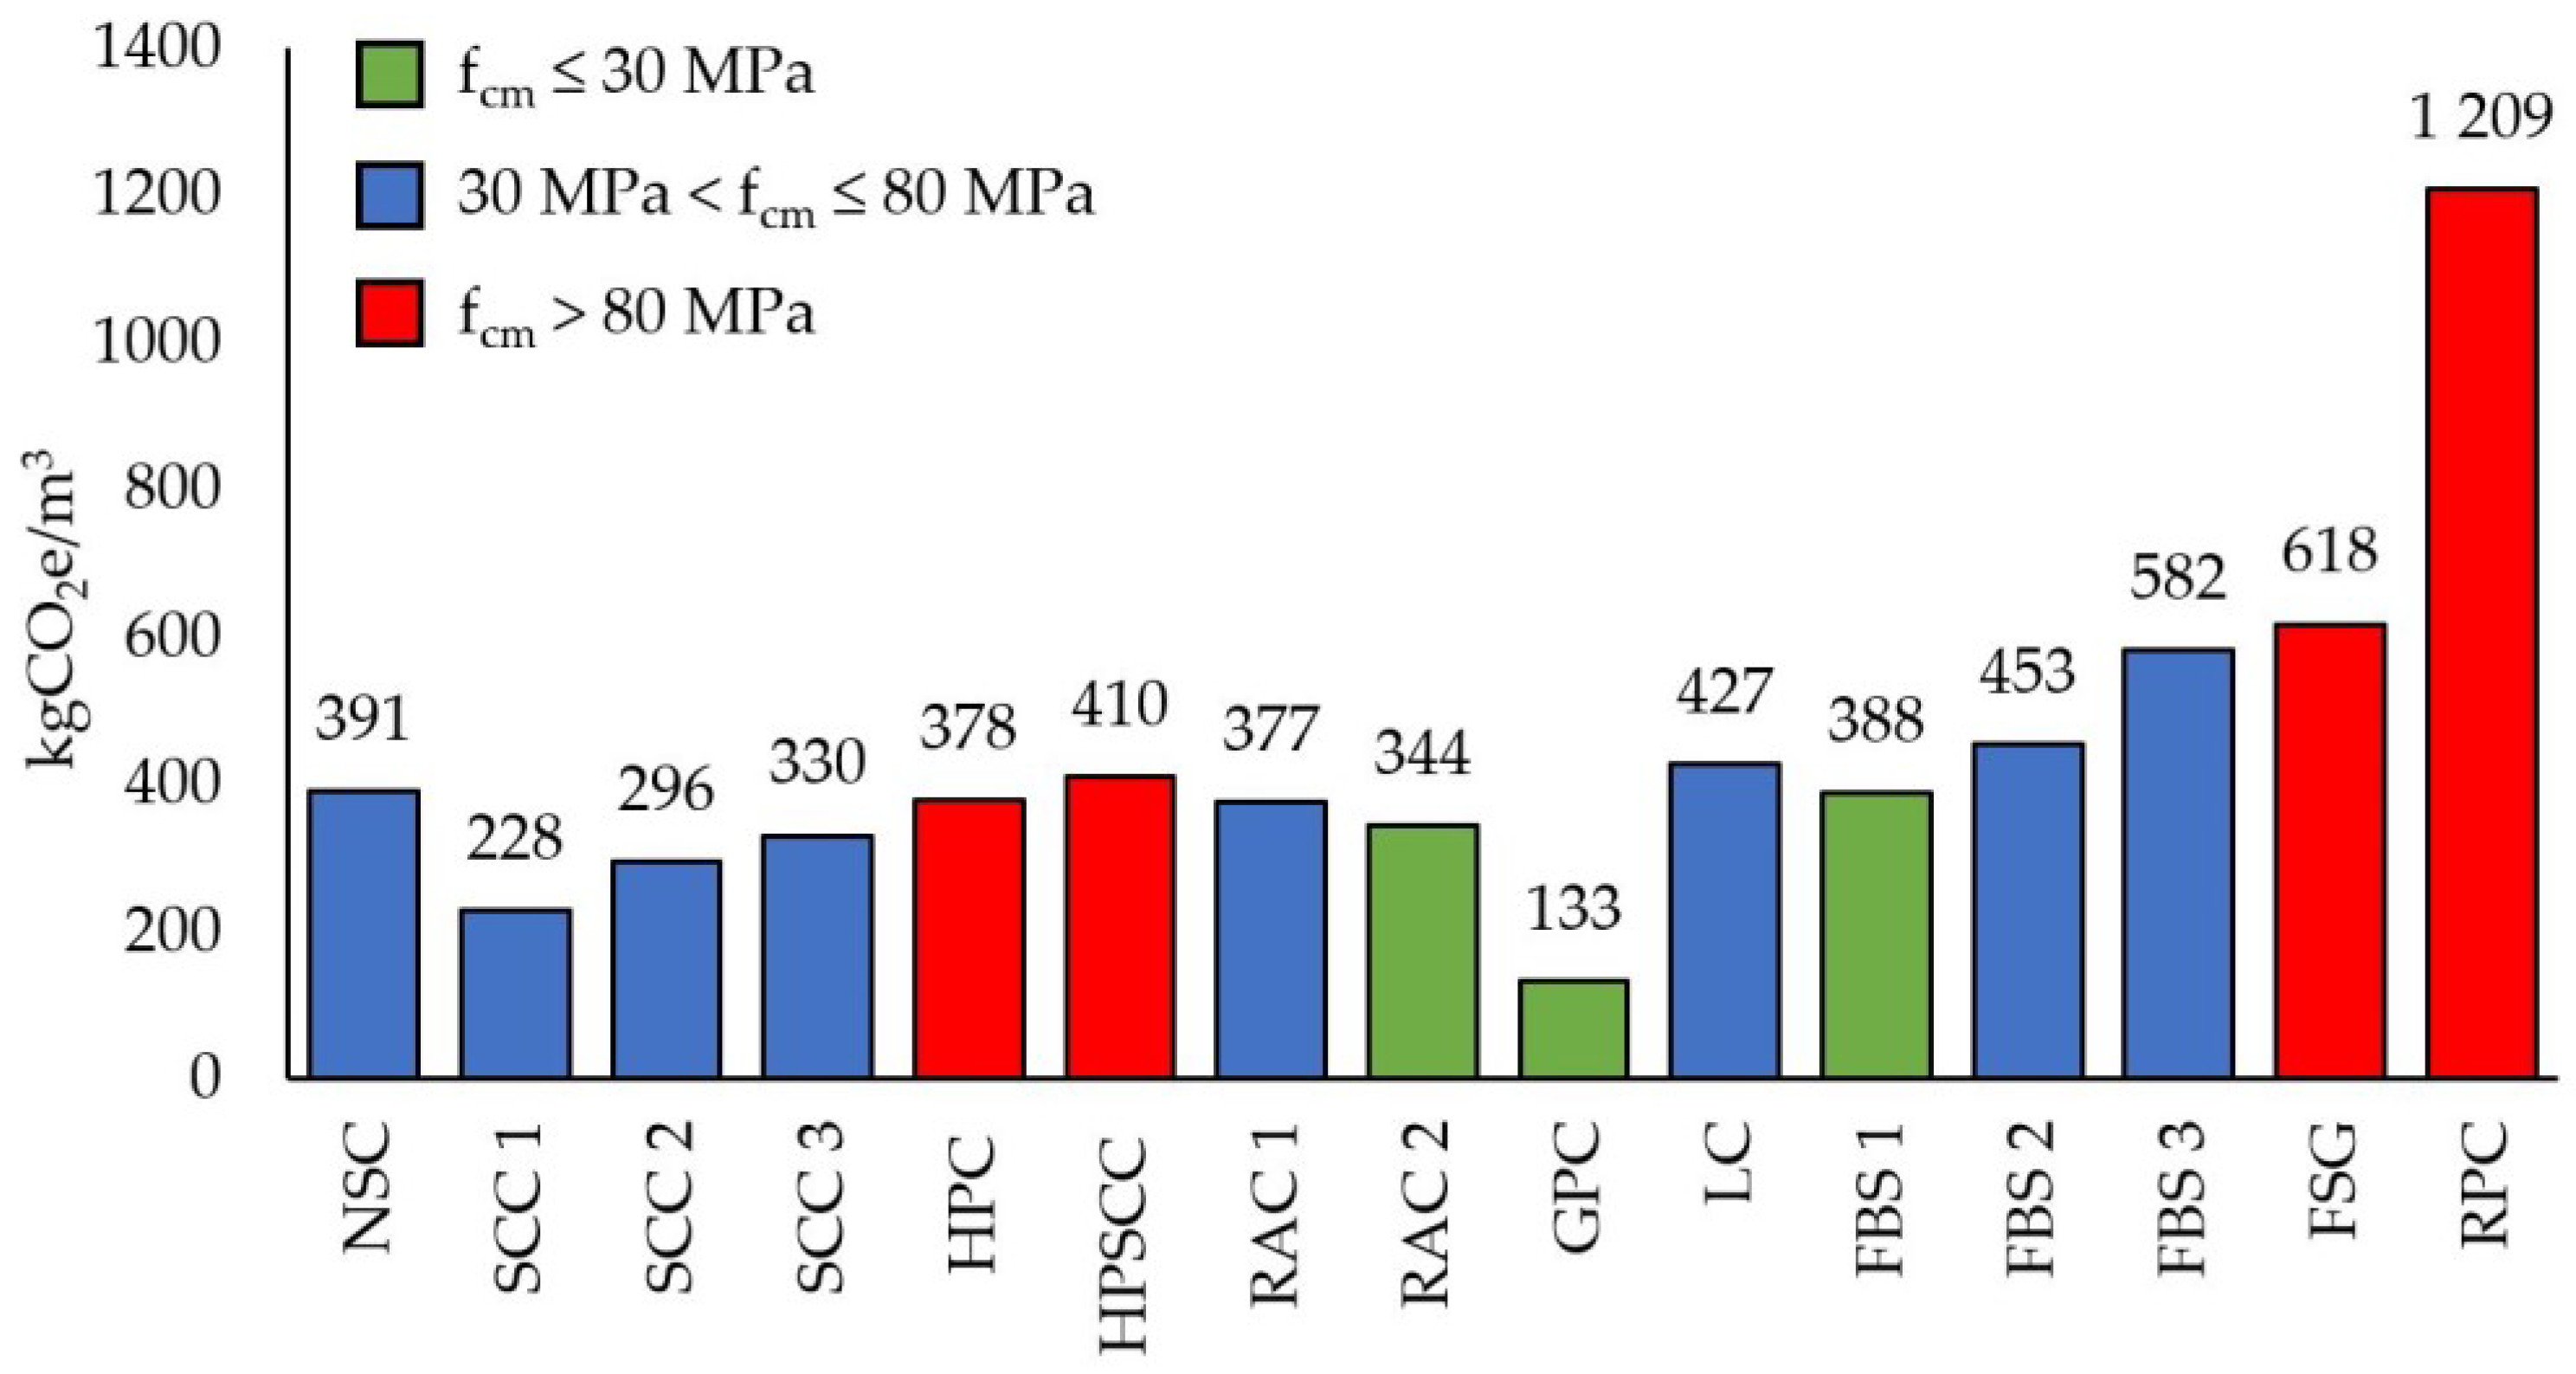
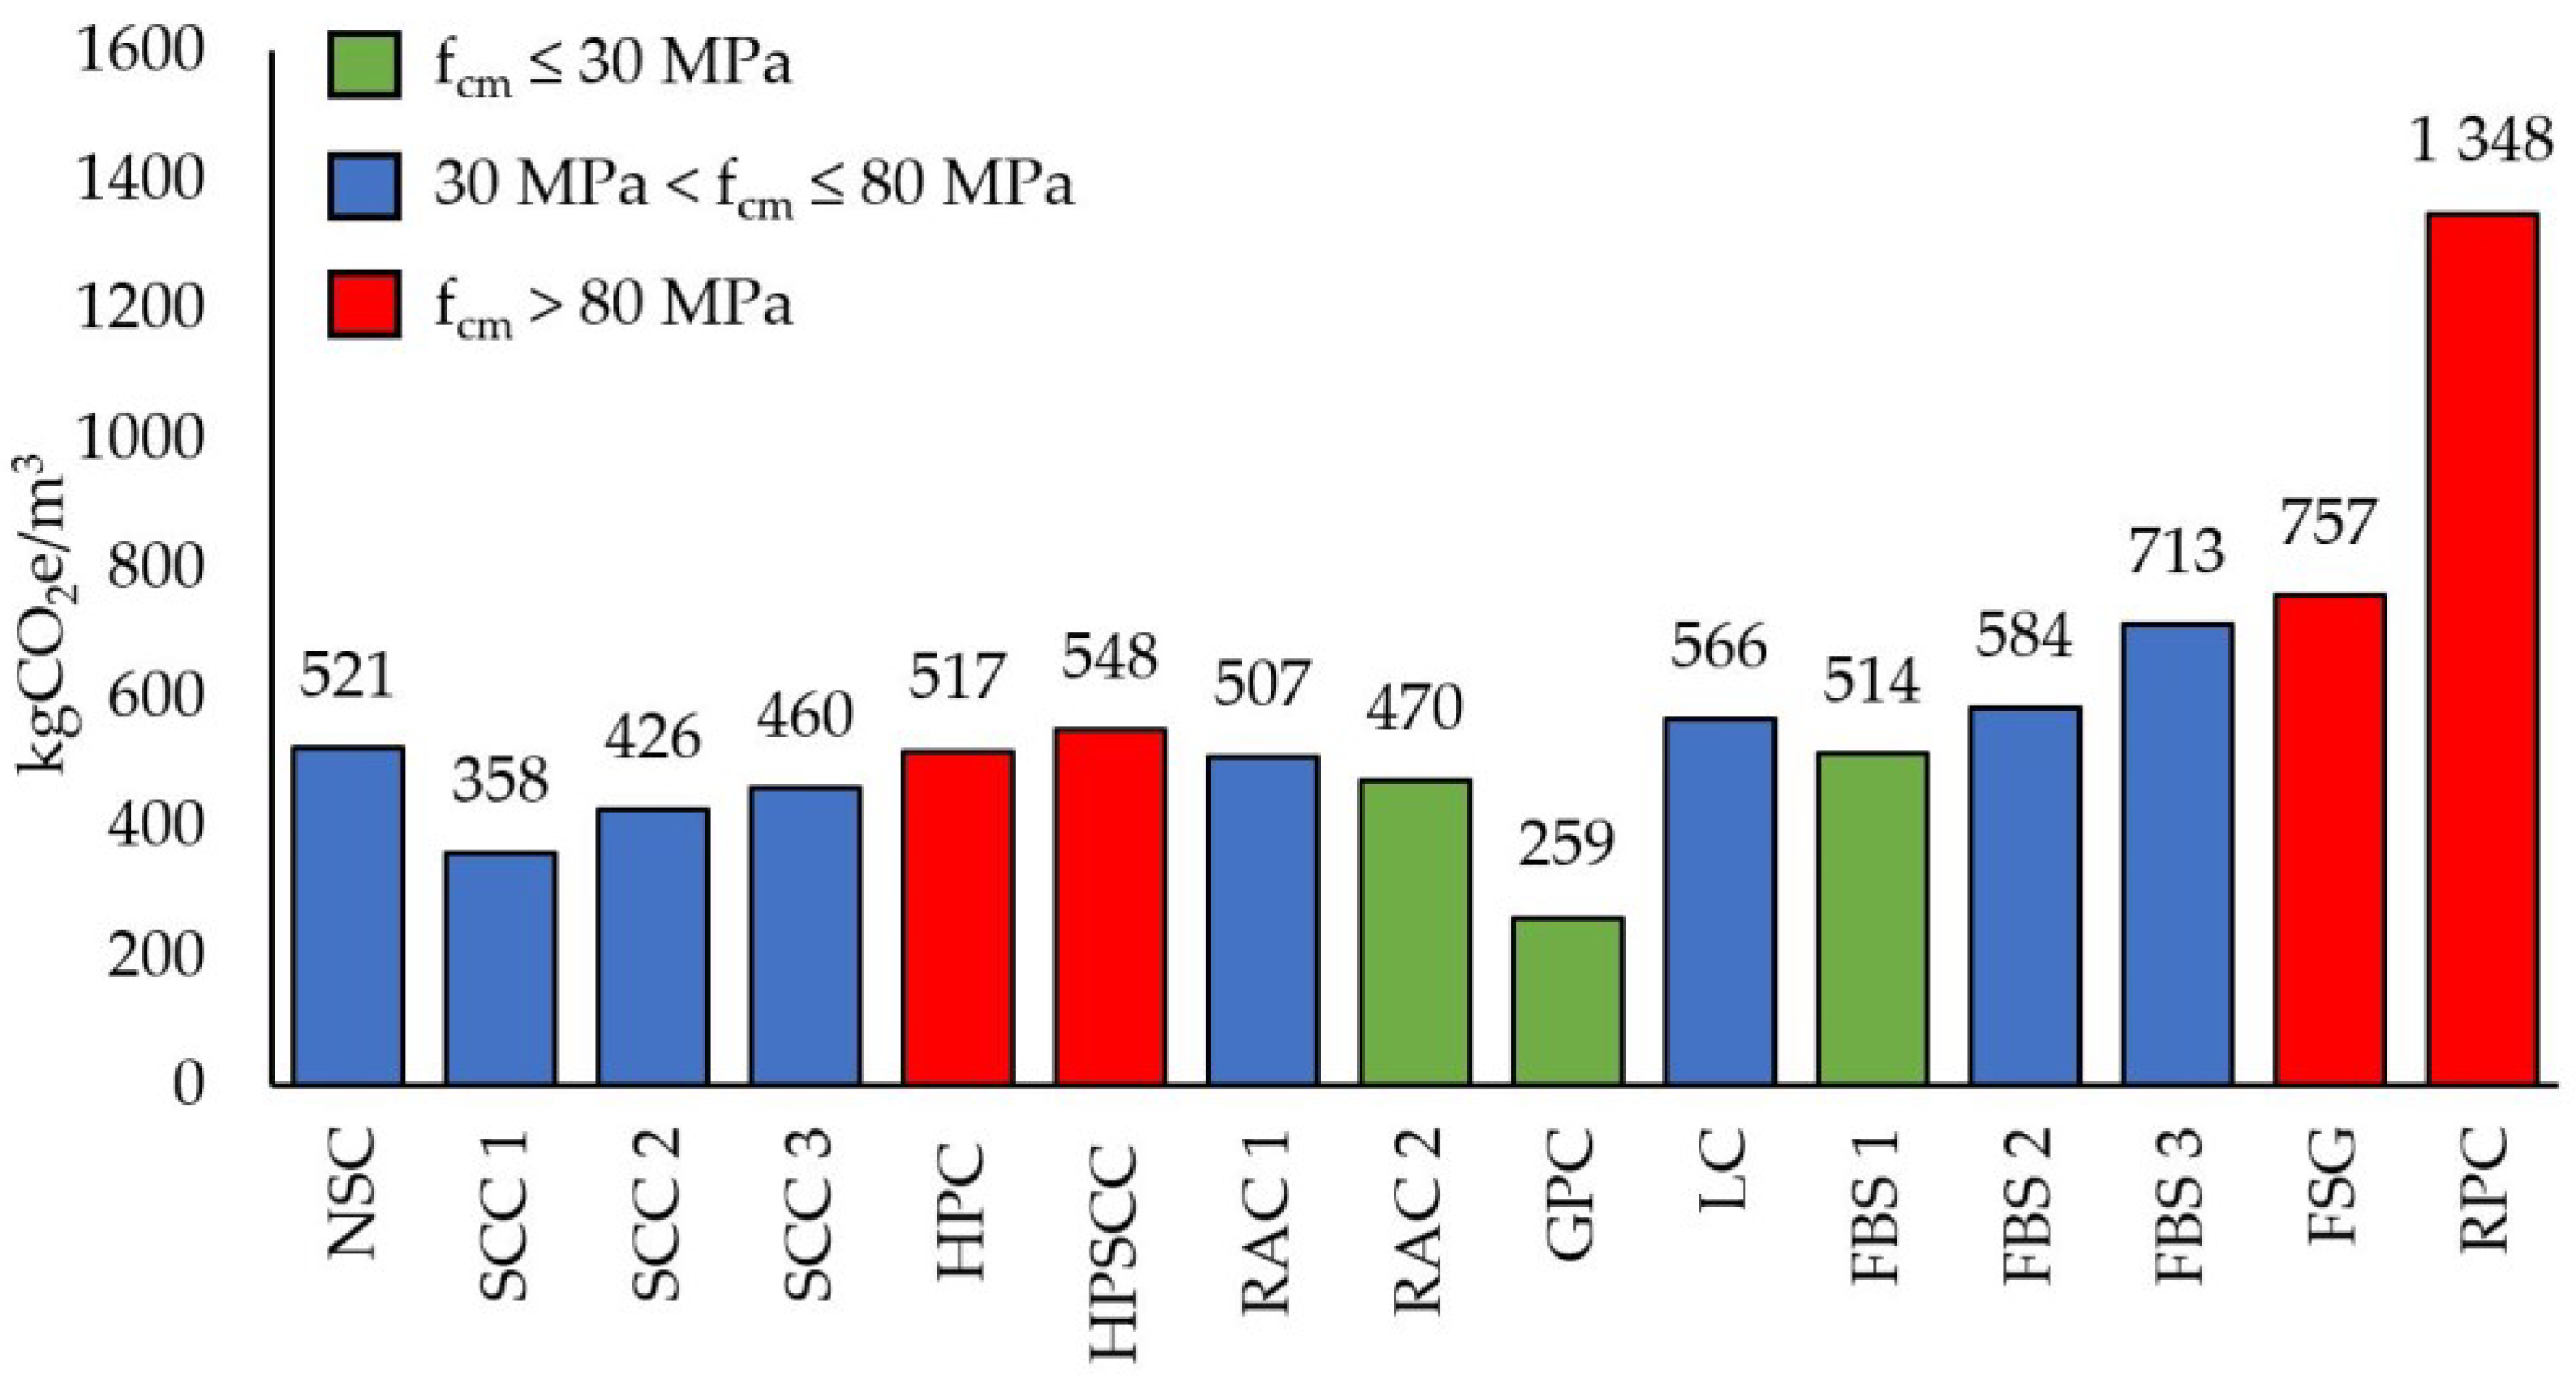
3. Results and Discussion
4. Conclusions
- The greatest impact on the carbon footprint had the composition of the concrete mix (phase A1), including primarily the type and amount of cement, which indicated the need to take low-carbon measures especially in this area.
- The use of industrial waste and recycled aggregate helps reduce the carbon footprint of concrete.
- At the initial stage of construction assessment, the simplified method (phases A1–A3) seems to be a sufficient method for the selection of concrete in terms of its lowest emissivity.
- On average, approximately 10% of the total carbon footprint emissions over the entire life cycle of the concrete were related to the incorporation of the concrete mixture at the construction site (phases A4–A5) and the demolition of the concrete at the end of its life cycle (phases C1–C4) in the analyzed construction.
- The share of reinforcing steel in the total CF of the analyzed structure amounted to an average of 15%.
- Depending on the location of the facility and its geometry and number of floors, when selecting concrete, it is necessary to consider not only the emissions per functional unit but also the value in relation to the entire structure and the emissivity associated with the consumption of reinforcing steel. This is because differences in the amount of material used due to the concrete’s strength class can significantly reduce the total carbon footprint emissions.
- After the implementation of CF reduction measures for phase A1, the impact of transportation, construction site processes, and demolition processes can be considered significant and important to reduce GHGs emissions for these life cycle phases.
- A correct evaluation of emissions offers a chance to recognize the primary sources and crucial regions that demand the implementation of low-emission procedures. From this standpoint, the analysis presented in this study could assist future researchers, especially when carrying out computations for concretes where binding materials other than Portland cement dominate.
- There is a need to develop unambiguous guidelines for estimating GHGs emissions that also consider the sources of energy production required primarily for the manufacture of cement, as a result of the specific nature of individual countries’ energy mixes.
- The analysis of the emissivity of a particular construction-material solution is done on a case-by-case basis, as it depends on the location of the structure and factors such as transportation distance and energy sources that vary between countries and are required to produce specific construction materials.
- The authors point out that the results are subject to uncertainties due to the assumptions made, e.g., regarding materials for which national EPDs were not available (values may vary between regions due to different energy sources), the transport distance assumed, and the calculation of the structure for a specific location (specific climatic loads, ground conditions).
Author Contributions
Funding
Institutional Review Board Statement
Informed Consent Statement
Data Availability Statement
Conflicts of Interest
References
- Lesniak, A.; Zima, K. Comparison of Traditional and Ecological Wall Systems Using the AHP Method. In International Multidisciplinary Scientific GeoConference Surveying Geology and Mining Ecology Management, Proceedings of the SGEM 2015: 15th International Multidisciplinary Scientific Geoconference, Albena, Bulgaria, 18–24 June 2015; SGEM: Albena, Bulgaria, 2015; pp. 157–164. [Google Scholar]
- Spišáková, M.; Mésároš, P.; Mandičák, T. Construction Waste Audit in the Framework of Sustainable Waste Management in Construction Projects—Case Study. Buildings 2021, 11, 61. [Google Scholar] [CrossRef]
- Jaskowska-Lemanska, J. Impurities of Recycled Concrete Aggregate-Types, Origin and Influence on the Concrete Strength Parameters. In IOP Conference Series: Materials Science and Engineering; Institute of Physics Publishing: Bristol, UK, 2019; Volume 603. [Google Scholar] [CrossRef] [Green Version]
- Sztubecka, M.; Skiba, M.; Mrówczynska, M.; Bazan-Krzywoszanska, A. An Innovative Decision Support System to Improve the Energy Efficiency of Buildings in Urban Areas. Remote Sens. 2020, 12, 259. [Google Scholar] [CrossRef] [Green Version]
- Skiba, M.; Mrówczyńska, M.; Sztubecka, M.; Bazan-Krzywoszańska, A.; Kazak, J.K.; Leśniak, A.; Janowiec, F. Probability Estimation of the City’s Energy Efficiency Improvement as a Result of Using the Phase Change Materials in Heating Networks. Energy 2021, 228, 120549. [Google Scholar] [CrossRef]
- Wałach, D. Analysis of Factors Affecting the Environmental Impact of Concrete Structures. Sustainability 2021, 13, 204. [Google Scholar] [CrossRef]
- Yan, H.; Ding, G.; Feng, K.; Zhang, L.; Li, H.; Wang, Y.; Wu, T. Systematic Evaluation Framework and Empirical Study of the Impacts of Building Construction Dust on the Surrounding Environment. J. Clean. Prod. 2020, 275, 122767. [Google Scholar] [CrossRef]
- United Nations Environment Programme 2021 Global Status Report for Buildings and Construction towards a Zero-Emissions, Efficient and Resilient Buildings and Construction Sector. Nairobi. 2021. Available online: https://globalabc.org/sites/default/files/2021-10/GABC_Buildings-GSR-2021_BOOK.pdf (accessed on 16 January 2023).
- Zima, K. Integrated Analysis of Costs and Amount of Greenhouse Gases Emissions during the Building Lifecycle. Arch. Civ. Eng. 2021, 67, 413–423. [Google Scholar] [CrossRef]
- Kijewska, A.; Bluszcz, A. Carbon Footprint Levels Analysis for the World and for the EU Countries. Syst. Wspomagania Inż. Prod. 2017, 6, 167–177. [Google Scholar]
- Iuorio, O.; Gigante, A.; de Masi, R.F. Life Cycle Analysis of Innovative Technologies: Cold Formed Steel System and Cross Laminated Timber. Energies 2023, 16, 586. [Google Scholar] [CrossRef]
- Wiśniewski, P.; Kistowski, M. Carbon Footprint as a Tool for Local Planning of Low Carbon Economy in Poland. Rocz. Ochr. Srodowiska 2017, 19, 335–354. [Google Scholar]
- ISO 14067:2018; Greenhouse Gases—Carbon Footprint of Products—Requirements and Guidelines for Quantification. International Organization for Standardization: London, UK, 2018.
- Głażewska, M.; Bundyra-Oracz, G.; Siemaszko-Lotkowska, D. The Emission Classification Standard for Ready-Mix Concrete. IMBiTB. 2022. (In Polish). Available online: https://emisyjnoscbetonu.pl/ (accessed on 28 September 2022).
- Bartosz, D.; Kowalski, W. Estimating the Carbon Footprint of Buildings. Whole Life Carbon Roadmap for Poland 2050. Polish Green Building Council—PLGBC, 2022. (In Polish). Available online: https://plgbc.org.pl/zrownowazone-budownictwo/dekarbonizacja-budownictwa/ (accessed on 24 November 2022).
- Forster, P.; Alterskjaer, K.; Smith, C.; Colman, R.; Damon Matthews, H.; Ramaswamy, V.; Storelvmo, T.; Armour, K.; Collins, W.; Dufresne, J.; et al. The Earth’s Energy Budget, Climate Feedbacks and Climate Sensitivity. In Climate Change 2021: The Physical Science Basis. Contribution of Working Group I to the Sixth Assessment Report of the Intergovernmental Panel on Climate Change; Cambridge University Press: Cambridge, UK; New York, NY, USA, 2021; pp. 923–1054. [Google Scholar]
- Labaran, Y.H.; Mathur, V.S.; Muhammad, S.U.; Musa, A.A. Carbon Footprint Management: A Review of Construction Industry. Clean. Eng. Technol. 2022, 9, 100531. [Google Scholar] [CrossRef]
- Garbacz, A.; Urbańska, P. Carbon Footprint of Concrete. BTA 2021, 4, 56–61. (In Polish) [Google Scholar]
- COM/2019/640 Final. Communication from the Commission to the European Parliament, the European Council, the Council, the European Economic and Social Committee and the Committee of the Regions—The European Green Deal. Brussels. 2019. Available online: https://eur-lex.europa.eu/legal-content/EN/TXT/?uri=CELEX:52019DC0640 (accessed on 24 November 2022).
- COM/2021/550 Final. Communication from the Commission to the European Parliament, the European Council, the Council, the European Economic and Social Committee and the Committee of the Regions “Fit for 55”: Delivering the EU’s 2030 Climate Target on the Way to Climate Neutrality. Brussels. 2021. Available online: https://eur-lex.europa.eu/legal-content/EN/TXT/?uri=CELEX:52021DC0550 (accessed on 24 November 2022).
- Li, X.; Wang, C.; Kassem, M.A.; Wu, S.Y.; Wei, T.B. Case Study on Carbon Footprint Life-Cycle Assessment for Construction Delivery Stage in China. Sustainability 2022, 14, 5180. [Google Scholar] [CrossRef]
- Resalati, S.; Kendrick, C.C.; Hill, C. Embodied Energy Data Implications for Optimal Specification of Building Envelopes. Build. Res. Inf. 2019, 48, 429–445. [Google Scholar] [CrossRef]
- Łasut, P.; Kulczycka, J. Methods and Programs for Calculating Carbon Footprint. Zesz. Nauk. IGSMiE PAN 2014, 87, 137–147. [Google Scholar]
- Zhang, S.; Ma, M.; Li, K.; Ma, Z.; Feng, W.; Cai, W. Historical Carbon Abatement in the Commercial Building Operation: China versus the US. Energy Econ. 2022, 105, 105712. [Google Scholar] [CrossRef]
- Ma, M.; Chen, M.; Feng, W.; Huo, J. What Decarbonized the Residential Building Operation Worldwide since the 2000s. Pet. Sci. 2022, 19, 3194–3208. [Google Scholar] [CrossRef]
- Kuczera, A.; Płoszaj-Mazurek, M. How to Decarbonise the Built Environment by 2050. Whole Life Carbon Roadmap for Poland. Polish Green Building Council—PLGBC. 2021. (In Polish). Available online: https://plgbc.org.pl/zrownowazone-budownictwo/dekarbonizacja-budownictwa/ (accessed on 24 November 2022).
- Kairies-Alvarado, D.; Muñoz-Sanguinetti, C.; Martínez-Rocamora, A. Contribution of Energy Efficiency Standards to Life-Cycle Carbon Footprint Reduction in Public Buildings in Chile. Energy Build. 2021, 236, 110797. [Google Scholar] [CrossRef]
- Yang, G.; Zhang, Q.; Zhao, Z.; Zhou, C. How Does the “Zero-Waste City” Strategy Contribute to Carbon Footprint Reduction in China? Waste Manag. 2023, 156, 227–235. [Google Scholar] [CrossRef]
- Ma, M.; Feng, W.; Huo, J.; Xiang, X. Operational Carbon Transition in the Megalopolises’ Commercial Buildings. Build. Environ. 2022, 226, 109705. [Google Scholar] [CrossRef]
- Xiang, X.; Ma, M.; Ma, X.; Chen, L.; Cai, W.; Feng, W.; Ma, Z. Historical Decarbonization of Global Commercial Building Operations in the 21st Century. Appl. Energy 2022, 322, 119401. [Google Scholar] [CrossRef]
- Tsay, Y.S.; Yeh, Y.C.; Jheng, H.Y. Study of the Tools Used for Early-Stage Carbon Footprint in Building Design. Adv. Electr. Electron. Eng. 2023, 4, 100128. [Google Scholar] [CrossRef]
- Haik, R.; Meir, I.A.; Peled, A. Lime Hemp Concrete with Unfired Binders vs. Conventional Building Materials: A Comparative Assessment of Energy Requirements and CO2 Emissions. Energies 2023, 16, 708. [Google Scholar] [CrossRef]
- Global Cement and Concrete Association; Concrete Future—GCCA 2050 Cement and Concrete Industry Roadmap for Net Zero Concrete. 2021. Available online: https://gccassociation.org/concretefuture/ (accessed on 24 November 2022).
- Skrzypczak, I.; Kokoszka, W.; Zięba, J.; Leśniak, A.; Bajno, D.; Bednarz, L. A Proposal of a Method for Ready-Mixed Concrete Quality Assessment Based on Statistical-Fuzzy Approach. Materials 2020, 13, 5674. [Google Scholar] [CrossRef] [PubMed]
- Skrzypczak, I.; Leśniak, A.; Ochab, P.; Górka, M.; Kokoszka, W.; Sikora, A. Interlaboratory Comparative Tests in Ready-Mixed Concrete Quality Assessment. Materials 2021, 14, 3475. [Google Scholar] [CrossRef] [PubMed]
- Wang, D.; Liu, G.; Li, K.; Wang, T.; Shrestha, A.; Martek, I.; Tao, X. Layout Optimization Model for the Production Planning of Precast Concrete Building Components. Sustainability 2018, 10, 1807. [Google Scholar] [CrossRef] [Green Version]
- Kaczmarczyk, G.P.; Wałach, D.; Natividade-Jesus, E.; Ferreira, R. Change of the Structural Properties of High-Performance Concretes Subjected to Thermal Effects. Materials 2022, 15, 5753. [Google Scholar] [CrossRef]
- CEMBUREAU The European Cement Association Cementing the European Green Deal. Reaching Climate Neutrality along the Cement and Concrete Value Chain by 2050. Available online: https://lowcarboneconomy.cembureau.eu/ (accessed on 10 January 2023).
- Polish Cement Association Concrete in Sustainable Construction Residential. 2018. (In Polish). Available online: https://www.polskicement.pl/broszura-beton-w-zrownowazonym-budownictwie-mieszkaniowym/ (accessed on 10 January 2023).
- Zhang, C.; Hu, M.; van der Meide, M.; Di Maio, F.; Yang, X.; Gao, X.; Li, K.; Zhao, H.; Li, C. Life Cycle Assessment of Material Footprint in Recycling: A Case of Concrete Recycling. Waste Manag. 2023, 155, 311–319. [Google Scholar] [CrossRef]
- Górak, P.; Gaudy, J.; Wójcik, A.; Grądzik, A. The Carbon Footprint Reduction in Bridge Structures by Using Material Solutions for Concretes Based on Low-Clinker Cements. In Proceedings of the XI Conference Concrete Days 2021, Wisła, Poland, 11–13 October 2021; Polish Cement Association: Wisła, Poland, 2021; pp. 211–222. (In Polish). Available online: https://www.dnibetonu.com/referaty/dni-betonu-2021-2/ (accessed on 5 March 2023).
- Latawiec, R.; Woyciechowski, P.; Kowalski, K. Sustainable Concrete Performance—CO2–Emission. In Proceedings of the IX Conference Concrete Days 2016, Wisła, Poland, 11–12 October 2016; Polish Cement Association: Wisła, Poland, 2016; pp. 1–11. (In Polish). Available online: https://www.dnibetonu.com/referaty/dni-betonu-2016-2/ (accessed on 5 March 2023).
- Walach, D. Economic and Environmental Assessment of New Generation Concretes. In IOP Conference Series: Materials Science and Engineering; IOP Publishing Ltd.: Bristol, UK, 2020; Volume 960. [Google Scholar]
- Ali, B.; Qureshi, L.A.; Khan, S.U. Flexural Behavior of Glass Fiber-Reinforced Recycled Aggregate Concrete and Its Impact on the Cost and Carbon Footprint of Concrete Pavement. Constr. Build. Mater. 2020, 262, 120820. [Google Scholar] [CrossRef]
- Deb, P.S.; Nath, P.; Sarker, P.K. The Effects of Ground Granulated Blast-Furnace Slag Blending with Fly Ash and Activator Content on the Workability and Strength Properties of Geopolymer Concrete Cured at Ambient Temperature. Mater. Des. 2014, 62, 32–39. [Google Scholar] [CrossRef] [Green Version]
- Jóźwiak-Niedźwiedzka, D. The Counteracting of the Concrete Scaling Problem by Means of Pre-Wetted Lightweight Aggregate. Part II—Laboratory Tests. Roads Bridges-Drogi Mosty 2006, 5, 17–42. [Google Scholar]
- Ali, B.; Yilmaz, E.; Sohail Jameel, M.; Haroon, W.; Alyousef, R. Consolidated Effect of Fiber-Reinforcement and Concrete Strength Class on Mechanical Performance, Economy and Footprint of Concrete for Pavement Use. J. King Saud Univ. Eng. Sci. 2021, in press. [Google Scholar] [CrossRef]
- Lee, M.; Mata-Falcón, J.; Kaufmann, W. Influence of Short Glass Fibres and Spatial Features on the Mechanical Behaviour of Weft-Knitted Textile Reinforced Concrete Elements in Bending. Constr. Build. Mater. 2022, 344, 128179. [Google Scholar] [CrossRef]
- Denisiewicz, A. Reactive Powder Concrete and Their Use in Composite Construction. Prz. Bud. 2014, 11, 18–23. [Google Scholar]
- Instytut Techniki Budowlanej ITB Environmental Product Declaration Type III ITB No. 116/2020 Cements CEM I, CEM II, CEM III, CEM IV, CEM V Produced in Poland. 2020. Available online: https://www.itb.pl/epd.html (accessed on 10 January 2023).
- Institut Bauen und Umwelt e.V. (IBU) EPD-ARM-20160051-IBD3-EN Environmental Product Declaration. Reinforcing Steel in Bars. 2016. Available online: https://constructalia.arcelormittal.com/en/tools/epd (accessed on 10 January 2023).
- EN 1990:2002/A1:2005; Eurocode—Basis of Structural Design. European Union: Brussels, Belgium, 2005.
- EN 1991-1-1:2002; Eurocode 1. Actions on Structures—Part 1-1 General Actions Densities, Self-Weight, Imposed Loads for Buildings. European Union: Brussels, Belgium, 2002.
- Autodesk Robot Structural Analysis Professional 2014. Available online: http://docs.autodesk.com/RSAPRO/2014/PLK/index.html?url=filesROBOT/GUID-4A734308-B2F3-4147-A310-BD47C48E9ED1.htm,topicNumber=ROBOTd30e6724 (accessed on 5 March 2023).
- EN 1992-1-1:2004; Eurocode 2: Design of Concrete Structures—Part 1-1: General Rules and Rules for Buildings. European Union: Brussels, Belgium, 2004.
- Chen, J.; Ng, P.-L.; Jaskulski, R.; Kubissa, W. Use of Quartz Sand to Produce Low Embodied Energy and Carbon Footprint Plaster. J. Sustain. Archit. Civ. 2018, 21, 75–81. [Google Scholar] [CrossRef] [Green Version]
- BRE Global BREG EN EPD No.: 000206 Environmental Product Declaration Granite Aggregate—Bardon Hill. 2017. Available online: https://www.greenbooklive.com/index.jsp (accessed on 24 November 2022).
- EPDITALY—VIA GAETANO DE CASTILLIA 10 EPD 2018-11-22-02 Environmental Product Declaration. Lightweight Expanded Clay Structural Aggregate. 2018. Available online: https://www.epditaly.it/ (accessed on 10 January 2023).
- Kurda, R.; Silvestre, J.D.; de Brit, J. Life Cycle Assessment of Concrete Made Withhigh Volume of Recycled Concrete Aggregates and Fly Ash. Resour. Conserv. Recycl. 2018, 139, 407–417. [Google Scholar] [CrossRef]
- Instytut Techniki Budowlanej ITB Environmental Product Declaration Type III ITB No. 064/2017 Steel Fibres for Concrete Reinforcement. 2017. Available online: https://www.itb.pl/epd.html (accessed on 10 January 2023).
- Hill, C.; Norton, A.; CH Industrial Ecology Ltd. LCA Database of Environmental Impacts to Inform Material Selection Process; DACOMAT: Paris, France, 2018. [Google Scholar]
- Institut Bauen und Umwelt e.V. (IBU) EPD-EFC-20210198-IBG1-EN Environmental Product Declaration Concrete Admixtures—Plasticizer and Superplasticizer. 2021. Available online: https://ibu-epd.com/veroeffentlichte-epds/ (accessed on 24 November 2022).
- Witzleben, S. Minimizing the Global Warming Potential with Geopolymer-Based Insulation Material with Miscanthus Fiber. Polymers 2022, 14, 3191. [Google Scholar] [CrossRef] [PubMed]
- NEPD-3016-1686-EN Environmental Product Declaration in Accordance with ISO 14025 Sodium Hydroxide. 2019. Available online: https://www.epd-norge.no/kjemikalier/sodium-hydroxide-article3470-333.html (accessed on 10 January 2023).
- Kouridis, C.; Samaras, C.; Hassel, D.; Mellios, G.; McCrae, I.; Hickman, J.; Zieroc, K.-H. EMEP/EEA Air Pollutant Emission Inventory Guidebook 2019–Update Oct. 2021. Available online: https://www.eea.europa.eu/themes/air/air-pollution-sources-1/emep-eea-air-pollutant-emission-inventory-guidebook (accessed on 24 November 2022).
- Heravi, G.; Nafisi, T.; Mousavi, R. Evaluation of Energy Consumption during Production and Construction of Concrete and Steel Frames of Residential Buildings. Energy Build. 2016, 130, 244–252. [Google Scholar] [CrossRef]
- IOŚ-PIB Emission Factors for CO2, SO2, NOx, CO and Total Dust for Electricity Based on Information in the National Greenhouse Gas and Other Substance Emissions Database for 2020. 2021. (In Polish). Available online: https://kobize.pl/pl/fileCategory/id/28/wskazniki-emisyjnosci (accessed on 24 November 2022).
- Sagan, J. Supporting Decision-Making Process in Reverse Logistics of Concrete Waste. Ph.D. Thesis, AGH University of Science and Technology, Cracow, Poland, 2018. (In Polish). [Google Scholar]
- Shao, Z. Non-Road Emission Inventory Model Methodology; International Council on Clean Transportation: Washington, DC, USA, 2016; Volume 4. [Google Scholar]
- Łój, G. The Possibility of Using Recycled Aggregates from Construction to Produce Vibro-Pressed Concrete. BTA 2018, 3, 56–61. [Google Scholar]
- Rowiński, L. Mechanised Construction Work Technology; PWN: Warsaw, Poland, 1976. (In Polish) [Google Scholar]
- Nath, P.; Sarker, P.K.; Biswas, W.K. Effect of Fly Ash on the Service Life, Carbon Footprint and Embodied Energy of High Strength Concrete in the Marine Environment. Energy Build. 2018, 158, 1694–1702. [Google Scholar] [CrossRef] [Green Version]
- Manjunatha, M.; Seth, D.; Balaji, K.V.G.D.; Bharath, A. Engineering Properties and Environmental Impact Assessment of Green Concrete Prepared with PVC Waste Powder: A Step towards Sustainable Approach. Case Stud. Constr. Mater. 2022, 17, e01404. [Google Scholar] [CrossRef]
- Schaefer, C.E.; Kupwade-Patil, K.; Ortega, M.; Soriano, C.; Büyüköztürk, O.; White, A.E.; Short, M.P. Irradiated Recycled Plastic as a Concrete Additive for Improved Chemo-Mechanical Properties and Lower Carbon Footprint. Waste Manag. 2018, 71, 426–439. [Google Scholar] [CrossRef] [PubMed]
- Habert, G.; Roussel, N. Study of Two Concrete Mix-Design Strategies to Reach Carbon Mitigation Objectives. Cem. Concr. Compos. 2009, 31, 397–402. [Google Scholar] [CrossRef]
- Visintin, P.; Xie, T.; Bennett, B. A Large-Scale Life-Cycle Assessment of Recycled Aggregate Concrete: The Influence of Functional Unit, Emissions Allocation and Carbon Dioxide Uptake. J. Clean. Prod. 2020, 248, 119243. [Google Scholar] [CrossRef]
- Hafez, H.; Kurda, R.; Kurda, R.; Al-Hadad, B.; Mustafa, R.; Ali, B. A Critical Review on the Influence of Fine Recycled Aggregates on Technical Performance, Environmental Impact and Cost of Concrete. Appl. Sci. 2020, 10, 1018. [Google Scholar] [CrossRef] [Green Version]
- Rudnicki, T. The Impact of the Aggregate Used on the Possibility of Reducing the Carbon Footprint in Pavement Concrete. Sustainability 2022, 14, 16478. [Google Scholar] [CrossRef]
- Xu, Y.; Liu, A.; Li, Z.; Li, J.; Xiong, J.; Fan, P. Review of Green Supply-Chain Management Diffusion in the Context of Energy Transformation. Energies 2023, 16, 686. [Google Scholar] [CrossRef]
- Jaskowska-Lemańska, J.; Kucharska, M.; Matuszak, J.; Nowak, P.; Łukaszczyk, W. Selected Properties of Self-Compacting Concrete with Recycled PET Aggregate. Materials 2022, 15, 2566. [Google Scholar] [CrossRef]
- Sagan, J.; Sobotka, A. Analysis of Factors Affecting the Circularity of Building Materials. Materials 2021, 14, 7296. [Google Scholar] [CrossRef]
- Fantilli, A.P.; Mancinelli, O.; Chiaia, B. The Carbon Footprint of Normal and High-Strength Concrete Used in Low-Rise and High-Rise Buildings. Case Stud. Constr. Mater. 2019, 11, e00296. [Google Scholar] [CrossRef]
- Zima, K.; Przesmycka, A. Concept of Integrated Cost Analysis and the Generated Carbon Footprint over the Life Cycle of a Building. Prz. Bud. 2021, 92, 42–48. [Google Scholar]


| Chemical Formula | GWP100 |
|---|---|
| CO2 | 1 |
| CH4—fossil origin | 29.8 |
| CH4—non fossil origin | 27.2 |
| N2O | 273 |
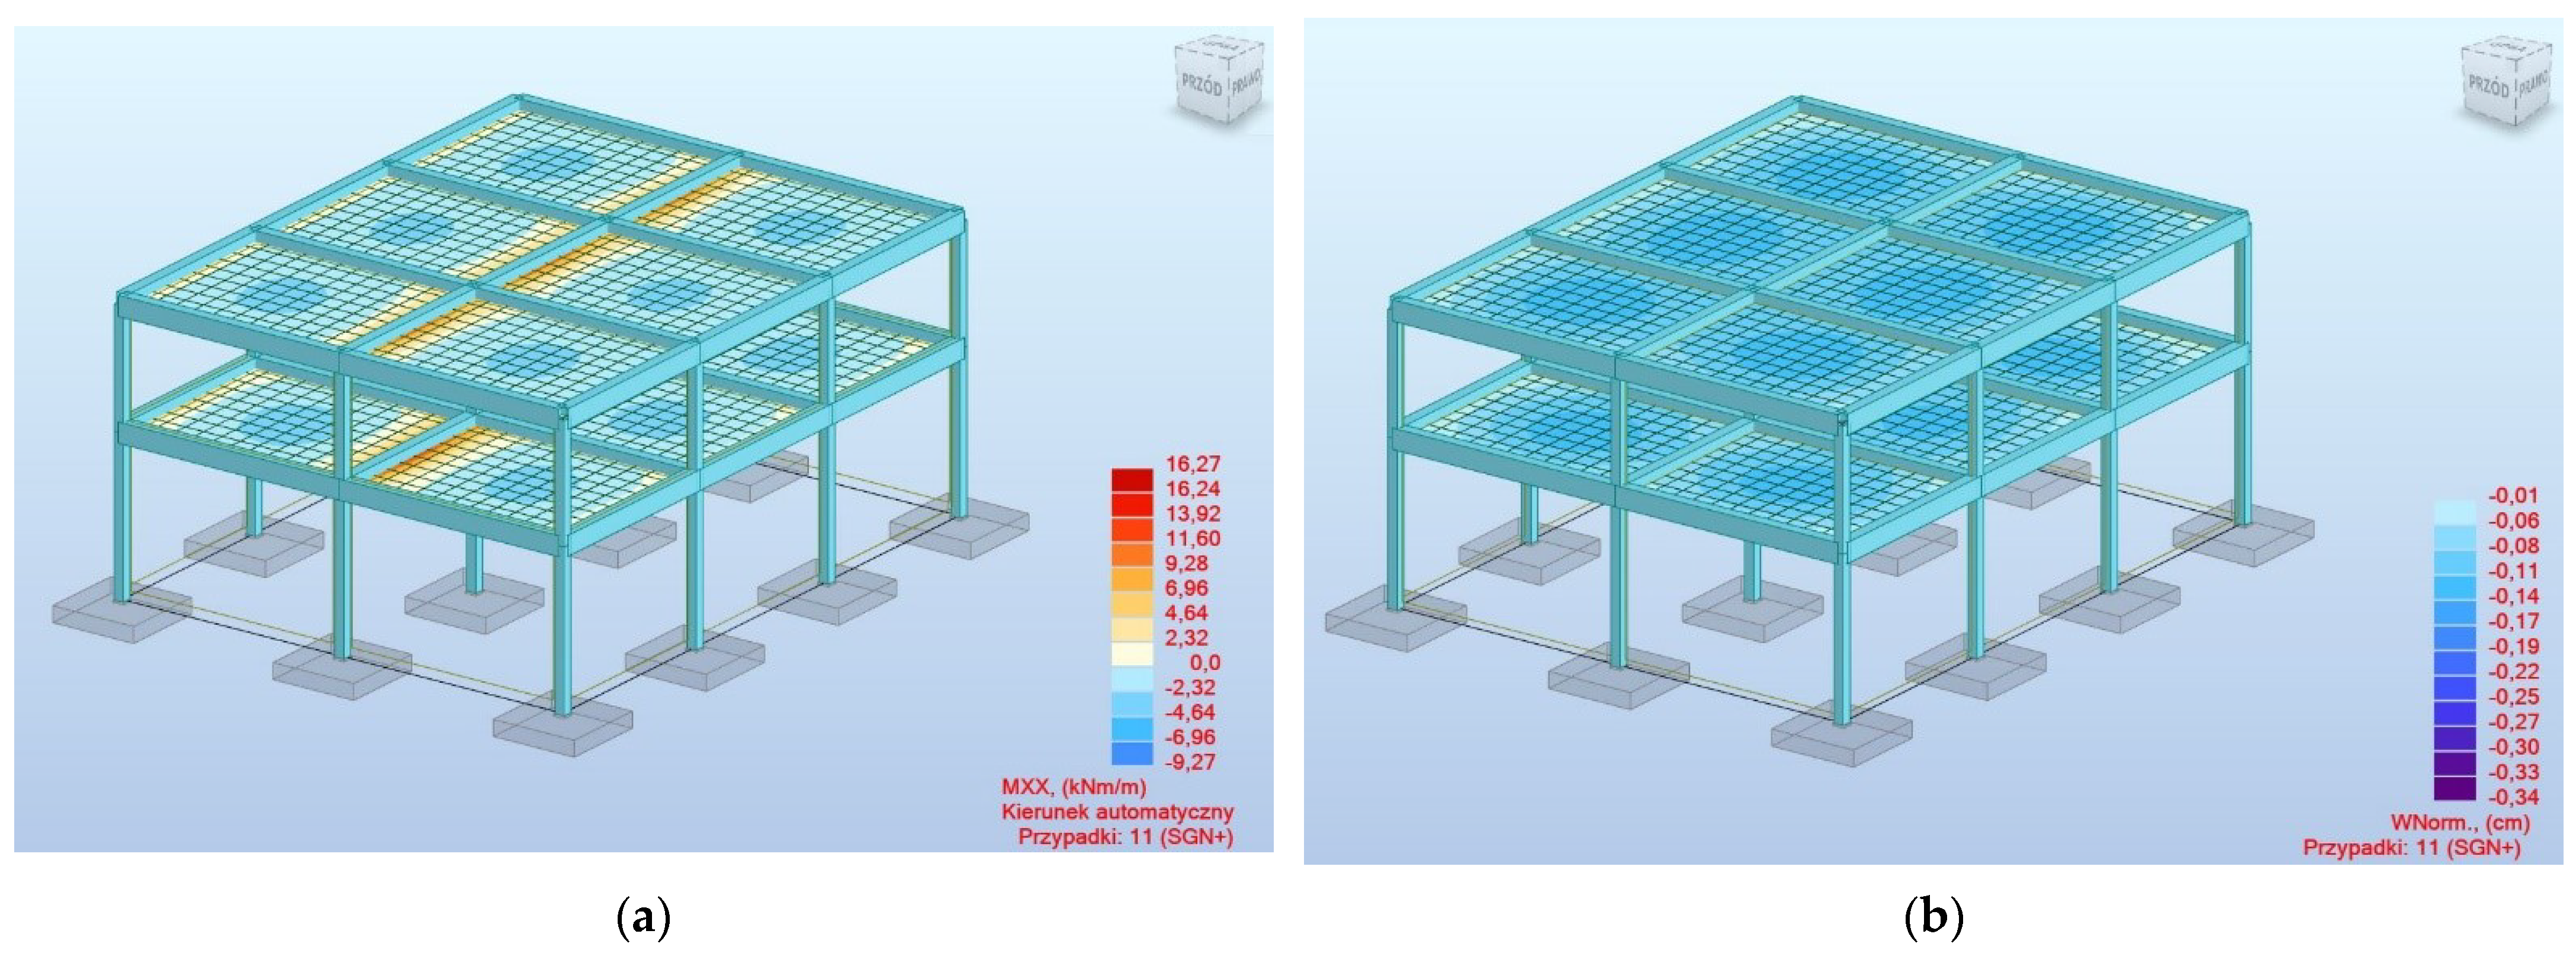
| Concrete Classes | Reinforcing Steel [Mg] | Concrete [m3] | |
|---|---|---|---|
| Construction 1 | C20/25 | 7.47 | 104.19 |
| Construction 2 | C50/60 | 7.06 | 95.97 |
| Construction 3 | C90/105 | 7.00 | 94.04 |
| Loading Capacity [t] | Transport | Exhaust Emission Factors | Fuel | ||||
|---|---|---|---|---|---|---|---|
| EtCO2 [kgCO2e/km] | EtN2O [kgN2Oe/km] | Typical Fuel Consumption [kg/km] | EfCO2 [kg/kg fuel] | Diesel Supply Chain Indicator SC | |||
| [kgCO2e/kg] | [kgCO2e/l] | ||||||
| 7.5–16 | the ingredients of the concrete mixtures | 0.486∙10−3 | 0.034∙10−3 | 0.155 | 3.169 | 0.395 | 0.332 |
| 16–32 | concrete mixtures, debris | 0.210 | |||||
| Process | Production * | Pumping | Compacting |
|---|---|---|---|
| Scope | A3 | A5 | A5 |
| Process energy consumption [kWh/m3] | 29.66 [66] | 0.49 [43] | 0.25 [43] |
| Vehicle Category | Power [kW] | Average Technical Performance [Mg/h] | Maximum Volume of the Excavator Bucket [m3] |
|---|---|---|---|
| Hydraulic hammer | 110 | According to Equations (8)–(10) | - |
| Excavator | 110 | According to Equation (11) | 1.5 |
| Crusher | 29.6 | 17.5 | - |
| i [-] | EFss [g/kWh] | TAF [-] | hculm [h] | [h] | AHC [-] | ANOx [-] | BSFCss [lb/kWh] | ||
|---|---|---|---|---|---|---|---|---|---|
| HC | NOx | ||||||||
| Excavator (Tier 4N) | 0.59 | 0.176 | 0.370 | 1 | 1092 | 4667 | 0.027 | 0.008 | 0.492 |
| Crusher (Tier 4) | 0.43 | 4.023 | 955 | 2500 | 0.547 | ||||
| Type of Concrete | Range | Own Results | Other Results | Source | ||
|---|---|---|---|---|---|---|
| CF [kgCO2e/m3] | Compressive Strength [MPa] | CF [kgCO2e/m3] | Compressive Strength [MPa] | |||
| Concrete based on CEM I | A1 | 305 | 28 | 215 | 25 | [82] |
| 291–349 | 30–80 | 310–378 | 30–50 | [41] | ||
| 291–349 | 30–80 | 350 | 60 | [82] | ||
| 386 | 88 | 394 | 80 | [82] | ||
| RAC 1 | 337 | 31 | 347 | 31 | [44] | |
| RAC 2 | 305 | 28 | 334 | 28 | [44] | |
| FSB 1 | 348 | 26 | 370 | 25.5 | [47] | |
| FSB 2 | 415 | 37 | 439 | 37 | [47] | |
| FSB 3 | 544 | 55 | 572 | 55 | [47] | |
Disclaimer/Publisher’s Note: The statements, opinions and data contained in all publications are solely those of the individual author(s) and contributor(s) and not of MDPI and/or the editor(s). MDPI and/or the editor(s) disclaim responsibility for any injury to people or property resulting from any ideas, methods, instructions or products referred to in the content. |
© 2023 by the authors. Licensee MDPI, Basel, Switzerland. This article is an open access article distributed under the terms and conditions of the Creative Commons Attribution (CC BY) license (https://creativecommons.org/licenses/by/4.0/).
Share and Cite
Wałach, D.; Mach, A. Effect of Concrete Mix Composition on Greenhouse Gas Emissions over the Full Life Cycle of a Structure. Energies 2023, 16, 3229. https://doi.org/10.3390/en16073229
Wałach D, Mach A. Effect of Concrete Mix Composition on Greenhouse Gas Emissions over the Full Life Cycle of a Structure. Energies. 2023; 16(7):3229. https://doi.org/10.3390/en16073229
Chicago/Turabian StyleWałach, Daniel, and Aleksandra Mach. 2023. "Effect of Concrete Mix Composition on Greenhouse Gas Emissions over the Full Life Cycle of a Structure" Energies 16, no. 7: 3229. https://doi.org/10.3390/en16073229