Article

Carbon Footprint Analysis throughout the Life Cycle of the Continuous Deep Mixing Method (CDMM) Technology

by
Aleksandra Mach
* and
Maciej Szczygielski
Faculty of Civil Engineering and Resource Management, AGH University of Krakow, Al. Mickiewicza 30, 30-059 Cracow, Poland
*
Author to whom correspondence should be addressed.
Energies 2024, 17(13), 3294; https://doi.org/10.3390/en17133294
Submission received: 7 May 2024 / Revised: 28 June 2024 / Accepted: 2 July 2024 / Published: 4 July 2024
(This article belongs to the Special Issue Sustainable Built Environment and Its Circular Economy)

Abstract

:
The objective of this article is to assess the carbon footprint across the Continuous Deep Mixing Method (CDMM) life cycle, considering its implementation in the context of sustainable, zero-emission, and decarbonising construction. Amidst global climate change challenges of greenhouse gas emissions in the construction sector, the CDMM emerges as a potentially effective solution to mitigate environmental impact. This study aims to address the gap in the existing scientific literature by evaluating the environmental aspects of CDMM application, with a focus on identifying primary emission sources. This research extends beyond the conventional focus on construction materials to include energy consumption from equipment and transportation, offering a holistic view of the technology’s environmental impact. This analysis identified cement as the major greenhouse gas emission source for the CDMM, underscoring the technology’s potential as an alternative to traditional geotechnical methods, in line with integrated design solutions and meeting growing social expectations for sustainability. The added value of this study comes from data derived from an actual project, enabling a realistic assessment of CDMM’s environmental impact and resource and energy efficiency.

1. Introduction

Geotechnical works, due to their energy-intensive and material-intensive nature, can have a significant impact on the efficiency of sustainable construction practices [1,2,3]. The field of geotechnical engineering encounters specific challenges arising from the diversity of soil types and the necessity of tailoring design solutions to individual needs and site conditions [4].
Foundation works are an integral part of most construction projects, and assessing their environmental impact is becoming increasingly important in the context of changing regulations (the Fit for 55 package [5]) and rising social expectations [6]. Specifically, the issue of greenhouse gas (GHG) emissions contributing to global warming has become a priority area of interest and is subject to restrictions. As a result, the geotechnical sector may not only voluntarily undertake pro-environmental actions, but these actions are becoming a necessity, particularly in light of factors such as the Emissions Trading System [7]. Decarbonising the construction sector through technological innovations and efficient resource management is crucial for achieving global climate goals [8,9]. These efforts include the development and implementation of construction methods that minimise the use and emission of GHGs, including the use of materials with a lower environmental impact [8,10] and techniques that reduce energy consumption.
The measure of GHG emissions is the carbon footprint (CF). According to ISO 14067:2018 [11], the carbon footprint is “the sum of GHG emissions and GHG removals in a product system, expressed as CO2 equivalents and based on a life cycle assessment using the single impact category of climate change”. By translating all effects of global warming into a common scale (CO2 equivalents—CO2e), it is possible to easily compare outcomes and assess the overall impact [12,13].
The substantial development of geotechnical technologies has resulted in a wide range of applicable methods. One of the significant groups of technologies in this field is the Deep Mixing Methods (DMMs) [14]. In the deep mixing process, the soil is mechanically mixed in situ, potentially with the addition of hydraulic or pneumatic methods, while a binder, typically cement- or lime-based, is introduced using specialised machinery. The deep mixing method can be categorised based on its execution process and the mode of binder injection. There are two installation methods depending on how the binder is introduced into the soil, either with or without the addition of water: wet and dry mixing methods [15]. The classification of DMMs along with their examples is presented in Figure 1.
Within the spectrum of Deep Mixing Methods (DMMs), the Continuous Deep Mixing Method (CDMM) stands out as a notable technique. This technology is also recognised by various names in different regions: Trenchmix (TRMX) by Soletanche-Bachy in France, the FMI system in Germany, and the Power Blender in Japan. The Trenchmix method involves the creation of vertical soil–cement panels using a trenchmixer (depicted in Figure 2c and Figure 3a) [18]. The trenchmixer is equipped with a specially designed sword featuring a rotating chain with mixing blades, tailored for the injection of cement slurry. This configuration allows for the homogeneous mixing of the soil across the entire height of the panels and controlled injection of the cement slurry, i.e., with specified speeds of the chain on the sword and the advancement of the sword in the soil [19,20]. This process results in a panel that is uniform across its profile, with intentionally modified, controlled strength and filtration properties. The speed of the chain on the sword and its advancement in the soil, along with the parameters of the binding material delivered, are adjusted based on the soil being mixed. The slurry (usually cement-based) is typically prepared on-site, necessitating the construction site to be equipped with silos (for storing cement), water connections/tanks, a mixing and pumping unit for delivering the slurry, and pressure lines to connect the pumps with the trenchmixer (illustrated in Figure 2).
The individual steps in the creation of a single panel are as follows:
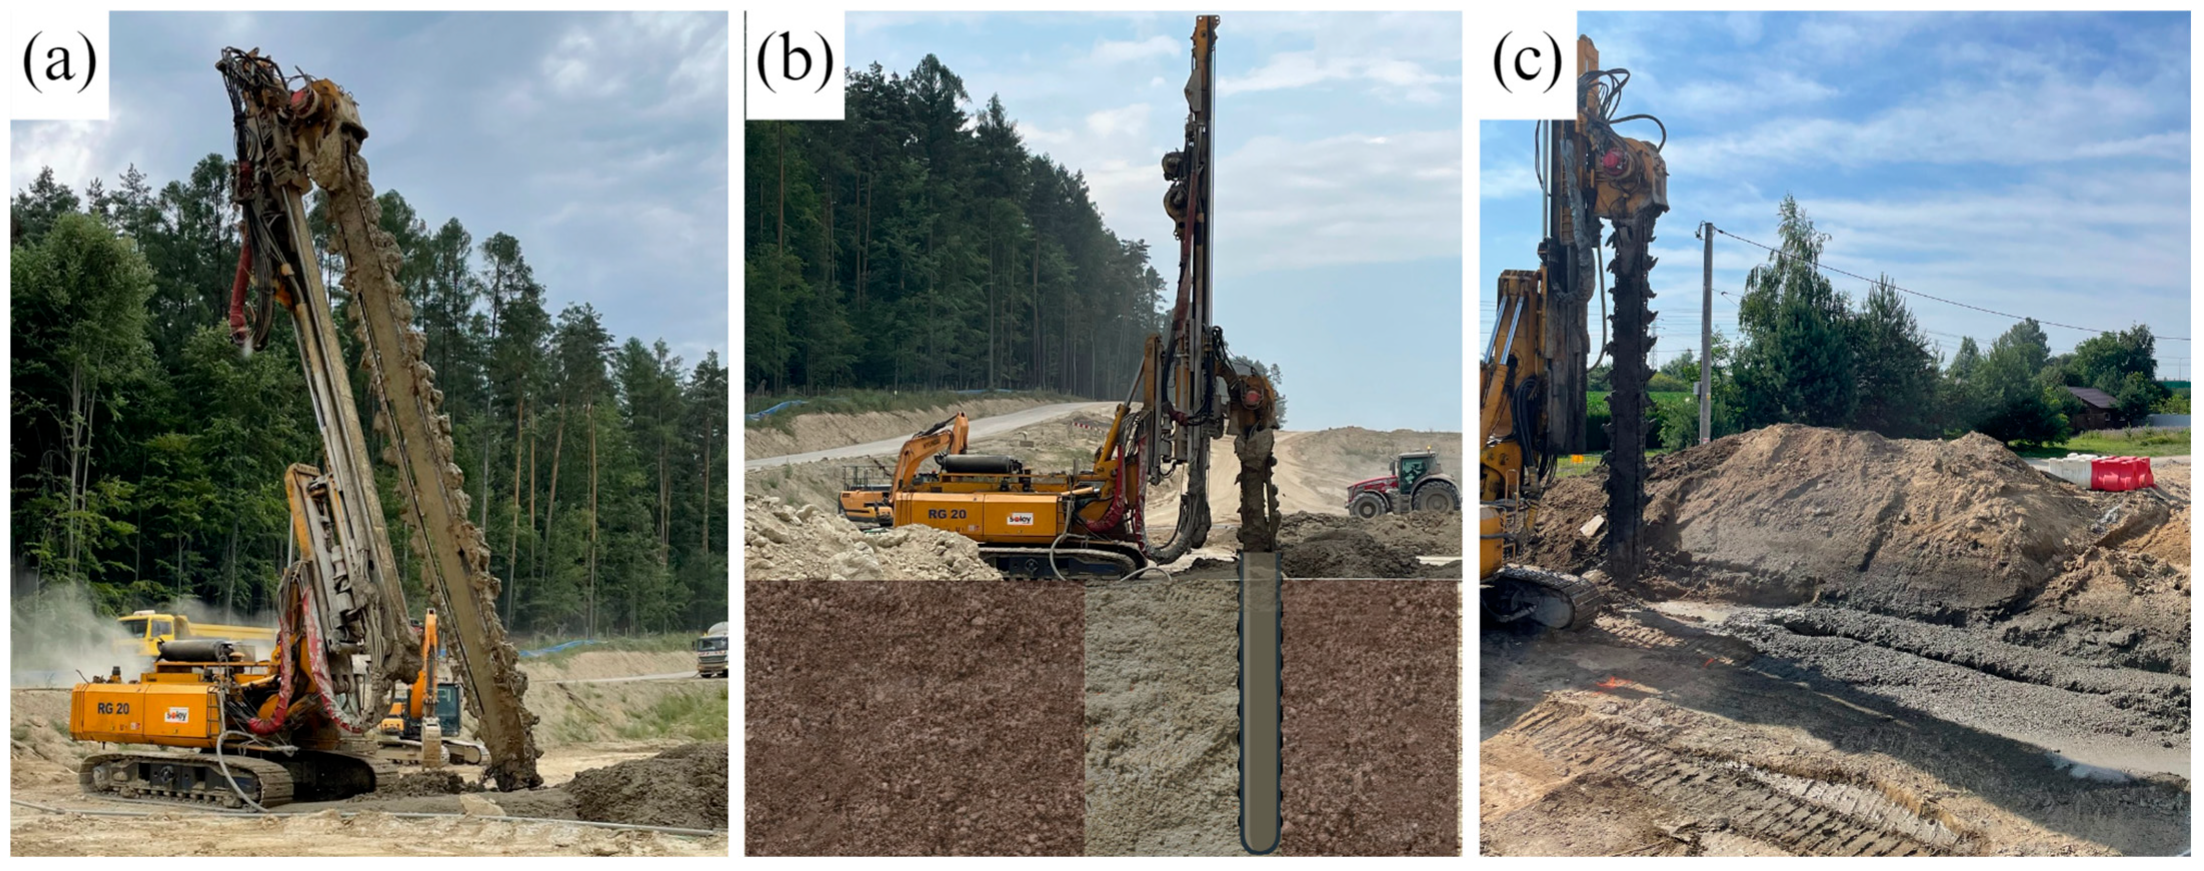
  • Preparation of the trenchmixer work site—clearing the land and removing the topsoil.
  • Positioning the machine along the axis of the barrier (Figure 3a).
  • Beginning of soil excavation (Figure 3b).
  • While the soil is being mixed with the slurry, the device moves at a suitably chosen speed to ensure the continuity of the barrier being constructed.
  • The finished panel (Figure 3c).
Figure 3. The panel construction process. Own elaboration. (a) Positioning the machine along the axis of the barrier; (b) Mixing soil with slurry; (c) The finished panel.
Energies 17 03294 g003
Due to its unique characteristics, the Trenchmix technology is applied in various construction sectors:
  • In hydraulic engineering—for the construction of anti-seepage barriers;
  • In cubature construction—temporary retaining walls;
  • In environmental protection—barriers against the migration of contaminants;
  • In infrastructure—strengthening of the soil substrate under roads and embankments, including railway ones.
Transforming civil engineering practices to align with sustainable development necessitates evaluating the impacts throughout the full life cycle of a project [21,22]. The life cycle of a construction object includes four main stages: the product stage, the construction process stage, the use stage, and the end-of-life stage. In the context of DMMs, the first two stages are particularly significant, as they constitute key elements of environmental assessment and are often the only ones considered. The structures created after the construction process stage do not require further intervention during the use stage, and at the end-of-life stage, most underground constructions typically remain an integral part of the soil or are utilised as foundations for new objects [23]. Among the sources of harmful emissions, the following groups can be distinguished: materials, transport (materials to the construction site—freight, equipment—mobilisation/demobilisation, and workers—transportation), energy, and waste.
Cement, a key material in DMM technologies, is known for its high carbon footprint due to the highly energy-intensive production process, significantly influencing the overall environmental impact of the technology [24]. Furthermore, additional ecological challenges, such as soil alkalisation (impacting ecosystems, urban water runoff, and plant life), highlight the urgency for eco-friendly and sustainable substitutes for cement in order to diminish its CF [25]. Consequently, numerous studies focus on exploring alternative materials (often of waste origin [26]) or modifying the slurry formula to mitigate this impact [27,28]. One such analysis demonstrated that substituting a portion of cement with substitutes like ground granulated blast furnace slag (GGBS), steel slag, or waste concrete powder can lead to a significant reduction in greenhouse gas emissions (GWP). Replacing 60% of Portland CEM I cement with the aforementioned materials resulted in a GWP reduction of 34.7%, 34.5%, and 35.8%, respectively, for a Deep Cement Mixing (DCM) project [29]. Among the sought-after cement substitutes for Deep Dry Soil Mixing (DDSM) technology, GGBS [30], bottom ash, marble dust, and tire rubber powder [31] are notable. Similarly, another study assessing the impact of using cement substitutes for Deep Mixing revealed a 40% reduction in GHG emissions for slag stabilisation and 50% for fly ash compared to traditional cement [32]. The article [33] introduces the Streamlined Energy and Emissions Assessment Model (SEEAM), a methodology for quantifying environmental impacts such as embodied energy (EE) and CO2 emissions in geotechnical construction projects, exemplified by its application to the LPV 111 levee project in New Orleans using DSM techniques.
Focusing solely on the materials used in DMM processes is not always justified. A study [34] comparing various types of foundation projects indicated that 70% of GHG emissions in methods of soil substrate strengthening (without specifying technologies) are due to energy consumption. However, in the carbon footprint analysis for DSM, the main source of emissions is the materials used [35]. Therefore, when assessing different technologies, it is important not to overlook issues related to energy consumption, as the contribution of different emission sources varies depending on the method chosen. Despite the extensive application of CDMM technology in geotechnical engineering, there is a noticeable lack of studies addressing its carbon footprint assessment. Without such evaluations, it is difficult to accurately determine the contributions of various emission sources within CDMM processes. This lack of data hinders the ability to develop effective strategies for emission reduction and improving the environmental sustainability of CDMM technology.
Understanding the specific contributions of energy consumption and material use to the overall carbon footprint of CDMM technology is crucial. This knowledge will be instrumental in identifying key areas where improvements can be made, whether through optimising energy use, selecting more sustainable materials, or implementing more efficient processes. Moreover, having a detailed breakdown of emission sources will support efforts to comply with environmental regulations and achieve sustainability targets within the construction industry. This is particularly important as it demonstrates how the balance of emissions sources can vary widely; for example, materials constitute 64% of emissions in Deep Cement Mixing [29], while in Deep Soil Mixing (DSM) [35], they account for 85%. An integrated approach was employed in research on DSM technology, where attempts to reduce harmful emissions were made through changes in the cement composition and the use of more efficient tools (larger diameter), which allowed for a 40% reduction in greenhouse gas emissions compared to the original project version [36].
Additionally, CDMM technology has the potential to serve as an alternative to other soil substrate strengthening methods such as DSM columns [37], soil replacement [38], Continuous Flight Auger (CFA) piles [39], gravel columns [40], and gravel piles [41]. Therefore, it is important to have an estimated level of emissions to compare its environmental impact with that of other technologies. By understanding the carbon footprint of the CDMM, stakeholders can make informed decisions about adopting this technology as a more sustainable option, potentially replacing more environmentally harmful methods. This comparison is essential for guiding both policy and practical decisions in the pursuit of greener construction practices.
The subject of the study is the slope stabilisation of excavations using a spatial system of soil–cement panels made with CDMM technology. The work is carried out as part of the following task: the “Excavation stability for S1 Dankowice—Suchy Potok road” interchange in Poland. The CDMM panels were designed with a width of 40 cm. CEM II cement was used for their construction, with a water–cement ratio of 1.0. The designed uniaxial compressive strength is 2.0 MPa, achieved on a sample after 56 days of curing. The panels perpendicular to the road axis are installed at intervals of 2.8 m. The depth of the panels was selected so that they are fully contained within the slope of the excavation. In the plan, the panels start 5 m from the upper edge of the slope towards the road axis and end between 0.5 and 2.0 m from the lower edge of the slope. The panels parallel to the road axis are installed at a distance of 4.8 m from the upper edge of the slope towards the road axis, and their depth is equal to the depth of the panels perpendicular to the road axis. Slope stabilisation using soil–cement panels made with CDMM technology provided adequate protection of the area for the construction of the S1 road. The project subjected to analysis is presented in Figure 4. This specific case study was selected because it represents a substantial investment, which allows for a thorough examination of the carbon footprint. Analysing a large-scale project provides a comprehensive perspective that can be useful for understanding the environmental impact of similar future projects.
The aim of this article is to assess the carbon footprint across the entire life cycle of the CDMM panels. Section 2 presents the Materials and Methods, while Section 3 offers the analysis in Results and Discussion. The existing literature lacks comprehensive carbon footprint assessments for this specific technology. Therefore, this work aims to fill that gap in the research. The conducted analysis will also identify the main sources of emissions associated with the CDMM technology, which will help pinpoint key areas for potential reduction and direct future research efforts. This could be significant in light of goals related to reducing greenhouse gas emissions—decarbonisation. Additionally, the analysis was conducted for two types of cement—CEM I and CEM II.

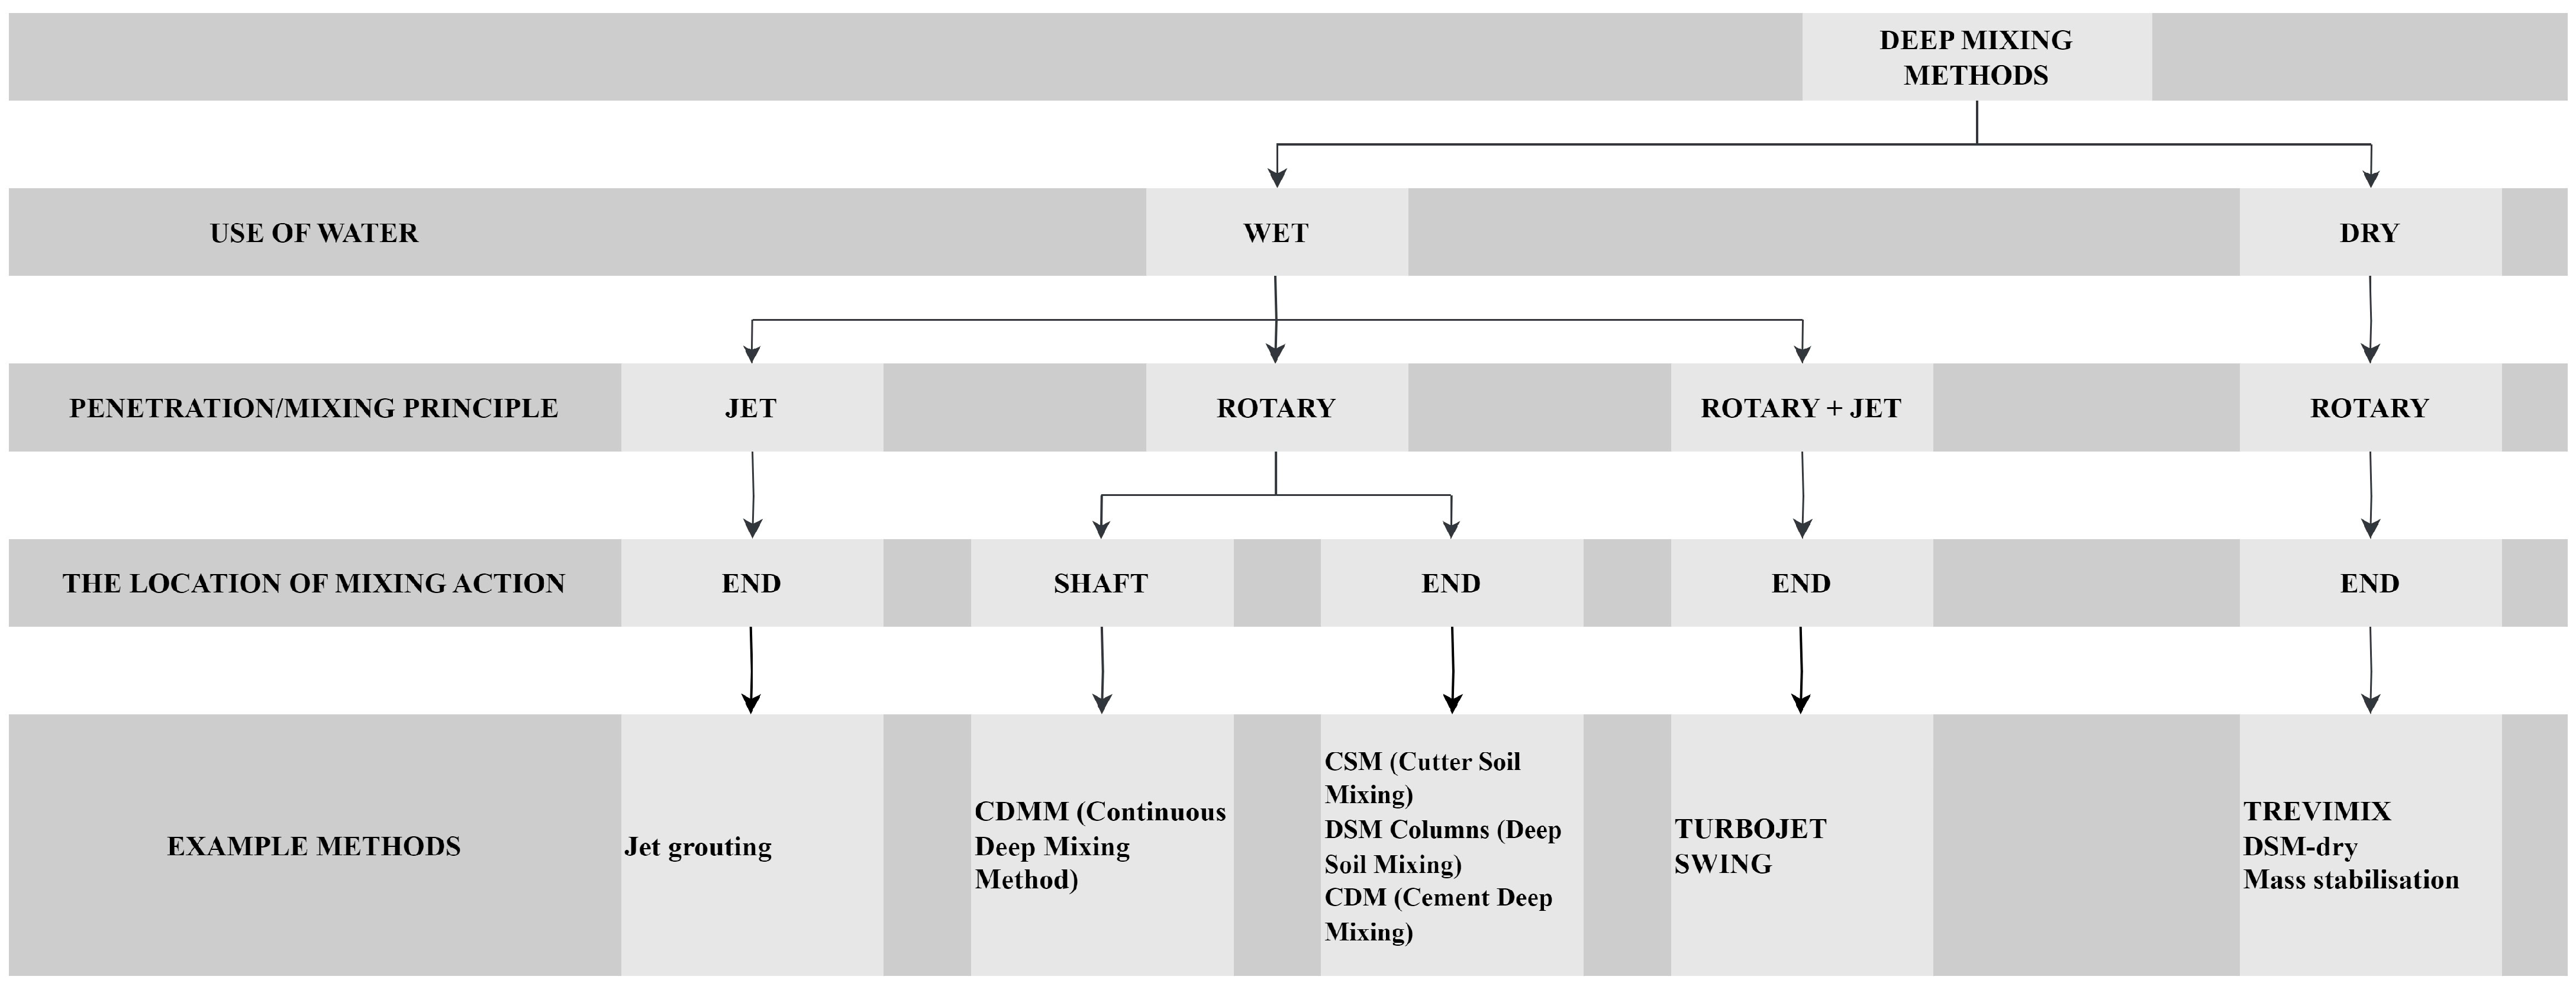
2. Materials and Methods

The carbon footprint assessment was conducted in accordance with ISO 14067:2018 [11], involving four phases: goal and scope definition; life cycle inventory; impact assessment; and result interpretation.
Throughout the preparation of the materials for this article, translation support was utilised from an artificial intelligence (AI) system—ChatGPT-4 [42]—developed by OpenAI. To ensure the precision of the translations, all results underwent additional verification and correction by the research team.

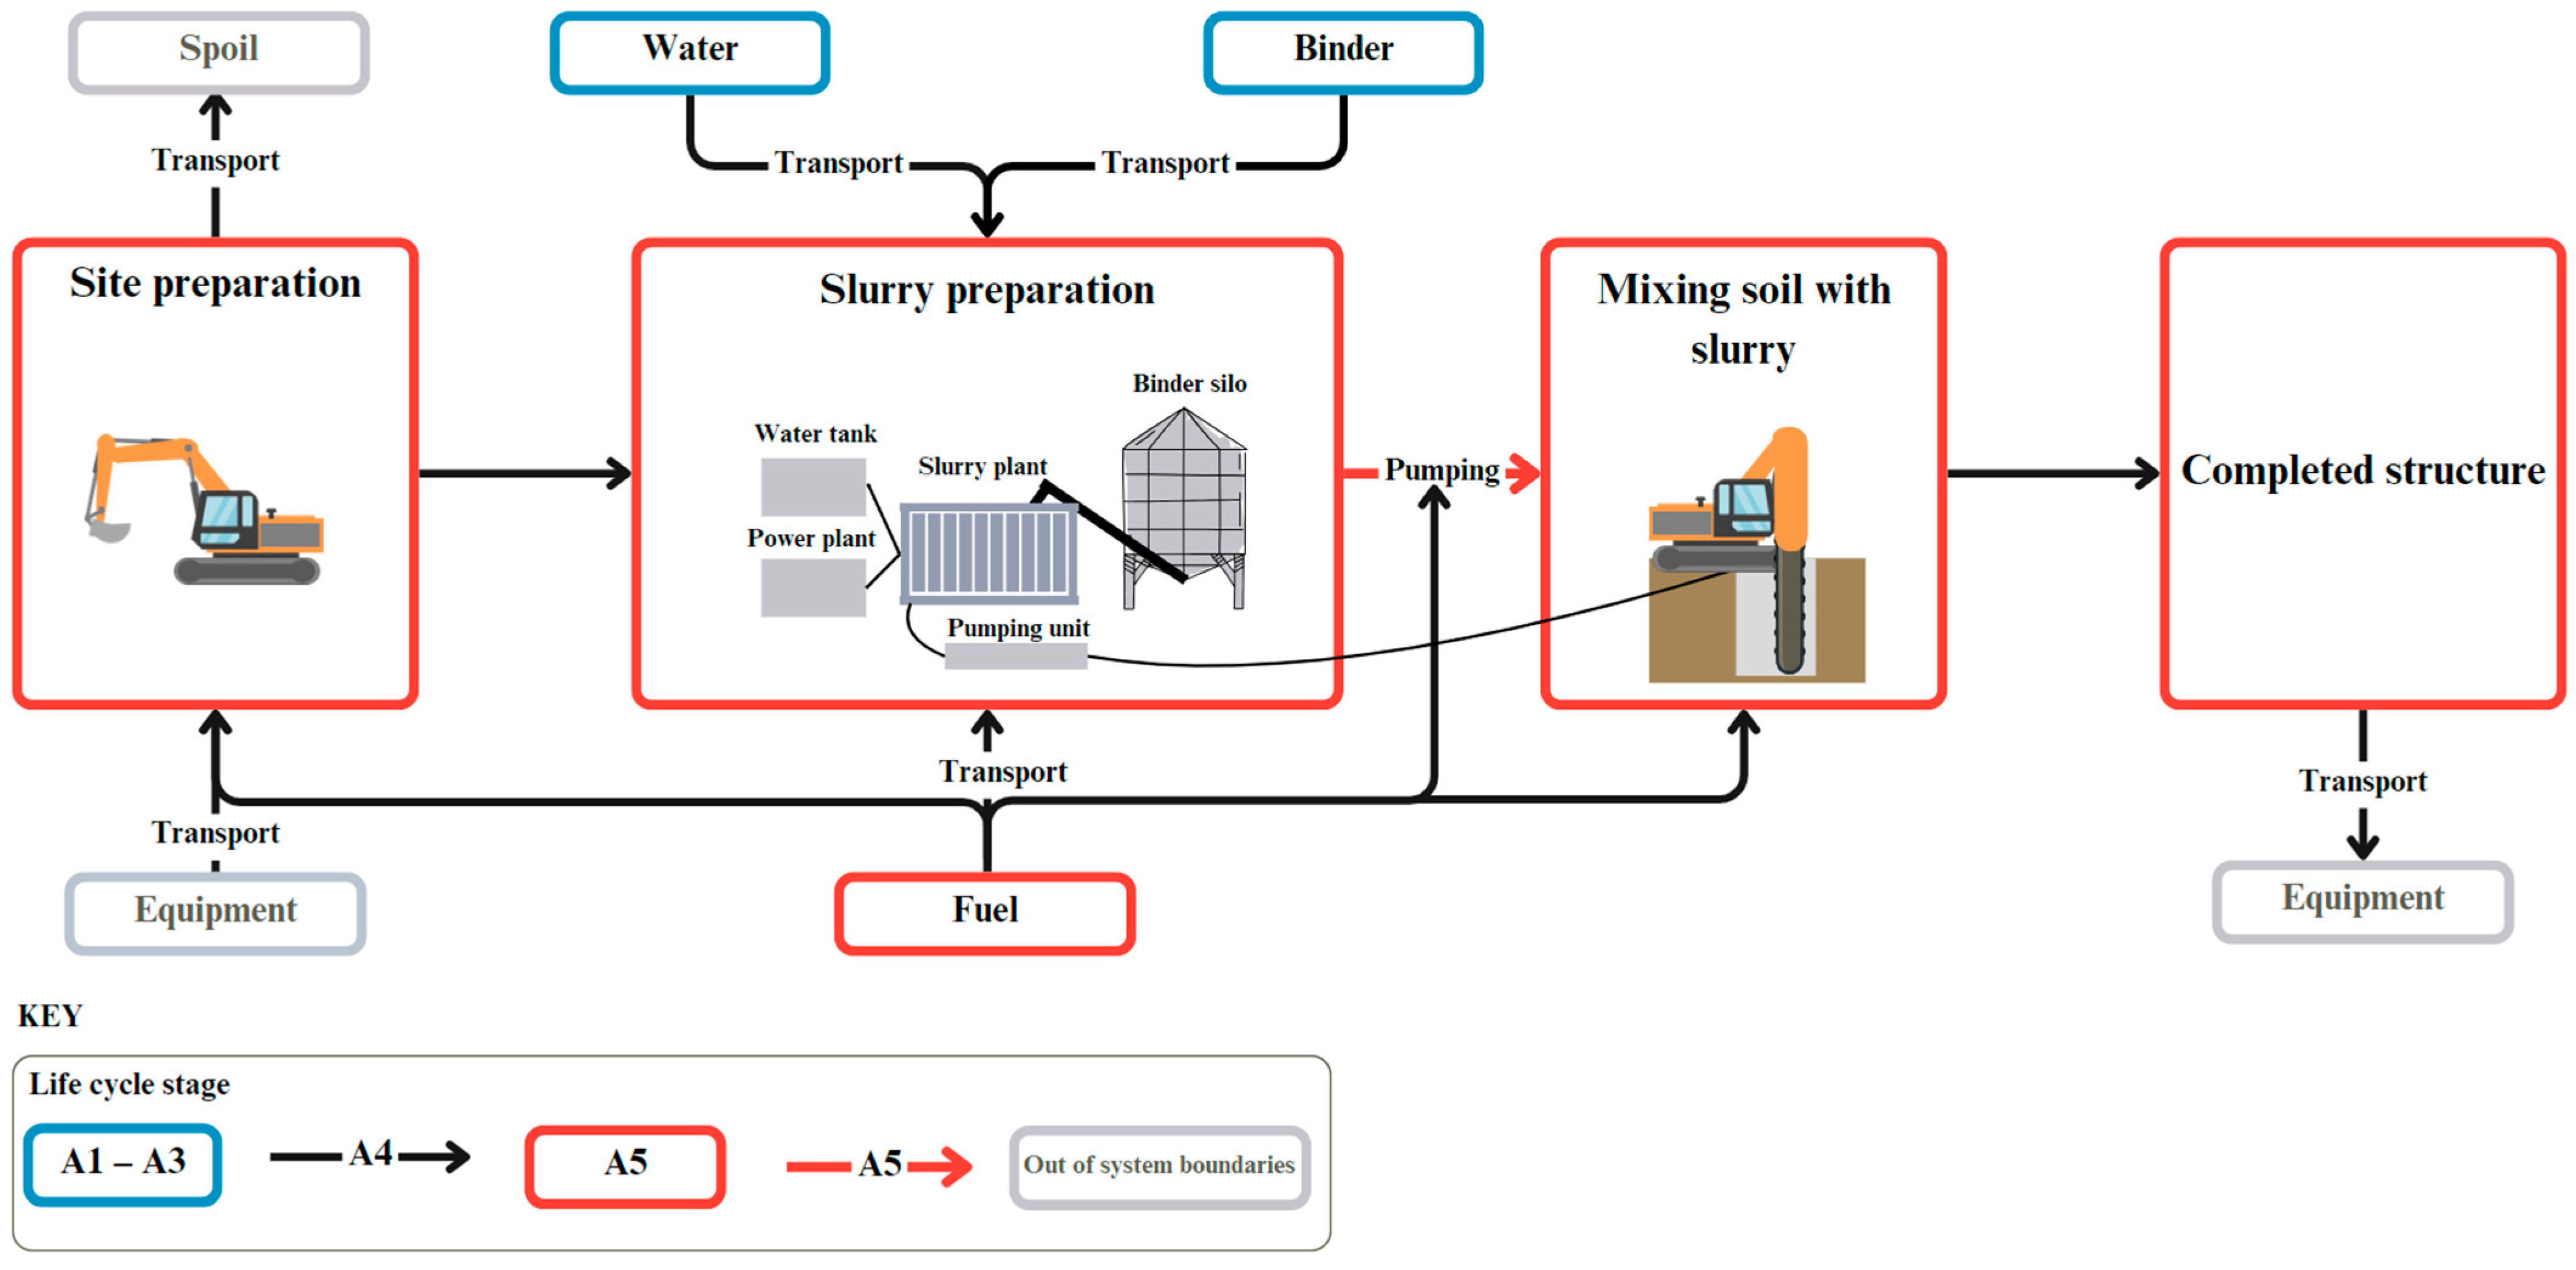
2.1. Goal and Scope Definition

The subject of the analysis is an investment involving the construction of panels with a total area of approximately 18,370 m2 and a thickness of 0.4 m. The functional unit (FU) is 1 m3 of a CDMM panel. The study analysed two variants of the investment execution: the use of CEM II (as in the actual investment) and an alternative variant using CEM I. The difference concerned only the type of material, while the other parameters of the analysis (amount of material, fuel consumption, etc.) remained unchanged.
The assessment covered the entire life cycle of the CDMM panels (cradle to grave), assuming that phases B and C do not require any processes. Therefore, the CF assessment measures up to considering emissions related to the following:
  • The production of materials (A1–A3)—water, binder;
  • Transport (A4) of equipment (mobilisation, demobilisation), water, binder, fuel;
  • The construction process (A5)—site preparation, production of the cement slurry, panel construction.
The system boundaries of this study are illustrated in Figure 5.

2.2. Inventory Analysis and Impact Assessment

The inventory data used in the analysis are based on actual consumption and data collected by the contractor of the CDMM panels. This includes detailed records such as invoices, material purchase records, and energy usage logs. Data collection relied on various operational logs and consumption records maintained throughout the duration of the project. Specifically, daily consumption register reports were utilised.
The calculation of the potential impact on climate change from each greenhouse gas (GHG) emitted or absorbed by the product system is to be carried out by multiplying the quantity of GHG emitted or absorbed by its 100-year Global Warming Potential (GWP) (Table 1) as specified by the IPCC [43].
The total carbon footprint CF (Equation (1)) for the complete life cycle of the CDMM panels is determined as the quotient of the sum of individual CFi values across the specified ranges A1–A5 by the overall volume (V) of the panels in the structure.
C F = i = A 1 A 5 ( C F i ) V [ k g C O 2 e m 3 ]
The analysis utilised the following data sources:
  • Environmental Product Declarations (EPDs);
  • JEC Well-to-Tank Report V5 [44];
  • EMEP/EEA air pollutant emission inventory guidebook 2023—1.A.3.b.i–iv Road transport [45];
  • EMEP/EEA air pollutant emission inventory guidebook 2023—1.A.4 Non-road mobile machinery 2023 [46].

2.2.1. The Production of Materials (A1–A3)

The data used for the assessment of the production phase (A1–A3) are presented in Table 2. The total emission CFA1–A3 (Equation (1)) is equal to the sum of the products of the individual emissions CFj for the materials used and their demand qj.
C F A 1 A 3 = j = 1 n C F j · q j   [ k g C O 2 e ]

2.2.2. Transport (A4)

The impact of transport CFA4 was assessed according to the Well-to-Wheel model (Equation (3)) [49]. This includes all greenhouse gas emissions from the production, transportation, transformation (Well-to-Tank—CFWTT), and distribution of the fuel used to power the vehicle, as well as those from fuel combustion (Tank-to-Wheels—CFTTW). The indicator for diesel CFWTT is 0.679 kgCO2e/L [44].
C F A 4 = C F W T T · F C + C F T T W A 4   [ k g C O 2 e ]
Here, FC is the total fuel consumption (diesel).
To estimate the emissions associated with fuel combustion CFTTWA4, the Tier 2 Methodology according to the EMEP/EEA air pollutant emission inventory guidebook 2023 1.A.3.b.i–iv Road transport (Equation (4)) [45] was utilised. The method classifies emissions based on the vehicle category k, fuel type m, and engine technology l. Engine classes are in accordance with EU legislation on permissible emission standards.
C F T T W A 4 = p G W P 100 p · E p = p [ G W P 100 p · k l E p , k , l · l k , l + m k l E p , m , k , l · F C m , k , l ]   [ k g C O 2 e ]
Here, p is the pollution type; Ep the mass of emissions of pollutant p during the inventory period; Ep,k,l the technology-specific emission factor of pollutant p for vehicle category k and technology l; lk,l the total distance driven by all vehicles of category k and technology l; Ep,m,k,l the emission factor of pollutant p for fuel type m consumption, vehicle category k, and technology l; and FCm,k,l the fuel consumption for vehicle category k and technology l.
The data used in the analysis are presented in Table 3.

2.2.3. The Construction Process (A5)

The emissions from equipment operation CFA5 were determined in a manner similar to that for transportation, using the Well-to-Wheel model (Equation (5)). To estimate emissions associated with fuel combustion CFTTWA4, the Tier 2 Methodology (Equation (6)) according to the EMEP/EEA air pollutant emission inventory guidebook 2023—1.A.4 Non-road mobile machinery 2023 [46] was utilised. The method classifies emissions based on the type of equipment NFR Sector (1.A.2.g vii—Mobile combustion in manufacturing industries and construction), fuel type m (diesel), and off-road equipment technology t (Table 4). Engine classes are in accordance with EU legislation on permissible emission standards.
C F A 5 = C F W T T · F C + C F T T W A 5   [ k g C O 2 e ]
C F T T W A 5 = p ( G W P 100 p · E p ) = p ( G W P 100 p · m t F C m , t · E F p , m , t )   [ k g C O 2 e ]
Here, FCm,t is the fuel consumption of fuel type m by equipment category and of technology type t, and EFp,m,t is the average emission factor for pollutant p for fuel type m for equipment category and of technology type t.

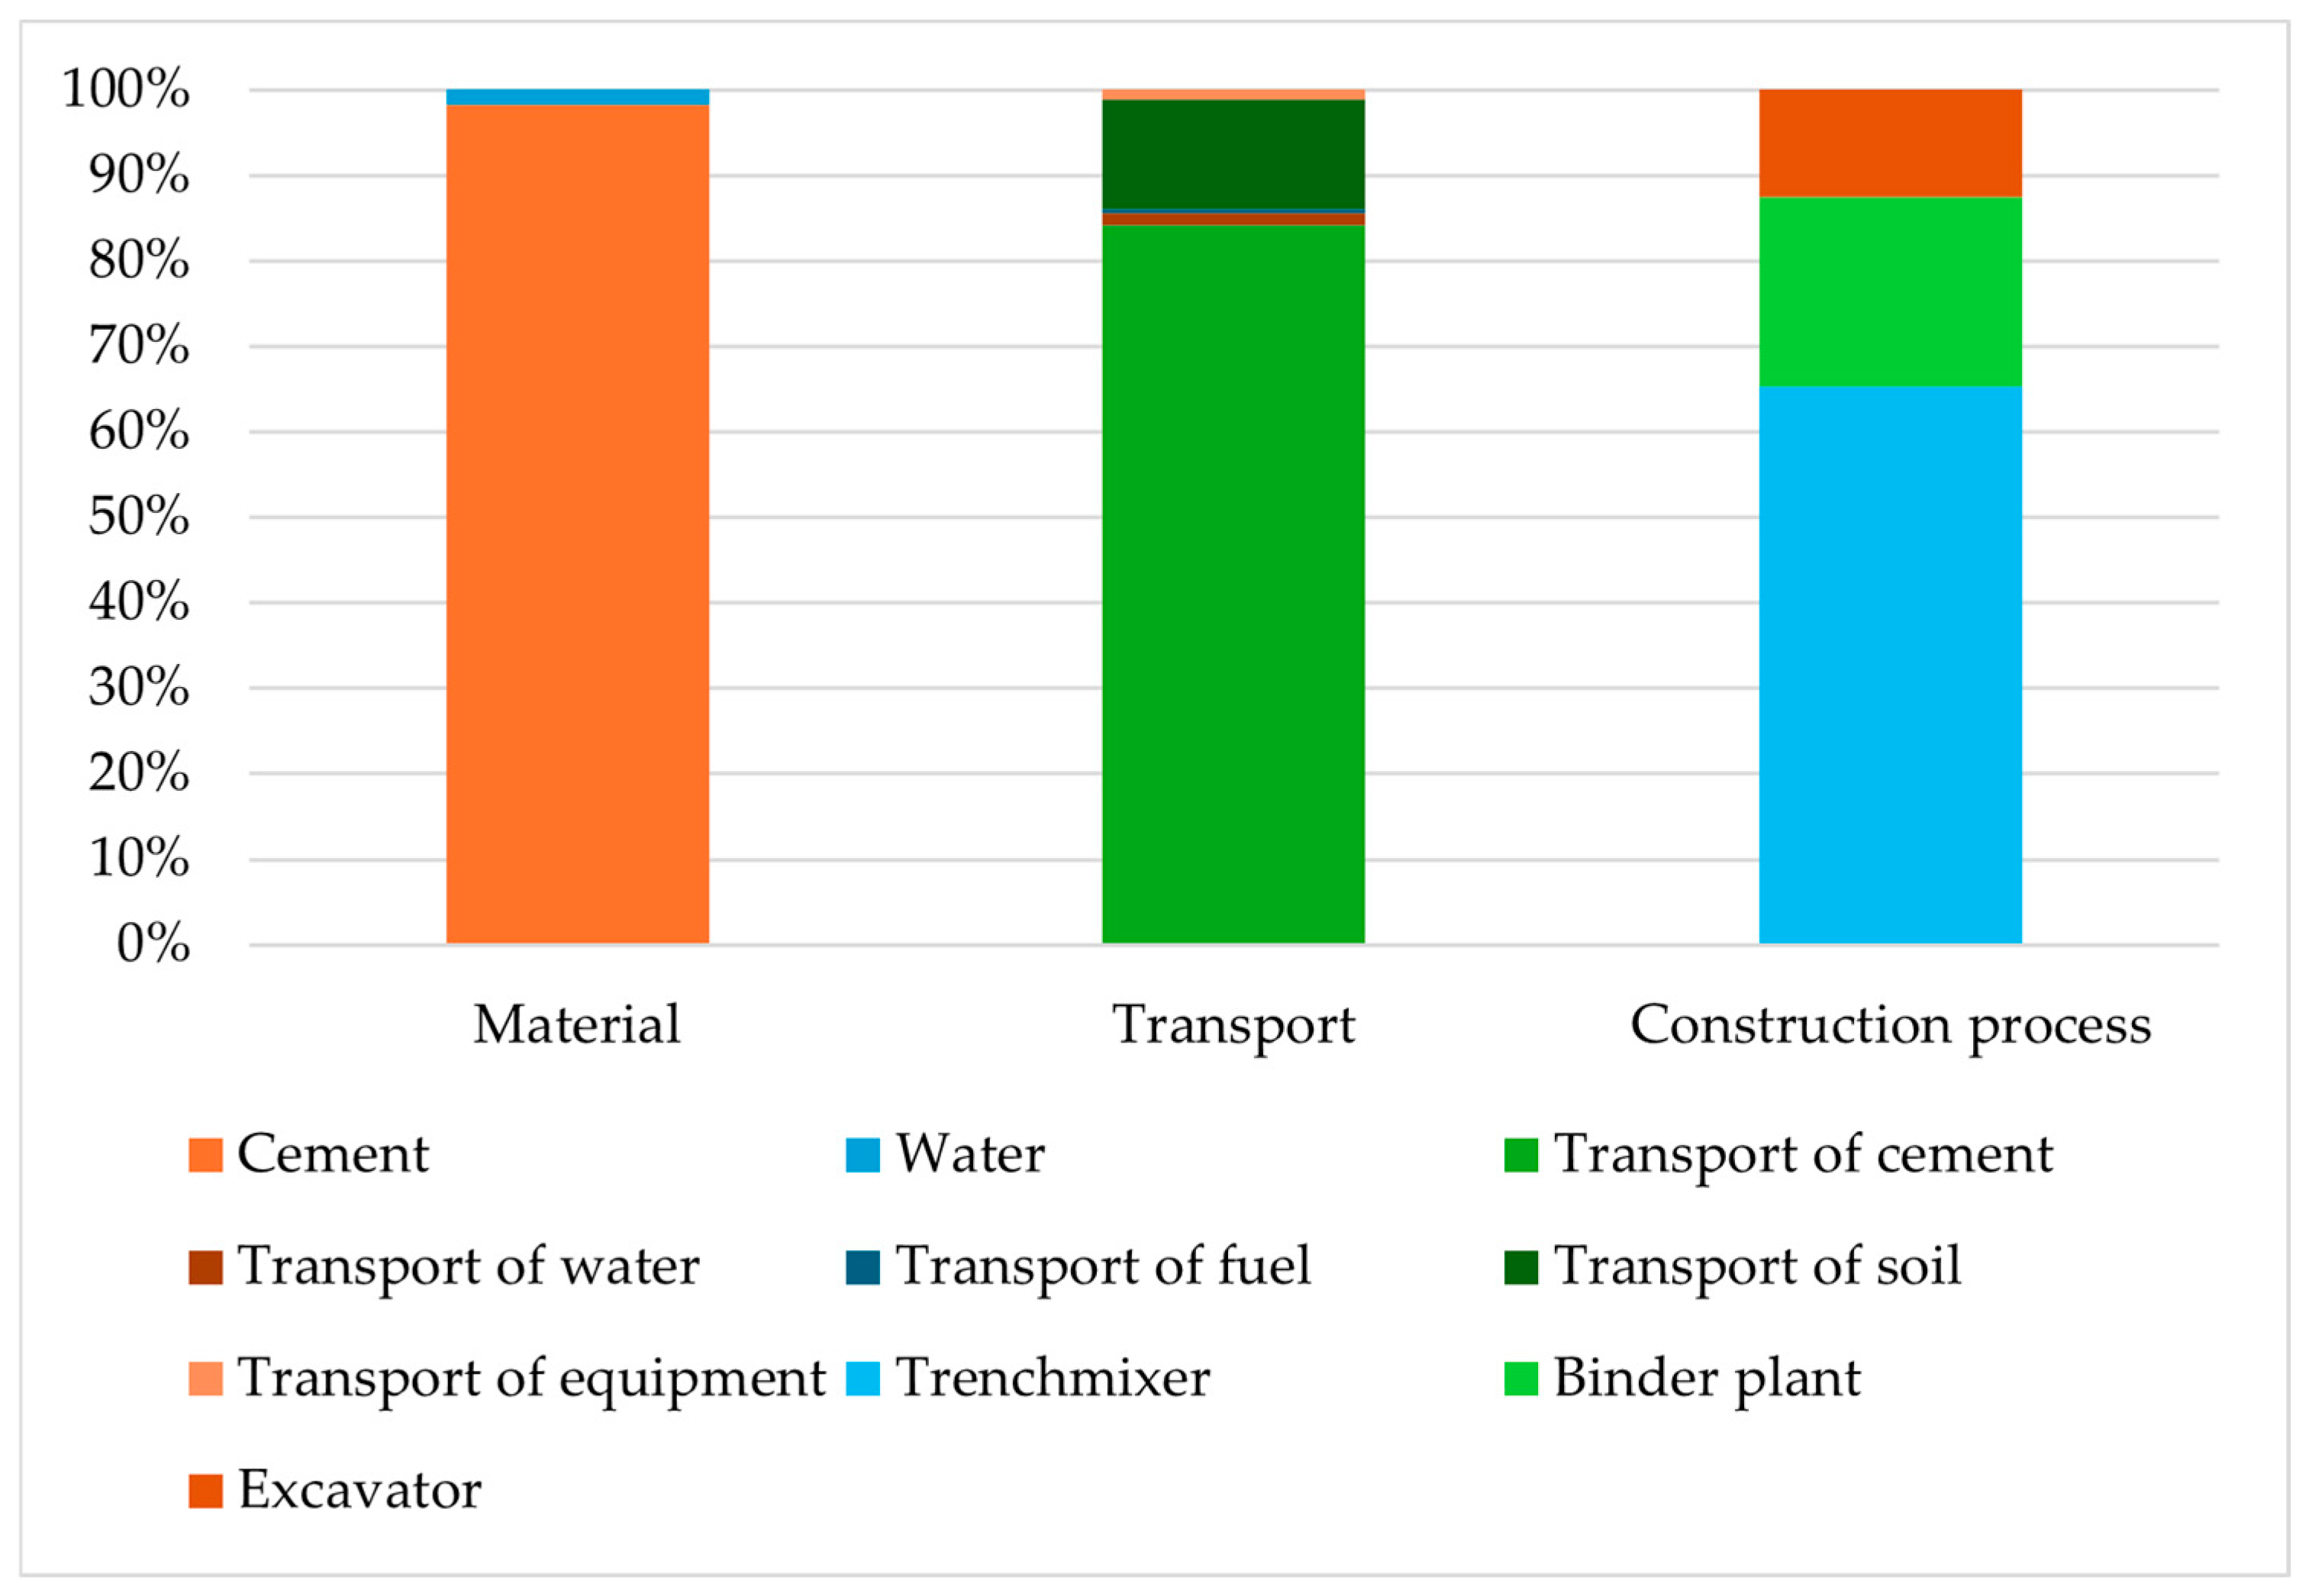
3. Results and Discussion

The total CF for the assessed construction amounted to 1.43 × 10⁶ kgCO2e (for CEM II) and 1.75 × 10⁶ kgCO2e (for CEM I), which translates to 194 kgCO2e (for CEM II) and 238 kgCO2e (for CEM I) per cubic meter when calculated per functional unit (Figure 6). This means that the CO2e emissions for CEM I are approximately 23% higher than for CEM II.
The primary source of GHG emissions, accounting for as much as 91%, is from the materials consumed (for CEM II). This high percentage indicates that optimising the composition of materials could provide the most substantial benefits in reducing emissions. The comparison between CEM I and CEM II clearly demonstrates that selecting a lower-emission cement can yield significant results in terms of reducing the carbon footprint. Additionally, other sources of emissions such as energy, transport, mobilisation, and demobilisation contribute relatively little to the overall emissions in CDMM technology. This suggests that focusing on reducing material-related emissions should be the primary strategy for mitigating the carbon footprint of the CDMM.
Since the only difference concerns the type of material, while other analysis parameters (fuel consumption, transportation, etc.) remain unchanged, the following sections of the work present the discussion of the results for CEM II (due to its use in the actual project).
A results comparison to other assessments of DMM group technologies is presented in Table 5. In all analysed studies, materials were the main component of the carbon footprint [35,36,50], while other emissions were considered less significant. An exception is the study [29], where emissions related to equipment use also qualified as relatively significant. In comparison to the CDMM, other technologies have a larger share of emissions related to processes, transport, and energy, which means their emission reduction strategies need to be more diversified. The significant resource efficiency of the CDMM (generally DMM) is associated with mixing concrete-like material directly in the ground by using in situ soil as an aggregate, thus saving not only on transporting concrete to the construction site but also on transporting excavated material off-site [50,51].
There is a noticeable challenge in making comparisons due to the diversity of functional units or the absence of their definitions/conversion values. Functional units are key in life cycle analyses (LCAs) because they provide a baseline to which inputs and outputs are normalised, enabling meaningful comparisons between different technologies or processes [1,52]. In the context of Table 5, functional units are varied or sometimes undefined, making direct comparisons difficult. Therefore, a discussion of the results is left only at the stage of percent shares of individual emission sources. Normalising emissions to a common unit, such as m3 or tons of stabilised soil, could provide clearer conclusions and make it easier to choose among several possible options. Addressing this issue through standardisation, conversion metrics, and a comprehensive LCA framework will allow for more accurate and meaningful comparisons, which will ultimately help make better decisions about sustainable construction practices.
Figure 7 illustrates the breakdown of emission sources within the materials group (A1–A3), transport (A4), and equipment (A5). Analysing the contribution of each element to GHG emissions facilitates the identification of the main emission sources in the Trenchmix process. Cement has the largest share in emissions, highlighting its significance in the context of its impact on the carbon footprint. Existing research on alternative materials and cement production methods provides a solid foundation for implementing innovative solutions. Their practical application can lead to GHG emission reduction, increase energy efficiency, and promote sustainable growth in the construction industry. Even a change in the type of cement used, as shown by the comparison between CEM I and CEM II, can significantly reduce emissions, demonstrating the potential for substantial environmental benefits. Applying these research findings will accelerate progress towards achieving sustainable development goals, contributing to the adoption of more eco-friendly engineering practices in the construction sector. Variations in the share of different GHG emission sources may not only result from technological differences but also from a wide range of factors characteristic of a particular region, such as energy mixes, energy policy, the availability of raw materials, and geographic and climatic conditions. A country utilising a larger share of renewable energy might generate lower GHG emissions related to energy production, which translates into a lower CF value in industrial processes, e.g., cement production. A comparison of CF emissions for CEM II group cements in different countries is presented in Table 6.
Analysing the processes occurring during the construction phase, it is important to note that the operation of the trenchmixer represents one of the main sources of emissions resulting from equipment use. Similar to the emissions associated with cement, their magnitude can vary depending on the specific project, particularly in the context of the diversity of the machinery fleet characteristic of a given company (age, technology, or degree of utilisation). Data shortages and a reliance largely on general assumptions rather than actual measurements can lead to significant discrepancies. This is a crucial issue since standards for estimating emissions often do not rely on actual measurements [58]. Therefore, it is important to consider this issue when analysing the study results and to continue working on developing consistent measurement methodologies. Despite the authors’ reliance on models concerning fuel combustion, an undeniable advantage of the conducted study is that the inventory data come from an actual implementation. This provides more reliable and representative information about the carbon footprint.
In contrast to building materials, for which Environmental Product Declarations (EPDs) are available, data on emissions related to the use of construction equipment and transportation are often limited in access, outdated, or require payment. The necessity of incurring additional costs and the effort involved in finding the relevant data can discourage the conduct of thorough and fully reliable analyses [59]. An example of good practice is the ministry in the United Kingdom [60], which makes spreadsheets with methodology and regularly updated emission data publicly available. Such initiatives can encourage more comprehensive and accurate environmental analyses by increasing the availability and transparency of data and reducing the costs and effort associated with their acquisition.

4. Conclusions

The aim of this article was to assess the carbon footprint of the CDMM technology, which demonstrated the following:
  • The total CF for the assessed construction translates to 194 kgCO2e (for CEM II) and 238 kgCO2e (for CEM I) per cubic meter when calculated per functional unit;
  • The presented CF results are significant from the perspective of the CDMM’s value as a potential alternative to other DMMs in the context of seeking solutions compliant with integrated design;
  • An undeniable advantage of the conducted study is that the inventory data come from an actual implementation. This provides more reliable and representative information about the carbon footprint;
  • The analysis demonstrated that the primary source of greenhouse gas (GHG) emissions in CDMM technology is materials (91%), particularly cement. Other sources of emissions, such as energy, transport, mobilisation, and demobilisation, contribute relatively little to the overall emissions. This suggests that the main strategy for emission reduction should focus on materials and the need to implement CF reduction practices proposed in many studies;
  • There are observed gaps in the generally available and current databases for a given country regarding emissions related to the operation of construction equipment and logistic processes, which undeniably complicates the promotion and credible environmental assessments in any construction investment.

Author Contributions

Conceptualisation, A.M. and M.S.; methodology, A.M. and M.S.; validation, A.M. and M.S. formal analysis, A.M. and M.S.; investigation, A.M. and M.S.; resources, A.M. and M.S.; data curation, A.M. and M.S.; writing—original draft preparation, A.M. and M.S.; writing—review and editing, A.M. and M.S.; visualisation, A.M. and M.S. All authors have read and agreed to the published version of the manuscript.

Funding

This research received no external funding.

Data Availability Statement

The data that support the findings of this study are available from the corresponding author upon request.

Acknowledgments

The artificial intelligence (AI)system—ChatGPT—developed by OpenAI, was utilised for translation support in the preparation of the materials for this article.

Conflicts of Interest

The authors declare no conflicts of interest.

References

  1. Song, X.; Carlsson, C.; Kiilsgaard, R.; Bendz, D.; Kennedy, H. Life Cycle Assessment of Geotechnical Works in Building Construction: A Review and Recommendations. Sustainability 2020, 12, 8442. [Google Scholar] [CrossRef]
  2. Raymond, A.J.; Kendall, A.; DeJong, J.T. Life Cycle Sustainability Assessment (LCSA): A Research Evaluation Tool for Emerging Geotechnologies. In Proceedings of the Geo-Congress 2020: Biogeotechnics (GSP 320), Minneapolis, MN, USA, 25–28 February 2020; American Society of Civil Engineers: Reston, VA, USA, 2020; pp. 330–339. [Google Scholar] [CrossRef]
  3. Sugade, O.; Dalvi, R.; Vyas, G. Sustainability Metrics for Ground Improvement Techniques. Proc. Sustain. Infrastruct. Dev. Manag. 2019. [Google Scholar] [CrossRef]
  4. De Melo, D.L.; Kendall, A.; Dejong, J.T. Evaluation of Life Cycle Assessment (LCA) Use in Geotechnical Engineering. Environ. Res. Infrastruct. Sustain. 2024, 4, 12001. [Google Scholar] [CrossRef]
  5. European Council. Fit for 55: Delivering on the Proposals. Available online: https://commission.europa.eu/strategy-and-policy/priorities-2019-2024/european-green-deal/delivering-european-green-deal/fit-55-delivering-proposals_en (accessed on 8 April 2024).
  6. Atradius, N.V. Industry Trends Construction Credit Risk Outlook Clouded by High Levels of Uncertainty. Available online: www.atradius.com (accessed on 2 January 2024).
  7. Blumberg, G.; Sibilla, M. A Carbon Accounting and Trading Platform for the UK Construction Industry. Energies 2023, 16, 1566. [Google Scholar] [CrossRef]
  8. Sbahieh, S.; Zaher Serdar, M.; Al-Ghamdi, S.G. Decarbonization Strategies of Building Materials Used in the Construction Industry. Mater. Today Proc. 2023. [Google Scholar] [CrossRef]
  9. Jaglan, A.K.; Korde, N. Capturing the Opportunity for Decarbonization in the Construction Industry: Emission-Free, Effective, and Resilient Solutions. Eng. Proc. 2023, 53, 1. [Google Scholar] [CrossRef]
  10. Kaboré, A.; Maref, W.; Ouellet-Plamondon, C.M. Hygrothermal Performance of the Hemp Concrete Building Envelope. Energies 2024, 17, 1740. [Google Scholar] [CrossRef]
  11. ISO 14067:2018; Greenhouse Gases—Carbon Footprint of Products—Requirements and Guidelines for Quantification. International Organization for Standardization: Geneva, Switzerland, 2018.
  12. Lopes, R.; Silva, D.; Rivero-Camacho, C.; Rusu, D.; Marrero, M. Methodology for Improving the Sustainability of Industrial Buildings via Matrix of Combinations Water and Carbon Footprint Assessment. Sustainability 2022, 14, 15297. [Google Scholar] [CrossRef]
  13. Benalcázar-Murillo, D.; Vilcekova, S.; Pardo, M.Á. Analysis of Equivalent CO2 Emissions of the Irrigation System—A Case Study. Sustainability 2023, 15, 16240. [Google Scholar] [CrossRef]
  14. Kitazume, M.; Terashi, M. The Deep Mixing Method; CRC Press/Balkema: London, UK, 2013. [Google Scholar]
  15. Denies, N.; Huybrechts, N. Deep Mixing Method: Equipment and Field of Applications. In Ground Improvement Case Histories Chemical, Electrokinetic, Thermal and Bioengineering; Butterworth-Heinemann: Oxford, UK, 2015; pp. 311–350. ISBN 9780081002384. [Google Scholar]
  16. Bruce, A.; Geosystems, E.C.O. An Introduction to the Deep Soil Mixing Methods as Used in Geotechnical Applications; Federal Highway Administration. Office of Infrastructure Research and Development: Washington, DC, USA, 2000. [Google Scholar]
  17. Guimond-Barrett, A. Influence of Mixing and Curing Conditions on the Characteristics and Durability of Soils Stabilised by Deep Mixing. Ph.D. Thesis, Géotechnique, Université du Havre, Le Havre, France, 2013. [Google Scholar]
  18. Głowacki, P.; Chmielewski, M. Trenchmix—Technology for Strengthening the Ground Medium under Road and Railway Embankments. NBI 2017, 4, 64–66. (In Polish) [Google Scholar]
  19. Hoffmann, M. Geomix Trenchmix—Innovative Technologies of Deep Soils Mixing by Soletanche Polska. GTMT 2008, 2, 68–72. (In Polish) [Google Scholar]
  20. Hanke, R.; Trybocka, K.; Jończyk-Szostek, M.; Kanty, P. Innowacyjna Technologia Gruntu. Mater. Bud. 2020, 2, 16–18. [Google Scholar] [CrossRef]
  21. Purdy, C.M.; Raymond, A.J.; Dejong, J.T.; Kendall, A.; Krage, C.; Sharp, J. Life-Cycle Sustainability Assessment of Geotechnical Site Investigation. Can. Geotech. J. 2022, 59, 863–877. [Google Scholar] [CrossRef]
  22. Wałach, D.; Sagan, J.; Jaskowska-Lemańska, J.; Dybeł, P. Comparative Analysis of Environmental Impacts of Municipal Road Structures. In Infrastructure and Environment; Krakowiak-Bal, A., Vaverkova, M., Eds.; Springer: Cham, Switzerland, 2019; pp. 9–14. [Google Scholar]
  23. Mach, A.; Wałach, D. Implementation of Integrated Life Cycle Design Principles in Ground Improvement and Piling Methods—A Review. Sustainability 2024, 16, 659. [Google Scholar] [CrossRef]
  24. Belaïd, F. How Does Concrete and Cement Industry Transformation Contribute to Mitigating Climate Change Challenges? RCR Adv. 2022, 15, 200084. [Google Scholar] [CrossRef]
  25. Chang, I.; Lee, M.; Cho, G.C. Global CO2 Emission-Related Geotechnical Engineering Hazards and the Mission for Sustainable Geotechnical Engineering. Energies 2019, 12, 2567. [Google Scholar] [CrossRef]
  26. Li, Y.; Eyley, S.; Thielemans, W.; Yuan, Q.; Li, J. Valorization of Deep Soil Mixing Residue in Cement-Based Materials. Resour. Conserv. Recycl. 2022, 187, 106597. [Google Scholar] [CrossRef]
  27. Wałach, D.; Mach, A. Effect of Concrete Mix Composition on Greenhouse Gas Emissions over the Full Life Cycle of a Structure. Energies 2023, 16, 3229. [Google Scholar] [CrossRef]
  28. Walach, D. Economic and Environmental Assessment of New Generation Concretes. IOP Conf. Ser. Mater. Sci. Eng. 2020, 960, 042013. [Google Scholar] [CrossRef]
  29. Kravchenko, E.; Lu, W.; Sauerwein, M.; Wong, A.H.K. Life Cycle Assessment of Waste Materials in Deep Cement Mixing for Land Reclamation in Hong Kong. Environ. Impact. Assess. Rev. 2024, 105, 107398. [Google Scholar] [CrossRef]
  30. Sargent, P.; Hughes, P.N.; Rouainia, M. A New Low Carbon Cementitious Binder for Stabilising Weak Ground Conditions through Deep Soil Mixing. Soils Found. 2016, 56, 1021–1034. [Google Scholar] [CrossRef]
  31. Al-Subari, L.; Hilal, A.; Ekinci, A. Life Cycle Assessment of Soil Stabilization Using Cement and Waste Additives. Constr. Build. Mater. 2023, 403, 133045. [Google Scholar] [CrossRef]
  32. Koch, E.; Major, Z.; Szigeti, C. Investigating the Ecological Footprint of Deep Mixing. Chem. Eng. Trans. 2023, 107, 349–354. [Google Scholar] [CrossRef]
  33. Shillaber, C.M.; Mitchell, J.K.; Dove, J.E. Energy and Carbon Assessment of Ground Improvement Works. II: Working Model and Example. J. Geotech. Geoenviron. 2016, 142, 04015084. [Google Scholar] [CrossRef]
  34. Chang, N. Sustainability in Geotechnical Construction. Available online: https://www.keller-africa.co.za/news/sustainability-geotechnical-construction (accessed on 12 June 2023).
  35. Topolnicki, M. Ground Improvement Instead of Piling—Effective Design Solutions for Heavily Loaded Structures. In Proceedings of the International Conference on Deep Foundations and Ground Improvement, Rome, Italy, 5–8 June 2018; pp. 1128–1137. [Google Scholar]
  36. Selvaraju, S.; Tang, C.; Raj, D. Effective Ways to Reduce Carbon Footprint in a Deep Soil Mixing Solution—A Case Study from Singapore. In Proceedings of the Conference on Foundation Decarbonization and Re-Use, Amsterdam, The Netherlands, 21–23 March 2023. [Google Scholar]
  37. Egorova, A.A.; Rybak, J.; Stefaniuk, D.; Zajączkowski, P. Basic Aspects of Deep Soil Mixing Technology Control. IOP Conf. Ser. Mater. Sci. Eng. 2017, 245, 022019. [Google Scholar] [CrossRef]
  38. Kurochkina, V.; Yakovleva, I. Effectiveness of the Method of Soil Substitution under the Foundations during the Construction of a Secondary School. E3S Web. Conf. 2019, 135, 03032. [Google Scholar] [CrossRef]
  39. Gurpersaud, N.; Shah, F.R. The Application and Development of Continuous Flight Auger (CFA) Piles in the Prairies. In Proceedings of the Geo-Virtual conference Resilience and Innovation, Calgary, AB, Canada, 14–16 September 2020. [Google Scholar]
  40. Jayapal, J.; Rajagopal, K. A Short Review of Geosynthetic Granular Column Treatment of Soft Clay Soils. In Lecture Notes in Civil Engineering; Springer: Berlin/Heidelberg, Germany, 2019; Volume 14, pp. 373–380. [Google Scholar]
  41. Ter-Martirosyan, Z.G.; Ter-Martirosyan, A.Z.; Angelo, G.O. Interaction of Gravel Piles with the Surrounding Soil and Raft. Soil Mech. Found. Eng. 2019, 56, 151–156. [Google Scholar] [CrossRef]
  42. OpenAI. ChatGPT. Available online: https://openai.com/index/chatgpt/ (accessed on 26 June 2024).
  43. Forster, P.; Alterskjaer, K.; Smith, C.; Colman, R.; Damon Matthews, H.; Ramaswamy, V.; Storelvmo, T.; Armour, K.; Collins, W.; Dufresne, J.; et al. The Earth’s Energy Budget, Climate Feedbacks and Climate Sensitivity. In Climate Change 2021: The Physical Science Basis. Contribution of Working Group I to the Sixth Assessment Report of the Intergovernmental Panel on Climate Change; Cambridge University Press: Cambridge, UK, 2021; pp. 923–1054. [Google Scholar]
  44. Prussi, M.; Yugo, M.; De Prada, L.; Padella, M.; Edwards, R.; Laura, L. JEC Well-to-Tank Report V5; EUR 30269 EN; Publications Office of the European Union: Luxembourg, 2020; ISBN 978-92-76-19926-7. [Google Scholar]
  45. Ntziachristos, L.; Samaras, Z. EMEP/EEA Air Pollutant Emission Inventory Guidebook 2023 1.A.3.b.i-Iv Road Transport 2023. Available online: https://www.eea.europa.eu/publications/emep-eea-guidebook-2023/part-b-sectoral-guidance-chapters/1-energy/1-a-combustion/1-a-3-b-i/view (accessed on 9 April 2024).
  46. Winther, M.; Dore, C. EMEP/EEA Air Pollutant Emission Inventory Guidebook 2023 1.A.4 Non Road Mobile Machinery 2023. Available online: https://www.eea.europa.eu/publications/emep-eea-guidebook-2023/part-b-sectoral-guidance-chapters/1-energy/1-a-combustion/1-a-4-non-road/view (accessed on 9 April 2024).
  47. Stowarzyszenie Producentów Cementu Environmental Product Declaration (EPD) Type III CEM I, CEM II, CEM III, CEM IV, CEM V Produced in Poland. Available online: https://www.polskicement.pl/epd-cement/ (accessed on 9 April 2024).
  48. A WINT White paper The Carbon Impact of Water. Available online: https://wint.ai/blog/the-carbon-footprint-of-water/ (accessed on 9 April 2024).
  49. Gustafsson, M.; Svensson, N.; Eklund, M.; Dahl Öberg, J.; Vehabovic, A. Well-to-Wheel Greenhouse Gas Emissions of Heavy-Duty Transports: Influence of Electricity Carbon Intensity. Transp. Res. D Transp. Environ. 2021, 93, 102757. [Google Scholar] [CrossRef]
  50. Beckhaus, K.; Jäger, S.; Ibuk, H. Geothermal Activation of Geotechnical Elements Using the Mixed-in-Place Technology. Geotechnik 2024, 47, 37–41. [Google Scholar]
  51. Sondermann, W. Ground Improvement as Alternative to Piling—Effective Design Solutions for Heavily Loaded Structures. In Latest Thoughts on Ground Improvement Techniques; Shehata, H., Poulos, H., Eds.; Springer Nature: Cham, Switzerland, 2019. [Google Scholar]
  52. Yao, Y.; Xu, P.; Li, J.; Hu, H.; Qi, Q. Advancements and Applications of Life Cycle Assessment in Slope Treatment: A Comprehensive Review. Sustainability 2024, 16, 398. [Google Scholar] [CrossRef]
  53. EPD Ireland Product Specific EPD Breedon Cement CEM II/A-L 42,5 N Bulk Cement. Available online: https://www.igbc.ie/epd/breedon-cement-cem-ii-a-l-425-n-bulk-cement/ (accessed on 9 April 2024).
  54. Stichting MRPI Environmental Product Declaration Spenner CEM II/B-S 42,5 N. Available online: https://spenner-zement.de/produkte/zement/portlandkompositzement-cem-iic-m-s-ll-425-n-na/ (accessed on 9 April 2024).
  55. BRE Global Environmental Product Declaration Hanson Multicem CEM II. Available online: https://www.greenbooklive.com/search/scheme.jsp?id=347 (accessed on 9 April 2024).
  56. EPD International AB Environmental Product Declaration II A/LL 42,5 R Cement. Available online: www.environdec.com (accessed on 9 April 2024).
  57. EPD Norway Environmental Product Declaration CEM II/B-M (V-L) 42,5 R. Available online: https://www.epd-norge.no/ (accessed on 9 April 2024).
  58. Lončarević, Š.; Ilinčić, P.; Šagi, G.; Lulić, Z. Problems and Directions in Creating a National Non-Road Mobile Machinery Emission Inventory: A Critical Review. Sustainability 2022, 14, 3471. [Google Scholar] [CrossRef]
  59. Fan-Ren, L.Y.U.; Hong-Cai, S.; Wen, Z. A Contrastive Analysis of Carbon Emissions in Different Solutions to Battered Piles. IOP Conf. Ser. Earth Environ. Sci. 2021, 634, 012007. [Google Scholar] [CrossRef]
  60. Greenhouse Gas Reporting: Conversion Factors 2023—GOV.UK. Available online: https://www.gov.uk/government/publications/greenhouse-gas-reporting-conversion-factors-2023 (accessed on 22 March 2024).
Figure 1. Classification of Deep Mixing Methods based on “binder”. Own elaboration based on [16,17].
Energies 17 03294 g001
Figure 2. Construction site facilities for CDMM. Own elaboration. (a) Silos and power generator; (b) Excavator; (c) Trenchmixer; (d) Mixing and pumping unit.
Energies 17 03294 g002
Figure 4. Segment of CDMM panel arrangement undergoing assessment (panels in red). Based on “Working design for excavation stability for S1 Dankowice—Suchy Potok road”.
Energies 17 03294 g004
Figure 5. Life cycle stages for CDMM. Own elaboration.
Energies 17 03294 g005
Figure 6. CF for 1 m3 CDMM panel (a) for CEM II and (b) for CEM I. Own elaboration.
Energies 17 03294 g006
Figure 7. Contribution of various emission sources in different phases of life cycle. Own elaboration.
Energies 17 03294 g007
Table 1. GWP100 use in analysis. Own elaboration based on [43].
PollutantGWP100
CO21
CH4—fossil origin29.8
CH4—non-fossil origin27.2
NO2273
Table 2. Life cycle inventory for A1–A3. Own elaboration.
MaterialAmount qjUnitSource of Emission Factor
Cement—CEM II/CEM I1975t[47]
Water—Fresh water1975t[48]
Table 3. Life cycle inventory for A4. Own elaboration.
Transport ofVehicle Category kLegislation/Technology lTotal Distance l [km]Source of Emission Factor
EquipmentHeavy-duty trucks Diesel 16–32 tEuro 6 a/b/c640[45]
EquipmentHeavy-duty trucks Diesel > 32 tEuro 6 a/b/c160
CementHeavy-duty trucks Diesel 16–32 tEuro 6 a/b/c68,200
WaterHeavy-duty trucks Diesel 16–32Euro 6 a/b/c1240
FuelHeavy-duty trucks Diesel ≤ 7.5 tEuro 6 a/b/c680
Excavated materialHeavy-duty trucks Diesel 16–32 tEuro 6 a/b/c10,440
Table 4. Life cycle inventory for A5. Own elaboration.
EquipmentNFR SectorFuel Consumption FC [L]Fuel Type mOff-Road Equipment Technology tSource of Emission Factor
Excavator1.A.2.g vii2105DiselStage IV[46]
Binder plant1.A.2.g vii3750DiselStage IV
Trenchmixer1.A.2.g vii11,015DiselStage IV
Table 5. Comparison with other studies on methods from DMM group. Own elaboration.
TechnologySourceFUEmissions Involve in AnalysisMind Emission
CDMMOur studym3 CDMM panelMaterials, energy, freight, mob/demobilisationMaterials91%
DCM[29]t binderMaterial preparation, material transportation, DCM installation,
and other auxiliary construction processes
Materials64%
Deep dry soil mixing[31]1 m3 of waste–cement–clay blendsMaterial production,
transportation, and site application of the mixtures
Mixed-In-Place retaining wall and BAUER LWS silicate gel grout plug[50]Materials, energy, transports for supply, mob/demobilisation, people’s transportation, assets, transports for disposalMaterials88%
DSM[35]Materials, energy, freight, mob/demobilisation, people’s transportation, assets, wasteMaterials85%
DSM and Jet Grouting[36]Materials, energy, freight, mob/demobilisation, people’s transportation, assets, wasteMaterials68%
Table 6. Comparison of carbon footprint for cement CEM II in different countries. Own elaboration.
CF [CO2e/t]5.93 × 1025.66 × 1028.26 × 1025.01 × 1006.16 × 1026.48 × 102
CountryIrelandGermanyUnited KingdomTürkiyeNorwayPoland
Source[53][54][55][56][57][47]
Disclaimer/Publisher’s Note: The statements, opinions and data contained in all publications are solely those of the individual author(s) and contributor(s) and not of MDPI and/or the editor(s). MDPI and/or the editor(s) disclaim responsibility for any injury to people or property resulting from any ideas, methods, instructions or products referred to in the content.

