1. Introduction
The European research roadmap to the realisation of Fusion Energy [
1] envisages the construction of the DEMO fusion reactor by 2050. It shall operate by exploiting the deuterium-tritium fusion reaction, and its operation will allow producing hundreds of MWs of electric power to be delivered to the grid. To this purpose, the DEMO reactor must be endowed with a Breeding Blanket (BB) system, mainly devoted to: (i) contributing to the shielding of the magnets from radiation arising from plasma, (ii) recovering the thermal power produced by the fusion reactions to transfer it to the primary heat transport system and (iii) producing tritium in order to ensure the plant self-sustenance, as deuterium can be conventionally extracted from ordinary water. At present, several BB concepts are under investigation in the European Union (EU) to be selected as the reference ones for DEMO. Among them, the Water-Cooled Lithium Lead (WCLL) BB concept is one of the most promising. It is characterised by a eutectic alloy of Pb and Li in liquid phase as breeder, tritium carrier and neutron multiplier material and by subcooled pressurized water at Pressurized Water Reactor (PWR) conditions as coolant.
Hence, an intense research work has been conducted since 2014 throughout EU, under the umbrella of EUROfusion consortium, to reach a sound WCLL BB design capable of matching all the design requirements [
2,
3] propagated from the plant level to the BB system’s one. In particular, the WCLL BB must withstand the thermal and mechanical loads it undergoes under both nominal and accidental scenarios fulfilling the structural design criteria prescribed by the RCC-MRx code [
4], currently the reference code for the DEMO BB structural design. In this way, the WCLL BB can operate in any loading conditions without incurring in the condition of incipient structural crisis, which may jeopardise its integrity.
In this context, several campaigns of thermomechanical analysis, based on the adoption of the Finite Element Method (FEM), have been conducted over the years [
5,
6] in order to improve the design of the WCLL BB segments in view of the requirements imposed by the RCC-MRx code. In particular, the proposed geometric layout has been changed in order to ensure the improvement of its structural performance leading to the fulfilment of the RCC-MRx criteria, allowing the design level to evolve from the preconceptual phase to a conceptual one [
2]. At present, the aim of the WCLL BB thermomechanical activities is to make its conceptual design more robust in sight of the next DEMO BB concept down-selection and the further engineering design phase [
3].
From the gained experience [
5,
6], it has been found that the major concerns in terms of structural criteria fulfilment are given by the secondary stress, due to the thermal field arising within the BB structural materials as effect of the thermal loads the blanket undergoes and the heat transport throughout the structural and functional materials, driven by the cooling effect of the water flowing throughout the channels and tubes. In particular, the criterion against the Immediate Plastic Flow Localisation (IPFL), involving the primary plus secondary membrane stress, is often not satisfied in the WCLL BB most loaded region because of the high value achieved by the secondary (i.e., thermal-induced) stress. In the analysis campaigns conducted so far, a pure FEM approach has been used to predict the spatial temperature distribution, making use of a set of assumptions and simplified, yet conservative, boundary conditions, in order to speed up the analysis procedure. Indeed, the adoption of a Computational Fluid Dynamic (CFD) tool, based on the Finite Volume Method (FVM), would have led to a tremendous increase in the modelling effort and, consequently, of the computational burden giving, on the other hand, more accurate and realistic results. Therefore, a comparison between the design approach followed so far and the more rigorous—but much more demanding—one is necessary at this stage of the WCLL BB conceptual design phase, for evaluating the entity of the approximation induced by the simplifying assumptions employed in the common structural design practice, based on a pure FEM approach, of complex components embedded with cooling circuits. This can be a relevant asset in the current conceptual design phase of the DEMO reactor, as it allows more conscious decision-making in performing the frequent trade-offs between result accuracy and computational cost that characterize the design activities.
Hence, in the present work, a thermofluid-dynamic assessment performed adopting the FVM has been coupled with a structural one, the latter carried out adopting the classic FEM approach. In particular, attention has been paid to the Top Cap (TC) region of the WCLL BB Central Outboard Blanket (COB) segment as its design has resulted in being particularly challenging and significantly different from the design of the other regions [
7]. The obtained results have been then compared with those gathered from the analogous study performed adopting a pure FEM approach [
7], in order to highlight the differences in the thermal field prediction and, consequently, the impact in terms of secondary stress calculation in between the two approaches. The work has been performed adopting the Ansys calculation suite, using the Ansys CFX module for the CFD analysis and the Ansys Mechanical module for the structural assessment. The inherent capabilities of the Ansys suite have been exploited in order to couple the thermal results, obtained by an FVM analysis, with the mechanical analysis model, developed on the basis of a FEM tool.
The developed models, the methodology followed, and the obtained results are herein reported and critically discussed, properly highlighting the differences between the adopted coupled methodology and the classically adopted pure FEM approach.
2. The DEMO Water-Cooled Lithium Lead Breeding Blanket Concept
A detailed description of the DEMO WCLL BB and of its design evolution can be found in literature, for example, in [
2,
3].
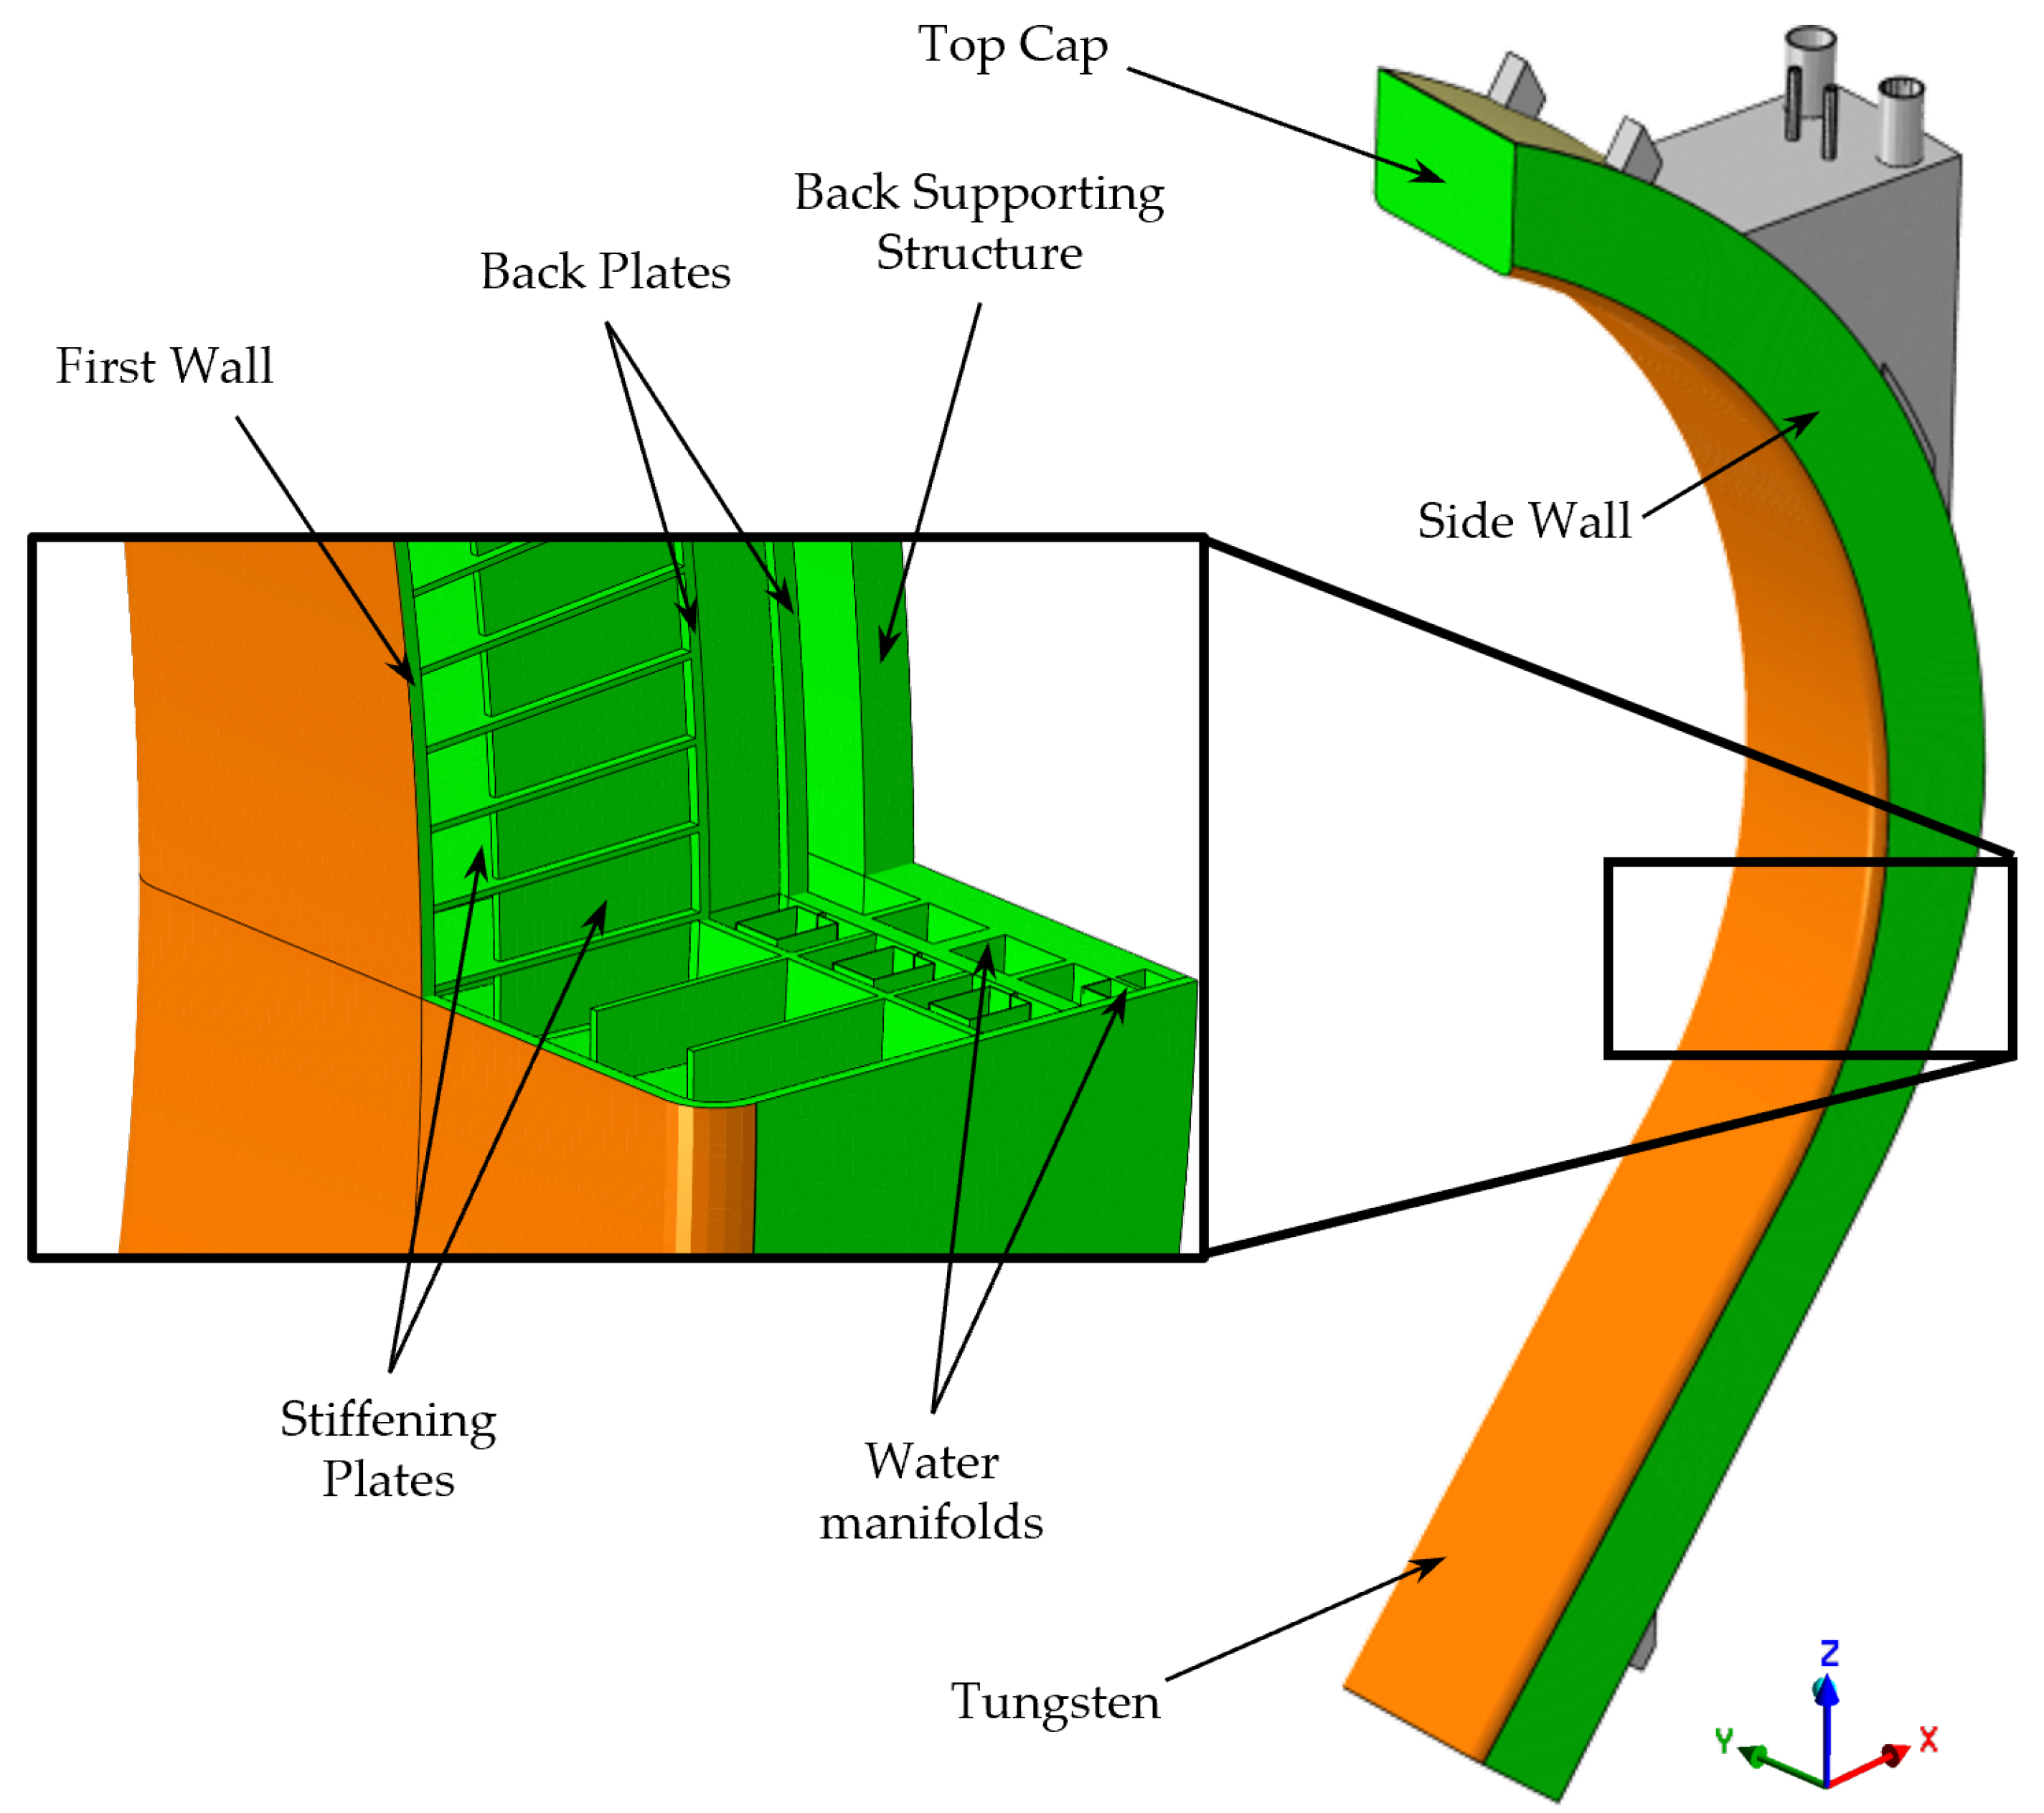
Here, one can recall that the DEMO BB system is articulated in sectors, and each DEMO BB sector is further split into five BB segments, two in the inboard region—namely Left and Right Inboard Blanket segments—and three in the outboard region—namely Left, Central (COB), and Right Outboard Blanket segments. A generic WCLL BB segment adopts the Eurofer steel as structural material and it can be considered to be composed of six main regions: (i) the First Wall–Side Wall (FW–SW), a U-shaped and actively cooled plate mainly used to face the heat flux radiated from plasma; (ii) the Breeding Zone (BZ), the region where tritium breeding reactions take place; (iii) the Manifolds, a region where the coolant and functional fluids are distributed and recollected; (iv) the Back Supporting Structure (BSS), a backbone structure with the main role of withstanding mechanical loads and assuring the BB connection with the Vacuum Vessel (VV) by means of proper attachments; (v) the caps, two actively cooled plates that close the segment in the poloidal direction and (vi) the feeding pipes, devoted to connecting manifolds to the primary heat transport system and to the PbLi purification loop. The aforementioned WCLL FW–SW complex is a 25 mm thick U-shaped plate cooled by water in PWR conditions (nominal pressure of 15.5 MPa, temperature range 295–328 °C) flowing in square channels with a 7 × 7 mm2 cross-section following a radial–toroidal–radial path. The channels are fed in countercurrent by means of a proper manifold system. It has to be added that the FW-SW is covered by a 2 mm-thick tungsten armor aimed at protecting the plasma from impurities.
Within the BZ, a grid of Stiffening Plates (SPs) is envisaged to internally reinforce the FW-SW against the nominal and accidental loads that the structure could undergo during the DEMO lifetime. In particular, the horizontal SPs (SPsh) are 10 mm thick whereas the vertical ones (SPsv) are 12 mm thick. In addition, a set of Back-Plates (BPs) separates the BZ from the Manifolds. The BZ is actively cooled by means of bundles of Double-Walled Tubes (DWTs). The water inside the DWTs follows a path similar to that of the FW–SW channels with a radial–toroidal–radial route. In order to optimize the heat removal, a DWTs water recirculation is envisaged [
2].
Last, there are the top and bottom caps (Top Cap, TC, and Bottom Cap, BC, respectively). The detailed design of these components is still under development, and the one relevant to the TC is the most advanced one [
7]. The TC consists of a 40 mm thick steel plate actively cooled by square channels with a 10 × 10 mm
2 section. The main reason behind the increased thickness with respect to the FW one is the withstanding of pressure arising in case of accident. In the end, it has to be recalled that the complex of FW-SW, BPs, Manifolds, Caps, and BSS is called Segment Box (SB). It is usual to refer to the SPs grid as a reinforcement component for the SB.
The rationale behind the design of WCLL BB segment is to replicate, along the poloidal direction, a basic geometric entity called slice [
2,
3]. The unique exceptions are the top and bottom external slice, housing the TC and BC, respectively, that differ from the other slices because of the presence of the caps.
Concerning the process fluids (i.e., breeder and coolant), three independent loops are needed: one is used to circulate the PbLi eutectic alloy, and two are used to route the water coolant. Indeed, the FW–SW structure and the BZ are cooled by water flowing into two separate systems at the same thermodynamic conditions. In particular, water coolant circuits are set to a pressure of 15.5 MPa, with the water temperature ranging from 295 to 328 °C in between inlet and outlet manifolds. Concerning the PbLi, it is assumed that it does not remove any thermal power, assuming the same temperature of about 330 °C at its inlet and outlet manifold. An average pressure of 0.5 MPa occurs, though it considerably varies along the poloidal abscissa of the segment due to the non-negligible liquid metal head. Fluids are delivered to and removed from the BB by means of feeding pipes routed through both the lower and upper ports. Lead–lithium is fed through the lower port and extracted from the upper one, whereas cooling water is fed and extracted from the upper port.
Since the present study is focussed on the WCLL BB COB segment, a detailed view of it is shown in
Figure 1. Here, the main SB components are indicated using a color code aimed at highlighting the tungsten armor (in orange), the Eurofer structural steel (in green), and the attachments (in grey), the latter made of Eurofer too and mainly devoted to connecting the WCLL COB segment to the VV. In this picture, the location of the TC in the general architecture of the COB segment is highlighted as well.
The Top Cap Region of the DEMO WCLL BB COB Segment
Since the work herein reported focuses on the TC region of the DEMO WCLL COB segment with the aim of comparing two different methodologies for the investigation of its thermal and structural performances, the reference geometric layout obtained from the study reported in [
7] is here considered. Indeed, it currently represents the reference geometric layout for the WCLL COB TC region (
Figure 2). A detailed description of the campaign of analysis performed to attain such a configuration is described in [
7].
Here, it is recalled that the TC is 40 mm thick as well as the FW-SW of the slice in which it is housed. The latter is endowed with only 2 cooling channels in countercurrent flow. As to the FW-SW of the poloidally adjacent slice, it is 32.5 mm thick to gradually reduce the FW-SW thickness to the nominal value of 25 mm, thus improving the SB structural performances in the TC region. Moreover, the SPsv thickness in the slice housing the TC is increased from the nominal value of 12 mm to 14 mm in order to reinforce the TC in case of accident. Furthermore, the 22 DWTs placed in the slice housing the TC are arranged according to a purposely set-up pattern aimed at avoiding the insurgence of hotspots in the TC region [
7]. Regarding the TC cooling channels, 8 square cooling channels (10 mm side) toroidally cross the component with the coolant flowing in parallel.
3. The 3D Geometric Model
A specific geometric model of the TC region of the WCLL COB segment has been created. In particular, as shown in
Figure 2, a cut of the reference WCLL BB COB segment has been made in order to isolate its Top Cap region. Then, it consists of the slice housing the TC, plus two adjacent radial-toroidal slices along the poloidal direction. In this way, a geometric model analogous to that adopted for the purely FEM calculations [
7] has been used in the present study. Such a geometric model includes the TC and the proper portion of the SB (cooled in total by 10 channels), covered by the pertinent tungsten armor, and of the SPs together with the necessary DWTs housed in the represented SB region (66 DWTs in total, with the 22 tubes housed in the TC cell differently deployed from the others in order to allow thermal field optimization). Moreover, in order to perform the thermofluid-dynamic analysis, the water coolant flow domain and the breeder domain have been included in the model. In particular, as shown in
Figure 3 and
Figure 4, the realized fluid domains include also fluids flowing throughout the inlet and outlet manifolds. The cooling water and the breeder flow from the inlet to the outlet manifolds, passing through the SB. Manifolds have a shape that is elongated in the poloidal direction, as they distribute and collect water in the whole BB segment. For the purposes of these analyses, only their portion in the correspondence of the TC region has been modelled, as shown in
Figure 3 and
Figure 4. Finally, it is worth mentioning that, in order to avoid numerical instabilities or physical nonsenses induced by boundary conditions, the water manifolds inlet boundary faces were moved 200 mm down in the poloidal direction as visible in
Figure 4.
Once defined the 3D geometric model, the proper FVM and FEM models have been created on the basis of the geometric layout here depicted, making use of proper boundary conditions in order to simulate the thermofluid-dynamic and structural effect of the remaining part of the segment, not included in the model in order to keep reasonable the computational burden and, consequently, the calculation time.
4. The Thermofluid-Dynamic Analysis
In this section, the steady-state thermofluid-dynamic analysis of the TC region of the WCLL BB COB segment is presented and critically discussed. The main scope of this analysis, carried out using the FVM Ansys CFX code, has been to obtain a realistic temperature 3D spatial distribution to be used as input for the next structural assessment. Moreover, the obtained thermal field has been compared with that resulting from the reference analysis [
7], performed by adopting a pure FEM approach.
4.1. The Adopted Methodology
In order to assess the thermal and thermofluid-dynamic performances of the TC region of the DEMO WCLL COB segment, an articulated analysis procedure has been set up and applied in order to finally calculate the temperature 3D spatial distribution in the assessed region.
Initially, preliminary “cold” CFD analysis has been performed, aimed at the preliminary assessment of the fluid velocities and mass flow rates (MFRs) in the FW-SW and BZ cooling circuits, in order to investigate the MFR spatial distribution in both the considered cooling circuits in steady-state conditions. Moreover, the first part of the study has been aimed at defining suitable meshes for the subsequent “hot” CFD simulations, starting from the geometry of the systems and a set of realistic boundary conditions.
Afterward, once assessed the FW and BZ cooling circuits from a pure fluid-dynamic standpoint, the second stage of the analysis focussed on running a coupled solid-fluid thermal and thermofluid-dynamic analysis of the TC region of the DEMO WCLL COB segment, so to obtain the 3D temperature field within the structural and functional materials under the steady-state nominal thermal loading conditions, representative of the end of flat top plasma operating mode of the DEMO reactor.
Concerning the cooling system employed for the SB (both FW and SW) and TC, from this point onward, it is identified simply as FW cooling system, for the sake of brevity. It is necessary to further notice that, despite the fact that the current DEMO WCLL design foresees a unique cooling circuit per BB segment feeds SB and TC cooling channels, in this work, reference will be made to one FW cooling system composed of two separate FW cooling circuits (called FW1 and FW2). This apparent contradiction arises from the convenient modelling choice that was adopted in order to model only a limited poloidal portion (the TC region) of the whole SB and TC cooling circuit. Indeed, in order to realize countercurrent coolant flows in adjacent channels of the SB, both the inlet and outlet manifold of the cooling circuit—which covers the whole poloidal development of the BB segment—are divided into two different elongated bodies, located at the opposite sides (in the toroidal direction) of the BB segment. As a result, when considering a limited poloidal portion of the BB segment (as in the present work), there appear to be two separate cooling circuits realizing opposite water flows in the segment box with the respective inlet and outlet manifolds, when actually a limited portion of the single cooling circuit is being assessed. A proper modelling of the limited portion of BB foresees treating the two apparently separate cooling circuits as if they were separate, imposing proper conditions at the domain boundaries to simulate their continuity. Therefore, when reference is made to one FW cooling system composed of two distinct cooling circuits, it has to be clear that reference is being made to the model employed for the simulation activity, and not to the current BB segment design for the SB and TC cooling.
4.2. The Preliminary Assessment of the Fluid Dynamics in the FW and BZ Cooling Circuits
The geometric layout of the TC region of the DEMO WCLL COB segment considered in the present work is that reported in
Figure 2 with the flow domains depicted in
Figure 3 and
Figure 4.
As a first step, an isothermal analysis has been performed in order to assess the WCLL COB TC region from a pure fluid-dynamic standpoint, namely predicting the MFR and fluid velocity 3D spatial distributions.
4.2.1. The Spatial Discretization
The driving criterion used for the discretization of the domain in this first stage of the study was to realize the densest meshes compatible with the available computational resources. This is achieved by applying mesh refinements in specifically selected regions expected to present significant gradients of the fluid-dynamic quantities and also by developing structured grids for regular parts of the domain, as, for instance, the DWTs in the BZ cooling circuit and the square-section channels in the FW cooling circuit. By adopting this structured-unstructured hybrid meshing strategy, it is possible to reduce the overall number of cells by setting a suitable sweep mesh size for the structured parts of the domains.
Regarding the near-wall refinement, inflation layers have been employed over all the wall surfaces and the first layer thickness has been selected so as to have values above the threshold value of ≈11 in order to adopt a high-Reynolds treatment.
Mesh composed of ≈9.3M nodes and ≈14.1M finite volumes, and ≈26.1M nodes and ≈31.3M volumes have been developed respectively to discretize the water flowing through the FW and the BZ cooling systems.
Details of the mesh setup are shown in
Figure 5, where the focus is put on the FW cooling water and the transition region between structured (DWTs) and unstructured (manifolds) mesh in the BZ cooling circuit.
It is moreover worth mentioning that the meshes were created imposing the compliance with Ansys CFX mesh metrics constraints of exponential factor, orthogonality angle, and aspect ratio, as prescribed in [
8]. As a result, less than
of the overall number of cells is characterized by poor metrics and, consequently, the results are not expected to be significantly influenced by the mesh quality.
4.2.2. Assumptions, Loads and Boundary Conditions
As already mentioned, the preliminary CFD analyses described in this section are isothermal. In order to account for the correct values of fluid density and viscosity, the Ansys CFX built-in IAPWS water properties tables have been considered [
9], while a uniform temperature, equal to 311.5 °C, has been set. This temperature has been calculated as the arithmetic average value between the inlet and outlet manifold (295 °C and 328 °C respectively) foreseen for the WCLL BB coolant [
2].
As to the FW cooling circuit, a countercurrent flow has been realized, whereas, regarding DWTs, water flows through the tubes from the central inlet manifold to the two lateral recirculation manifolds (
Figure 6), and from the recirculation manifolds to the two inner outlet manifolds, according to the reference scheme [
2]. It is to be mentioned that, in the modelling of the recirculation manifolds of the BZ cooling system, it has been hypothesized that there is no net mass flow in the poloidal direction. This is a simplifying assumption performed in order to assign plausible conditions at the recirculation manifold boundaries, as an estimate of the actual MFR would require a thermofluid-dynamic analysis of the entire BB segment.
On both the tubes and channel walls, an equivalent sand-grain roughness value of 15
m was specified, in agreement with the values adopted for Eurofer in other papers [
10,
11].
Then, proper boundary conditions have been imposed at the boundary faces of the water manifolds, whose nomenclature is reported in
Figure 6.
In particular, a nominal pressure of 15.5 MPa has been imposed on the boundary face of the water inlet manifolds. Moreover, the segment’s global MFR has been imposed on the “exit” boundary faces of the outlet manifolds, whereas purposely calculated MFR values have been imposed on the “entrance” boundary faces of the outlet manifolds to take into account the portion of the global mass flow passing through the rest of the segment not included in the model. The imposed MFRs are summarized in
Table 1 and have been selected in agreement with the values adopted in [
7] and coherently with the total BB segment values reported in [
12].
Finally, concerning the turbulence modelling strategy, the k-
SST model, already employed for the thermal-hydraulic analysis of the WCLL BB [
2], has been selected for all the simulations, while an automatic wall function has been employed at the walls.
4.2.3. The Obtained Results
The main results obtained in the fluid-dynamic analyses are reported in this section, in terms of pressure distributions and fluid velocity fields.
Figure 7 illustrates the streamlines in the FW cooling system, showing a maximum fluid velocity of nearly 16 m/s in the proximity of the outlet manifolds, whereas the coolant within the channels does not exceed the 6 m/s, as prescribed by the project requirements [
2]. It is possible to further notice that the SB cooling channels exhibit similar velocities and pressure distributions, whereas slowly moving fluid is predicted in some TC cooling channels.
Indeed, it is clearly visible that, among the toroidally oriented TC cooling channels, only the ones that are closer to the manifolds show sufficient flow velocity, due to the cooling circuit layout. These trends are confirmed by the MFRs calculated in the SB and TC cooling channels, as reported in
Figure 8. Here, the SB channels are numbered in ascending order from the bottom to the top whereas the TC channels are numbered in ascending order from the closest to the FW to the closest to the BSS (
Figure 4). The SB channels exhibit a maximum difference, in terms of MFRs, of 5% (maximum MFR in SB9 channel, 0.1377 kg/s, minimum MFR in SB2 channel, 0.1313) whereas the highest and the lowest MFRs in the TC channels differ by one order of magnitude (maximum MFR in TC8 channel, 0.1307 kg/s, minimum MFR in TC3 channel, 0.0217 m/s). This situation is particularly critical, as the quasi-stagnating water flow is verified in the channels that are closer to the FW, subjected to more intense heat fluxes from plasma.
Figure 9 shows the static pressure field in the FW cooling system. A total pressure drop between the inlet and outlet exit sections of 0.105 MPa is observed, while the total pressure drop between the outlet entrance and the outlet exit is estimated to be 0.056 MPa.
Figure 10 shows the streamline in the BZ cooling circuit, having maximum fluid velocities around of 16 m/s in the zone of the outlet manifolds. It is possible to notice that the top regions of the recirculation manifolds are characterized by fluid stagnation, which may lead to overheating or even boiling phenomena, and need therefore further investigation.
It is moreover important to highlight the presence of strong vortices in the upper part of the outlet manifold, resulting from the sudden change in direction of the coolant. These vortices, appear to have a significant effect on the flow field inside the TC BZ cooling system since they deeply influence the pressure field inside the manifold, as depicted in
Figure 11. Moreover, a similar vortex structure is obtained if different sets of coolant boundary conditions are employed, confirming that are not numerical artefacts and that they arise from the geometrical features of the manifolds.
As a result of the nonsymmetrical pressure field inside the outlet and recirculation manifolds, the MFR distribution among the DWTs is not symmetrical, as depicted in
Figure 12, where the MFRs in the DWTs connecting the inlet and the recirculation manifolds are shown, and
Figure 13, showing the MFR in the DWTs connecting recirculation and outlet manifolds. In particular, DWT numbering is always from the bottom to the top, and they are reported separately for the left and right sides. Moreover, channels 1 to 8 of
Figure 12 refer to the DWTs closer to the FW, while the following 9 to 20 refer to the innermost ones. The vortices causing the nonsymmetric MFR distributions are possibly unstable, and thus the coolant distribution may change with time.
Finally, a total pressure drop between the inlet and outlet exit sections of the BZ cooling system of 0.052 MPa is observed, while the total pressure drop between the outlet manifold entrance and the outlet exit is estimated to be 0.046 MPa. This latter result suggests that most of the pressure drop occurs inside the upper part of the outlet manifold.
In conclusion, the performed fluid-dynamic analysis showed two potential criticalities in the current design of the TC region cooling circuit: (i) a strongly uneven distribution of the MFRs among the TC channels, which may lead to overheating in the particularly critical zone closer to the FW, and therefore may represent a design flaw of the examined WCLL BB region, and (ii) a severe fluid stagnation in the upper part of the BZ recirculation manifolds.
In the following section, the coupled solid–fluid, thermal and thermofluid-dynamic analysis is presented, where the effects of both the realistic MFR distribution and fluid stagnation on the thermal field are assessed.
4.3. Thermofluid-Dynamic Analysis of the Top Cap Region
Once assessed from a pure fluid-dynamic standpoint of the FW and BZ cooling circuits, the second stage of the work focussed on running a coupled solid-fluid thermal and thermofluid-dynamic steady-state analysis of the TC region of the DEMO WCLL COB segment, so as to obtain the 3D temperature distribution within the structural and functional materials under the nominal thermal loading conditions, representative of the end of flat top plasma operating mode of the DEMO reactor.
4.3.1. The Spatial Discretization
In the coupled solid–fluid, thermal and thermofluid-dynamic analysis, the discretization adopted for the water flowing through the SB and BZ cooling circuits is the same that was employed in the isothermal fluid-dynamic analysis (
Figure 5). On the other hand, a proper discretization has been adopted for the tungsten layer, the breeder domain and the SB as shown in (
Figure 14).
In particular, as to the tungsten a mesh consisting of ≈210k nodes and ≈104k volumes has been set up, whereas a grid made of ≈7.7M nodes and ≈39.6M volumes has been obtained to discretize the breeder domain. Similarly, the Eurofer steel domain (i.e., the SB) has been meshed with ≈11.2M nodes and ≈52.8M volumes. The element sizes adopted for the tungsten and Eurofer domains have been selected so as to have comparable mesh sizes with the FEM model developed in [
7], thus avoiding interpolation issues in the temperature mapping required to perform the following thermo-mechanical analyses. The complete mesh, composed of the two cooling circuits, the SB, the breeder and the tungsten, comprises ≈54.4M nodes and ≈138.0M finite volumes.
4.3.2. Assumptions, Loads, and Boundary Conditions
The coupled solid–fluid thermal and thermofluid-dynamic analysis is meant to provide an accurate estimate of the 3D temperature field in the TC region, by considering the thermal loads generated during the reactor operation, as well as the influence of the thermofluid-dynamics of the cooling systems on the solid–fluid heat exchange. To this end, it is necessary to impose realistic loads and boundary conditions, representing the steady-state normal operation scenario of the DEMO WCLL COB segment. In all the domains, both solid and fluid, the heat deposited by fusion neutrons within the materials was modelled as a volumetric heat source, having a 3D spatial distribution dictated by various nuclear phenomena, including neutron capture and scattering, and the breeding reactions with lithium occurring in the breeder. In particular, the volumetric heat loads adopted have been drawn from [
13].
In the water domains, the same boundary conditions already adopted for the isothermal analyses have been considered, as they originate from estimates based on the available data on the BB segment inlet and outlet conditions, and on the position of the TC within its segment. As the fluid is no longer considered isothermal, the proper inlet (295 °C) and outlet manifold entrance (328 °C) temperatures (with reference to the boundaries defined in
Figure 6) have been imposed at the boundary sections of the water manifolds.
In the solid domains, in order to consistently reproduce the thermal problem, the imposed conditions need to take into account the thermal loads received from the plasma, the heat deposited by fusion neutrons, and the interactions of the TC structure with the cooling water, and with the surrounding parts of the reactor. Regarding the thermal loads received from the plasma, a proper heat flux incident on the tungsten domain has been imposed. It has an estimated value of 0.24 MW/m
2 on the straight part of the FW, which was therefore applied to this zone, in agreement with the modelling strategy applied in [
7]. However, as obvious, this heat flux progressively decreases down to zero on the curved surfaces of the FW, and a cosine law has been selected to describe this variation. Concerning the heat deposited by fusion neutrons, volumetric heat loads curves from [
13] have been adopted, while regarding the interaction between the structures and the water a simple conservative heat transfer interface condition has been selected. Finally, the external surfaces of the TC region were assumed to be adiabatic, according to the hypothesis that, in steady-state operation of the reactor, these parts of the structure reach thermal equilibrium with the surrounding other blanket segments, while the BSS has been conservatively set as adiabatic. Regarding the structural and functional material properties, temperature-dependent values have been selected for Eurofer [
14], tungsten [
15], and PbLi [
16]. Temperature and pressure-dependent properties have been used for water too [
9].
4.3.3. The Obtained Results
The obtained results relevant to the flow field are qualitatively identical to those obtained from the isothermal analyses, so they are not shown in this section for the sake of brevity. It has to be only mentioned that, since the fluid is no longer considered isothermal, variations in velocity and MFRs numerical values have been calculated, as expected, whereas their trends remain unchanged.
Regarding the temperature distribution within the coolant,
Figure 15 shows the saturation margin distribution in the FW-SW and TC cooling water, defined locally as
, where
is the water saturation temperature as a function of the local absolute pressure
p, drawn from [
9], while
T is the local coolant temperature value. In particular, the regions in grey of
Figure 15 are those in which negative saturation margins are predicted, i.e., coolant vaporization is foreseen by the simulation.
As it can be observed, wide zones of the TC cooling channels closer to the FW exhibit temperatures that exceed the saturation temperature (≈345 °C at 15.5 MPa). Such zones are those where the fluid-dynamic analysis has shown the lowest MFR. Therefore, the performed analyses predict the potential water vaporization in some regions of the TC cooling circuit during the steady-state operation, which makes the examined cooling system configuration potentially unacceptable. Furthermore, localized coolant vaporization is predicted in the upper FW channels, but the boiling phenomena are observed not to be extended to the bulk of the coolant. Concerning the stagnation regions in the upper part of the BZ recirculation manifolds, no criticalities are observed due to the low volumetric heat loads in the rear part of the BB segment.
Further investigation on this specific part of the WCLL BB cooling system is needed, as the simulation performed is not able to predict the occurrence of two-phase flow conditions. Furthermore, dedicated analyses should be also performed to assess whether the cooling circuit undergoes two-phase instabilities, as can be suggested by the results depicted in
Figure 15.
Last,
Figure 16 shows the temperature field in the Eurofer domain. It is to be noticed that, despite the uneven MFR distribution in the top cap cooling channels, the FW and top cap maximum temperatures seldom exceed 500 °C, and practically no zone is predicted to have temperatures exceeding 550 °C, which is a DEMO design requirement. However, it should be pointed out that this outcome is the result of the modelling choices for the CFD analyses, and possibly significantly higher temperatures would be obtained, especially in the TC, if a proper (yet unfeasible with the available computational resources) modelling strategy for the two-phase flow is employed, possibly resulting in lower structural performances.
5. Comparison of the Thermal Analyses Results
In order to evaluate the differences between the 3D thermal field obtained within Eurofer domain from the performed thermofluid-dynamic analysis and the analogous spatial distribution predicted in the reference study [
7], a quantitative comparison has been carried out. To this purpose, the obtained thermal field shown in
Figure 16 has been mapped onto the mesh set-up in the reference study and herein further used for the structural analysis reported in the following section. Then, a node-by-node comparison of the temperatures (the ones calculated in the pure FEM analysis against the ones obtained from the thermofluid-dynamic FVM analysis and mapped onto the reference case mesh) has been performed.
Let
the temperature at the
ith node calculated from the CFD analysis and
the temperature value at the same location calculated in the reference study, in which thermal analysis based on the FEM approach was performed. Thus, the local percentage deviation between the two temperature distributions can be defined as:
Thus, the statistical distributions of the deviations and their cumulative curves have been plotted and reported in
Figure 17 for FW-SW (
Figure 17a), TC (
Figure 17b) and SPs (
Figure 17c). Generally, one can see that the calculated deviations stay within the range from −11.6% to +14.8%. Hence, an acceptable agreement between the two approaches has been found.
As can be observed, more than 90% of the FW-SW domain experiences deviations in the range ±3%. This means that the pure FEM approach is a very good method to preliminarily investigate the global thermal performances of the FW-SW region of the DEMO WCLL BB segments, allowing to obtain quite reliable results with lower employment of computational resources and time than a coupled thermofluid-dynamic analysis. Moreover, it can be observed that the deviation statistical distribution is slightly shifted toward the positive values. This means that, globally, the CFD analysis allows obtaining slightly higher temperatures within Eurofer than the pure FEM thermal analysis.
Moreover, looking at the statistical distribution of the temperature deviation obtained for the TC, it can be observed that the predicted values are almost all positive. This means that the coupled approach allows for predicting higher temperatures than the pure FEM approach. This outcome can be qualitatively explained considering that the coupled approach allows obtaining a more realistic MFR distribution than the pure FEM, and in this case, this leads to the prediction of low MFR values in most of the TC channels with consequently higher temperatures. Of course, as already diffusely explained, the potential onset of bulk boiling phenomena in some TC channels may lead to even higher temperatures in the TC. Nevertheless, it should be determined if this will cause the nonfulfillment of the Eurofer temperature limit, since at present the temperature margin is quite high, and if this possible overheating is significantly diffused or localised and, then, even acceptable. In the same way, looking at the results concerning the SPs it can be observed that the coupled approach returns lower temperatures than the pure FEM analysis, probably because of a more realistic simulation of the heat transfer phenomena.
It has to be mentioned that, in the computation of the deviation values here represented, the absolute scale has been considered for the temperature in order to assign a precise physical meaning to the obtained deviation values. Moreover, the contour map of the calculated percentage temperature deviation has been carried out and shown in
Figure 18. From a general point of view, it can be seen that the spatial distribution of the deviations confirms that the FEM approach for the determination of the thermal field is in any case capable of providing quite reliable outcomes, with the further advantage of being less demanding in terms of modelling effort and computational burden than the FVM one.
As can be observed, the CFD analysis allows obtaining generally higher temperature (i.e., positive deviation values) in the FW-SW and TC regions, whereas lower temperature values are generally obtained within SPs in the CFD calculation. The latter is mainly due to a more efficient heat exchange modelling in the CFD analysis with respect to the pure FEM approach adopted in the reference study. In particular, the CFD simulation allows better predicting the heat transfer coefficient, which is more precisely evaluated than in the FEM analysis. As to the TC, the spatial distribution of the deviation values reflects the uneven MFR distribution carried out from the thermal-hydraulic assessment. Indeed in the front part of the TC, where low MFRs are predicted, the highest temperature values are calculated, whereas in the back part, where the highest MFR values are carried out, negative deviations (and so lower temperature than the reference case) are predicted. Moreover, it can be observed that the highest deviation is obtained in the back region of the SB, which is less critical from the design point of view. However, this result can be explained by considering that in the reference study, the temperature in this region is given as a Dirichlet boundary condition whereas in the analysis herein reported it depends on the MFR distribution.
6. The Thermomechanical Analysis
Once obtained the 3D thermal field, in this section, the results obtained from the steady state thermomechanical analysis of the TC region of the WCLL BB COB segment are presented, together with the adopted methodology, the assumptions and the models’ setup, and critically discussed. The main scope of this analysis has been the verification of the fulfilment of the RCC-MRx structural design criteria in the investigated domain. Moreover, the obtained results in terms of both equivalent stress intensities and stress tensor components spatial distributions will be compared with those resulting from the reference analysis performed adopting a pure FEM approach, in order to highlight the difference in the prediction of the structural performances in between the two approaches.
6.1. The Adopted Methodology
The steady-state mechanical performances of the TC region of the WCLL COB segment under the nominal loading conditions have been investigated by adopting the FEM approach and using the Mechanical module of the Ansys calculation suite. As mentioned before, the same spatial discretization grid already used for the reference study [
7] has been adopted, together with the displacement field calculated in [
5] and imposed as a boundary condition in order to simulate the mechanical effect of the rest of the WCLL COB segment not included in the model. Then, the thermal field obtained from the CFD analysis has been mapped onto the selected mesh.
Results in terms of 3D spatial distributions of the stress tensor components have been then compared with those calculated in the reference study. Afterward, a stress linearization procedure has been performed in the most critical regions in order to verify the fulfilment of the prescribed RCC-MRx structural design criteria. In this regard, the obtained values of the ratios between stress intensities and stress limits have been compared with the values obtained at the same locations in the reference study, to further check the differences in results between the two followed analysis approaches.
6.2. The Spatial Discretisation
The adopted mesh has been inherited from [
7]. Then, for the sake of brevity, here, it is only recalled that it consists of ≈5.9M nodes connected in ≈4.6M tetrahedral and hexahedral linear elements.
6.3. Loads and Boundary Conditions
In order to investigate the TC region thermomechanical performances under the steady state nominal loading conditions, a proper set of loads and boundary conditions has been adopted in accordance with the reference study [
7] and the DEMO BB load specifications [
17].
First, as already discussed, the 3D thermal field obtained in the first part of the study has been mapped onto the FEM mesh in order to take the thermal-induced stress field into account.
Second, a set of pressure loads has been imposed in order to consider the mechanical effect of the cooling and functional fluids. In particular, the water and breeder design pressures have been imposed onto the respective wetted surfaces. Such pressure values, obtained by multiplying the nominal pressures by a safety factor of 1.15 [
17], amount to 17.825 MPa and 0.575 MPa for water and breeder respectively.
Moreover, the static effect of the fluids has been simulated imposing on the structural material a purposely calculated temperature-dependent equivalent density, in order to consider their weight.
Then, the 3D spatial distribution of the ferromagnetic forces, arising within the Eurofer domain because of its ferromagnetic nature, has been imposed to as well [
18].
Finally, in order to consider the mechanical action of the not-modelled regions of the WCLL COB segment on the investigated domain, the displacement field at the lower radial-toroidal boundary face calculated from a whole segment structural analysis [
5] has been mapped onto the realised mesh, as shown in
Figure 19. In particular, the 3D spatial distributions of the three components of the displacement vector have been mapped, giving the resulting displacement field shown in figure.
6.4. The Obtained Results
As the main scope of the work is to compare the results obtained from the pure FEM methodology to those gathered from the coupled CFD-FEM one, attention has been paid to the 3D spatial distributions of the stress tensor components.
In particular, in
Figure 20, the spatial distributions of the normal components (
,
and
) are depicted, providing separate views for FW-SW, TC and SPs. The obtained results are quite encouraging since, as can be observed, most of the normal stress ranges between ±300 MPa. Especially within SPs, extremely localised hotspots, mainly due to the application of the EM loads, are visible. Since they represent the point of applications of the ferromagnetic forces, stress values in these points are not meaningful.
In the same way, the spatial distributions of the shear components (
,
and
) are depicted in
Figure 21. Also from the shear stress standpoint results are quite promising since, as can be observed, most of the stress ranges in between ±100 MPa. Also in this case, the high stress values predicted in correspondence with the EM forces points of application should not be treated as indicative of the structural answer of the considered component.
In addition, the obtained results in terms of Von Mises equivalent stress field are depicted in
Figure 22. As it can be observed, in most of the investigated domain, the predicted Von Mises stress is below 500 MPa. This outcome confirms the positive judgement given to the structural answer of the TC region, even in the current approach where a finer thermal assessment has been performed.
Last, a stress linearization procedure has been performed considering a purposely conceived set of paths (
Figure 23), built in correspondence of those TC and FW-SW channels where the highest and lowest MFRs have been predicted in the hydraulic analysis. Then, the fulfillment of the set of RCC-MRx structural design criteria regarding the service level A has been checked. Results are reported in
Table 2, where the ratios of the equivalent stress intensities over the stress limits (depending on the path average temperature) are reported, entailing that values greater than 1.0 indicate that the criterion is not met along that path. Critical values, namely those very close to 1.0, have been reported in orange in the table. As it can be observed, all the criteria are fulfilled along all the considered paths even though the criterion against the Immediate Fracture due to exhaustion of ductility ((P
m + P
b + Q + F)/S
et) is met with a very narrow margin along the paths SB2_A and SB9_A.
7. Comparison of the Thermomechanical Analyses Results
In order to evaluate the differences between the structural behavior of the TC region predicted by the pure FEM approach and the coupled CFD-FEM one, the obtained spatial distributions of the stress tensor components have been compared.
In order to perform these comparisons with the highest level of precision, the values of the stress tensor components at the integration points have been considered, rather than those extrapolated at nodes. In this way, the influence on results of the shape functions and results averaging has been excluded. Moreover, it has to be noted that each stress tensor component presents a wide number of points with very low values. This produces noise in the comparisons, generating big variations on small values and hiding the errors related to the biggest stress value that, of course, are of the highest interest. For this reason, in order to minimise the background noise given by big variations on small values, it has been decided to filter out the stresses comprised between ±40 MPa.
Let
the
jth stress component evaluated at the
ith integration point in the coupled analysis and
the stress value at the same location calculated in the reference (i.e., pure FEM) study. Thus, for the
jth stress component, the local percentage deviation between the stress obtained by the two analysis methodologies can be defined as:
Thus, the statistical distribution of the deviation and its cumulative curve have been plotted and reported in
Figure 24 as to FW-SW, in
Figure 25 for the SPs and in
Figure 26 regarding the TC.
Looking at the distributions, one can see that remarkable differences in the predicted stress are clearly visible. This was expected because of the different nature of the two analysis approach. Moreover, what emerges from the reported cumulative curves is that, in a considerable part of the investigated domain, the calculated deviations are negative. This means that the stress predicted from the pure FEM analysis is globally higher than that calculated in the coupled approach. Hence, one can conclude that, even though big differences in stress emerge, the pure FEM approach can be considered the most conservative of the two. Of course, as to TC, the deviations may reduce somehow since the potential onset of the boiling bulk phenomena could lead to higher thermal gradients and, therefore, to higher stress. But this can be considered as a second-order effect to be investigated by means of a dedicated campaign of analysis, as the actual magnitude of such potential effect should be evaluated. This is a positive outcome in sight of the follow up of the WCLL BB design activities, as it confirms that the quickest (and less demanding) pure FEM approach can be used to preliminarily compare alternatives, and then the most promising ones can be refined adopting the most accurate (and more expensive in terms of modelling effort and computational resources) coupled CFD-Structural approach.
In the end, a comparison in terms of RCC-MRx criteria verification has been performed as well. The results of criteria verification obtained in the pure FEM analysis have been reported in
Table 3, whereas the deviations between the two sets of results are reported in
Table 4, calculating them as the difference between the result of the coupled analysis and the reference one divided by the latter.
As can be observed, the criteria involving only primary stress are not affected by deviations, as the main difference in the two approaches stays in the thermal field calculation. Indeed, the biggest deviations are calculated for the two criteria involving secondary stress (Q) as they depend on the thermal gradients. However, it is not possible to obtain a unique trend for the deviations as the stress linearization procedure foresees operations and averaging that unavoidably alters the physical meaning of the analysis results.
8. Conclusions
In this paper, the classic design approach adopted for the design of the TC region of the DEMO WCLL COB segment, based on a pure FEM thermal and structural analysis, has been compared to a single phase coupled thermofluid-dynamic/structural approach based on both FV and FEM analyses.
First, the coupled analysis approach has allowed confirming that, as already emerged from the reference pure FEM assessment, the proposed design solution for the TC region of the WCLL COB segment fulfils the prescribed thermal and structural criteria, even though some concerns about the MFR distribution within the TC arise. Hence, the performed coupled thermofluid-dynamic and thermomechanical assessment paves the way for dedicated campaign of hydraulic analysis aimed at balancing the MFR distribution within the TC. In any case, more detailed analysis should be performed to clarify if the potential onset of bulk boiling within some TC channels will effectively lead to the overtaking of the Eurofer temperature limit and, should it be the case, to what extent the TC is affected from it in terms of extension of the overheated region.
Moreover, the obtained outcomes have highlighted that, globally, the pure FEM approach allows predicting higher stress than the coupled one. Hence, it can be concluded that the quicker pure FEM approach can be still used as a preliminary analysis approach in order to perform parametric analysis or evaluation of lot of alternatives, leaving to the coupled approach the role of refining the design of the most promising configurations.

 ,
, 


