

Review of Methods to Create Meteorological Data Suitable for Moisture Control Design by Hygrothermal Building Envelope Simulation


Abstract
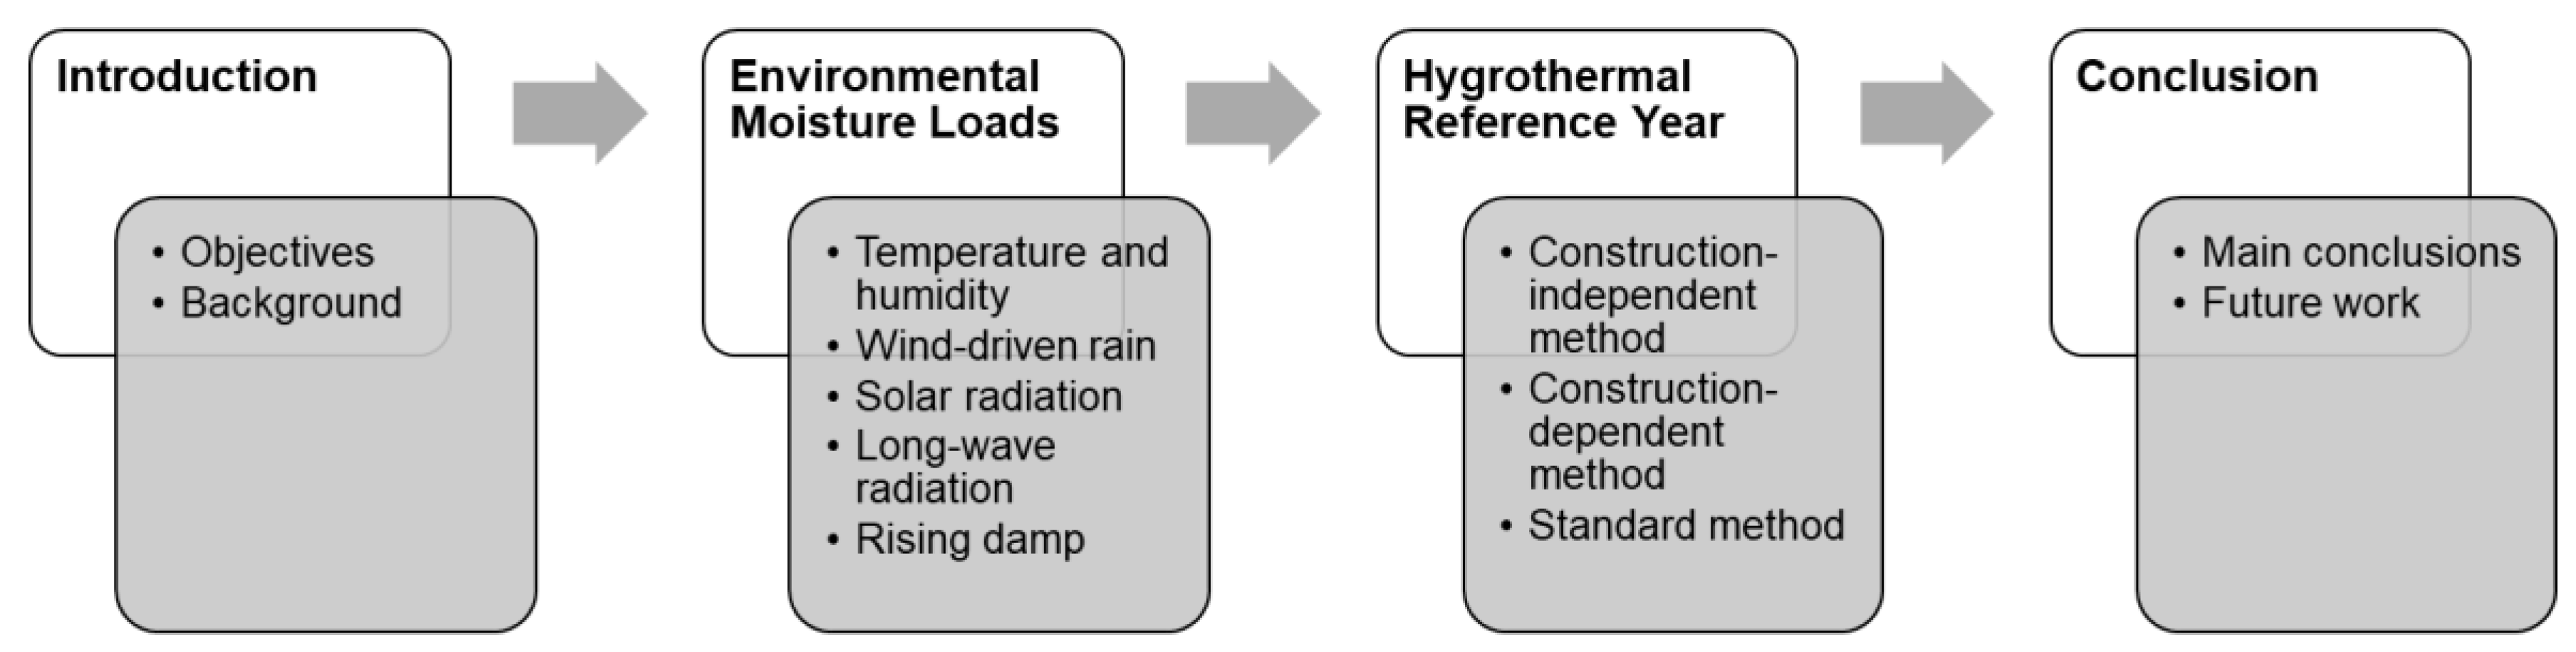
1. Introduction
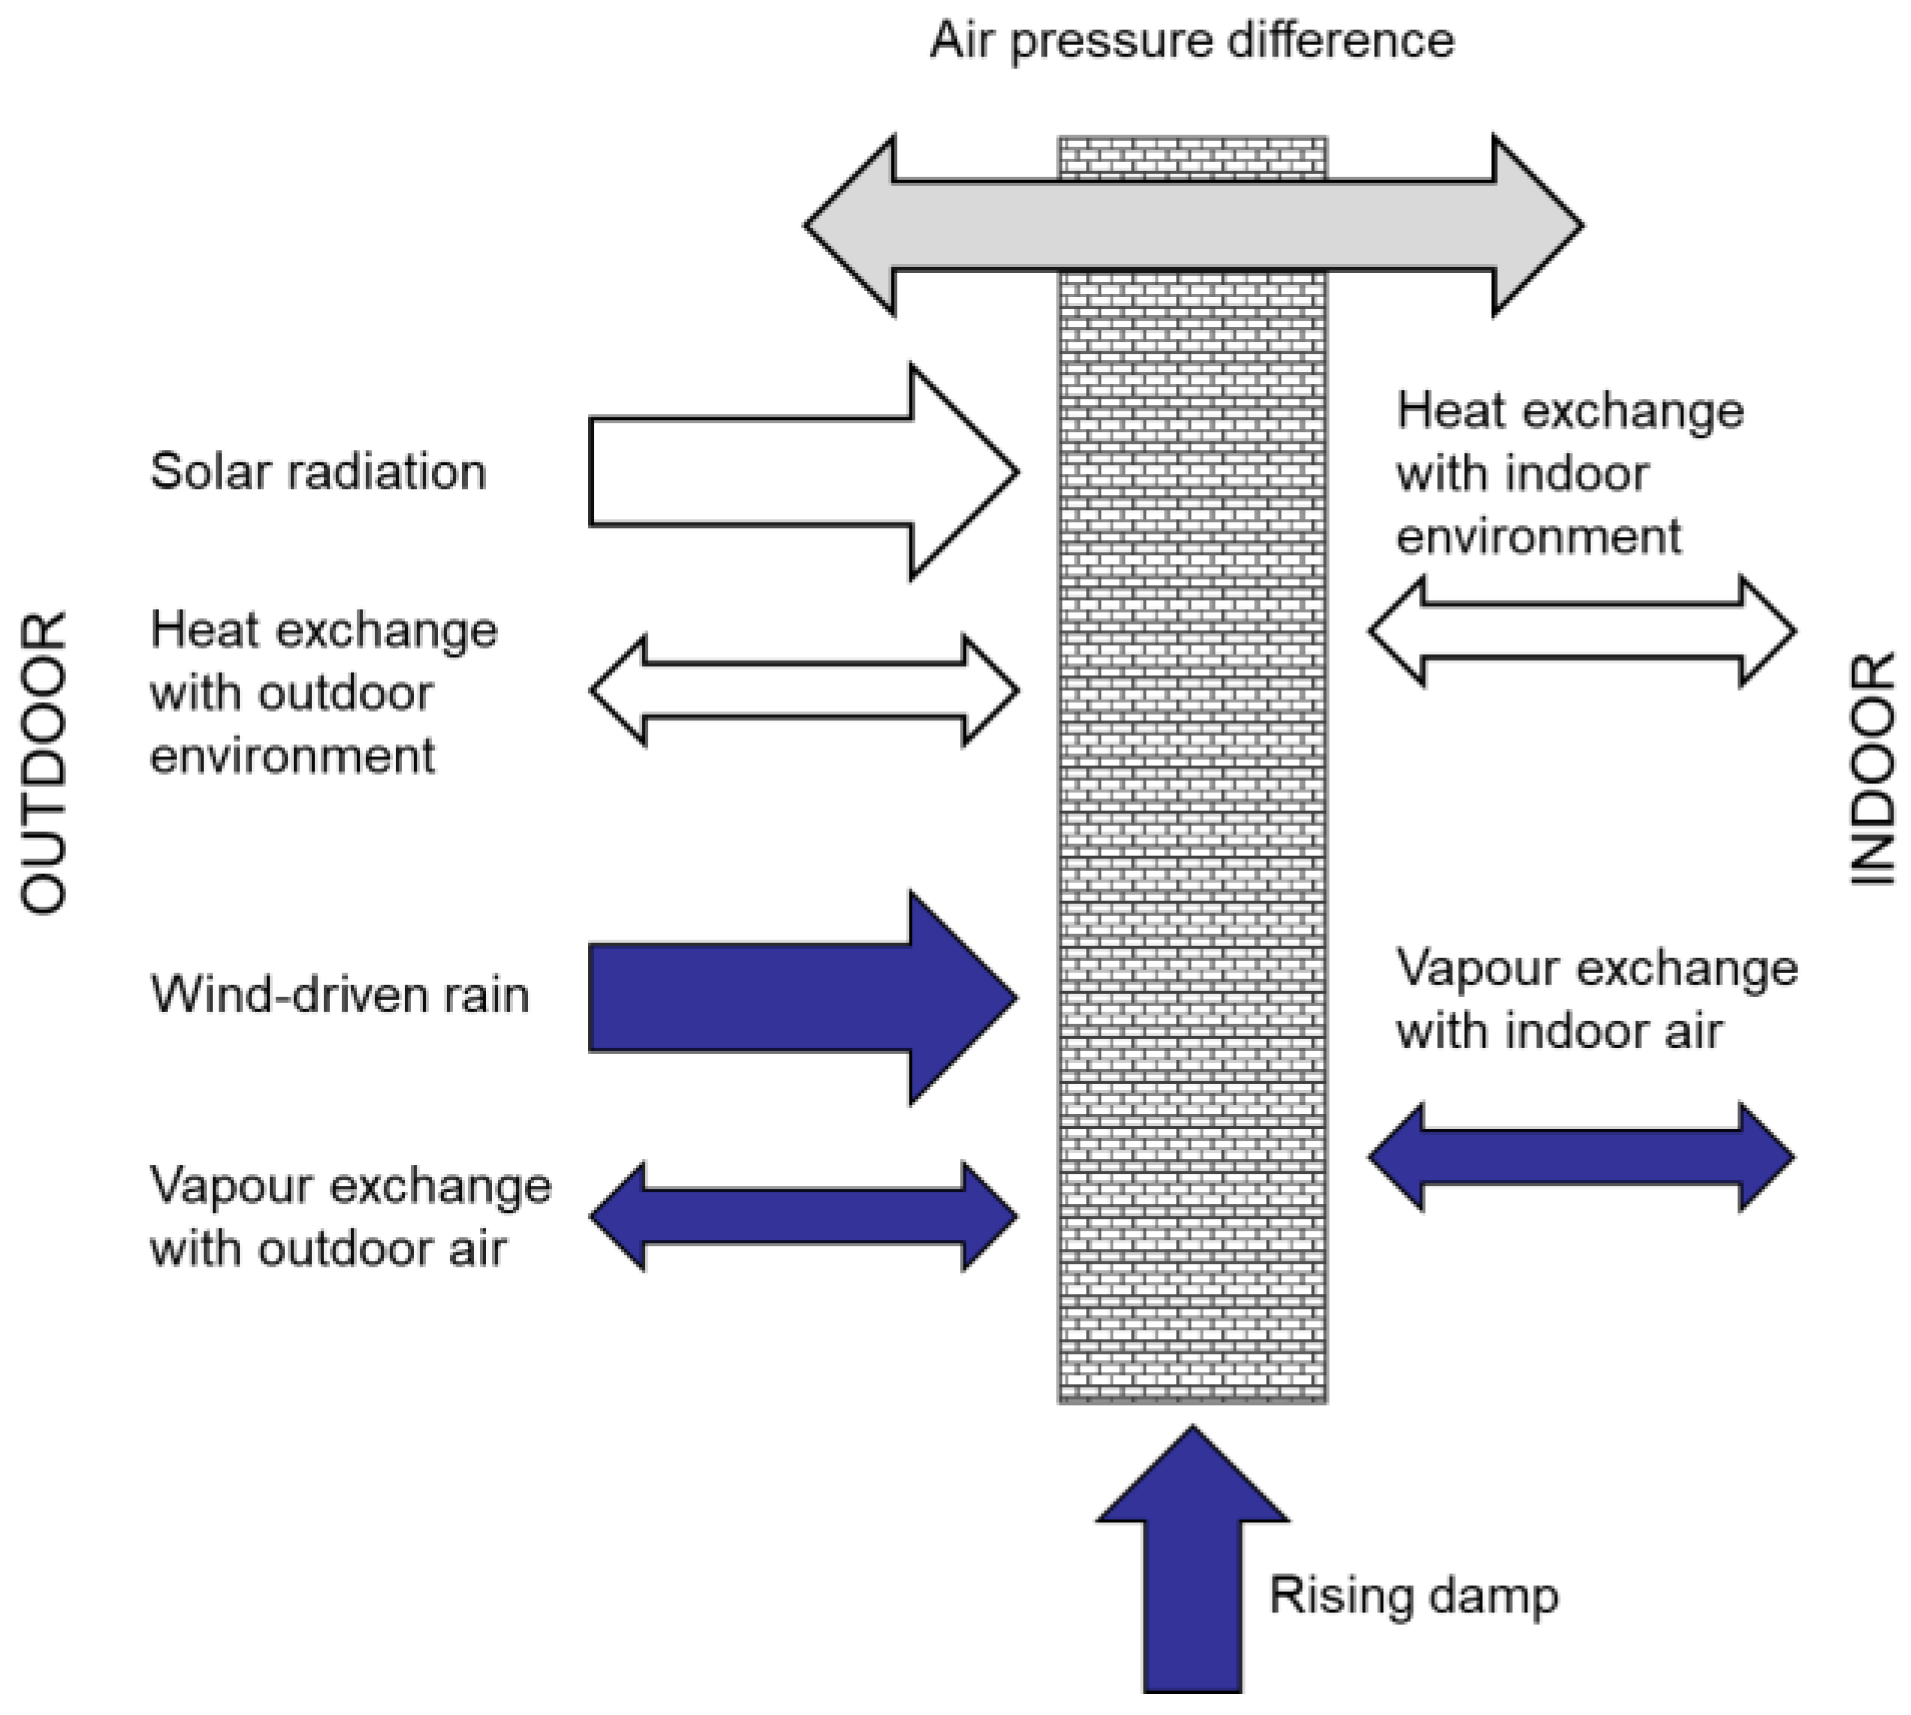
2. Environmental Moisture Loads
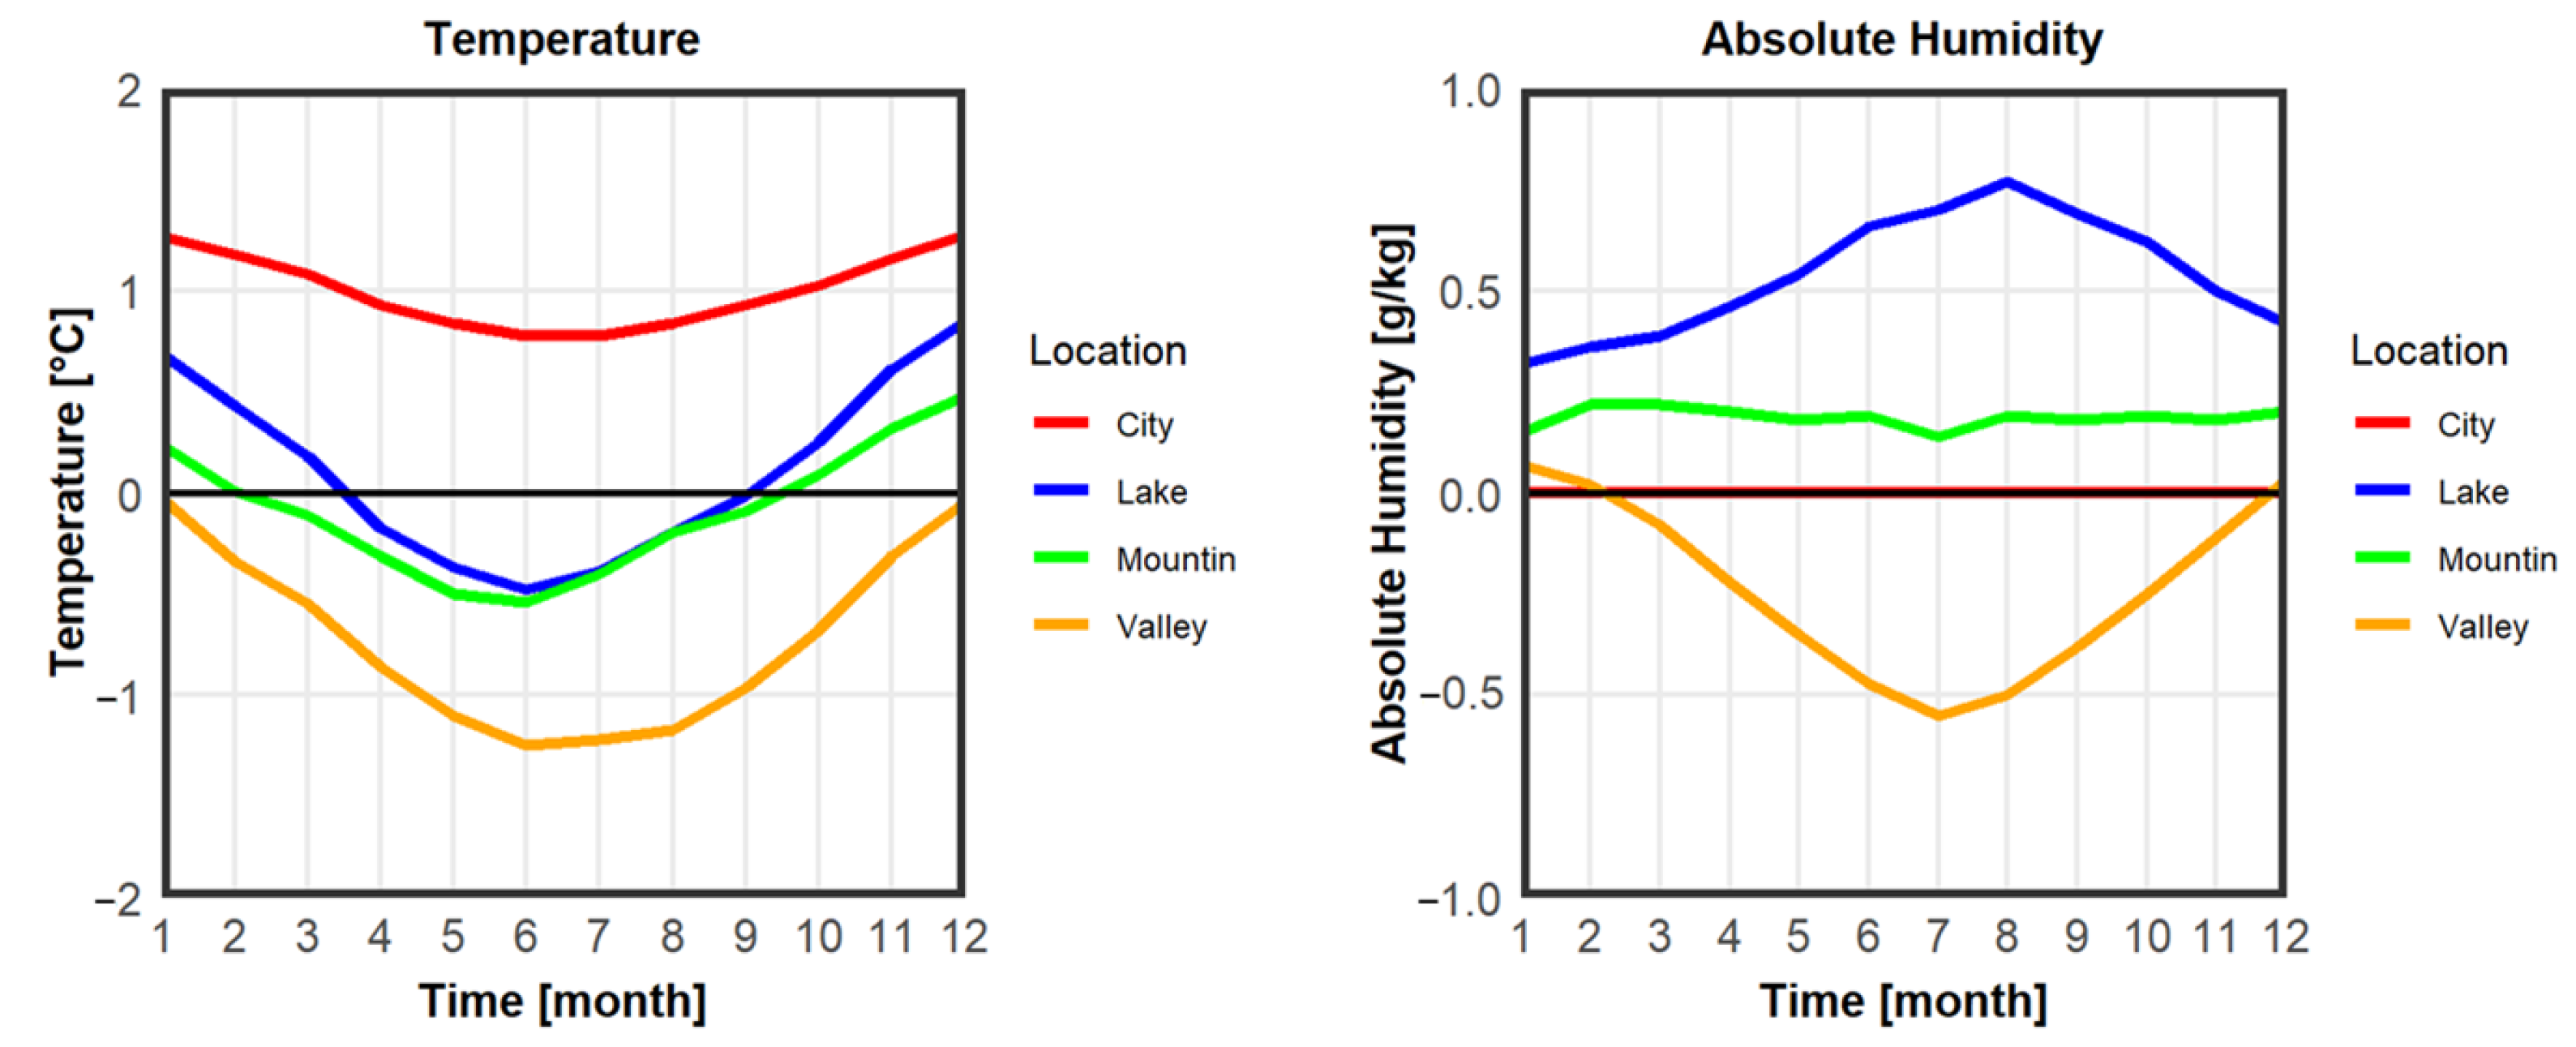
2.1. Temperature and Humidity
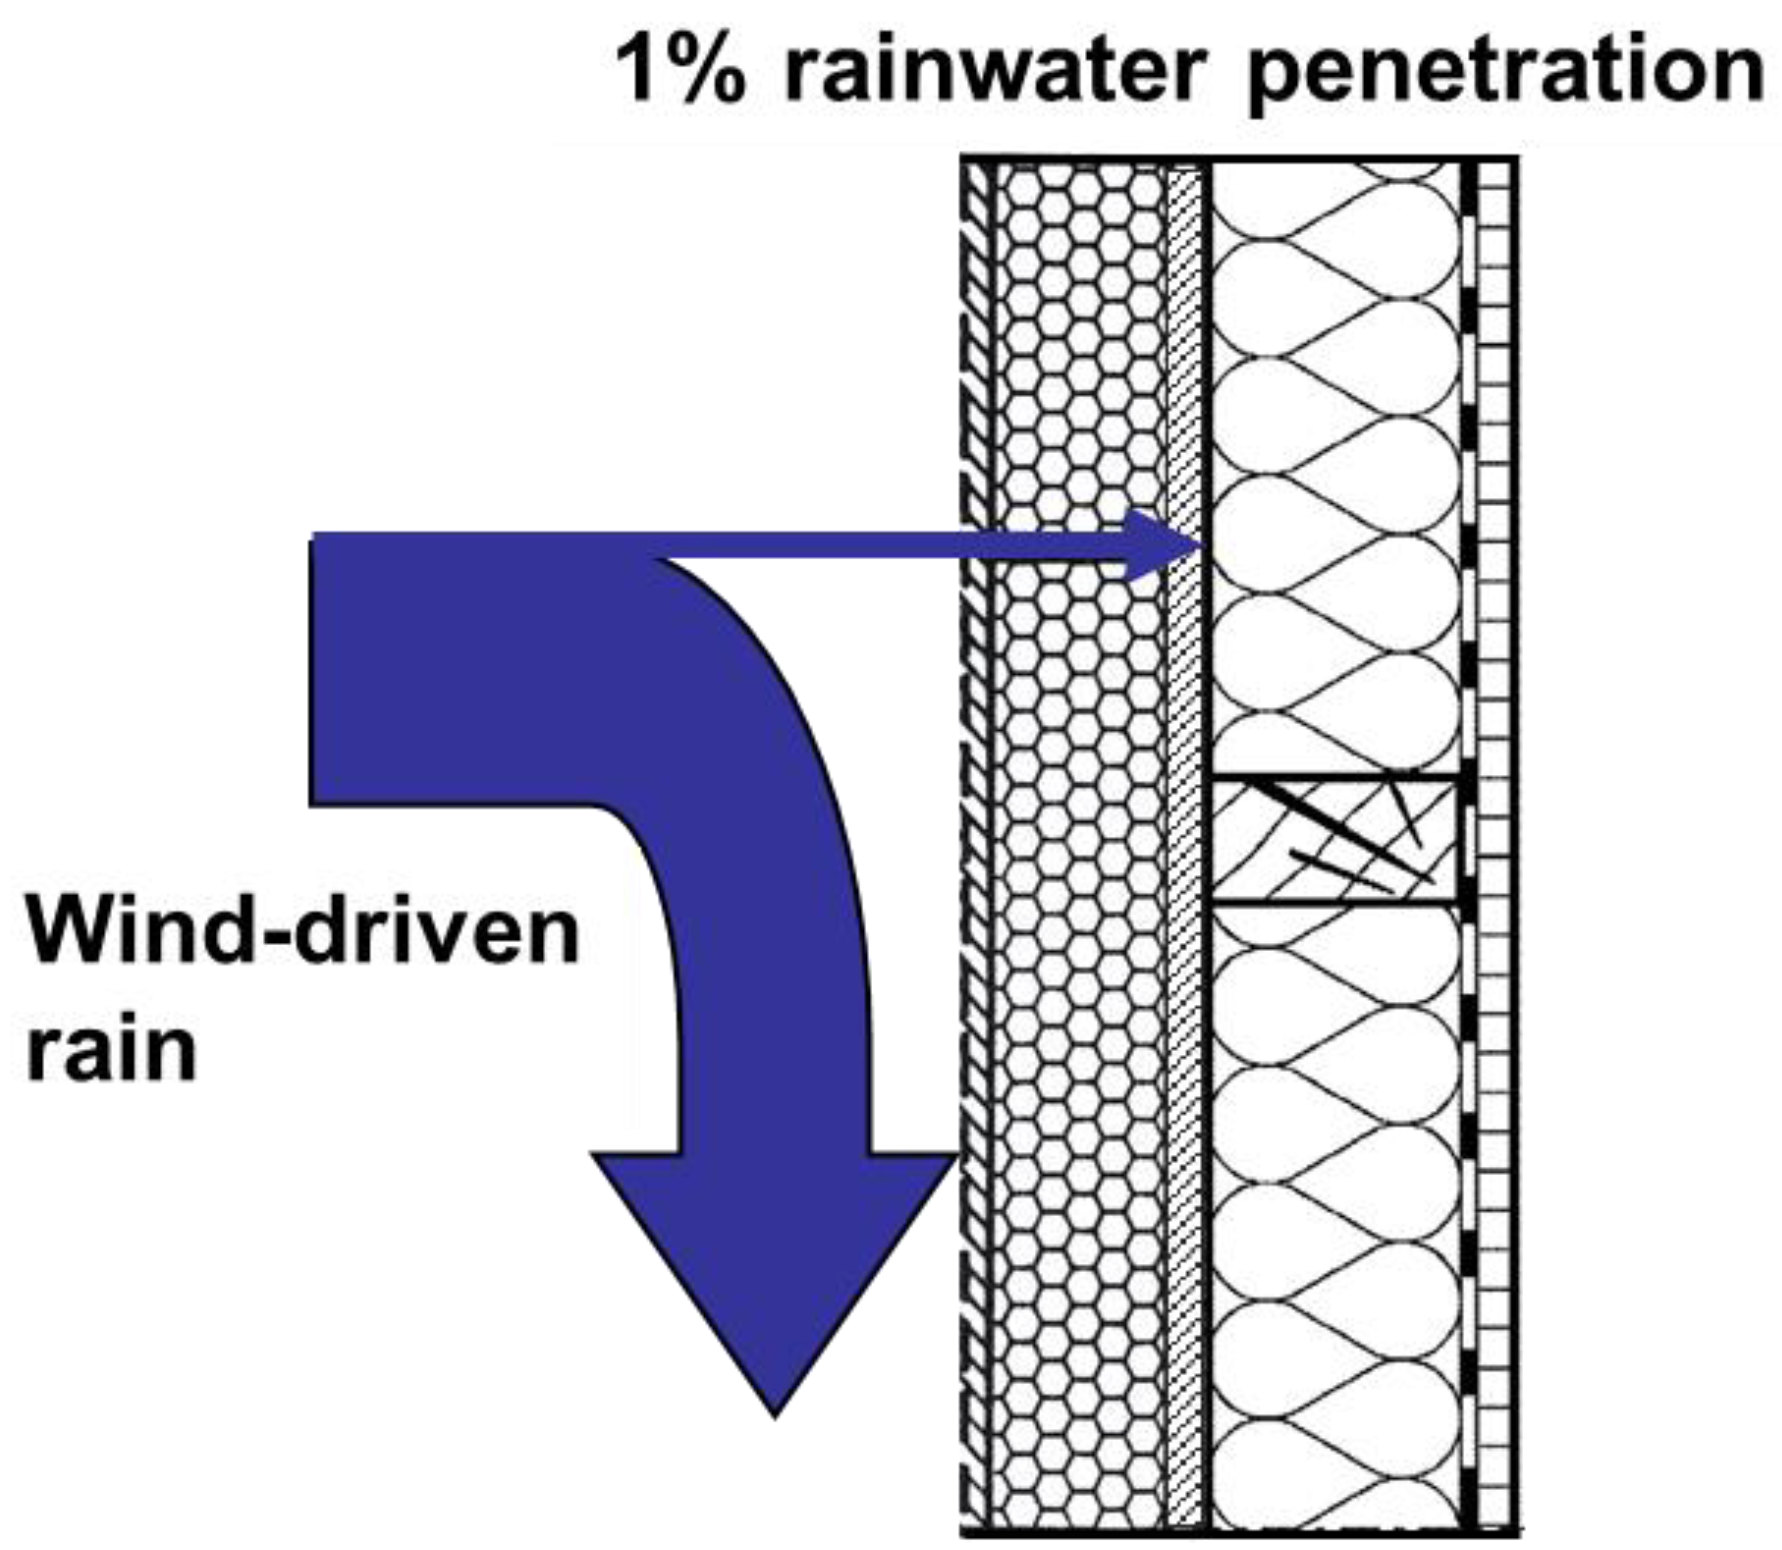
2.2. Driving Rain
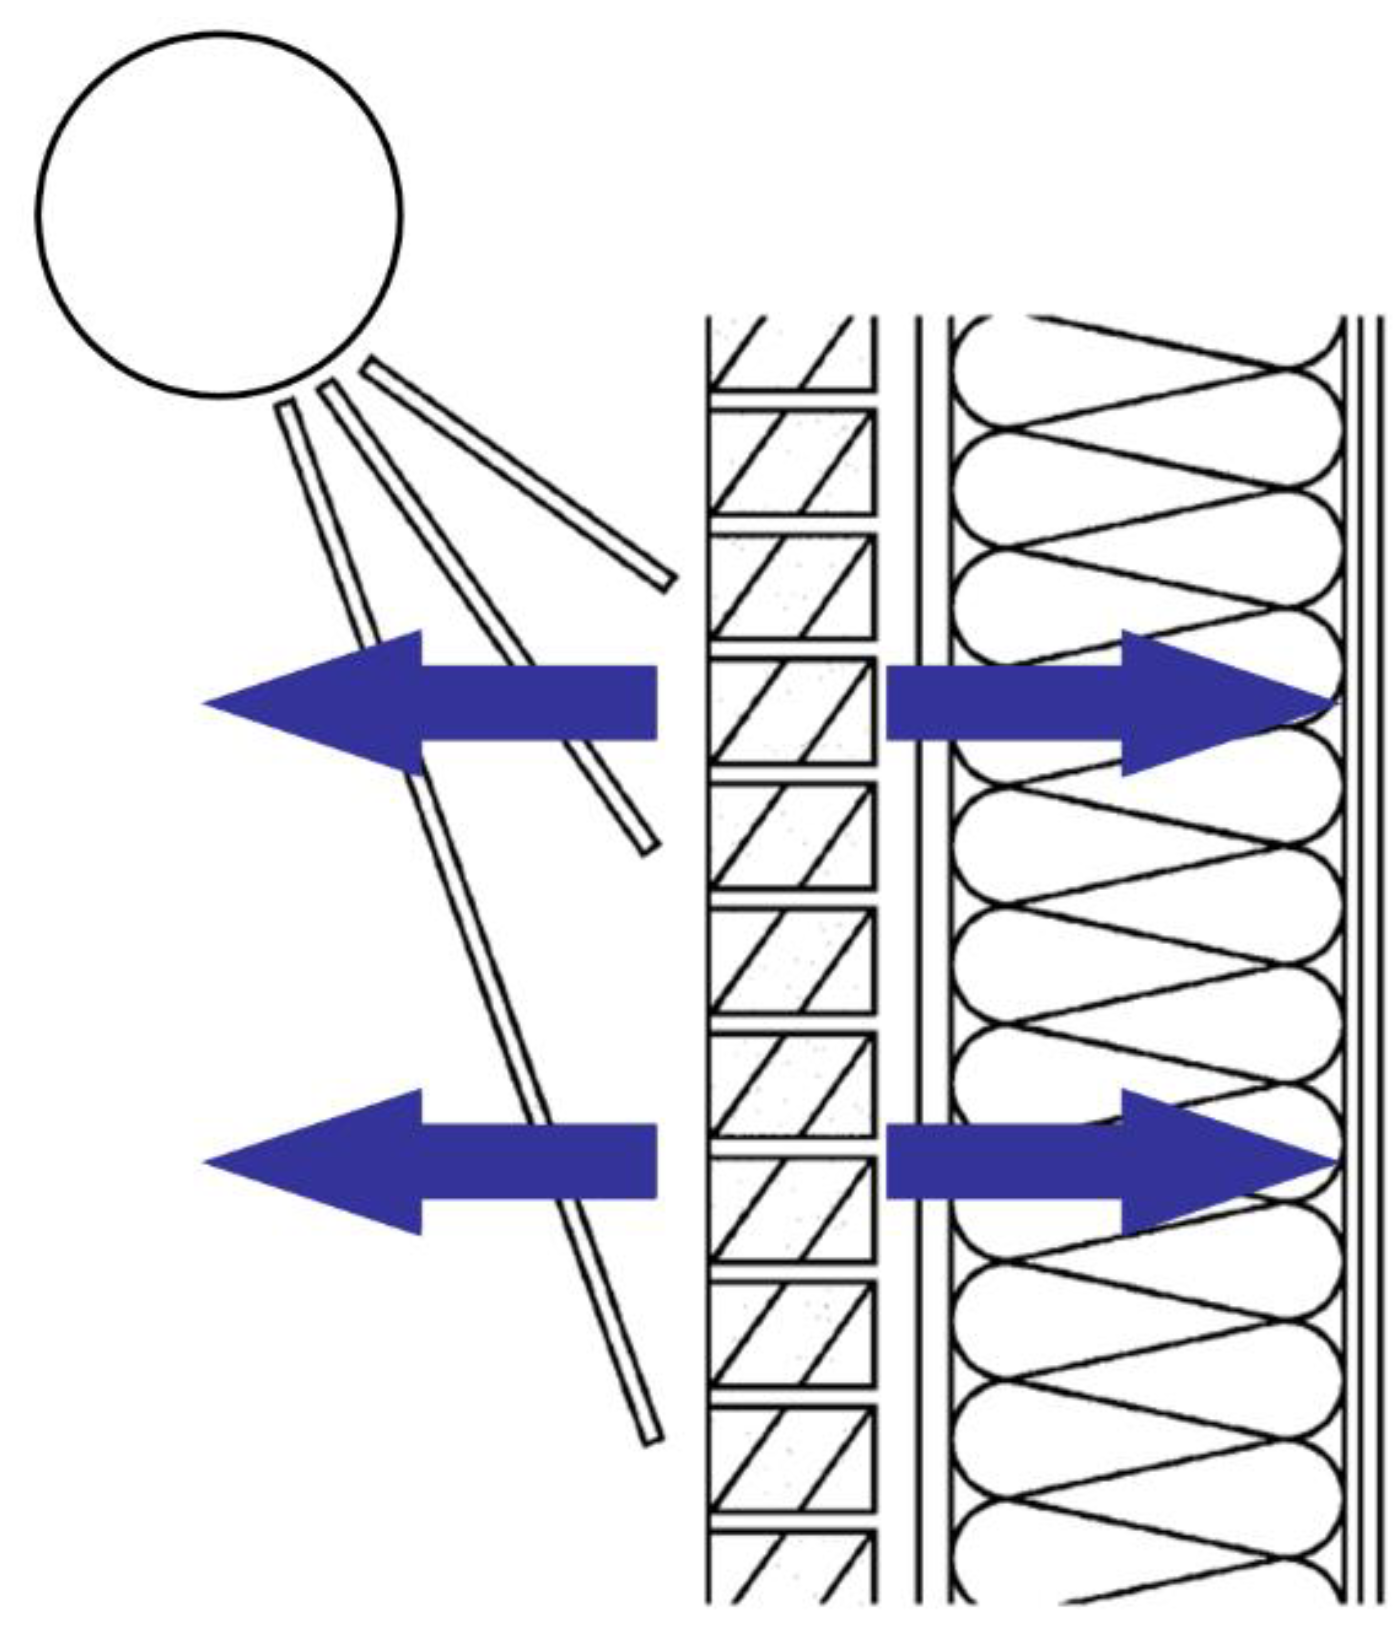
2.3. Solar Radiation
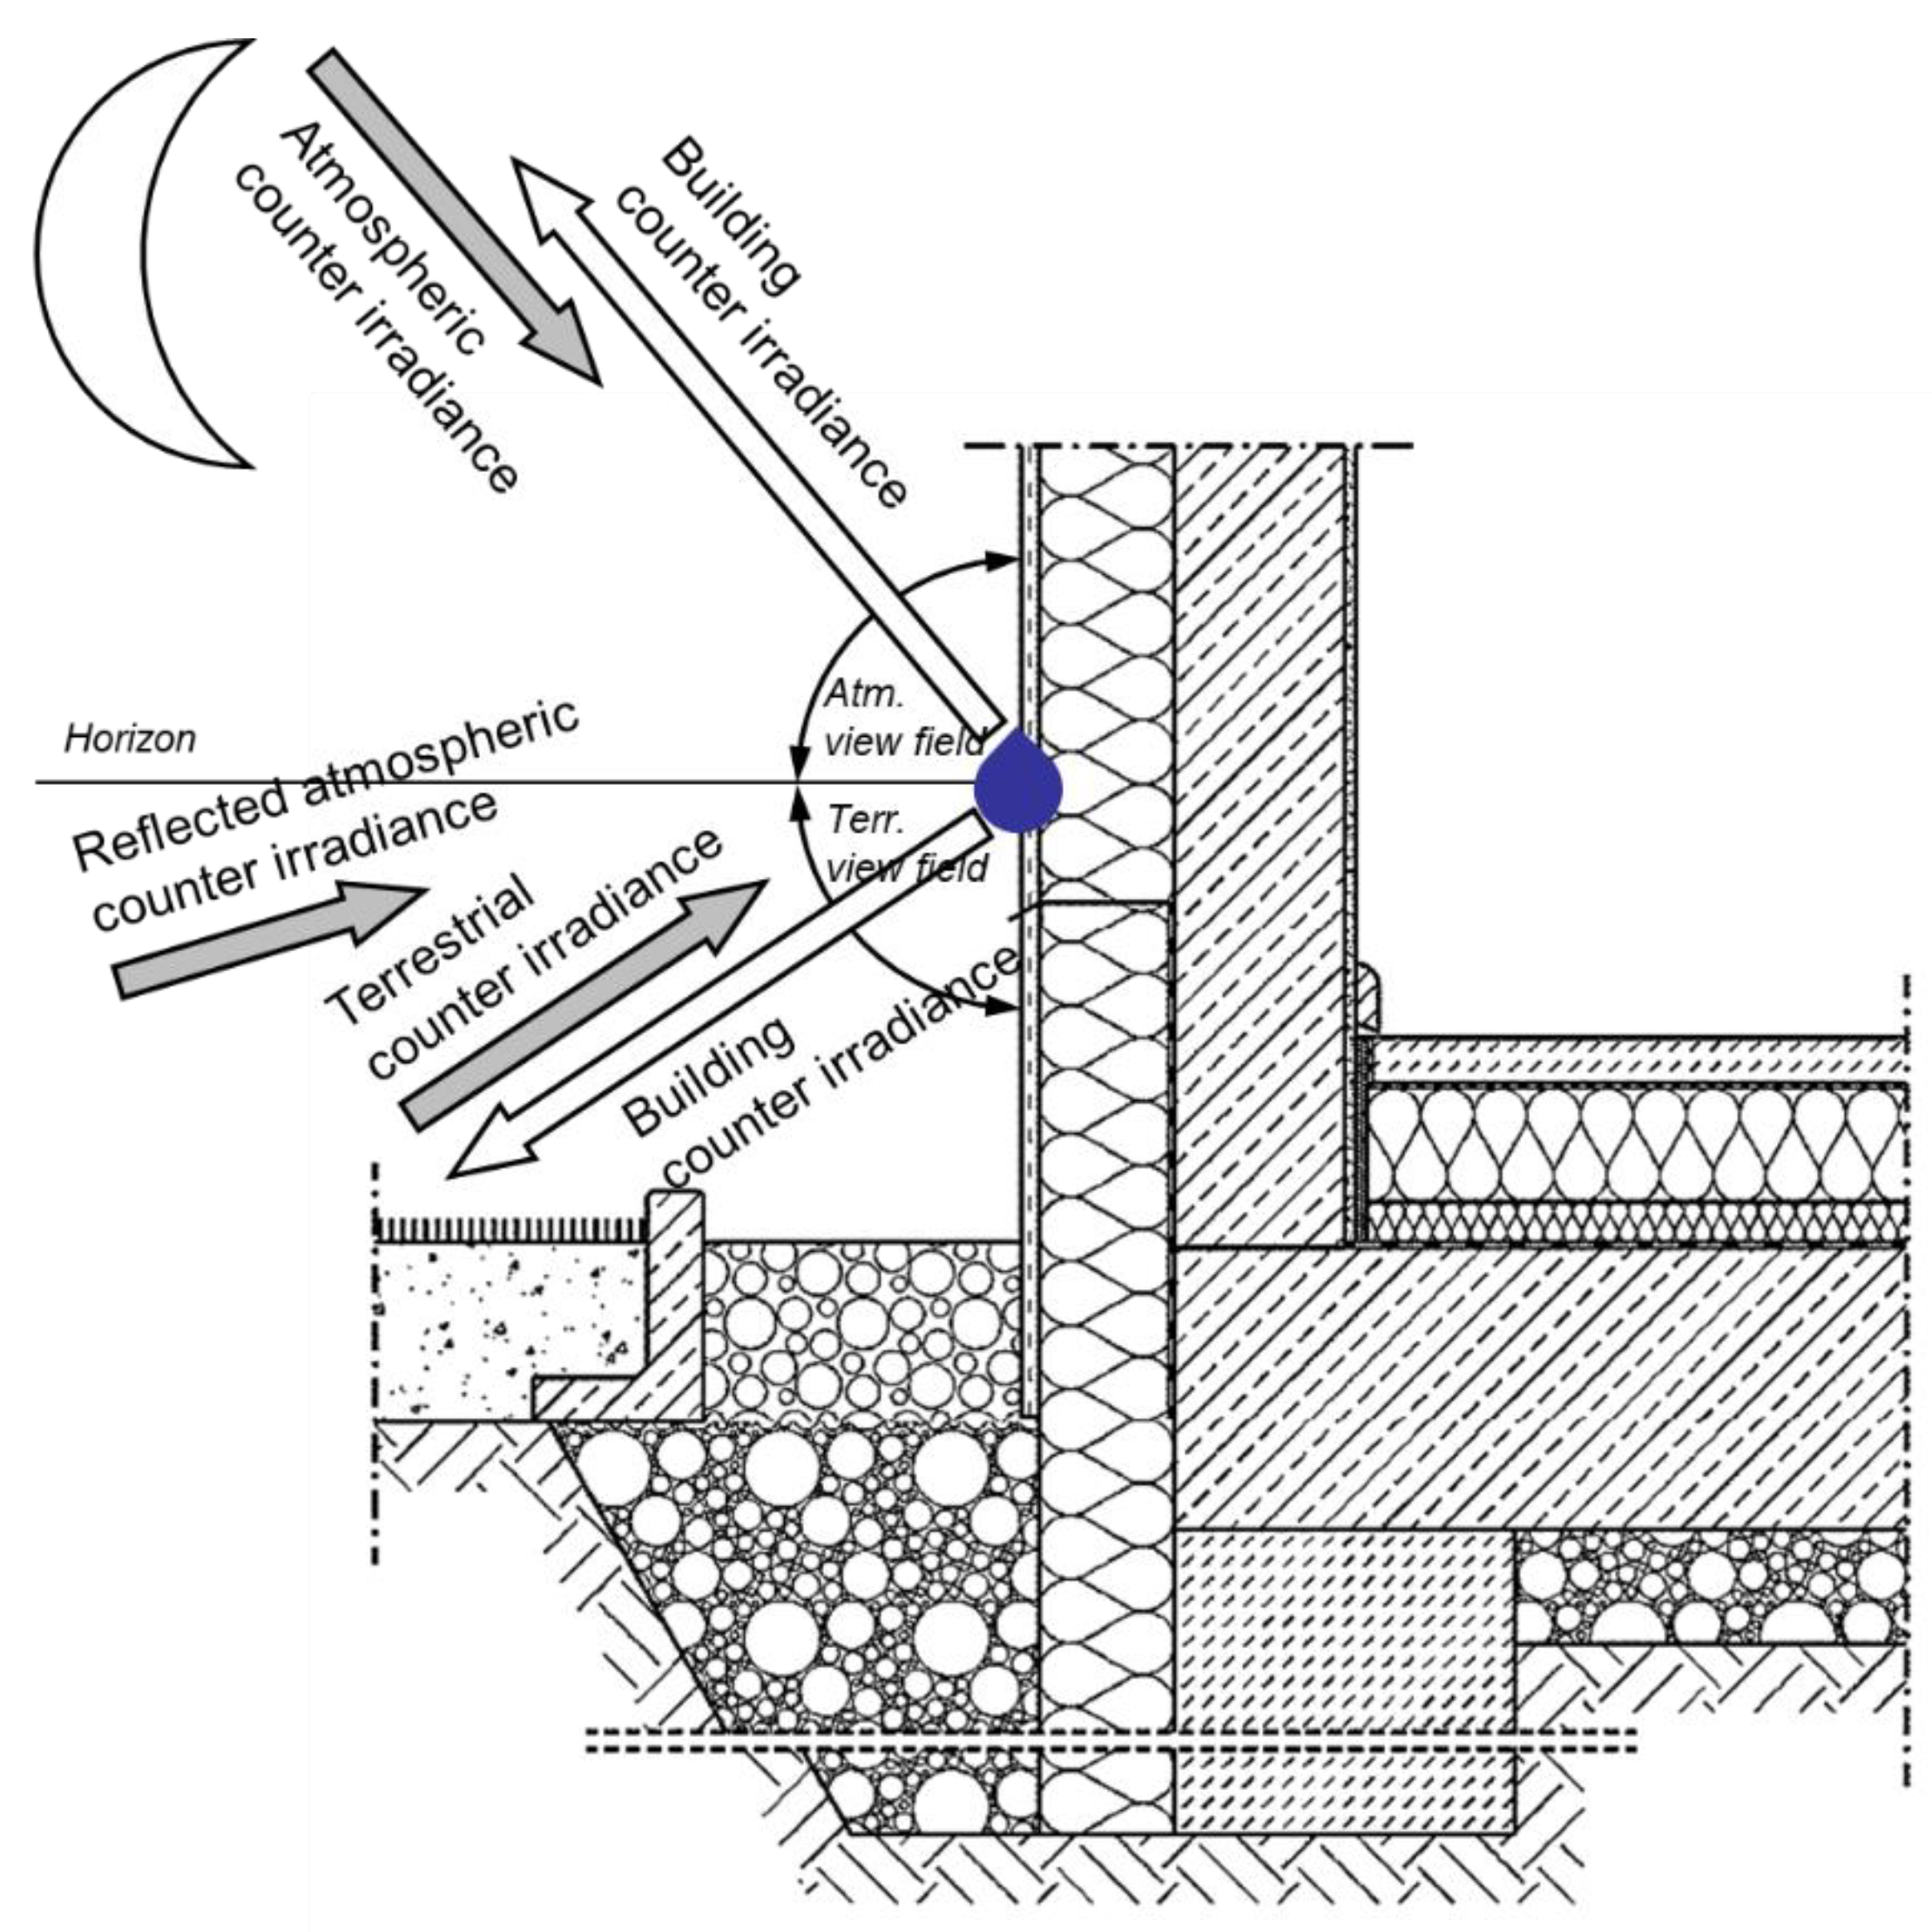
2.4. Long-Wave Radiation
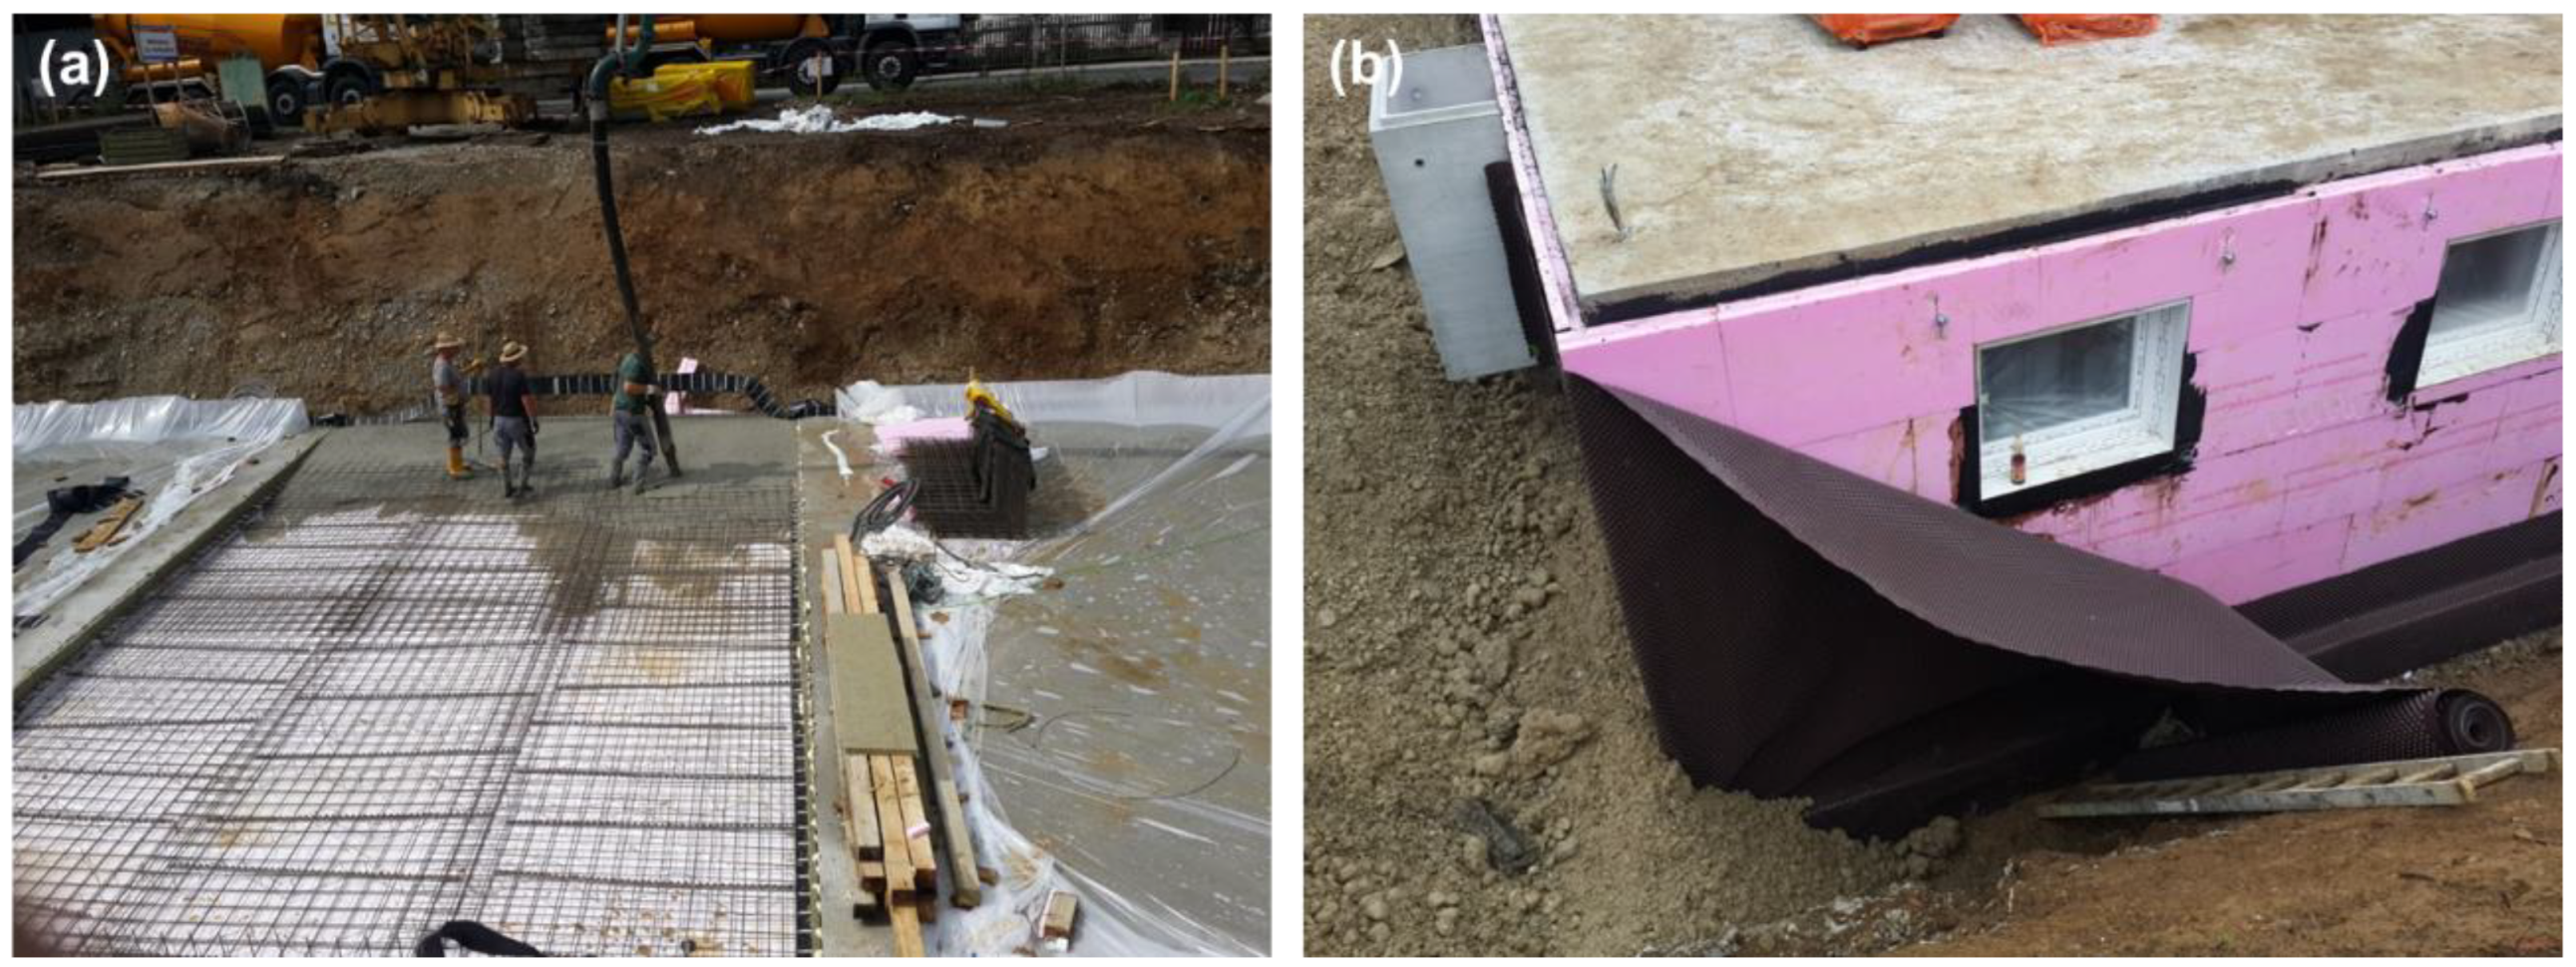
2.5. Rising Damp
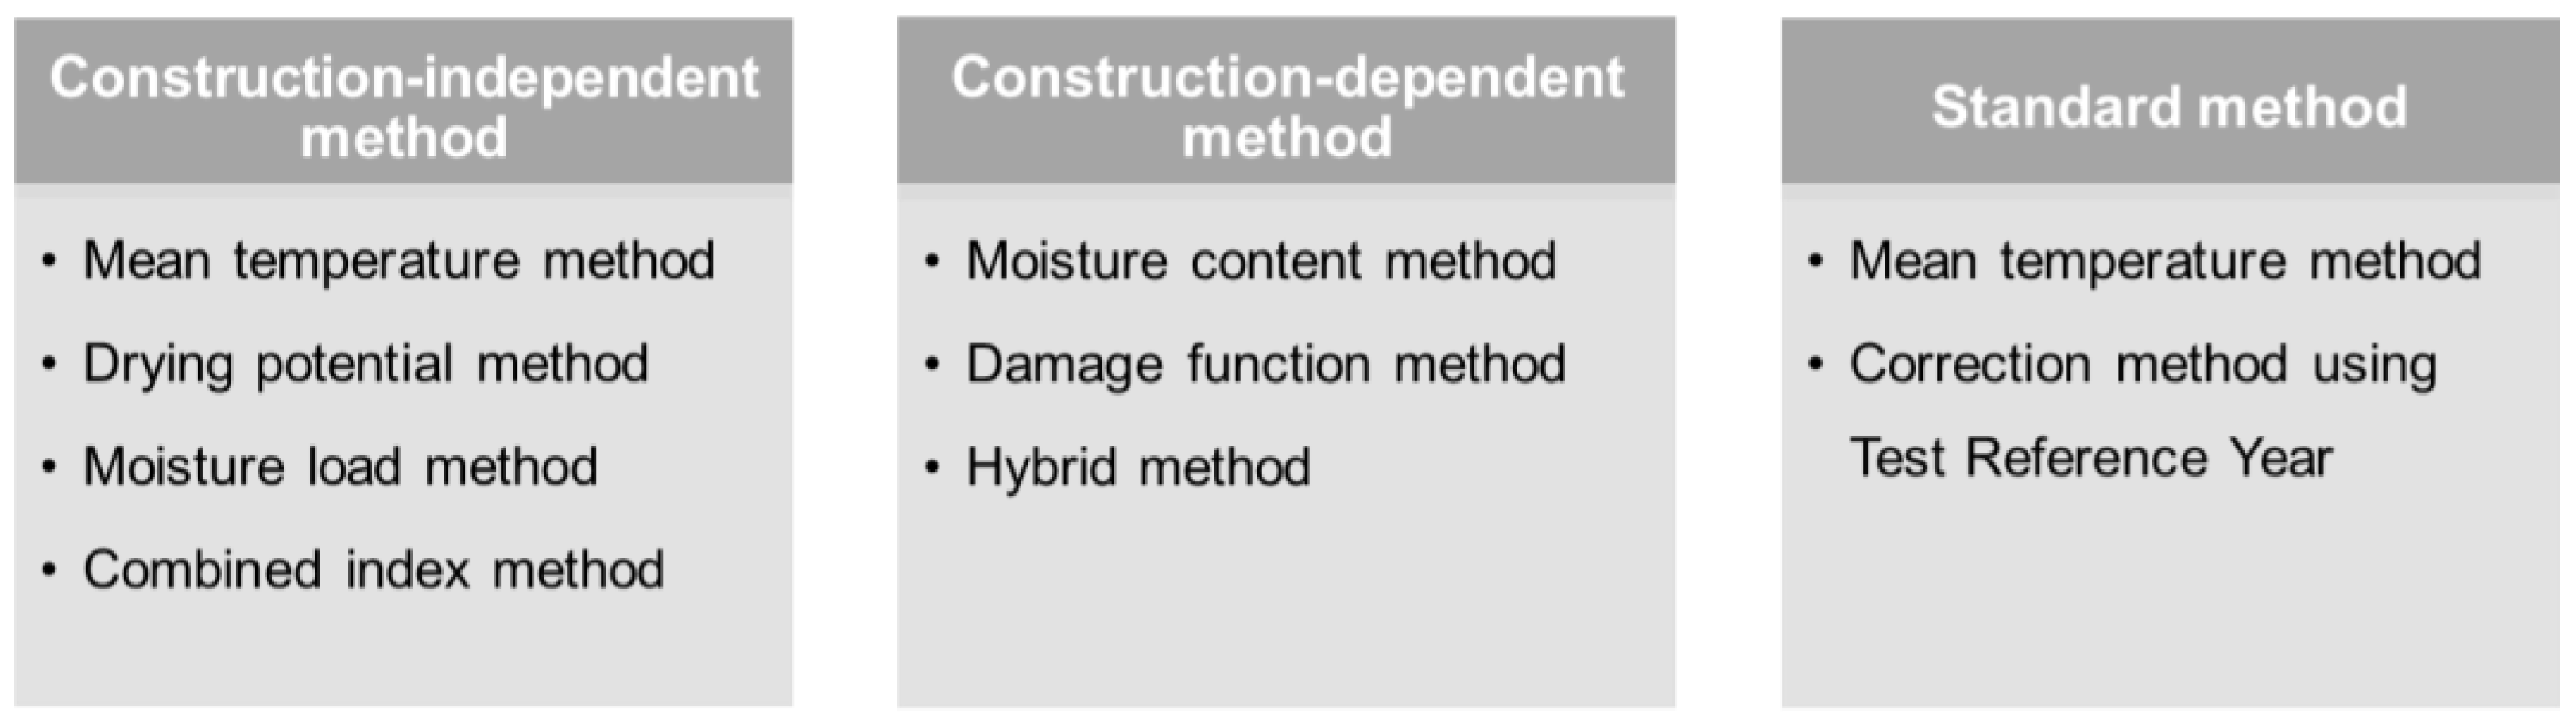
3. Hygrothermal Reference Year
3.1. Construction-Independent Method
3.1.1. Mean Temperature Method
3.1.2. Drying Potential Method
3.1.3. Moisture Load Method
3.1.4. Combined Index Method
3.2. Construction-Dependent Methods
3.2.1. Moisture Content Method
- Rank every year and for each construction in accordance with the average moisture content value determined with a hygrothermal simulation. The year with the highest average moisture content is ranked 1st, with the subsequent and monotonously decreasing years being ranked 2, 3, 4, 5, and so on. For example, with 30 years of weather data, the 10% level will be represented by the 3rd year.
- Select all the years that occurred in the 5 worst year groups for half or more of the constructions and calculate the sum of the rankings for every construction. For example, Table 3 [15] shows that 5 years 1989, 1990, 1991, 1992, and 1994 were each found to be in the 5 worst years in at least 5 of the 6 constructions.
- Select two or three years with the lowest mean rankings.
- Assuming a normal distribution function, calculate the average probability level for each selected year using the average moisture content.
- Repeat the first three steps using the maximum moisture content criteria. It is important that the same years as those selected for the average moisture content (in the second step) must be selected. In this case, the years 1989, 1990, 1991, 1992 and 1994 must be selected.
- Calculate the average probability level for the average and the maximum moisture content for each year selected.
- The year with the lowest probability level is selected to be the HRY for the specific location.
3.2.2. Damage Function Method
3.2.3. Hybrid Climate Analysis and Hygrothermal Performance Method
3.3. Summary of Selection Methods for Hygrothermal Reference Years
3.4. Standards on Moisture-Control Design of Buildings
4. Conclusions
Author Contributions
Funding
Conflicts of Interest
References
- ISO 22185-1; Diagnosing Moisture Damage in Buildings and Implementing Countermeasures–Part 1: Principles, Nomenclature and Moisture Transport Mechanisms. International Standards Organization: London, UK, 2021.
- Künzel, H.M. Raumluftfeuchte in Wohngebäuden–Randbedingung für die Feuchteschutzbeurteilung, Zeitschrift für Wärmeschutz, Kälteschutz, Schallschutz. Brandschutz 2006, 51, 31–41. [Google Scholar]
- American Society of Heating, Refrigerating and Air-Conditioning Engineer. Damp Buildings, Human Health, and HVAC Design; American Society of Heating, Refrigerating and Air-Conditioning Engineer: Atlanta, GA, USA, 2020. [Google Scholar]
- Bundesministerium für Wirtschaft und Energie. Energieeffizienz-Strategie Gebäude-Wege zu Einem Nahezu Klimaneutralen Gebäudebestand, Kapital 2–1.4 Restriktionen zur Reduktion des Endenergiebedarfs Durch Effizienzmaßnahmen; Bundesministerium für Wirtschaft und Energie: Berlin, Germany, 2015. [Google Scholar]
- U.S. Environmental Protection Agency (USEPA). Moisture Control Guidance for Building Design, Construction and Maintenance; U.S. Environmental Protection Agency (USEPA): Washington, DA, USA, 2013.
- VHV Allgemeine Versicherung AG. VHV-Bauschadenbericht Hochbau 2021/22, Kapitel 4 Aktuelle Schadenanalyse; Fraunhofer-Informationszentrum Raum und Bau IRB: Stuttgart, Germany, 2022. [Google Scholar]
- Künzel, H.M. Moisture risk assessment of roof constructions by computer simulation in comparison to the standard Glaser-method. In Proceedings of the International Building Physics Conference, Eindhoven, The Netherlands, 18–21 September 2000. [Google Scholar]
- Künzel, H.M.; Zirkelbach, D. Advances in hygrothermal building component simulation–Modelling moisture sources likely to occur due to rainwater leakage. J. Build. Perform. Simul. 2013, 5, 346–353. [Google Scholar] [CrossRef]
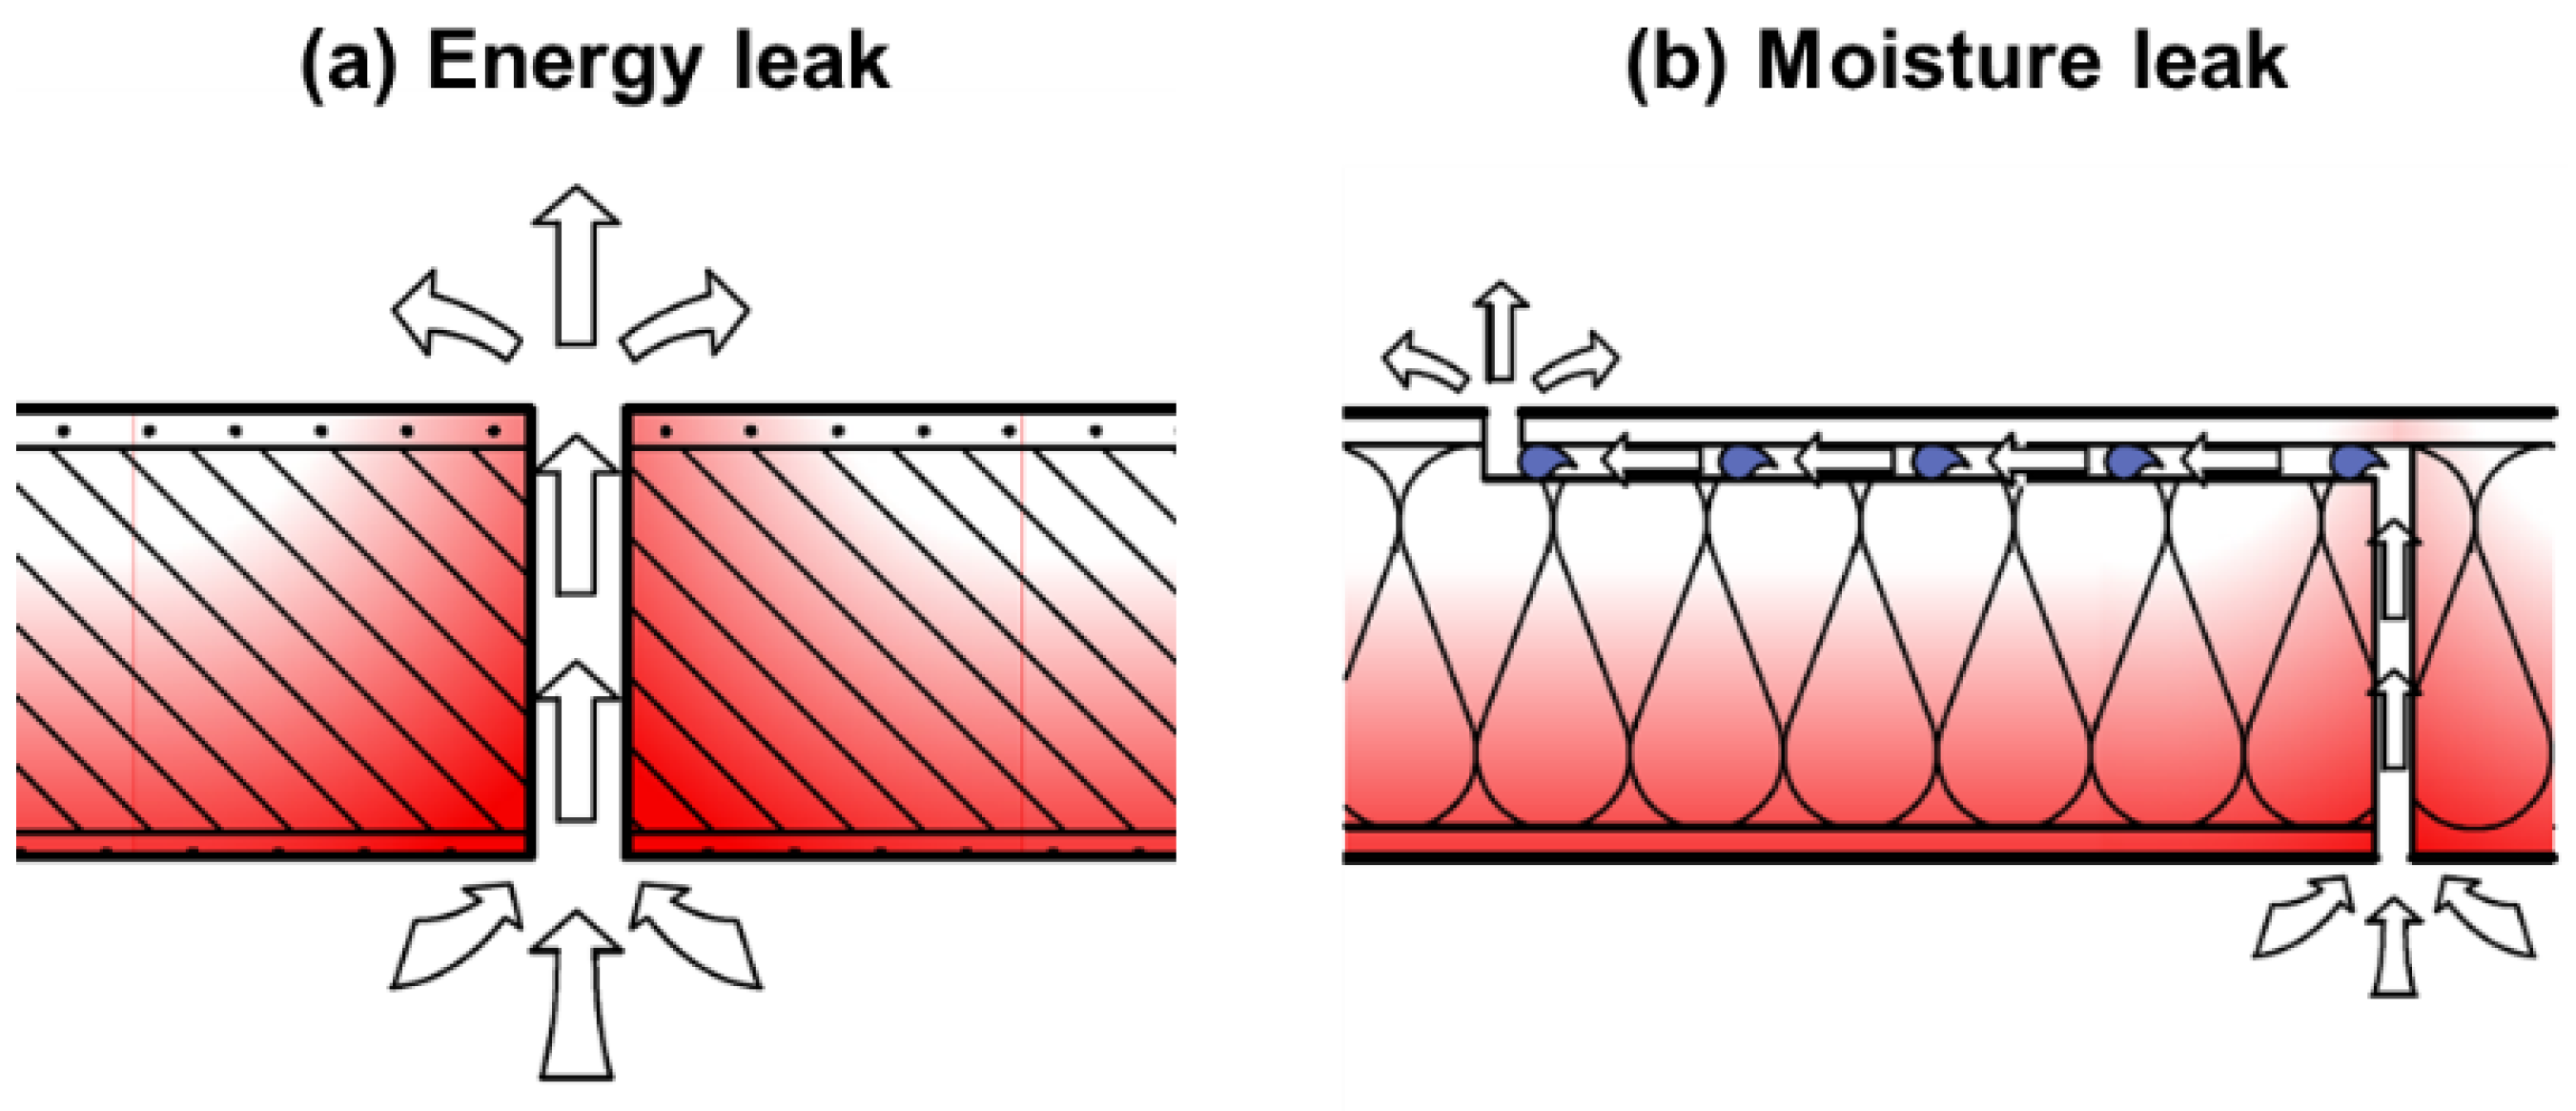
- Künzel, H.M.; Zirkelbach, D.; Schafaczek, B. Vapour control design of wooden structures including moisture sources due to air exfiltration. In Proceedings of the 9th Nordic Symposium on Building Physics, Tampere, Finland, 29 May–2 June 2011; pp. 189–196. [Google Scholar]
- ISO 15927-4; Hygrothermal Performance of Buildings–Calculation and Presentation of Climatic Data–Part 4: Hourly Data for Assessing the Annual Energy Use for Heating and Cooling. International Standards Organization: London, UK, 2005.
- Hall, I.J.; Prairie, R.R.; Anderson, H.E.; Boes, E.C. Generation of a typical meteorological year. In Proceedings of the Annual Meeting of the American Section of the International Solar Energy Society, Denver, CO, USA, 28–31 August 1978; pp. 669–671. [Google Scholar]
- Marion, W.; Urban, K. User’s Manual for TMY2s Derived from the 1961–1990 National Solar Radiation Data Base; National Renewable Energy Laboratory: Golden, CO, USA, 1995.
- Wilcox, S.; Marion, W. User’s Manual for TMY3 Data Sets; National Renewable Energy Laboratory: Golden, CO, USA, 2008.
- Sanders, C. Environmental conditions. In Energy Conservation in Buildings and Community Systems, Annex 24 Heat-Air and Moisture Transfer in Insulated Envelope Parts (HAMTIE); International Energy Agency: Paris, France, 1996. [Google Scholar]
- Geving, S. Moisture Design of Building Constructions: Hygrothermal Analysis Using Simulation Models–Part I and II. Ph.D. Thesis, Norwegian University of Science and Technology, Faculty of Civil and Environmental Engineering, Trondheim, Norway, 1997. [Google Scholar]
- Künzel, H.M.; Karagiozis, A. Vapor control in cold and coastal climate zones. In Proceedings of the 3th Conference of International Building Performance Simulation Association-Canada, Sydney, Australia, 14–16 November 2004; pp. 55–60. [Google Scholar]
- ASHRAE Fundamental Handbook, Chapter 25 Heat, Air, and Moisture Control in Building Assemblies–Fundamentals; American Society of Heating and Air-Conditioning Engineers: Atlanta, GA, USA, 2017.
- TenWolde, A.; Carll, C.G.; Malinauskas, V. Air Pressures in wood frame walls. In Proceedings of the Conference Proceedings Thermal Envelopes VII, Clearwater Beach, FL, USA, 6–10 December 1999; pp. 665–675. [Google Scholar]
- ANSI/ASHRAE Standard 160-2021; Criteria for Moisture-Control Design Analysis in Buildings. American Society of Heating and Air-Conditioning Engineers: Atlanta, GA, USA, 2021. Available online: https://www.techstreet.com/ashrae/standards/ashrae-160-2021?product_id=2242192 (accessed on 3 April 2023).
- DIN 4108-3; Thermal Protection and Energy Economy in Buildings–Part 3: Protection against Moisture Subject to Climate Conditions–Requirements, Calculation Methods and Directions for Planning and Construction. Deutsches Institut für Normung: Berlin, Germany, 2018.
- Derome, D.; Karagiozis, A.; Carmeliet, J. The Nature, Significance and Control of Solar-Driven Diffusion in Wall Systems; ASHRAE research report RP-1235; ASH RAE: Washington, DC, USA, 2009. [Google Scholar]
- Finch, G.; Straube, J. Ventilated wall claddings: Review, field Performance, and hygrothermal Modeling. In Proceedings of the Buildings X Conference, American Society of Heating and Air-Conditioning Engineers, Atlanta, GA, USA, 2–7 December 2007. [Google Scholar]
- Burnett, E.; Straube, J.; Karagiozis, A. Development of design strategies for rainscreen and sheathing membrane performance in wood frame walls. In ASHRAE Research Project RP-1091; ASH RAE: Washington, DC, USA, 2004. [Google Scholar]
- Künzel, H.M. Factors determining surface moisture on external walls. In Proceedings of the Buildings X Conference, Atlanta, GA, USA, 2–7 December 2007; American Society of Heating and Air-Conditioning Engineers: Atlanta, GA, USA, 2007. [Google Scholar]
- Kehrer, M.; Schmidt, T. Temperaturverhältnisse an Außenoberflächen unter Strahlungseinflüssen. In Proceedings of the Conference of International Building Performance Simulation Association-BauSIM, Bruges, Belgium, 1–3 September 2006. [Google Scholar]
- Mesoscale and Microscale Meteorology Laboratory. Weather Research & Forecasting Model (WRF). Available online: https://www.mmm.ucar.edu/models/wrf (accessed on 3 February 2023).
- Tanaka, E.; Zirkelbach, D.; Schöner, T. Lokalklima–Modelle zur Anpassung von Referenzklimadaten auf die lokalen Verhältnisse; IBP-Mitteilung 551; Fraunhofer-Institut für Bauphysik IBP: Stuttgart, Germany, 2017. [Google Scholar]
- Eibl, M.; Kilian, R. Climate for Culture-Measurement Guideline; Fraunhofer Institute for Building Physics: Stuttgart, Germany, 2011. [Google Scholar]
- Künzel, H.M. Regendaten für die Berechnung des Feuchtetransports; IBP-Mitteilung 265; Fraunhofer-Institut für Bauphysik IBP: Stuttgart, Germany, 1995. [Google Scholar]
- ISO 13788; Hygrothermal Performance of Building Components and Building Elements–Internal Surface Temperature to Avoid Critical Surface Humidity and Interstitial Condensation–Calculation Methods. International Standards Organization: London, UK, 2012.
- EN 15026; Hygrothermal Performance of Building Components and Building Elements–Assessment of Moisture Transfer by Numerical Simulation. European Committee for Standardization: Bruxelles, Belgium, 2007.
- ANSI/ASHRAE Standard 160-2016; Criteria for Moisture-Control Design Analysis in Buildings. American Society of Heating and Air-Conditioning Engineers: Atlanta, GA, USA, 2016. Available online: https://www.techstreet.com/ashrae/standards/ashrae-160-2016?product_id=1939166 (accessed on 3 April 2023).
- BS 5250; Code of Practice for Control of Condensation in Buildings. British Standards Institution: Cambridge, UK, 2011.
- Djebbar, R.; van Reenen, D.; Kumaran, M.K. Indoor and outdoor weather analysis tool for hygrothermal modelling. In Proceedings of the 8th Conference on Building Sciences and Technology–Solutions to Moisture Problems in Building Enclosures, Toronto, ON, Canada, 6–8 May 2001; pp. 140–157. [Google Scholar]
- Cornick, S.M.; Dalgliesh, W.A.; Said, N.M.; Djebbar, R.; Tariku, F.; Kumaran, M.K. Task 4 Environmental Conditions Final Report; IRC–RR–113; Institute for Research in Construction, National Research Council of Canada: Ottawa, ON, Canada, 2002. [Google Scholar]
- Ali Mohamed, F.; Hens, H. Outdoor Climate: Reference Years–Equivalent Temperature for Condensation. In Energy Conservation in Buildings and Community Systems, Annex 24 Heat-Air and Moisture Transfer in Insulated Envelope Parts (HAMTIE); Report T2-B-92/03; International Energy Agency: Paris, France, 1992. [Google Scholar]
- Sanders, C. Proposals for work resulting from the Glasgow meeting. In Energy Conservation in Buildings and Community Systems, Annex 24 Heat-Air and Moisture Transfer in Insulated Envelope Parts (HAMTIE); International Energy Agency: Paris, France, 1993. [Google Scholar]
- Künzel, H.M.; Schmidt, T. Auswahl und Aufbereitung von meteorologischen Datensätzen für Feuchtetransportberechnungen. In Proceedings of the Tagungsband Bauklimatisches Symposium, Dresden, Germany, 27–29 September 1999; pp. 637–647. [Google Scholar]
- Hagentoft, E.; Harderup, E. Climatic influences on the building envelope using the Π-Factor. In Energy Conservation in Buildings and Community Systems, Annex 24 Heat-Air and Moisture Transfer in Insulated Envelope Parts (HAMTIE); Task 2. Environmental Conditions; International Energy Agency: Paris, France, 1996. [Google Scholar]
- Kalamees, T.; Vinha, J. Estonian climate analysis for selecting moisture reference years for hygrothermal calculations. J. Therm. Envel. Build. Sci. 2004, 27, 199–220. [Google Scholar] [CrossRef]
- Karagiozis, A.N. Weather File Analyzer Software; Oak Ridge National Laboratory: Oak Ridge, TN, USA, 2003.
- Cornick, S.; Djebbar, R.; Dalgliesh, W.A. Selecting moisture reference years using a Moisture Index approach. Build. Environ. 2003, 38, 1367–1379. [Google Scholar] [CrossRef]
- Straube, J.F. Moisture Control and Enclosure Wall Systems. Ph.D. Thesis, Civil Engineering Department, University of Waterloo, Waterloo, ON, Canada, 1998. [Google Scholar]
- Zhou, X.; Derome, D.; Carmeliet, J. Robust moisture reference year methodology for hygrothermal simulations. Build. Environ. 2016, 110, 23–35. [Google Scholar] [CrossRef]
- Rode, C. Reference years for moisture calculations. In Energy Conservation in Buildings and Community Systems, Annex 24 Heat-Air and Moisture Transfer in Insulated Envelope Parts (HAMTIE); International Energy Agency: Paris, France, 1993. [Google Scholar]
- Juráš, P.; Žilinský, J. Comparison of HAM simulation with different reference years for Bratislava. In Advanced Materials Research; Trans Tech Publications Ltd.: Zürich, Switzerland, 2013; Volume 855, pp. 149–153. [Google Scholar]
- Salonvaara, M. Environmental Weather Loads for Hygrothermal Analysis and Design of Buildings; ASHRAE Research Report RP-1325; ASHRAE: Washington, DC, USA, 2011. [Google Scholar]
- Mukhopadhyaya, P.; Kumaran, K.; Tariku, F.; Van Reenen, D. Application of hygrothermal modeling tool to assess moisture response of exterior walls. J. Archit. Eng. 2006, 12, 178–186. [Google Scholar] [CrossRef]
- Kocí, J.; Madera, J.; Cerný, R. Generation of a critical weather year for hygrothermal simulations using partial weather data sets. Build. Environ. 2014, 76, 54–61. [Google Scholar] [CrossRef]
- Schöner, T.; Zirkelbach, D. Development of hygrothermal reference years for Germany. In Proceedings of the Central European Symposium on Building Physics, Dresden, Germany, 14–16 September 2016; pp. 133–140. [Google Scholar]
- Fraunhofer Institute for Building Physics, Department Hygrothermics. Energieoptimiertes Bauen Klima-und Oberflächenübergangsbedingungen für die Hygrothermische Bauteilsimulation; IBP-Bericht HTB-021/2016; Fraunhofer Institute for Building Physics: Stuttgart, Germany, 2016. [Google Scholar]
- WTA 6-2; Simulation Wärme-und Feuchtetechnischer Prozesse. Wissenschaftlich-Technische Arbeitsgemeinschaft für Bauwerkserhaltung und Denkmalpflege: Juelich, Germany, 2014.
- ISO 15927-1; Hygrothermal Performance of Buildings–Calculation and Presentation of Climatic Data–Part 1: Monthly Means of Single Meteorological Elements. International Standards Organization: London, UK, 2003.
- ASTM E3054; Standard Guide for Characterization and Use of Hygrothermal Models for Moisture Control Design in Building Envelopes. American Society for Testing and Materials: West Conshohocken, PA, USA, 2016.


| Construction-Independent Method | Evaluated Index | Required Climatic Parameter | Evaluated Period | |
|---|---|---|---|---|
| Mean temperature method [36,37,38] | Mean temperature | Air temperature | Annual | |
| Drying potential method | Π-factor method [39] | Π-factor | Air temperature, relative humidity, solar radiation, sky/ground counter radiation, and wind speed/direction | Annual |
| Saturation deficit method [40] | Saturation deficit | Air temperature and relative humidity | Winter (December–February) | |
| Moisture load method | ANK/ORNL method [41] | Moisture load potential | Air temperature, relative humidity, air pressure, rainfall, and wind speed/direction | Annual |
| Combined index method | Moisture Index method [42] | Moisture Index | Air temperature, relative humidity, rainfall, and wind speed/direction | Annual |
| Climate Index method [44] | Climate Index | Air temperature, relative humidity, solar radiation, sky/ground counter radiation, wind speed/direction, rainfall | Annual | |
| Construction |
|
| Orientation |
|
| Outdoor climate | Air temperature, relative humidity, and global radiation |
| Indoor climate |
|
| Initial condition | Equilibrium moisture content at 80% rh |
| Duration | Five-year period starting on 1 October and ending on 30 September |
| Year | 1989 | 1990 | 1991 | 1992 | 1994 |
|---|---|---|---|---|---|
| Construction 1 | 2 | 1 | 4 | 3 | 5 |
| Construction 2 | 4 | 5 | 6 | 7 | 1 |
| Construction 3 | 6 | 5 | 2 | 4 | 1 |
| Construction 4 | 3 | 1 | 4 | 2 | 7 |
| Construction 5 | 4 | 1 | 3 | 2 | 5 |
| Construction 6 | 4 | 1 | 3 | 2 | 5 |
| Ave. ranking | 3.8 | 2.3 | 3.7 | 3.3 | 4 |
| Method | Advantage | Disadvantage | |
|---|---|---|---|
| Construction-independent method | Mean temperature |
|
|
| Drying potential |
|
| |
| Moisture load |
|
| |
| Combined index |
|
| |
| Construction-dependent method | Moisture content |
|
|
| Damage function |
|
| |
| Hybrid method |
|
| |
| Standard | Severe Climate | Mean Climate |
|---|---|---|
| ISO 13788 [30] |
| Mean value according to ISO 15927-1 [53] |
| EN 15026 [31] | TRY according to ISO 15927-4 [10] | |
| WTA 6-2 [52] | ||
| DIN 4108-3 [20] | TRY determined by main climatic parameters, including rainfall data according to ISO 15927-4 [51] | |
| ASHRAE Standard 160 (2016) [32] |
| N/A |
| ASHRAE Standard 160 (2021) [19] | 93rd-percentile year in Severity Index | N/A |
| BS 5250 [33] |
| Mean value according to ISO 15927-1 [53] |
| ASTM E3054 [54] | N/A | N/A |
| Return Period | Temperature [K] | Relative Humidity [%rh] |
|---|---|---|
| 1 in 5 | −1 | +2 |
| 1 in 10 | −1 | +4 |
| 1 in 20 | −2 | +4 |
| 1 in 50 | −4 | +6 |
Disclaimer/Publisher’s Note: The statements, opinions and data contained in all publications are solely those of the individual author(s) and contributor(s) and not of MDPI and/or the editor(s). MDPI and/or the editor(s) disclaim responsibility for any injury to people or property resulting from any ideas, methods, instructions or products referred to in the content. |
© 2023 by the authors. Licensee MDPI, Basel, Switzerland. This article is an open access article distributed under the terms and conditions of the Creative Commons Attribution (CC BY) license (https://creativecommons.org/licenses/by/4.0/).
Share and Cite
Kim, S.; Zirkelbach, D.; Künzel, H.M. Review of Methods to Create Meteorological Data Suitable for Moisture Control Design by Hygrothermal Building Envelope Simulation. Energies 2023, 16, 3271. https://doi.org/10.3390/en16073271
Kim S, Zirkelbach D, Künzel HM. Review of Methods to Create Meteorological Data Suitable for Moisture Control Design by Hygrothermal Building Envelope Simulation. Energies. 2023; 16(7):3271. https://doi.org/10.3390/en16073271
Chicago/Turabian StyleKim, Sughwan, Daniel Zirkelbach, and Hartwig M. Künzel. 2023. "Review of Methods to Create Meteorological Data Suitable for Moisture Control Design by Hygrothermal Building Envelope Simulation" Energies 16, no. 7: 3271. https://doi.org/10.3390/en16073271
APA StyleKim, S., Zirkelbach, D., & Künzel, H. M. (2023). Review of Methods to Create Meteorological Data Suitable for Moisture Control Design by Hygrothermal Building Envelope Simulation. Energies, 16(7), 3271. https://doi.org/10.3390/en16073271