
Exploitation of Mediterranean Cooperation Projects’ Tools for the Development of Public Buildings’ Energy Efficiency Plans at Local Level: A Case Study in Greece
 , and
, and
Abstract
:1. Introduction
2. Materials and Methods
2.1. Assessment of Planning Tools for Public Buildings’ Energy Efficiency
- P1: collection and organization of building-stock data;
- P2: impact assessment of the base-case situation and retrofit scenarios;
- P3: identification of suitable renovation solutions;
- P4: techno-economic parametric assessment of renovation scenarios;
- P5: prioritization of buildings and of renovation projects;
- P6: production of a gradual energy renovation plan.
- Most tools are not suitable for impact assessment for the various building states (i.e., base-case and retrofit scenarios), i.e., they presume externally available state KPIs obtained, for example, from available studies or EPCs, building energy simulations or measurements. Only the PrioritEE tool incorporates some averaged energy consumption values derived from national EPCs, standards and reports, at least from the partner countries, to confront the challenge of absent base-case state KPIs.
- All tools are freely available for instant use in a web environment or instant download, except for the PrioritEE tool and the EDUFOOTPRINT calculator, which require some administrative processing to obtain access.
- The majority of the acknowledged planning pillars, specifically focused on public buildings’ energy renovation, is addressed by the PrioritEE and the IMPULSE tools; however, only the latter reaches the final planning step, notably the automatic production of a gradual public-building-stock energy renovation plan.
- It is based on the typology-based approach, which is widely accepted by the scientific community for energy efficiency planning purposes, as advocated in the introduction section.
- It presents high replicability as it has already been widely used across the Mediterranean for the production of energy-mix plans at the local level. Indicatively, it has been tested in more than five EU Mediterranean regions and municipalities in the framework of the IMPULSE and IMPULSE-PLUS projects’ implementation. It has been also used in planning activities in the framework of the SEACAP 4 SDG project, and it has been included in a training package in the framework of the meetMED project [36], both conducted for authorities located in the south Mediterranean region.
- In view of the case studied herein, it is recommended by MINENV the conducting of municipal building energy efficiency plans in the framework of L.4843/2021 (the IMPULSE tools are embedded in the ministry’s webpage dedicated for local and regional plans for public building energy efficiency [27]).
2.2. The Selected Set of Tools
2.2.1. The “Listing Public Buildings of Communities: Classification into Typologies and Corresponding Representative Buildings” Tool
2.2.2. The “KPIs’ Processing” Tool
2.2.3. The “KPIs-Processor’s PLUG-IN”
2.3. Suggested Stepwise Planning Methodology
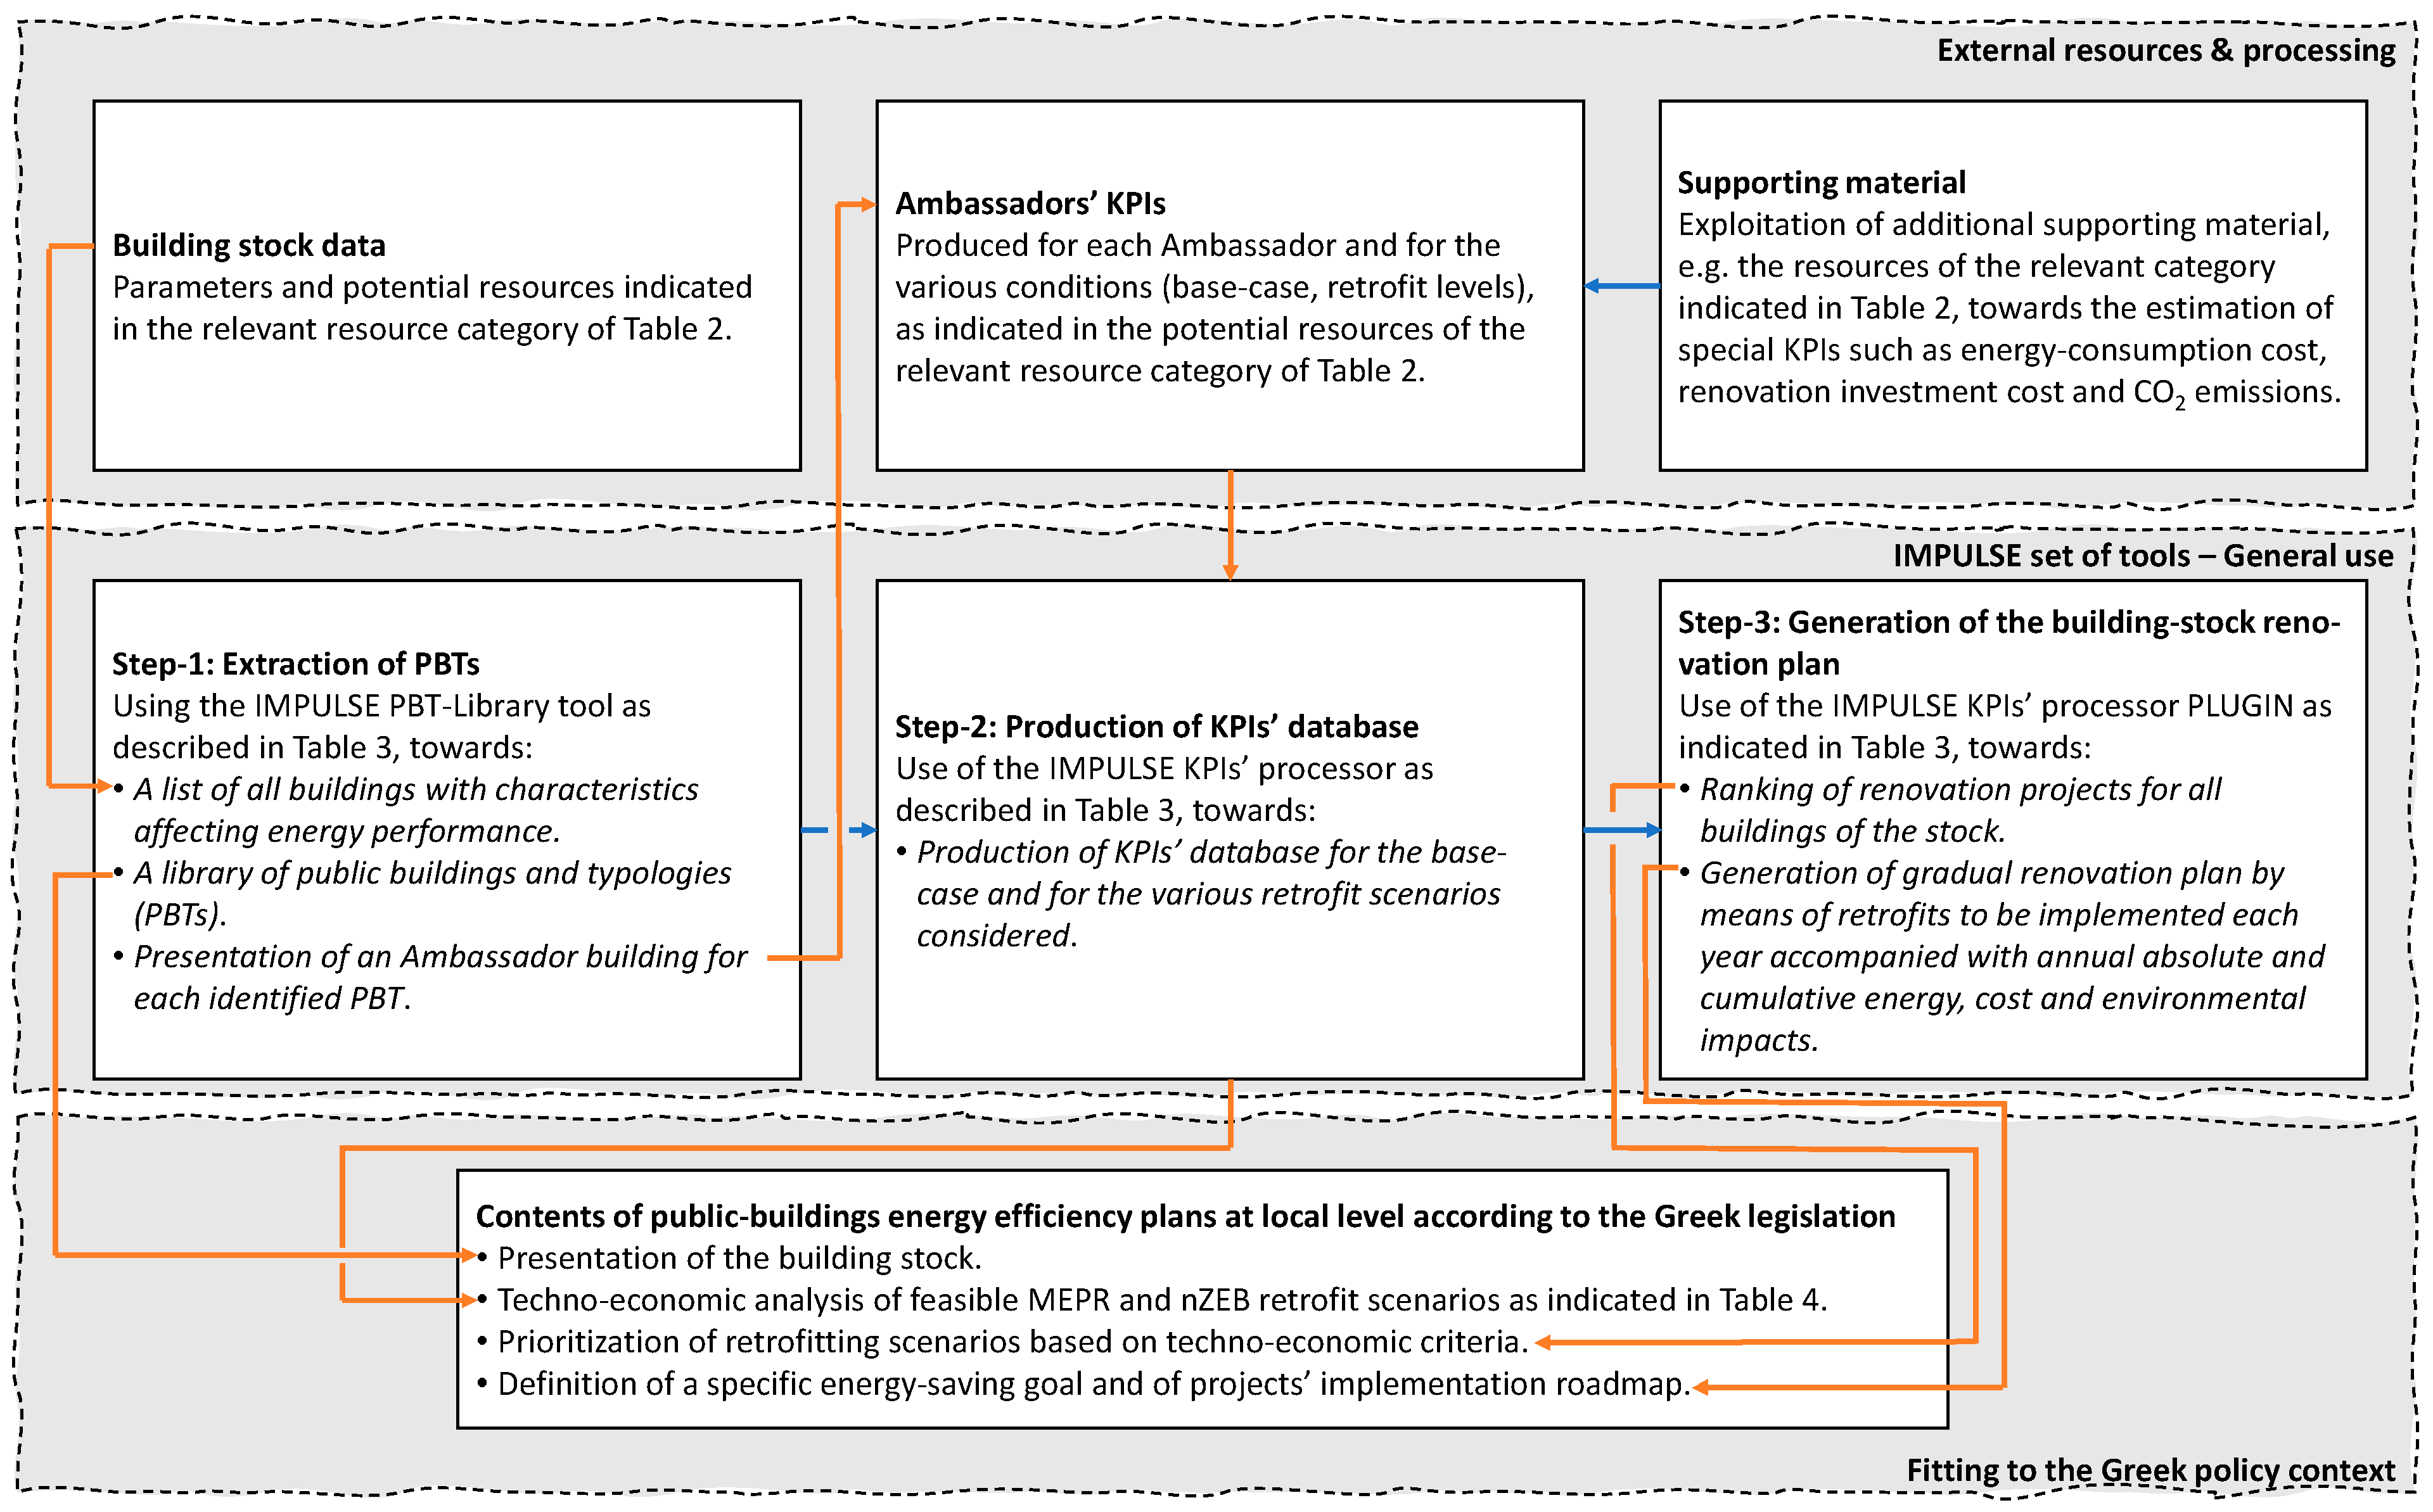
- External resources and processing: it stands for an external source of data and information required as input conditions to the IMPULSE set of tools, referring to the resource categories below:
- ○
- Building stock data: for each building included in the examined building stock, data regarding key characteristics that influence energy performance are collected by available studies, building permit documentation or inspections.
- ○
- Ambassadors’ KPIs: provided that the building stock has been classified into representative typologies following the procedure of the IMPULSE “PBT-Library” tool, the state KPIs of each ambassador building (one representative building of each typology) for the base case and for the various retrofit levels are extracted from external resources and used as inputs in the KPIs’ processing tool.
- ○
- Supporting material: it refers to additional external resources that may be needed for the generation of additional KPIs, for instance the primary energy and CO2 emission conversion factors, energy technologies unit costs, etc.
- IMPULSE set of tools—general use: the steps presented in this layer indicate the sequence of using the tools in generalized terms, meaning that the tools can be applied for any country/region. The following methodological steps are suggested:
- ○
- Step-1: extraction of PBTs: after feeding the PBT-Library tool with the “Building stock data”, and provided that appropriate classification ranges of input parameters are adopted, the tool provides guidance toward the development of a library of public-building typologies accompanied with details for one representative building (ambassador) of each typology.
- ○
- Step-2: production of the KPIs’ database: it is produced using the KPIs’ processing tool, as a result of inserting the ambassadors’ KPIs provided by the previous methodological layer. KPI databases are produced for the base case and the retrofit scenarios considered.
- ○
- Step-3: generation of the building-stock renovation plan: being fed by the KPI database in step-2, the KPIs’ processor PLUGIN, after setting up the decision-making scheme, provides a gradual renovation plan accompanied with suggested projects and energy, environmental and cost performance indicators on an annual basis.
- Fitting to the Greek policy context: this layer refers to the specialization of the planning methodology in the Greek policy context. According to the ongoing legislation, public buildings’ energy efficiency plans at regional or municipal level should be built upon concrete contents released by MINENV, particularly the following:
- ○
- Presentation of the building stock: this section may be easily completed by the synthesis of information between the available building-stock data and the tabulation and classification procedures in step-1 of the second layer above.
- ○
- Techno-economic analysis of feasible retrofit scenarios, namely: (a) the minimum energy performance requirements scenario (MEPR); (b) the nZEB scenario. The recommended scenarios correspond to the major and deep retrofit levels foreseen by IMPULSE; hence, the required techno-economic analysis can be easily based on the KPI database produced by the KPIs’ processor.
- ○
- Prioritization of retrofitting scenarios based on techno-economic criteria.
- ○
- Definition of a specific energy-saving goal and of projects’ implementation road map.
2.4. The Case Study Considered
- First professional high school of Aigio;
- Municipal office of Akrata;
- Municipal office of Sympoliteia;
- Municipal office of Aigeira;
- Municipal office of Diakopto;
- First elementary school of Aigio;
- Second elementary school of Aigio;
- First junior high school of Aigio;
- High school of Akrata;
- First senior high school of Aigio.
- As decision criteria, the following KPIs and desired states are adopted:
- ○
- Total annual primary energy savings (the highest possible);
- ○
- Total annual avoided CO2 emissions (the highest possible);
- ○
- Investment cost (the least possible (per project));
- Desired duration of the plan (until deep retrofit of all buildings): 6 years;
- Number of buildings retrofitted per year: at least two.
- Balanced road map with similar number of projects implemented each year.
3. Results
3.1. Classification of the Building Stock
- Building use. Taking into account the recorded uses, as well as the fact that, according to the Greek EPBD, the A (elementary) and B (high school) education levels have the same operation schedules, load sources and minimum operation requirements, the following building uses are identified:
- ○
- A or B education level;
- ○
- Office.
- Number of floors. This relates mainly to the effect of roof interventions on the overall building energy performance. As per other research [37,38], low-rise buildings are considered those with fewer than three floors. In this regard, the following classification ranges are adopted:
- ○
- Up to three floors (low-rise);
- ○
- Four to six floors;
- ○
- Above six floors.
- Construction type. Apart from the thermal transmittance, a building envelope’s structure materials determine the building’s thermal inertia. Following the Greek EPBD classification, the following options are adopted:
- ○
- Light/medium structure (e.g., metallic);
- ○
- Heavy structure (concrete, brick wall);
- ○
- Very heavy structure (e.g., masonry).
- Heating system. This is an essential parameter since it defines the efficiency of ensuring thermal comfort conditions in winter, as well as the energy source consumed to cover the related energy demand. The following options are adopted:
- ○
- Oil boiler-burner (central system);
- ○
- Central heat pump;
- ○
- None exist.
- Cooling system. It is related to the energy source consumed to compensate for the cooling loads in the summer period. The following options are adopted:
- ○
- Local heat pump (regular A/C split units);
- ○
- Central heat pump;
- ○
- None exist or are limited.
- PBT1 ambassador: second elementary school of Aigio;
- PBT2 ambassador: municipal office of Sympoliteia;
- PBT3 ambassador: municipal office of Diakopto;
- PBT4 ambassador: junior high school of Akrata.
3.2. Ambassador-Buildings’ (External) Energy Analysis
- Energy consumption per carrier, obtained by the simulation software;
- Annual total CO2 emissions, obtained by the simulation software;
- Investment cost, obtained using typical interventions’ unit costs found in ref. [27] for the Greek context;
- Annual energy cost, obtained on the basis of the ongoing energy supply unit cost (EUR/kWh) in Greece [39];
- Simple payback period, calculated as the period (in years) after which the annual cumulative cash flow becomes positive;
- Annual cumulative cash flow, calculated as the sum of the previous year cumulative cash flow and the ongoing year net cash flow being the energy-cost savings achieved because of the annual energy saving (assumed constant).
3.3. Production of Building Stock KPIs’ Database
3.4. Production of the Building Stock Energy Efficiency Road Map
- DC1: total annual primary energy savings;
- DC2: annual avoidance of CO2 emissions;
- DC3: investment cost.
- Decision criteria and respective weights:
- ○
- Total annual primary energy savings/weight: 30%;
- ○
- Total annual avoided CO2 emissions/weight: 10%;
- ○
- Estimated investment cost/weight: 60%;
- No bias is imposed on a specific typology, retrofit level or RES integration;
- Desired floor area renovated annually: 5% of the whole building stock floor area;
- KPIs’ database objective participated in the MCA processing: all retrofit levels for all four PBTs, except the minor retrofit level because it is not at all included in the retrofit scenarios studied.
4. Discussion
- For all ambassador buildings, thermal-protection envelope interventions envisaged in the medium retrofit scenario present the highest payback period. Especially for the two school buildings, and despite the relatively high primary-energy saving (around 20%), the investment is prohibitive because of extremely long payback periods (over 50 years).
- Investment attractiveness is improved by moving toward the major and deep retrofit levels. For the latter, which includes RES integration, primary-energy saving reaches around 93% with analogous CO2 emissions avoidance and energy cost reduction. In terms of payback period, it is estimated at around 10 years, ranging between 20 and 30 years for the office and school buildings, respectively. Less attractiveness occurs for the school buildings because of the periods of no operation for about 4 months of holidays per year.
- Improve buildings’ clustering through including additional important classification criteria and ranges toward increasing the fidelity of planning predictions;
- Focus more on the validation of the methodology through using more advanced energy simulation tools, as suggested, for example, in ref. [10], and comparisons with actual data (e.g., energy measurements).
5. Conclusions
- Generally, the presented methodology is considered practical and fits well within the requirements for building an energy renovation plan in relation to EU and national policies and regulations.
- The methodology is flexible, specifically in terms of the development of the renovation road map, since due to the PLUG-IN tool, alternative road maps may be produced very fast just by altering the multi-criteria assessment scheme inputs.
- Provided that at least the most important energy-influencing technical parameters are adopted for buildings’ clustering purposes, the suggested approach significantly accelerates the production of the renovation plan since detailed energy analyses are required only for the typologies’ representative buildings (ambassadors) rather than for all buildings of the building stock.
- The main limitations of the methodology are related to the procedures for concluding the building typologies and ambassadors, as well as for retrieving the latter’s KPIs for the base case and the various retrofit scenarios. Therefore, verification activities are strongly recommended, e.g., through comparisons of simulated data with available measurements or at least with the energy performance of similar buildings.
- For the case studied, the methodology provided a feasible 6-year renovation plan outlining the specific buildings and projects to be implemented each year. Informative indicators associate the road map—i.e., absolute and cumulative energy savings, energy-cost savings, emissions avoidance and investment cost—which facilitates the determination of a specific energy efficiency goal to be achieved in the following years in accordance to other possible plans or commitments, e.g., the Sustainable Energy and Climate Action Plan (SECAP).
- Based on the splitting of the required investment produced by the plan, the interested authority can easily and effectively attract the attention of specific funding programs and adjust the preparations of technical energy-upgrading proposals for submission.
Author Contributions
Funding
Data Availability Statement
Acknowledgments
Conflicts of Interest
Appendix A
- Tool-1/PBT-Library: worksheets and procedure of use:
- First, in the last worksheet “Dropdown menus” values and ranges of each classification criteria (building use, period of construction, number of floors, heating/cooling systems, etc.) are inserted depending on the building stock recorded and key national (or local) regulations related to energy efficiency (for example, the building use defines the operational schedule of the building, thus the energy consumption; hence, the different building types recorded in the stock should be enlisted in the related input in the tool).
- In the worksheet “List of PB & CC_Absolute values”, for each building, the absolute value of each classification criterion is inserted toward formulating the catalogue of the buildings accompanied with their technical characteristics.
- The worksheet “List of Public Buildings & PBTs” is used to redefine the building stock in terms of replacing the absolute value of each classification criterion by the corresponding range from a drop-down list of the available options created in the worksheet “Dropdown menus”. Finally, buildings with the same classification ranges of each criterion are allocated to the same PBT, hence formulating the final list of public buildings classified into typologies.
- Finally, 15 worksheets named “Details for Ambassador of PBT” are available to insert technical details for up to 15 representative buildings of the identified typologies. Each representative building stands for an ambassador of the respective typology, reflecting the energy performance of all buildings of the typology. It is strongly recommended to choose ambassadors with the maximum available technical information (structure, systems properties, etc.) and/or available energy studies or EPCs if they exist.
- Tool-2/KPIs’ processor: worksheets and procedure of use:
- According to the tool instructions, it is recommended to start with the worksheet “Projection_base-case”. The name, floor area and the corresponding no. of PBT are inserted for each building of the considered stock.
- For the various states of each PBT’s ambassador building, i.e., base case, minor retrofit, medium retrofit, major retrofit and deep retrofit, the energy, environmental (emissions) and cost indicators are inserted in each corresponding worksheet. This means that the state KPIs, e.g., energy consumption per end-use and per carrier, CO2 emissions and energy consumption cost, should be available for the various building conditions (base case and various levels of retrofit), e.g., obtained by energy simulations or received from available studies or EPCs.
- Finally, based on the assumption that buildings of the same typology share the same normalized values per sq.m. of floor area of the KPIs, in the “Projection” worksheets, the state and impact KPIs are extrapolated from each ambassador to each building of the same typology. Hence, the tool produces a KPI database for all buildings and for all retrofit scenarios considered.
- An intermediate worksheet “Prioritization” is also available that automatically provides a hierarchy of retrofit scenarios for each PBT based on the combined indicator, “Total investment cost per total annual energy saved”.
- Tool-3/KPIs-processor’s PLUGIN: worksheets and procedure of use:
- Inputs are provided in the worksheet “MCA-INPUT” as follows: (a) initially, up to five KPIs are selected as decision-making criteria from the list of KPIs originating in the KPIs’ processor—in parallel, a weight factor for each criterion is inserted; (b) optionally, the user can bias the decision to a certain PBT, retrofit level or RES integration; (c) the desired renovation rate in terms of annual % of floor area retrofitted is imposed; (d) the options of buildings and levels of retrofit to be ranked are defined in a matrix enlisting all PBTs and a binary 1 (YES)–0 (NO) input definition for each level of retrofit, declaring whether the scenario is considered in the ranking or not, respectively.
- The tool automatically provides the suggested retrofitting road map in the worksheet “PLAN”.
- It should be highlighted that the tool is functional if and only if it exists in the same electronic folder with the previous completed “KPIs’ processor” and that both Excel files are open while processing.
Appendix B

| Weights Combination 1 (Comb1) | Total Annual Primary Energy Savings (DC1) | Total Annual Avoided CO2 Emissions (DC2) | Investment Cost (DC3) | |||||
|---|---|---|---|---|---|---|---|---|
| 30% | 10% | 60% | ||||||
| Years of implementation | 1 | 2 | 3 | 4 | 5 | 6 | ||
| Annual absolute | Floor area retrofitted m² | 6942.00 | 4580.00 | 980.00 | 2070.00 | 1870.00 | 1115.00 | |
| Annual investment EUR | 1,162,994.08 | 739,936.46 | 289,431.86 | 331,751.40 | 302,272.70 | 236,289.18 | ||
| Cost savings EUR/yr | 59,757.49 | 39,869.42 | 29,236.35 | 18,350.67 | 15,142.61 | 9274.82 | ||
| Avoided CO2 tns/yr | 141.48 | 95.66 | 71.83 | 45.33 | 36.04 | 22.05 | ||
| Energy savings kWh/yr | 640,781.73 | 435,284.01 | 329,561.31 | 208,339.27 | 163,550.20 | 100,037.80 | ||
| Annual accumulated | Floor area retrofitted m² | 6942.00 | 11,522.00 | 12,502.00 | 14,572.00 | 16,442.00 | 17,557.00 | |
| Investment EUR | 1,162,994.08 | 1,902,930.55 | 2,192,362.41 | 2,524,113.81 | 2,826,386.51 | 3,062,675.69 | ||
| Cost savings EUR/yr | 59,757.49 | 99,626.92 | 128,863.26 | 147,213.93 | 162,356.54 | 171,631.35 | ||
| Avoided CO2 tns/yr | 141.48 | 237.13 | 308.96 | 354.29 | 390.33 | 412.39 | ||
| Energy savings kWh/yr | 640,781.73 | 1,076,065.74 | 1,405,627.05 | 1,613,966.32 | 1,777,516.52 | 1,877,554.32 | ||
| PROJECTS PER YEAR | PBT2–Municipal office of Aigeira–Medium Retrofit PBT2–Municipal office of Aigeira–Major Retrofit PBT2–Municipal office of Akrata–Medium Retrofit PBT1–1st professional high school of Aigio–Deep retrofit | PBT2–Municipal office of Aigeira–Deep retrofit PBT2–Municipal office of Akrata–Major Retrofit PBT1–1st senior high school of Aigio–Deep retrofit | PBT2–Municipal office of Akrata–Deep retrofit PBT2–Municipal office of Sympoliteia–Deep retrofit PBT3–Municipal office of Diakopto–Major Retrofit | PBT3–Municipal office of Diakopto–Deep retrofit PBT1–1st junior high school of Aigio–Deep retrofit | PBT1–1st Elem. school of Aigio–Major Retrofit PBT1–1st Elementary school of Aigio–Deep retrofit PBT1–2nd Elementary school of Aigio–Deep retrofit | PBT4–Junior high school of Akrata–Deep retrofit | ||
| % primary energy saving (cumulative) | 32.37% | 54.36% | 71.01% | 81.54% | 89.80% | 94.86% | ||
| Weights Combination 2 (Comb2) | Total Annual Primary Energy Savings (DC1) | Total Annual Avoided CO2 Emissions (DC2) | Investment Cost (DC3) | |||||
| 10% | 30% | 60% | ||||||
| Years of implementation | 1 | 2 | 3 | 4 | 5 | 6 | ||
| Annual absolute | Floor area retrofitted m² | 6942.00 | 4580.00 | 980.00 | 2070.00 | 1870.00 | 1115.00 | |
| Annual investment EUR | 1,162,994.08 | 739,936.46 | 289,431.86 | 331,751.40 | 302,272.70 | 236,289.18 | ||
| Cost savings EUR/yr | 59,757.49 | 39,869.42 | 29,236.35 | 183,50.67 | 15,142.61 | 9274.82 | ||
| Avoided CO2 tns/yr | 141.48 | 95.66 | 71.83 | 45.33 | 36.04 | 22.05 | ||
| Energy savings kWh/yr | 640,781.73 | 435,284.01 | 329,561.31 | 208,339.27 | 163,550.20 | 100,037.80 | ||
| Annual accumulated | Floor area retrofitted m² | 6942.00 | 11,522.00 | 12,502.00 | 14,572.00 | 16,442.00 | 17,557.00 | |
| Investment EUR | 1,162,994.08 | 1,902,930.55 | 2,192,362.41 | 2,524,113.81 | 2,826,386.51 | 3,062,675.69 | ||
| Cost savings EUR/yr | 59,757.49 | 99,626.92 | 128,863.26 | 147,213.93 | 162,356.54 | 171,631.35 | ||
| Avoided CO2 tns/yr | 141.48 | 237.13 | 308.96 | 354.29 | 390.33 | 412.39 | ||
| Energy savings kWh/yr | 640,781.73 | 1,076,065.74 | 1,405,627.05 | 1,613,966.32 | 1,777,516.52 | 1,877,554.32 | ||
| PROJECTS PER YEAR | PBT2–Municipal office of Aigeira–Medium Retrofit PBT2–Municipal office of Aigeira–Major Retrofit PBT2–Municipal office of Akrata–Medium Retrofit PBT1–1st professional high school of Aigio–Deep retrofit | PBT2–Municipal office of Aigeira–Deep retrofit PBT2–Municipal office of Akrata–Major Retrofit PBT1–1st senior high school of Aigio–Deep retrofit | PBT2–Municipal office of Akrata–Deep retrofit PBT2–Municipal office of Sympoliteia–Deep retrofit PBT3–Municipal office of Diakopto–Major Retrofit | PBT3–Municipal office of Diakopto–Deep retrofit PBT1–1st junior high school of Aigio–Deep retrofit | PBT1–1st Elementary school of Aigio–Major Retrofit PBT1–1st Elementary school of Aigio–Deep retrofit PBT1–2nd Elementary school of Aigio–Deep retrofit | PBT4–Junior high school of Akrata–Deep retrofit | ||
| % primary energy saving (cumulative) | 32.37% | 54.36% | 71.01% | 81.54% | 89.80% | 94.86% | ||
| Weights Combination 3 (Comb3) | Total Annual Primary Energy Savings (DC1) | Total Annual Avoided CO2 Emissions (DC2) | Investment Cost (DC3) | |||||
| 60% | 10% | 30% | ||||||
| Years of implementation | 1 | 2 | 3 | 4 | 5 | 6 | 7 | |
| Annual absolute | Floor area retrofitted m² | 6832.00 | 4450.00 | 900.00 | 1850.00 | 1640.00 | 1115.00 | 770.00 |
| Annual investment EUR | 1,104,346.05 | 719,312.05 | 264,912.81 | 299,039.84 | 314,310.53 | 236,289.18 | 124,465.23 | |
| Cost savings EUR/yr | 55,323.15 | 36,034.55 | 27,601.25 | 14,980.65 | 22,181.75 | 9274.82 | 6235.19 | |
| Avoided CO2 tns/yr | 131.68 | 85.77 | 67.32 | 35.66 | 55.08 | 22.05 | 14.84 | |
| Energy savings kWh/yr | 597,526.72 | 389,197.00 | 308,066.02 | 161,801.00 | 253,581.58 | 100,037.80 | 67,344.20 | |
| Annual accumulated | Floor area retrofitted m² | 6832.00 | 11,282.00 | 12,182.00 | 14,032.00 | 15,672.00 | 16,787.00 | 17,557.00 |
| Investment EUR | 1,104,346.05 | 1,823,658.09 | 2,088,570.91 | 2,387,610.75 | 2,701,921.28 | 2,938,210.46 | 3,062,675.69 | |
| Cost savings EUR/yr | 55,323.15 | 91,357.70 | 118,958.95 | 133,939.60 | 156,121.35 | 165,396.16 | 171,631.35 | |
| Avoided CO2 tns/yr | 131.68 | 217.45 | 284.76 | 320.42 | 375.49 | 39.55 | 412.39 | |
| Energy savings kWh/yr | 597,526.72 | 986,723.72 | 1,294,789.74 | 1,456,590.74 | 1,710,172.32 | 1,810,210.12 | 1,877,554.32 | |
| PROJECTS PER YEAR | PBT1–1st professional high school of Aigio–Deep retrofit | PBT1–1st senior high school of Aigio–Deep retrofit | PBT2–Municipal office of Aigeira–Medium Retrofit PBT2–Municipal office of Sympoliteia–Deep retrofit PBT2–Municipal office of Aigeira–Major Retrofit PBT2–Municipal office of Akrata–Medium Retrofit PBT2–Municipal office of Aigeira–Deep retrofit PBT2–Municipal office of Akrata–Major Retrofit | PBT1–1st junior high school of Aigio–Deep retrofit | PBT3–Municipal office of Diakopto–Deep retrofit PBT2–Municipal office of Akrata–Deep retrofit PBT1–2nd Elementary school of Aigio–Deep retrofit | PBT4–Junior high school of Akrata–Deep retrofit | PBT1–1st Elementary school of Aigio–Deep retrofit | |
| % primary energy saving (cumulative) | 30.19% | 49.85% | 65.41% | 73.59% | 86.40% | 91.45% | 94.86% | |
| Weights Combination 4 (Comb4) | Total Annual Primary Energy Savings (DC1) | Total Annual Avoided CO2 Emissions (DC2) | Investment Cost (DC3) | |||||
| 10% | 60% | 30% | ||||||
| Years of implementation | 1 | 2 | 3 | 4 | 5 | 6 | 7 | |
| Annual absolute | Floor area retrofitted m² | 6832.00 | 4450.00 | 900.00 | 1850.00 | 1640.00 | 1115.00 | 770.00 |
| Annual investment EUR | 1,104,346.05 | 719,312.05 | 264,912.81 | 299,039.84 | 314,310.53 | 236,289.18 | 124,465.23 | |
| Cost savings EUR/yr | 55,323.15 | 36,034.55 | 27,601.25 | 14,980.65 | 22,181.75 | 9274.82 | 6235.19 | |
| Avoided CO2 tns/yr | 131.68 | 85.77 | 67.32 | 35.66 | 55.08 | 22.05 | 14.84 | |
| Energy savings kWh/yr | 597,526.72 | 389,197.00 | 308,066.02 | 161,801.00 | 253,581.58 | 100,037.80 | 67,344.20 | |
| Annual accumulated | Floor area retrofitted m² | 6832.00 | 11,282.00 | 12,182.00 | 14,032.00 | 15,672.00 | 16,787.00 | 17,557.00 |
| Investment EUR | 1,104,346.05 | 1,823,658.09 | 2,088,570.91 | 2,387,610.75 | 2,701,921.28 | 2,938,210.46 | 3,062,675.69 | |
| Cost savings EUR/yr | 553,23.15 | 91,357.70 | 118,958.95 | 133,939.60 | 156,121.35 | 165,396.16 | 171,631.35 | |
| Avoided CO2 tns/yr | 131.68 | 217.45 | 284.76 | 320.42 | 375.49 | 39.55 | 412.39 | |
| Energy savings kWh/yr | 597,526.72 | 986,723.72 | 1,294,789.74 | 1,456,590.74 | 1,710,172.32 | 1,810,210.12 | 1,877,554.32 | |
| PROJECTS PER YEAR | PBT1–1st professional high school of Aigio–Deep retrofit | PBT1–1st senior high school of Aigio–Deep retrofit | PBT2–Municipal office of Aigeira–Medium Retrofit PBT2–Municipal office of Sympoliteia–Deep retrofit PBT2–Municipal office of Aigeira–Major Retrofit PBT2–Municipal office of Akrata–Medium Retrofit PBT2–Municipal office of Aigeira–Deep retrofit PBT2–Municipal office of Akrata–Major Retrofit | PBT1–1st junior high school of Aigio–Deep retrofit | PBT3–Municipal office of Diakopto–Deep retrofit PBT2–Municipal office of Akrata–Deep retrofit PBT1–2nd Elementary school of Aigio–Deep retrofit | PBT4–Junior high school of Akrata–Deep retrofit | PBT1–1st Elementary school of Aigio–Deep retrofit | |
| % primary energy saving (cumulative) | 30.19% | 49.85% | 65.41% | 73.59% | 86.40% | 91.45% | 94.86% | |
| Weights Combination 5 (Comb5) | Total Annual Primary Energy Savings (DC1) | Total Annual Avoided CO2 Emissions (DC2) | Investment Cost (DC3) | |||||
| 30% | 60% | 10% | ||||||
| Years of implementation | 1 | 2 | 3 | 4 | 5 | 6 | ||
| Annual absolute | Floor area retrofitted m² | 6832.00 | 4450.00 | 2510.00 | 1555.00 | 1100.00 | 1110.00 | |
| Annual investment EUR | 1,104,346.05 | 719,312.05 | 484,680.20 | 356,431.78 | 177,807.47 | 220,098.14 | ||
| Cost savings EUR/yr | 55,323.15 | 36,034.55 | 34,312.68 | 20,859.44 | 8907.42 | 16,194.11 | ||
| Avoided CO2 tns/yr | 131.68 | 85.77 | 83.29 | 51.08 | 21.20 | 39.38 | ||
| Energy savings kWh/yr | 597,526.72 | 389,197.00 | 380,525.00 | 234,079.40 | 96,206.00 | 180,020.20 | ||
| Annual accumulated | Floor area retrofitted m² | 6832.00 | 11,282.00 | 13,792.00 | 15,347.00 | 16,447.00 | 17,557.00 | |
| Investment EUR | 1,104,346.05 | 1,823,658.09 | 2,308,338.30 | 2,664,770.08 | 2,842,577.55 | 3,062,675.69 | ||
| Cost savings EUR/yr | 55,323.15 | 91,357.70 | 125,670.38 | 146,529.82 | 155,437.24 | 171,631.35 | ||
| Avoided CO2 tns/yr | 131.68 | 217.45 | 300.73 | 351.81 | 373.01 | 412.39 | ||
| Energy savings kWh/yr | 597,526.72 | 986,723.72 | 1,367,248.72 | 1,601,328.12 | 1,697,534.12 | 1,877,554.32 | ||
| PROJECTS PER YEAR | PBT1–1st professional high school of Aigio–Deep retrofit | PBT1–1st senior high school of Aigio–Deep retrofit | PBT2–Municipal office of Sympoliteia–Deep retrofit PBT1–1st junior high school of Aigio–Deep retrofit | PBT3–Municipal office of Diakopto–Deep retrofit PBT4–Junior high school of Akrata–Deep retrofit | PBT1–2nd Elementary school of Aigio–Deep retrofit | PBT2–Municipal office of Akrata–Deep retrofit PBT2–Municipal office of Aigeira–Deep retrofit PBT1–1st Elementary school of Aigio–Deep retrofit | ||
| % primary energy saving (cumulative) | 30.19% | 49.85% | 69.07% | 80.90% | 85.76% | 94.86% | ||
| Weights Combination 6 (Comb6) | Total Annual Primary Energy Savings (DC1) | Total Annual Avoided CO2 Emissions (DC2) | Investment Cost (DC3) | |||||
| 60% | 30% | 10% | ||||||
| Years of implementation | 1 | 2 | 3 | 4 | 5 | 6 | ||
| Annual absolute | Floor area retrofitted m² | 6832.00 | 4450.00 | 2510.00 | 1555.00 | 1100.00 | 1110.00 | |
| Annual investment EUR | 1,104,346.05 | 719,312.05 | 484,680.20 | 356,431.78 | 177,807.47 | 220,098.14 | ||
| Cost savings EUR/yr | 55,323.15 | 36,034.55 | 34,312.68 | 20,859.44 | 8907.42 | 16,194.11 | ||
| Avoided CO2 tns/yr | 131.68 | 85.77 | 83.29 | 51.08 | 21.20 | 39.38 | ||
| Energy savings kWh/yr | 597,526.72 | 389,197.00 | 380,525.00 | 234,079.40 | 96,206.00 | 180,020.20 | ||
| Annual accumulated | Floor area retrofitted m² | 6832.00 | 11,282.00 | 13,792.00 | 15,347.00 | 16,447.00 | 17,557.00 | |
| Investment EUR | 1,104,346.05 | 1,823,658.09 | 2,308,338.30 | 2,664770.08 | 2,842577.55 | 3,062,675.69 | ||
| Cost savings EUR/yr | 55,323.15 | 91,357.70 | 125,670.38 | 146,529.82 | 155,437.24 | 171,631.35 | ||
| Avoided CO2 tns/yr | 131.68 | 217.45 | 300.73 | 351.81 | 373.01 | 412.39 | ||
| Energy savings kWh/yr | 597,526.72 | 986,723.72 | 1,367,248.72 | 1,601,328.12 | 1,697,534.12 | 1,877,554.32 | ||
| PROJECTS PER YEAR | PBT1–1st professional high school of Aigio–Deep retrofit | PBT1–1st senior high school of Aigio–Deep retrofit | PBT2–Municipal office of Sympoliteia–Deep retrofit PBT1–1st junior high school of Aigio–Deep retrofit | PBT3–Municipal office of Diakopto–Deep retrofit PBT4–Junior high school of Akrata–Deep retrofit | PBT1–2nd Elementary school of Aigio–Deep retrofit | PBT2–Municipal office of Akrata–Deep retrofit PBT2–Municipal office of Aigeira–Deep retrofit PBT1–1st Elementary school of Aigio–Deep retrofit | ||
| % primary energy saving (cumulative) | 30.19% | 49.85% | 69.07% | 80.90% | 85.76% | 94.86% | ||
References
- European Commission–Department. Energy in Focus, Energy Efficiency in Buildings; European Commission: Brussels, Belgium, 2020; Available online: https://commission.europa.eu/news/focus-energy-efficiency-buildings-2020-02-17_en (accessed on 28 February 2023).
- Directive 2018/844/EU of the European Parliament and of the Council of 30 May 2018, amending Directive 2010/31/EU on the energy performance of buildings and Directive 2012/27/EU on energy efficiency L156/75. Off. J. Eur. Union 2018, 156, 75–91.
- European Commission, Secretariat-General. Communication from the Commission to the European Parliament, the European Council, the Council, the European Economic and Social Committee and the Committee of the Regions; The European Green Deal, COM(2019) 640 final; European Commission: Brussels, Belgium.
- Directive 2012/27/EU of the European Parliament and of the Council of 25 October 2012, on energy efficiency, amending Directives 2009/125/EC and 2010/30/EU and repealing Directives 2004/8/EC and 2006/32/EC, L315/1. Off. J. Eur. Union 2012, 315, 1–56.
- Directive 2018/2002/EU of the European Parliament and of the Council of 11 December 2018, amending Directive 2012/27/EU on energy efficiency, L328/210. Off. J. Eur. Union 2018, 328, 210–229.
- An Coimisiún Eorpach, Ard-Stiúrthóireacht an Fhuinnimh, Commission recommendation (EU) 2019/786 of 8 May 2019 on building renovation. Off. J. Eur. Union 2019, 127, 34–79.
- Economidou, M.; Todeschi, V.; Bertoldi, P. Accelerating Energy Renovation Investments in Buildings; EUR 29890 EN; Publications Office of the European Union: Luxembourg, 2019; ISBN 978-92-76-12195-4. [Google Scholar] [CrossRef]
- D’Oca, S.; Ferrante, A.; Ferrer, C.; Pernetti, R.; Gralka, A.; Sebastian, R.; Veld, P.O. Technical, Financial, and Social Barriers and Challenges in Deep Building Renovation: Integration of Lessons Learned from the H2020 Cluster Projects. Buildings 2018, 8, 174. [Google Scholar] [CrossRef] [Green Version]
- Salvia, M.; Simoes, S.G.; Herrando, M.; Čavar, M.; Cosmi, C.; Pietrapertosa, F.; Gouveia, J.P.; Fueyo, N.; Gómez, A.; Papadopoulou, K.; et al. Improving policy making and strategic planning competencies of public authorities in the energy management of municipal public buildings: The PrioritEE toolbox and its application in five mediterranean areas. Renew. Sustain. Energy Rev. 2021, 135, 110106. [Google Scholar] [CrossRef]
- Stavrakakis, G.M.; Katsaprakakis, D.A.; Damasiotis, M. Basic Principles, Most Common Computational Tools, and Capabilities for Building Energy and Urban Microclimate Simulations. Energies 2021, 14, 6707. [Google Scholar] [CrossRef]
- Napoli, G.; Bottero, M.; Ciulla, G.; Dell’Anna, F.; Figueira, J.R.; Greco, S. Supporting public decision process in buildings energy retrofitting operations: The application of a Multiple Criteria Decision Aiding model to a case study in Southern Italy. Sustain. Cities Soc. 2020, 60, 102214. [Google Scholar] [CrossRef]
- Droutsa, K.G.; Kontoyiannidis, S.; Dascalaki, E.G.; Balaras, C.A. Ranking cost effective energy conservation measures for heating in Hellenic residential buildings. Energy Build. 2014, 70, 318–332. [Google Scholar] [CrossRef]
- Dascalaki, E.; Droutsa, K.G.; Balaras, C.A.; Kontoyiannidis, S. Building typologies as a tool for assessing the energy performance of residential buildings—A case study for the Hellenic building stock. Energy Build. 2011, 43, 3400–3409. [Google Scholar] [CrossRef]
- Ahern, C.; Griffiths, P.; O’Flaherty, M. State of the Irish housing stock—Modelling the heat losses of Ireland’s existing detached rural housing stock & estimating the benefit of thermal retrofit measures on this stock. Energy Policy 2013, 55, 139–151. [Google Scholar]
- Mata, E.; Kalagasidis, S.A.; Johnsson, F. Energy usage and technical potential for energy saving measures in the Swedish residential building stock. Energy Policy 2013, 55, 404–414. [Google Scholar] [CrossRef] [Green Version]
- Corrado, V.; Ballarini, I. Refurbishment trends of the residential buildings stock: Analysis of a regional pilot case in Italy. Energy Build. 2016, 132, 91–106. [Google Scholar] [CrossRef]
- Ignjatović, D.; Bojana, Z.; Ignjatović, Ć.N.; Đukanović, L.; Radivojević, A.; Rajčić, A. Methodology for Residential Building Stock Refurbishment Planning—Development of Local Building Typologies. Sustainability 2021, 13, 4262. [Google Scholar] [CrossRef]
- TABULA Project. Available online: https://episcope.eu/iee-project/tabula/ (accessed on 1 March 2023).
- Herrando, M.; Gómez, A.; Fueyo, N. Supporting Local Authorities to Plan Energy Efficiency in Public Buildings: From Local Needs to Regional Planning. Energies 2022, 15, 907. [Google Scholar] [CrossRef]
- Liébana-Durán, M.E.; Serrano-Lanzarote, B.; Ortega-Madrigal, L. Identification of Cost-Optimal Measures for Energy Renovation of Thermal Envelopes in Different Types of Public School Buildings in the City of Valencia. Appl. Sci. 2021, 11, 5108. [Google Scholar] [CrossRef]
- PrioritEE PLUS Project. Available online: https://prioritee.interreg-med.eu/ (accessed on 1 March 2023).
- Pietrapertosa, F.; Tancredi, M.; Giordano, M.; Cosmi, C.; Salvia, M. How to Prioritize Energy Efficiency Intervention in Municipal Public Buildings to Decrease CO2 Emissions? A Case Study from Italy. Int. J. Environ. Res. Public Health 2020, 17, 4434. [Google Scholar] [CrossRef]
- IMPULSE/IMPULSE PLUS Project. Available online: https://impulse.interreg-med.eu/ (accessed on 1 March 2023).
- Stavrakakis, G.M.; Damasiotis, M. Practical Guide and Tools for Public-Buildings’ Energy Efficiency Plans; European Energy Innovation Prologue Media Ltd.: Hertfordshire, UK.
- IMPULSE Deliverables’ Database. Available online: https://impulse.interreg-med.eu/what-we-achieve/deliverable-database/ (accessed on 1 March 2023).
- SEACAP 4 SDG Identifies the Main Tools Proposed to Mediterranean Cities for Energy Efficiency Plans. Available online: https://www.enicbcmed.eu/seacap-4-sdg-identifies-main-tools-and-instruments-be-proposed-mediterranean-cities-updating-their (accessed on 1 March 2023).
- Energy Efficiency Plans for Regional and Municipal Buildings. Available online: https://ypen.gov.gr/energeia/energeiaki-exoikonomisi/ktiria/schedio-energeiakis-apodosis-ktirion-perifereion-kai-dimon/ (accessed on 1 March 2023).
- IMPULSE Methodology Booklet. Available online: https://efficient-buildings.interreg-med.eu/our-achievements/strategy-and-planning/impulse-methodology-booklet/ (accessed on 31 March 2023).
- EduFootprint Platform. Available online: http://edufootprint.provinciatreviso.it/index.php/en/ (accessed on 2 March 2023).
- SISMA SET Tool and Training Kits. Available online: https://sisma.interreg-med.eu/sisma-set-tool/documents/ (accessed on 2 March 2023).
- PrioritEE Decision Support Tool (DST). Available online: https://prioritee.interreg-med.eu/prioritee-toolbox/decision-support-tool/ (accessed on 2 March 2023).
- EPC Simulation Tool. Available online: https://stepping.interreg-med.eu/deliverable-library/detail/?tx_elibrary_pi1%5Blivrable%5D=7861&tx_elibrary_pi1%5Baction%5D=show&tx_elibrary_pi1%5Bcontroller%5D=Frontend%5CLivrable&cHash=837b9206531b2c96e36f47b5c3f0c497 (accessed on 2 March 2023).
- Balaras, C.A.; Droutsa, K.G.; Dascalaki, E.G.; Kontoyiannidis, S.; Moro, A.; Bazzan, E. Urban Sustainability Audits and Ratings of the Built Environment. Energies 2019, 12, 4243. [Google Scholar] [CrossRef] [Green Version]
- IMPULSE-Building Typologies and Performance Indicators Platforms. Available online: https://impulse.interreg-med.eu/what-we-achieve/deliverable-database/detail/?tx_elibrary_pi1%5Blivrable%5D=3123&tx_elibrary_pi1%5Baction%5D=show&tx_elibrary_pi1%5Bcontroller%5D=Frontend%5CLivrable&cHash=661c222449fa8c5ae7eea9b1d0696d9f (accessed on 3 March 2023).
- IMPULSE PLUG-IN KPIs’ Processor Tool. Available online: https://impulse.interreg-med.eu/what-we-achieve/deliverable-database/detail/?tx_elibrary_pi1%5Blivrable%5D=16103&tx_elibrary_pi1%5Baction%5D=show&tx_elibrary_pi1%5Bcontroller%5D=Frontend%5CLivrable&cHash=09091e4a5cc917f3e0c0b91fc66c4945 (accessed on 6 March 2023).
- Training Package: Sustainable Energy Design Toolkit for Public Auhorities in the Framework of the meetMED Project (Published in the EU Neighbours South Programme). Available online: https://south.euneighbours.eu/publication/meetmed-sustainable-energy-design-toolkit-public-authorities/ (accessed on 2 March 2023).
- Leskovar, Ž.V.; Premrov, M. A Review of Architectural and Structural Design Typologies of Multi-Storey Timber Buildings in Europe. Forests 2021, 12, 757. [Google Scholar] [CrossRef]
- He, S.; Wang, X.; Dong, J.; Wei, B.; Duan, H.; Jiao, J.; Xie, Y. Three-Dimensional Urban Expansion Analysis of Valley-Type Cities: A Case Study of Chengguan District, Lanzhou, China. Sustainability 2019, 11, 5663. [Google Scholar] [CrossRef] [Green Version]
- Efthymiou, E.N.; Yfanti, S.; Kyriakarakos, G.; Zervas, P.L.; Langouranis, P.; Terzis, K.; Stavrakakis, G.M. A Practical Methodology for Building a Municipality-Led Renewable Energy Community: A Photovoltaics-Based Case Study for the Municipality of Hersonissos in Crete, Greece. Sustainability 2022, 14, 12935. [Google Scholar] [CrossRef]
- Droutsa, K.G.; Kontoyiannidis, S.; Balaras, C.A.; Dascalaki, E.G.; Argiriou, A.A. Representative typology of buildings: Case study of hellenic non residential buildings. Energy Sources Part A Recovery Util. Environ. Eff. 2022, 1–21. [Google Scholar] [CrossRef]


| Tool | Key Capabilities | Planning Pillars Addressed | Limitations |
|---|---|---|---|
| EDUFOOTPRINT platform [29] | Quantitative evaluation of environmental footprint for various scenarios, taking into account life-cycle analysis; possibility to identify “green” interventions (with low emissions in the manufacturing stage); accounting for environmental impacts of renovation works during renovation; best-practices platforms: freely available/instant use; calculator: freely available for download after login and authorization by the webpage administrator. | P2–P4 | The tool is restricted to single-building processing, thus cannot handle numerous buildings. It is limited to only one building type, namely, educational buildings. It does not provide a hierarchy of projects for various buildings and types. It cannot provide gradual renovation plans. The calculator is not instantly available, and the user should first register in the webpage and obtain access to the tool only after administrator authorization. |
| SISMA SET [30] | Performing techno-economical assessment for a single building; computation of advanced financial indicators, i.e., NPV, IRR; facilitates the formulation of financial schemes and defines the margins for the required subsidy; freely available/instant download. | P2, P4 | The tool cannot manipulate numerous buildings. It partly tackles P3 by means of the manual inserting of KPIs for different solutions. The tool presumes already available state KPIs. It does not provide a hierarchy of projects for numerous buildings. Limited usability toward the production of gradual renovation plans. |
| PRIORITEE decision support tool (DST) [31] | A decision support tool (web app) to assess building stock energy performance, evaluate different efficiency and renewable interventions, and compare, rank and prioritize technical options through a set of key performance indicators (KPIs), including simple cost indicators such as energy costs, investment value, return of investment. Freely accessible only after login and authorization by the webpage administrator. | P1–P5 | The tool addresses very well almost all pillars of energy planning. The main limitation is that the tool does not automatically provide a gradual renovation plan. Another limitation is that it is not instantly available, and the user should first register in the webpage and obtain access to the tool only after administrator authorization. |
| STEPPING EPC simulation tool [32] | The EPC simulation tool detects different investment scenarios to balance public and private interest in making the investment; the profitability of the investment is assessed by a number of specialized economic parameters such as profitability index, net present value, internal rate of return; the tool was designed to assess an investment plan of a building bundle. Freely available/instant use. | P3–P5 | The tool provides a renovation investment plan accompanied with specialized cost indicators (NPV, IRR), as well as the required margin for subsidy. The tool manipulates numerous buildings and provides bundles of investments. The main restriction is that it presumes already available state KPIs in the base-case situation and for the various retrofit scenarios envisaged. It cannot automatically provide a gradual energy renovation plan. |
| CESBA-MED toolkit [33] | This is a holistic tool belonging to the category of methods known as urban energy planning methods. It contains a large list of indicators that the user can choose, including climate, energy, environmental indicators, water, waste, etc. Provided that the urban processes and indicators are already available, the tool incorporates prioritization schemes of various renovation and strategies scenarios tackling public buildings’ energy efficiency taking into account the interconnections with its environmental and system surroundings. Freely available/instant download. | P2–P5 | The tool addresses well the pillars, provided that the required state KPIs are externally available. Although the tool is very useful for holistic policy making and strategy development for cities’ sustainability, it presumes external calculation/production of state KPIs. Some of these KPIs and processes are considered advanced and require high-level skills from end users to use the tool properly. Does not automatically produce a gradual renovation plan for public buildings. |
| IMPULSE Excel-based tools [34,35] | The Excel-based tools provide the possibility to group the public building stock into representative typologies, to promptly produce KPIs for all the stock and to prioritize buildings and projects in a time horizon of up to 20 years; provided that the grouping of buildings is realistic, the KPIs’ projection tool from representative buildings to the whole sample of buildings allows for the fast conducting of a realistic plan for gradual renovations in the following years. Freely available/instant download. | P2–P6 | The tools adequately address almost all planning pillars. The main advantage is that the tools provide a gradual public building renovation plan that facilitates deciding on what projects to do, for which buildings and when. A key limitation is that they presume available state KPIs for the base-case and retrofit scenarios. They do not contain advanced financial indicators such as NPV or IRR; however, they predict a payback period, which is adequate, at least for practical planning purposes. |
| IMPULSE Tool | Input Parameters | Category | Potential Resources |
|---|---|---|---|
| PBT Library |
| Building stock data |
|
| KPIs’ processor | For both the base case and the various retrofit levels, the following state KPIs are required for each ambassador building:
| Ambassadors’ KPIs Supporting material | For the ambassador buildings identified after the classification process followed using the tool “PBT Library”, the following possible resources may be exploited (it is strongly recommended that buildings with the maximum available information should be selected as ambassadors):
|
For the various retrofit levels, the following additional KPIs are required:
| Supporting material |
|
| Methodological Step | IMPULSE Tool | Procedure | Expected Output |
|---|---|---|---|
| Step-1: Extraction of PBTs | PBT Library |
|
|
| Step-2: Production of KPI database | KPIs’ processor |
|
|
| Step-3: Generation of the building-stock renovation plan | KPIs-processor’s PLUG-IN | Provision of the following inputs in the worksheet “MCA-INPUT”:
|
|
| Content of the Energy-Efficiency Plan (Based on Legislation) | IMPULSE Tool | Procedure |
|---|---|---|
| Presentation of the building stock | PBT Library | Synthesis of information between the available building-stock data and the tabulation and classification procedures in step-1 of the second methodological layer above. |
| Techno-economic analysis of feasible retrofit scenarios | KPIs’ processor | The MEPR and nZEB scenarios are analyzed for all ambassador buildings in the first methodological layer. The obtained KPIs are then provided in the IMPULSE tool, as major (MEPR) and deep (nZEB) retrofits. The produced KPI database for the whole building stock can be elaborated on for techno-economic analysis presentation. |
| Prioritization of retrofitting scenarios | KPIs-processor’s PLUGIN | Based on the setup of the decision-making scheme, the tool provides a ranking of all projects for all buildings, as well as a gradual renovation plan associated with the expected absolute and cumulative energy savings. The outcome stands for the required energy-saving goal together with the presentation of a projects’ implementation road map. |
| Definition of a specific energy-saving goal and of a projects’ implementation road map |
| Interventions | Scenario 1 IMPULSE-Wise Retrofit Level: Medium | Scenario 2 1 IMPULSE-Wise Retrofit Level: Major | Scenario 3 1 IMPULSE-Wise Retrofit Level: Deep |
|---|---|---|---|
| Envelope interventions | ✓ | ✓ | ✓ |
| Roof thermal insulation: graphite-based EPS 7 cm | ✓ | ✓ | ✓ |
| Wall thermal insulation: graphite-based EPS 7 cm | ✓ | ✓ | ✓ |
| Windows replacement: low-e double-glazed 4-18-4 mm, aluminum frame with thermal break | ✓ | ✓ | ✓ |
| Systems’ interventions | - | ✓ | ✓ |
| Installation of a central heat-pump for heating and cooling | - | ✓ | ✓ |
| Fixtures’ replacement with LED (prescribed based on lumens minimum requirements) | - | ✓ | ✓ |
| RES integration | - | - | ✓ |
| Grid-connected PV (installed power prescribed based on the electricity demand after energy efficiency interventions) | - | - | ✓ |
| KPI | Base-Case Situation | Scenario 1 IMPULSE-Wise Retrofit Level: Medium | Scenario 2 IMPULSE-Wise Retrofit Level: Major | Scenario 3 IMPULSE-Wise Retrofit Level: Deep |
|---|---|---|---|---|
| Electricity consumption (kWh/m2) | 20.4 | 19.6 | 12.0 | 2.0 |
| Fossil fuel consumption (for heating purposes) (kWh/m2) | 31.0 | 14.6 | 0.0 | 0.0 |
| RES consumption (kWh/m2) | 0.0 | 0.0 | 0.0 | 10.0 |
| End-use energy share |  |  |  |  |
| Annual total emissions CO2 (kg/m2) | 20.5 | 15.7 | 7.2 | 1.2 |
| Investment cost (EUR) | Not applicable | 138,263.0 | 153,862.0 | 177,807.0 |
| Annual energy cost (EUR) | 9369.0 | 6724.0 | 2765.0 | 462.0 |
| Simple payback period (yrs) | Not applicable | >50 | 23.9 | 20.7 |
| Annual cumulative cash flow (EUR) | Not applicable |  |  |  |
| KPI | Base-Case Situation | Scenario 1 IMPULSE-Wise Retrofit Level: Medium | Scenario 2 IMPULSE-Wise Retrofit Level: Major | Scenario 3 IMPULSE-Wise Retrofit Level: Deep |
|---|---|---|---|---|
| Electricity consumption (kWh/m2) | 81.0 | 77.0 | 42.2 | 2.0 |
| Fossil fuel consumption (for heating purposes) (kWh/m2) | 93.0 | 43.7 | 0.0 | 0.0 |
| RES consumption (kWh/m2) | 0.0 | 0.0 | 0.0 | 40.2 |
| End-use energy share |  |  |  |  |
| Annual total emissions CO2 (kg/m2) | 73.4 | 57.9 | 25.5 | 1.2 |
| Investment cost (EUR) | Not applicable | 101,383.0 | 131,651.0 | 185,640.0 |
| Annual energy cost (EUR) | 19,609.0 | 14,605.0 | 5853.0 | 277.0 |
| Simple payback period (yrs) | Not applicable | 20.3 | 9.8 | 10.0 |
| Annual cumulative cash flow (EUR) | Not applicable |  |  |  |
| KPI | Base-Case Situation | Scenario 1 IMPULSE-Wise Retrofit Level: Medium | Scenario 2 IMPULSE-Wise Retrofit Level: Major | Scenario 3 IMPULSE-Wise Retrofit Level: Deep |
|---|---|---|---|---|
| Electricity consumption (kWh/m2) | 78.6 | 74.7 | 38.5 | 2.0 |
| Fossil fuel consumption (for heating purposes) (kWh/m2) | 75.0 | 35.3 | 0.0 | 0.0 |
| RES consumption (kWh/m2) | 0.0 | 0.0 | 0.0 | 36.5 |
| End-use energy share |  |  |  |  |
| Annual total emissions CO2 (kg/m2) | 67.2 | 54.3 | 23.2 | 1.2 |
| Investment cost (EUR) | Not applicable | 79,836.0 | 87,431.0 | 120,142.0 |
| Annual energy cost (EUR) | 11,769.0 | 9018.0 | 3555.0 | 185.0 |
| Simple payback period (yrs) | Not applicable | 29.0 | 10.7 | 10.7 |
| Annual cumulative cash flow (EUR) | Not applicable |  |  |  |
| KPI | Base-Case Situation | Scenario 1 IMPULSE-Wise Retrofit Level: Medium | Scenario 2 IMPULSE-Wise Retrofit Level: Major | Scenario 3 IMPULSE-Wise Retrofit Level: Deep |
|---|---|---|---|---|
| Electricity consumption (kWh/m2) | 20.8 | 20.0 | 12.3 | 2.0 |
| Fossil fuel consumption (for heating purposes) (kWh/m2) | 32.0 | 15.0 | 0.0 | 0.0 |
| RES consumption (kWh/m2) | 0.0 | 0.0 | 0.0 | 10.3 |
| End-use energy share |  |  |  |  |
| Annual total emissions CO2 (kg/m2) | 21.0 | 16.0 | 7.4 | 1.2 |
| Investment cost (EUR) | Not applicable | 141,491.0 | 211,356.0 | 236,289.0 |
| Annual energy cost (EUR) | 9743.1 | 6978.0 | 2873.0 | 468.0 |
| Simple payback period (yrs) | Not applicable | >50 | 34.2 | 28.1 |
| Annual cumulative cash flow (EUR) | Not applicable |  |  |  |
| KPI | Base-Case Situation | Scenario 1 IMPULSE-Wise Retrofit Level: Medium | Scenario 2 IMPULSE-Wise Retrofit Level: Major | Scenario 3 IMPULSE-Wise Retrofit Level: Deep |
|---|---|---|---|---|
| Electricity consumption (kWh) | 444,816.8 | 426,691.4 | 252,441.0 | 35,114.0 |
| Fossil fuel consumption (for heating purposes) (kWh) | 626,742.0 | 294,568.7 | 0.0 | 0.0 |
| Annual total emissions CO2 (tns) | 433.5 | 334.9 | 152.1 | 21.2 |
| Investment cost (k EUR) | - | 2260.6 | 2596.6 | 3062.7 |
| Annual energy cost (k EUR) | 179.0 | 129.8 | 53.0 | 7.4 |
| Simple payback period (yrs) | - | 46.0 | 20.6 | 17.8 |
| Combination | Weights | Road Map Duration (yrs) | Standard Deviation of Projects’ Number | No. of Years with at Least Two Buildings Being Retrofitted |
|---|---|---|---|---|
| Comb1 | DC1: 30% DC2: 10% DC3: 60% | 6 | 1.03 | 5 |
| Comb2 | DC1: 10% DC2: 30% DC3: 60% | 6 | 1.03 | 5 |
| Comb3 | DC1: 60% DC2: 10% DC3: 30% | 7 | 1.91 | 2 |
| Comb4 | DC1: 10% DC2: 60% DC3: 30% | 7 | 1.91 | 2 |
| Comb5 | DC1: 30% DC2: 60% DC3: 10% | 6 | 0.82 | 3 |
| Comb6 | DC1: 60% DC2: 30% DC3: 10% | 6 | 0.82 | 3 |
Disclaimer/Publisher’s Note: The statements, opinions and data contained in all publications are solely those of the individual author(s) and contributor(s) and not of MDPI and/or the editor(s). MDPI and/or the editor(s) disclaim responsibility for any injury to people or property resulting from any ideas, methods, instructions or products referred to in the content. |
© 2023 by the authors. Licensee MDPI, Basel, Switzerland. This article is an open access article distributed under the terms and conditions of the Creative Commons Attribution (CC BY) license (https://creativecommons.org/licenses/by/4.0/).
Share and Cite
Stavrakakis, G.M.; Zervas, P.L.; Terzis, K.; Langouranis, P.; Saranti, P.; Stephanedes, Y.J. Exploitation of Mediterranean Cooperation Projects’ Tools for the Development of Public Buildings’ Energy Efficiency Plans at Local Level: A Case Study in Greece. Energies 2023, 16, 3352. https://doi.org/10.3390/en16083352
Stavrakakis GM, Zervas PL, Terzis K, Langouranis P, Saranti P, Stephanedes YJ. Exploitation of Mediterranean Cooperation Projects’ Tools for the Development of Public Buildings’ Energy Efficiency Plans at Local Level: A Case Study in Greece. Energies. 2023; 16(8):3352. https://doi.org/10.3390/en16083352
Chicago/Turabian StyleStavrakakis, George M., Panagiotis L. Zervas, Konstantinos Terzis, Panagiotis Langouranis, Panagiota Saranti, and Yorgos J. Stephanedes. 2023. "Exploitation of Mediterranean Cooperation Projects’ Tools for the Development of Public Buildings’ Energy Efficiency Plans at Local Level: A Case Study in Greece" Energies 16, no. 8: 3352. https://doi.org/10.3390/en16083352