Article

Enhanced Gas Production from Class II Gas Hydrate Reservoirs by the Multistage Fractured Horizontal Well

1
School of Petroleum Engineering, China University of Petroleum (East China), Qingdao 266580, China
2
Tianjin Branch of CNOOC Ltd., Tianjin 300459, China
3
Shenzhen Branch of CNOOC Ltd., Shenzhen 518000, China
4
Key Laboratory of Gas Hydrate, Guangzhou Institute of Energy Conversion, Chinese Academy of Sciences, Guangzhou 510640, China
*
Author to whom correspondence should be addressed.
Energies 2023, 16(8), 3354; https://doi.org/10.3390/en16083354
Submission received: 19 January 2023 / Revised: 6 March 2023 / Accepted: 20 March 2023 / Published: 10 April 2023

Abstract

:
In the two test productions that have been conducted in the hydrate reservoir test development zone in the South China Sea, the gas production capacity of single wells is low and the exploitation difficulty with the cost is too high for commercial demand economically. The low permeability of the hydrate-bearing layer (HBL) acts as the major barrier for pressure propagation during depressurization. Hydraulic fracturing by the combined depressurization is considered a promising hydrate production enhancement technology that can effectively improve the seepage state in the reservoir. In this study, to evaluate the effectiveness of the development methods association with fracturing, we established an idealized Class II hydrate reservoir and studied it using a multi-stage fractured horizontal well to assist in depressurization extraction. In order to evaluate the production enhancement effect of this method, we compared the gas production results of four methods, including single vertical well, vertical fractured well, horizontal well, and multistage fractured horizontal well through numerical simulation. In order to investigate the influence of key fracture parameters on the production enhancement effect, a sensitivity analysis of the production effect of Class II hydrate reservoirs with different fracture spacing, number of fractures, fracture conductivity, and fracture length was conducted, and the results were analyzed in terms of gas production and water production behavior curves as well as physical field evolution over time. The simulation results show that the multi-stage fractured horizontal wells have the best production increase in the comparison of well types. In the analysis of fracture parameters, it can be found that the selection of proper fracture spacing and dimensionless fracture conductivity can lead to a significant increase in gas production.

1. Introduction

Natural gas hydrates, also known as “combustible ice”, are crystalline compounds formed by hydrocarbon gases, mainly methane, and water under specific low-temperature and high-pressure conditions. They are widely distributed on the edges of oceanic continental shelves and glacial tundra and contain huge reserves of natural gas [1,2,3]. As the reserves of conventional fossil fuels are decreasing, natural gas hydrates, as an important component of unconventional energy sources, have attracted more and more attention [4,5,6]. At present, some field tests were performed. According to the field tests in Mackenzie Delta [7,8], Alaska North Slope [9], Nankai Trough [10,11], Qilian Mountain permafrost in China [12] and the Shenhu sea in the South China Sea [13] and some reservoir-scale prediction studies [14,15,16], it can be found that the current production technology can extract gas from hydrate reservoirs. However, the extraction efficiency is still far below the commercial development standard [17]. Therefore, it is necessary to further explore the production enhancement methods for hydrate reservoir development.
Several methods are available to exploit hydrate reservoirs, including depressurization, thermal stimulation, chemical inhibitor injection, and CO2–CH4 exchange. The conventional extraction method alone has limitations such as low energy efficiency and low gas production rate. New production enhancement methods should be explored. The first offshore NGH production test in Shenhu Area indicates the permeability of the NGH formation is very low (the permeability is 2–5 mD for the test area) [18]. Hydraulic fracturing can be an effective method for gas hydrate reservoirs. Several authors have studied hydraulic fracturing experimentally based on hydrate-bearing sediments [19,20,21]. The effect of hydraulic fracturing on gas production from natural gas hydrate reservoirs was also studied by numerical simulations. Chen et al. [22] analyzed the effect of fracture length and fracture spacing on gas production for hydrate reservoirs. Feng et al. [23,24] found that fracturing could significantly increase gas production in the early production stage. Zhao et al. [25] performed numerical modeling of NGH decomposition behavior under various fracturing patterns from the core scale and found a significant improvement in gas production efficiency by fracturing. Liu et al. [26] discussed the development of a feasibility evaluation model for hydraulic fracturing of hydrate-bearing porous media, in which the feasibility of hydraulic fracturing of hydrate reservoirs is evaluated by the fracturability index. Yu et al. [17] analyzed the enhancement of natural gas production by hydraulic fracturing in a multilayered hydrate reservoir at the Second Test Site in the South China Sea and demonstrated that horizontal fractures and branching fractures can enhance the production of low-permeability clayey-silt hydrate reservoirs.
Horizontal well technology can increase the contact area between the well and the reservoir. Chong et al. [27,28] demonstrated that horizontal wells help to improve gas recovery rates based on small-scale experiments. Feng et al. [29] evaluated the gas production performance of vertical and horizontal wells using depressurization and thermal stimulation methods. Feng et al. [30] investigated that depressurization of horizontal wells is beneficial to the dissociation of hydrates in larger-scale hydrate reservoirs. Yang et al. [31] showed that horizontal wells are able to reach industrial recovery levels for Class III hydrate reservoirs under combined depressurization and thermal stimulation. Reagan et al. [32] compared the gas production effect of horizontal and vertical wells in different hydrate reservoirs. They found that horizontal wells had limited production enhancement for Class Ⅰ hydrate reservoirs, but good production enhancement for Class II and III hydrate reservoirs. Moreover, a significant advantage of horizontal wells in the production of Class Ⅱ and Ⅲ hydrate is the prevention of secondary hydrate formation in the vicinity of the wellbore. Li et al. [33] conducted a numerical simulation study of the gas production potential of the multi-year permafrost at the DK-2 site in the Qilian Mountains using a two-point horizontal well system. They concluded that the desired gas production performance can be obtained using a two-point horizontal well system under appropriate pressure reduction and heat injection conditions. Liu et al. [34] proposed a production method using one horizontal well and one vertical injection well to improve the performance of hot water stimulation in gas hydrate reservoirs. The results showed that the method successfully shifted the flow of hot water to the undissociated zone with higher gas hydrate saturation and facilitated gas hydrate dissociation. Liu et al. [35] proposed a geothermal energy-assisted gas hydrate recovery method and demonstrated its feasibility. The well package consists of a horizontal well located in the geothermal reservoir and two production horizontal wells distributed in the gas hydrate formation. Feng et al. [36] found that the use of horizontal wells to exploit a sand-dominated hydrate reservoir such as the Nankai Trough produced significant gas and that horizontal wells increased production by an order of magnitude over vertical wells. Ma et al. [37] investigated the effect of horizontal fracture length and well location on gas production in each layer in the Shenhu Sea hydrate reservoir and the variation of total production by numerical simulation.
In this study, we developed a numerical model for a multistage fractured horizontal well to extract Class II hydrate reservoirs. We analyzed the effect of multistage fractured horizontal wells on gas production efficiency. The production performance of four different production methods: single vertical well, single fractured vertical well, horizontal well and multistage fractured horizontal well are compared. The characteristics of pressure, temperature, and hydrate saturation are analyzed. In Section 2, mathematical models to simulate hydrate mining in sediments are given. Then, we show the numerical simulation model. Finally, the result and discussion are given.

2. Mathematical Models

Figure 1 depicts a schematic diagram of a hypothetical vertical fracture after hydraulic fracturing. The width of the fracture is always small. The permeability of fracture is much higher than that of the matrix. As shown in Figure 2, Class II hydrates are considered in this study. The following assumptions are considered: (1) the model is divided into three phases (aqueous, gas, and hydrate) and three mass components (CH4, CH4·nH2O, and H2O); (2) the fluid flow in the model (in the matrix as well as in the fracture) follows Darcy’s law; (3) CH4 is the only gas produced by hydrate decomposition; (4) the fractures have uniform width, length, and height.
As shown in Figure 3, the fracture is idealized as a rectangular high permeability flow plane in this study, and the fracture is treated with the local refinement technique (LGR). Make the fracture area 0.001 m × 100 m in x and y directions, and z-direction through the whole hydrate layer. For computational reasons, the width of the grid refinement cannot be too small, so in the actual calculation, the conductivity of the fracture is kept constant and the fracture width is adjusted appropriately by the equivalent seepage resistance method, a hypothetical method that reduces the need for computational cost while maintaining a certain degree of accuracy [38].

2.1. Kinetic Model of Hydrate Dissociation

The process of hydrate dissociation or formation can be described in the following equation [39]:
Reaction:   CH 4 ( g ) + nH 2 O ( l ) CH 4 n H 2 O ( s ) ± heat
In this paper, the Kim–Bishnoi equation [40,41] is used to describe the kinetic properties of hydrates:
d c h ( d ) d t = k d A d p e p g
where c h ( d ) is the hydrate concentration; k d is the hydrate dissociation rate constant; A d is the hydrate dissociation area; p e is the equilibrium pressure; p g is the gas phase pressure.
The dissociation rate constant k d is defined as [42]:
k d = k d 0 exp E / R T
where k d 0 is the intrinsic hydrate dissociation rate constant.
Defining A d = φ 2 A H S S w S h , λ d = k d 0 A H S / ρ w ρ h . The kinetics of hydrate dissociation can be estimated as [43,44]:
d c h ( d ) d t = λ d φ ρ w S w φ ρ h S h p e exp E R T 1 1 K ( p , T )
where K ( p , T ) is the equilibrium constant K values for chemical reactions in the simulator; R is the gas universal constant; A H S is the specific area of hydrate particles; S represents the phase saturation; The subscripts g, w, and h mean the gas, water, and hydrate, respectively; ρ is the phase density.

2.2. Mass Balance Equation

The mass balance equation of each component is described as follows [44]:
Methane:
( φ ρ g S g ) t = ( ρ g v g ) + m ˙ g + q g
Water:
( φ ρ w S w ) t = ( ρ w v w ) + m ˙ w + q w
Hydrate:
( φ ρ h S h ) t = m ˙ h
where v is the flow velocity; m ˙ denotes the mass change due to hydrate dissociation; φ is the intrinsic porosity; q g is the gas production rate of the well; q w is the water production rate of the well.

2.3. Equation of Energy Conservation

The energy conservation equation can be written as [44]:
· λ c T · ρ g v g r H g + ρ w v w r H w + q g H g + q w H w + q h = t ( 1 ϕ ) ρ s H s + ϕ ( s h ρ h H h + s w ρ w h w + s g ρ g H g
where q h is the heat of hydrate dissociation.
The effective heat conduction is described based on the method of volume average [44]:
λ c = λ s ( 1 ϕ ) + ϕ ( λ h H h + λ g H g + λ w H w )
where λ is the conductivity coefficient; H is the enthalpy of phase; the subscript s indicates the solid phase.

2.4. The Relation between Porosity and Permeability

With the dissociation of hydrate, the effective permeability of hydrate formation changes with the change of porosity. In this study, the relationship between effective permeability and porosity is based on the Carmen–Kozeny model [42,44]:
k = k 0 φ φ 0 ε 1 φ 0 1 φ 2
where k is the effective permeability when the porosity is φ ; k 0 is the effective permeability when the porosity is φ 0 ; ε is an empirical parameter.

3. Numerical Simulation Model

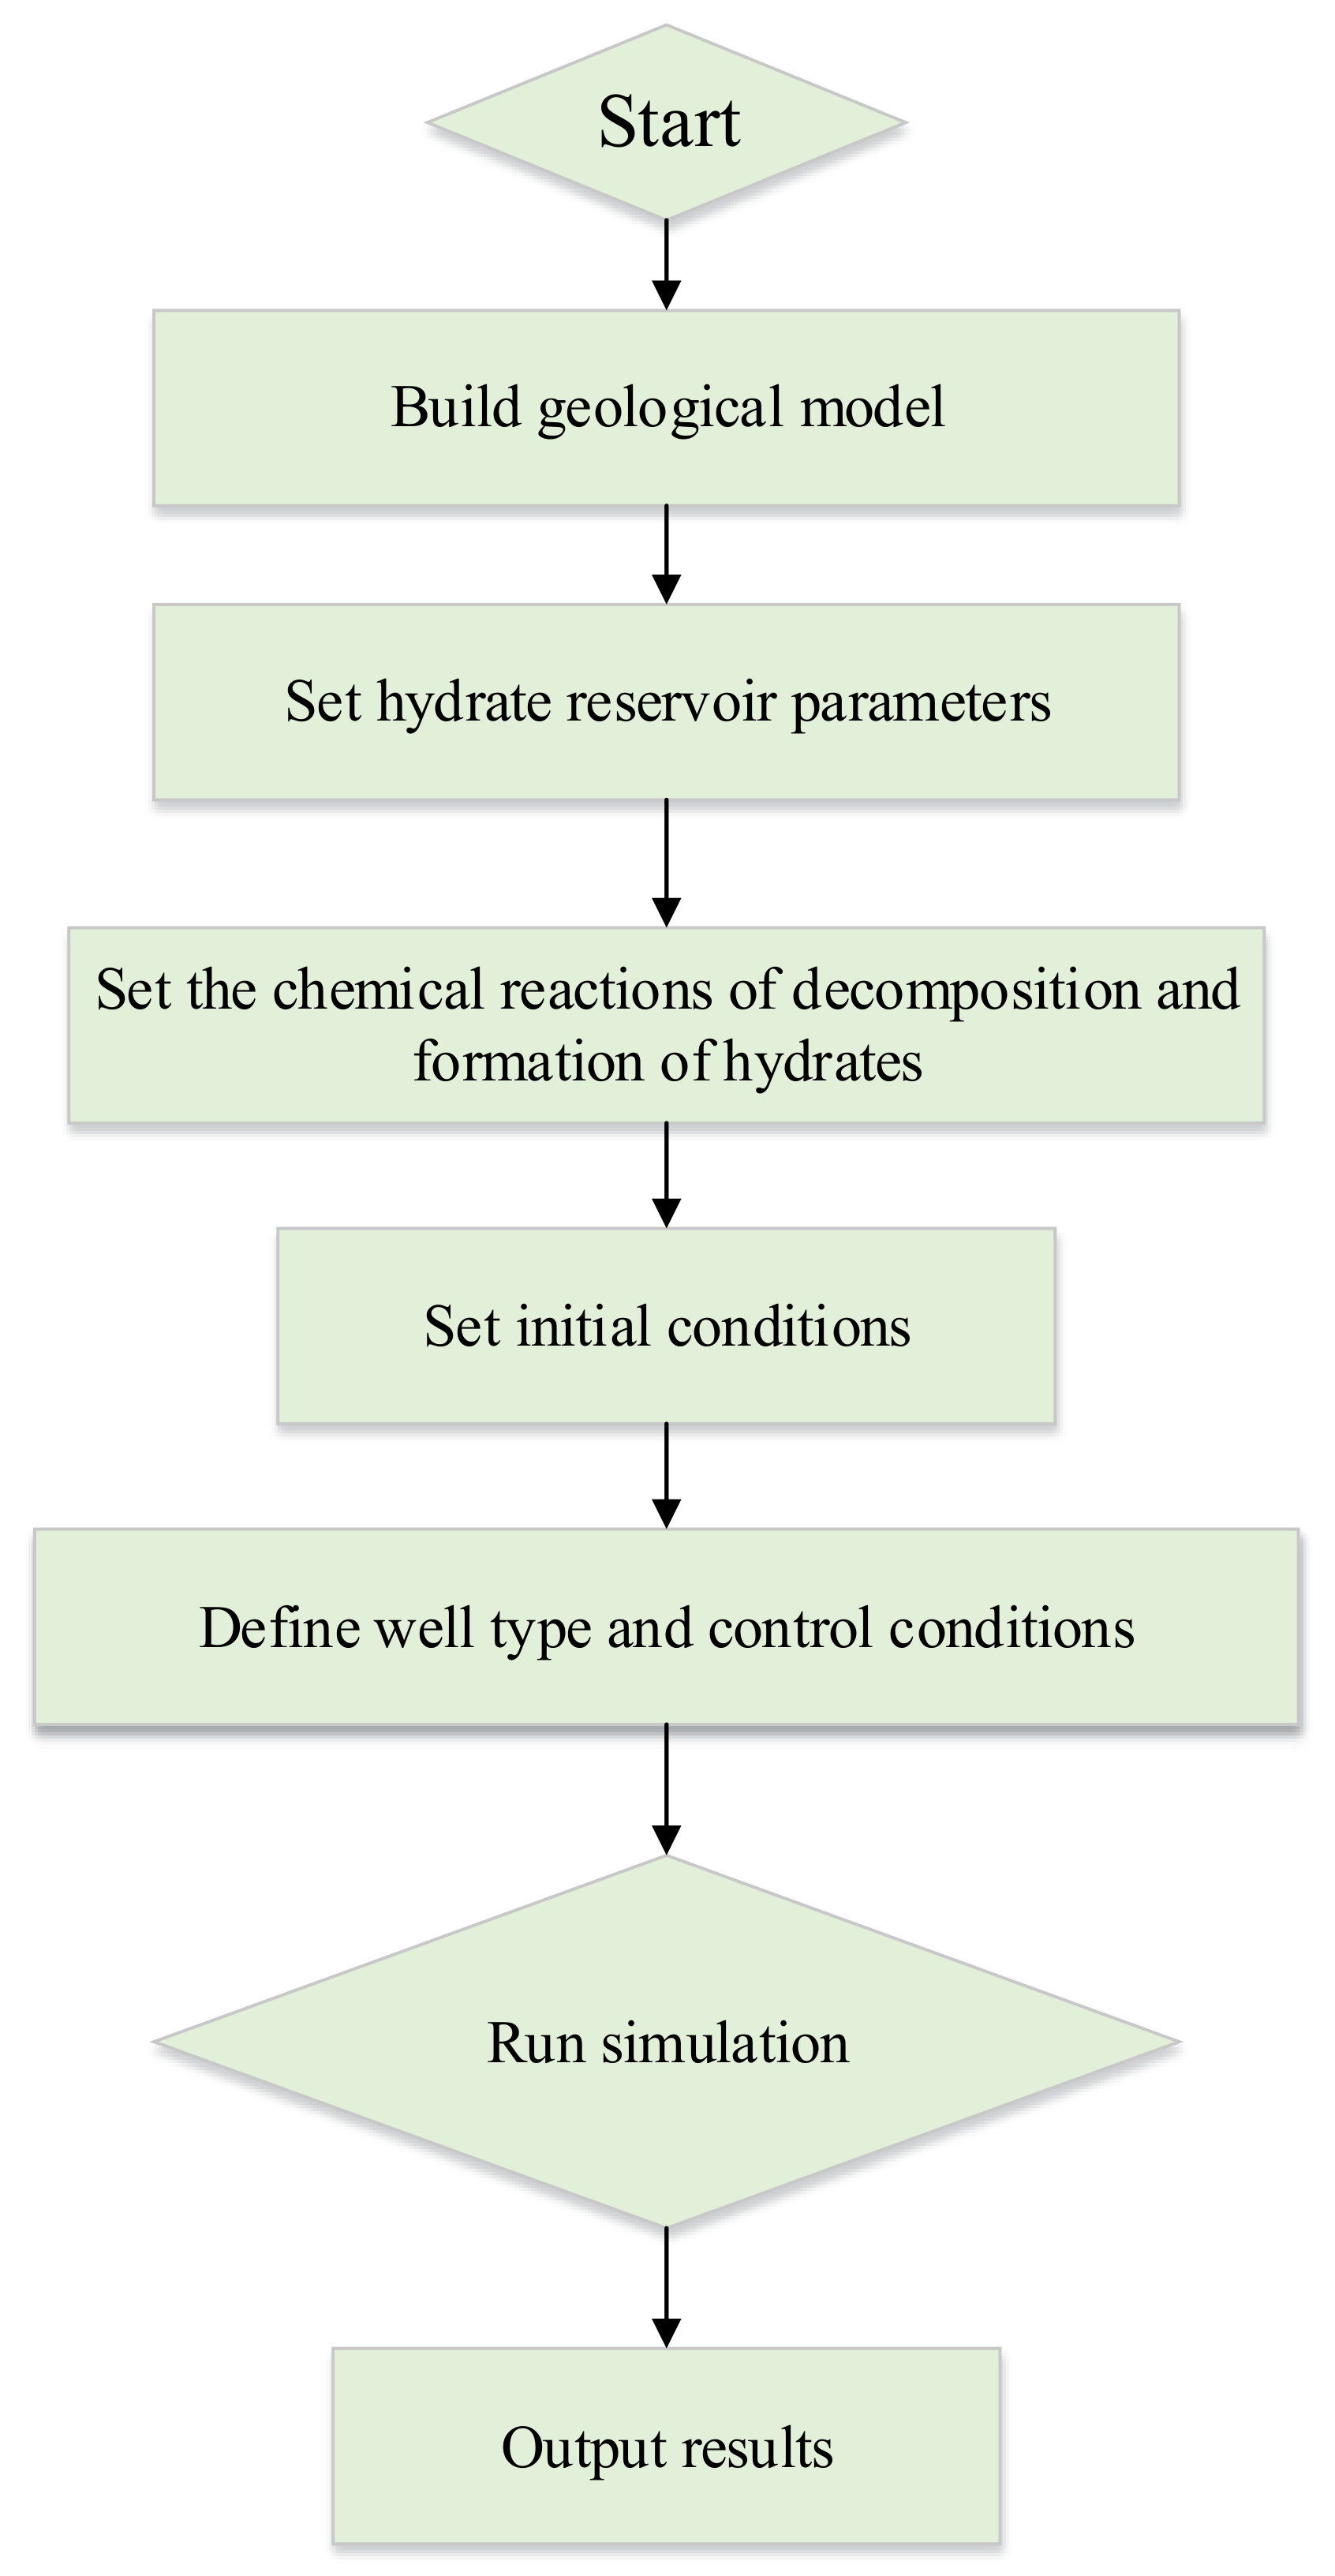
The CMG-STARS software developed by Canadian CMG Company is an effective tool for gas hydrate production analysis. It integrates mass conservation, energy conservation, and chemical reactions. Thus, hydrate formation and dissociation can be described and simulated. In this study, the CMG-STARS 2012 is applied to carry out corresponding numerical simulations. Many researchers have successfully applied the simulator to investigate the gas production behavior from hydrate reservoirs [39,43,44,45,46]. The flow of simulated hydrate development using CMG-STARS in this paper is shown in Figure 4.
In this paper, a rectangular hydrate reservoir model is designed for Class II hydrate reservoirs. The model is 1400 m long, 300 m wide and 10 m high (8 m for the hydrate layer and 2 m for the underlying water layer). The grid of 70 × 15 × 10 is set, and the specific geological model is shown in Figure 5. A horizontal well 1000 m long was set up in the fourth layer for production simulation. In order to study the effect of multistage fractured horizontal wells on the gas production of Class II hydrate reservoirs, 10 fractures were set along the horizontal well with an interval of 100 m. The specific parameters are shown in Table 1. In order to verify the accuracy of the results after coarsening the grid, we added two sets of simulation groups with finer grid division, namely 140 × 30 × 10 and 280 × 60 × 10. We simulated a single horizontal well development using these three grid sizes. The simulation results are shown in Figure 6, when comparing the gas production, it can be seen that the accuracy of the simulation after coarsening the grid is not much different from that of the other two groups of more refined grids.

4. Discussion

4.1. Impact of Different Methods of Production Enhancement

This section analyzes and compares the production effects of four types of production enhancement methods: single vertical well, vertical fractured well, horizontal well, and multistage fractured horizontal well on Class II hydrate reservoirs. The fracture is set 100 m long, with k-direction penetrating through the whole hydrate formation. The dimensionless fracture conductivity (DFC) is 10. The horizontal well is 1000 m long and the fracture spacing is 100 m, a total of 10 fractures. The dimensionless fracture conductivity is calculated as follows [44].
C f D = k f b k L f
where k f is the fracture permeability, mD; b is the fracture width, m; k is the matrix permeability, mD and L f is the fracture half-length, m.
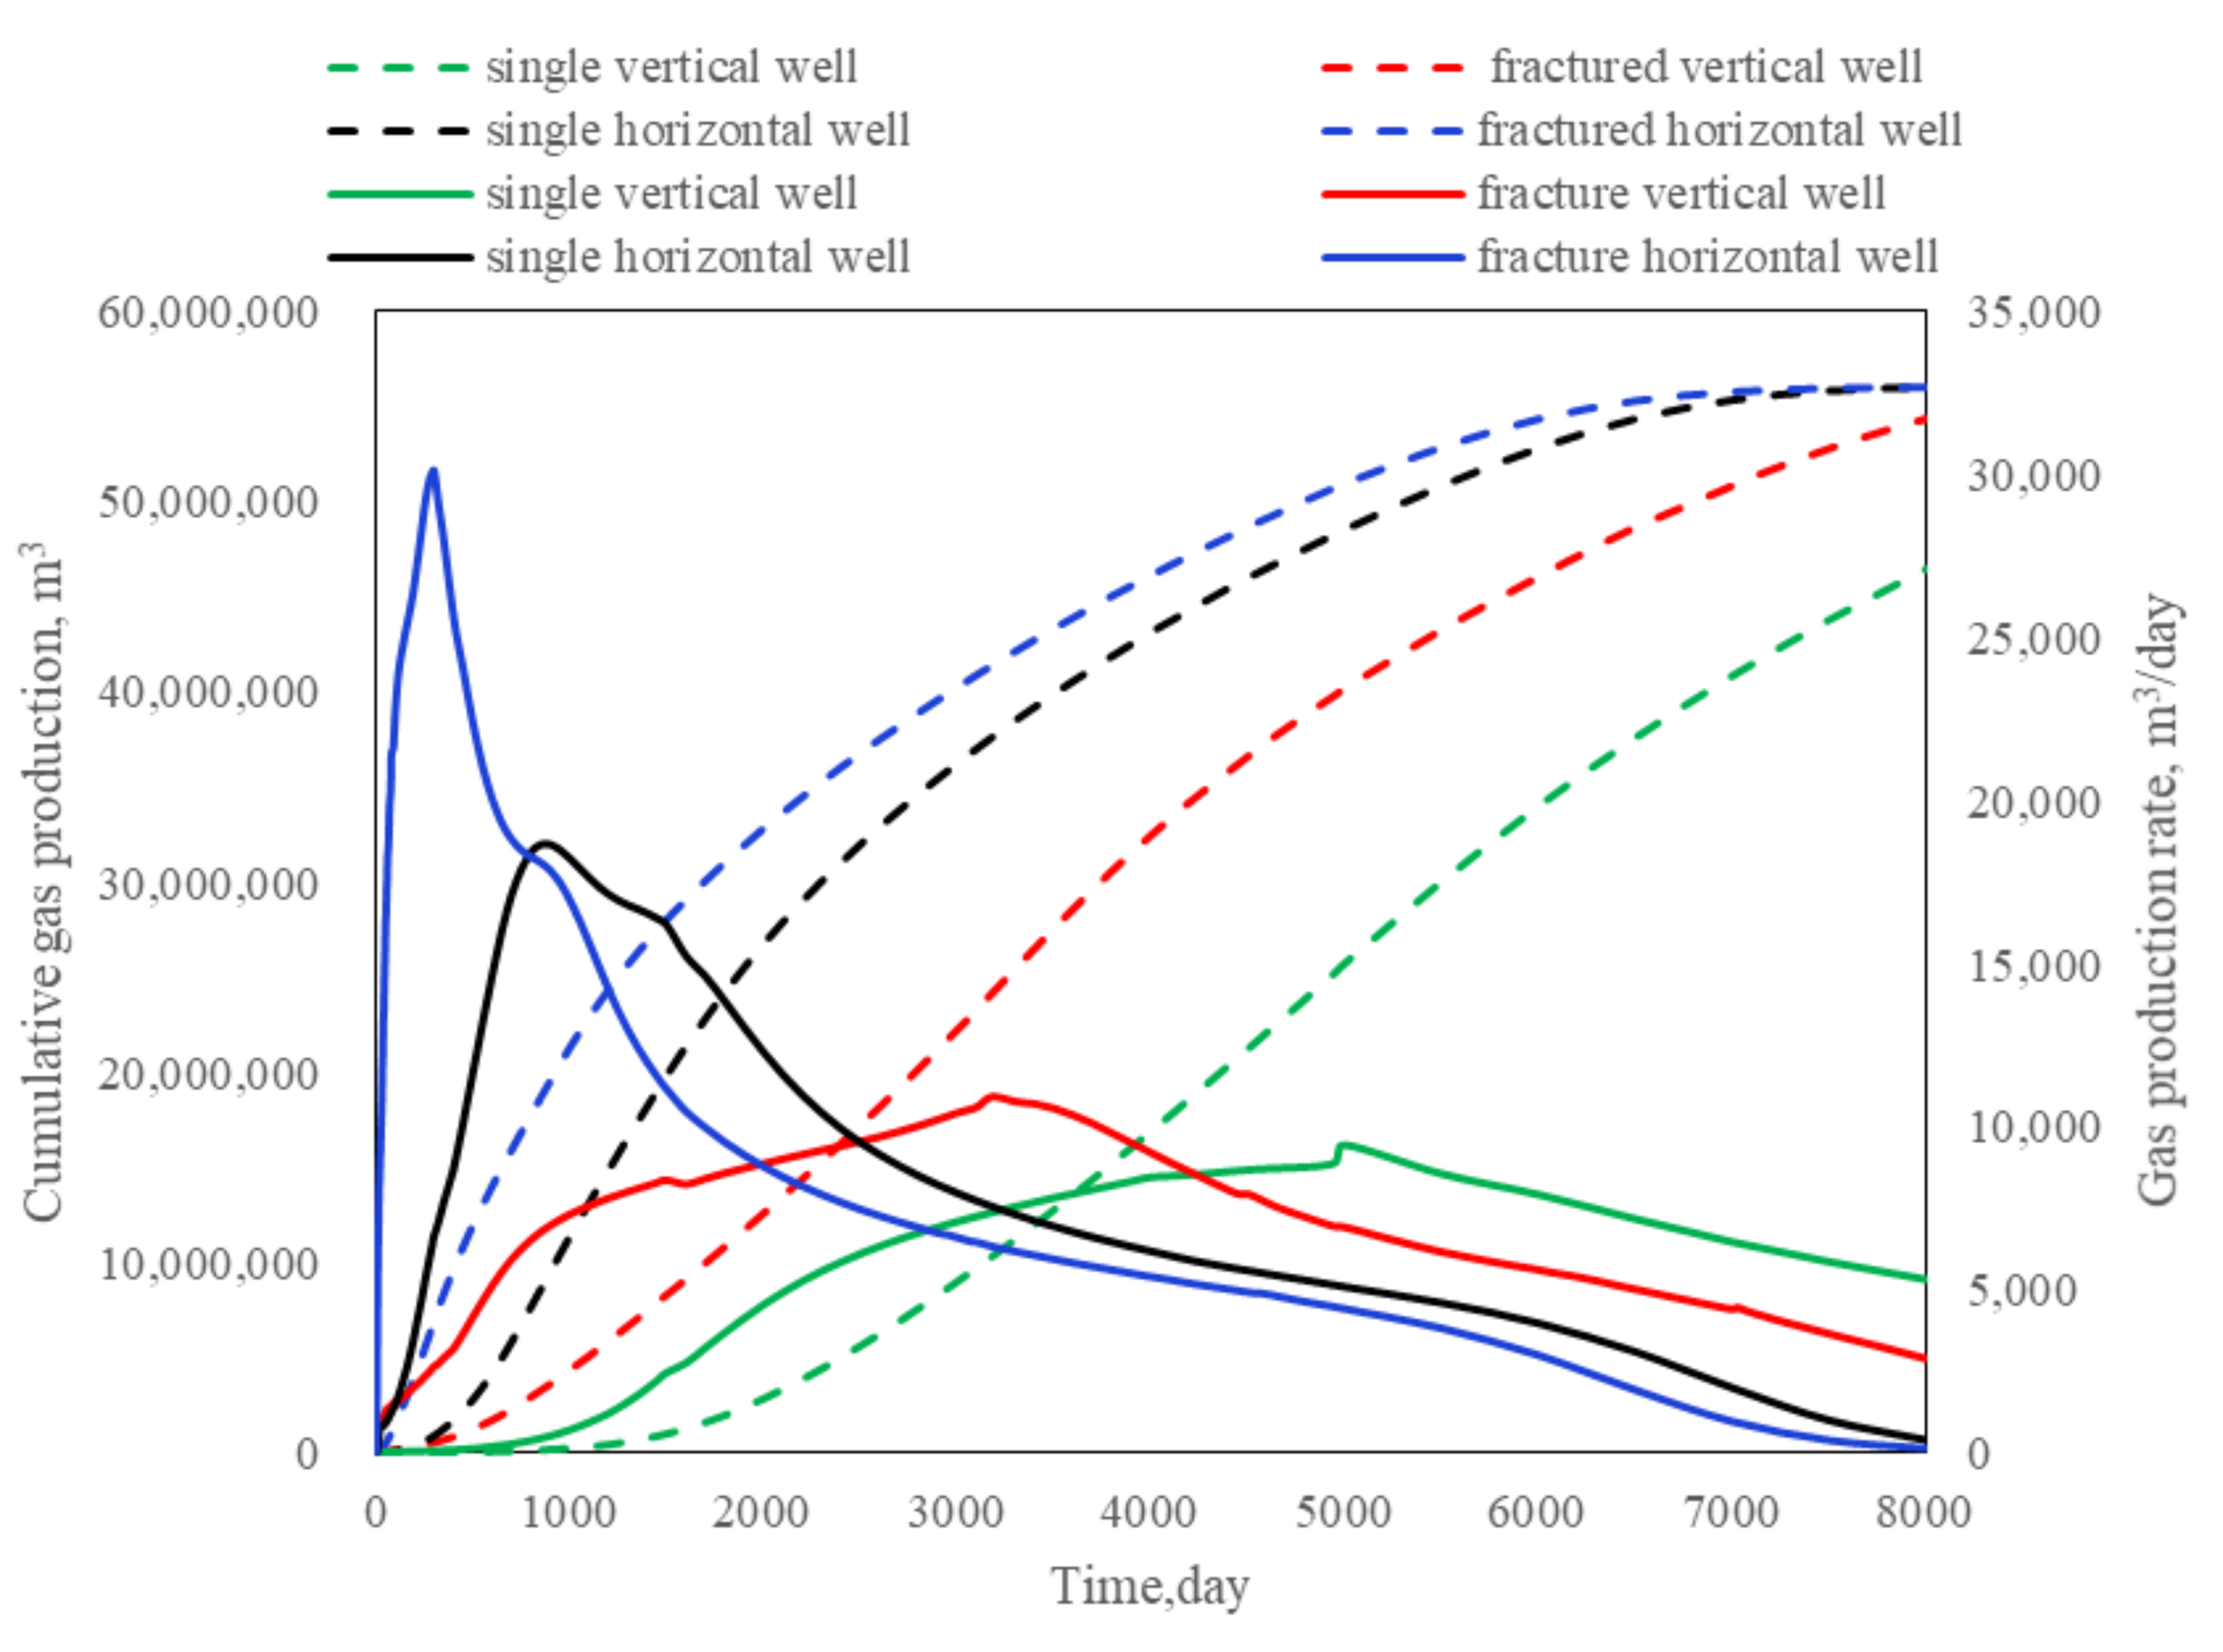
The effects of four different production methods on the gas production of the Class II hydrate reservoir are shown in Figure 7. The production enhancement effect of hydraulic fracturing is considerable. Horizontal well production produces more gas than a single vertical well. The production trends are similar for all methods. The gas production behavior is divided into three stages. In the first stage, the gas production rate increases rapidly. For the second stage, the gas production rate reaches a peak and then decreases rapidly. For the third stage, gas production remains at a low value. In the case of single vertical well production, the cumulative gas production reaches 4.6 × 10⁷ m3 at 8000 days and the peak daily gas production reaches 9498.514 m3/day at 5000 days. The cumulative gas production of fractured vertical wells reaches 5.4 × 10⁷ m3 at 8000 days and the peak daily gas production reaches 10,899.03 m3/day at 3200 days. The horizontal well cumulative gas production is 5.6 × 10⁷ m3 at 8000 days and reaches a peak of 18,663.41 m3/day at 900 days. The multistage fractured horizontal well reaches a peak of 30,155.98 m3/day at 300 days and the cumulative gas production at 8000 days coincided with that of the horizontal well. The multistage fractured horizontal well is very effective in increasing the initial production rate. Figure 8 shows the water production rate for different cases. The multistage fracturing horizontal well leads to the most water production. The cumulative water production reaches 1.22 × 10⁵ m3 by the end of production time.
Figure 9, Figure 10 and Figure 11 illustrate the evolution of the physical parameters over time. In the early stages, a low-pressure, low-temperature region occurs near the production well. The comparison shows that the pressure and temperature decrease largely when considering fractures. The fractures allow the gas and water to flow more quickly into the production well. It can be seen from Figure 11 that the hydrate decomposition region is different: vertical well < vertical fractured well < horizontal well < multistage fractured horizontal well. This is because the horizontal well has a larger contact area than the vertical well. The fracture enhanced this mechanism.

4.2. Effect of Different Fracture Spacing

This section analyzed the effect of different fracture spacing on the production of Class II hydrate reservoirs. The fracture spacing is set to be 40 m, 60 m and 100 m, respectively. The fracture length is 100 m. The dimensionless fracture conductivity is 10 and the number of fractures is 10. For the “no fracture” case, the horizontal well with 10 perforation points is considered. The interval between two perforation points is 100 m.
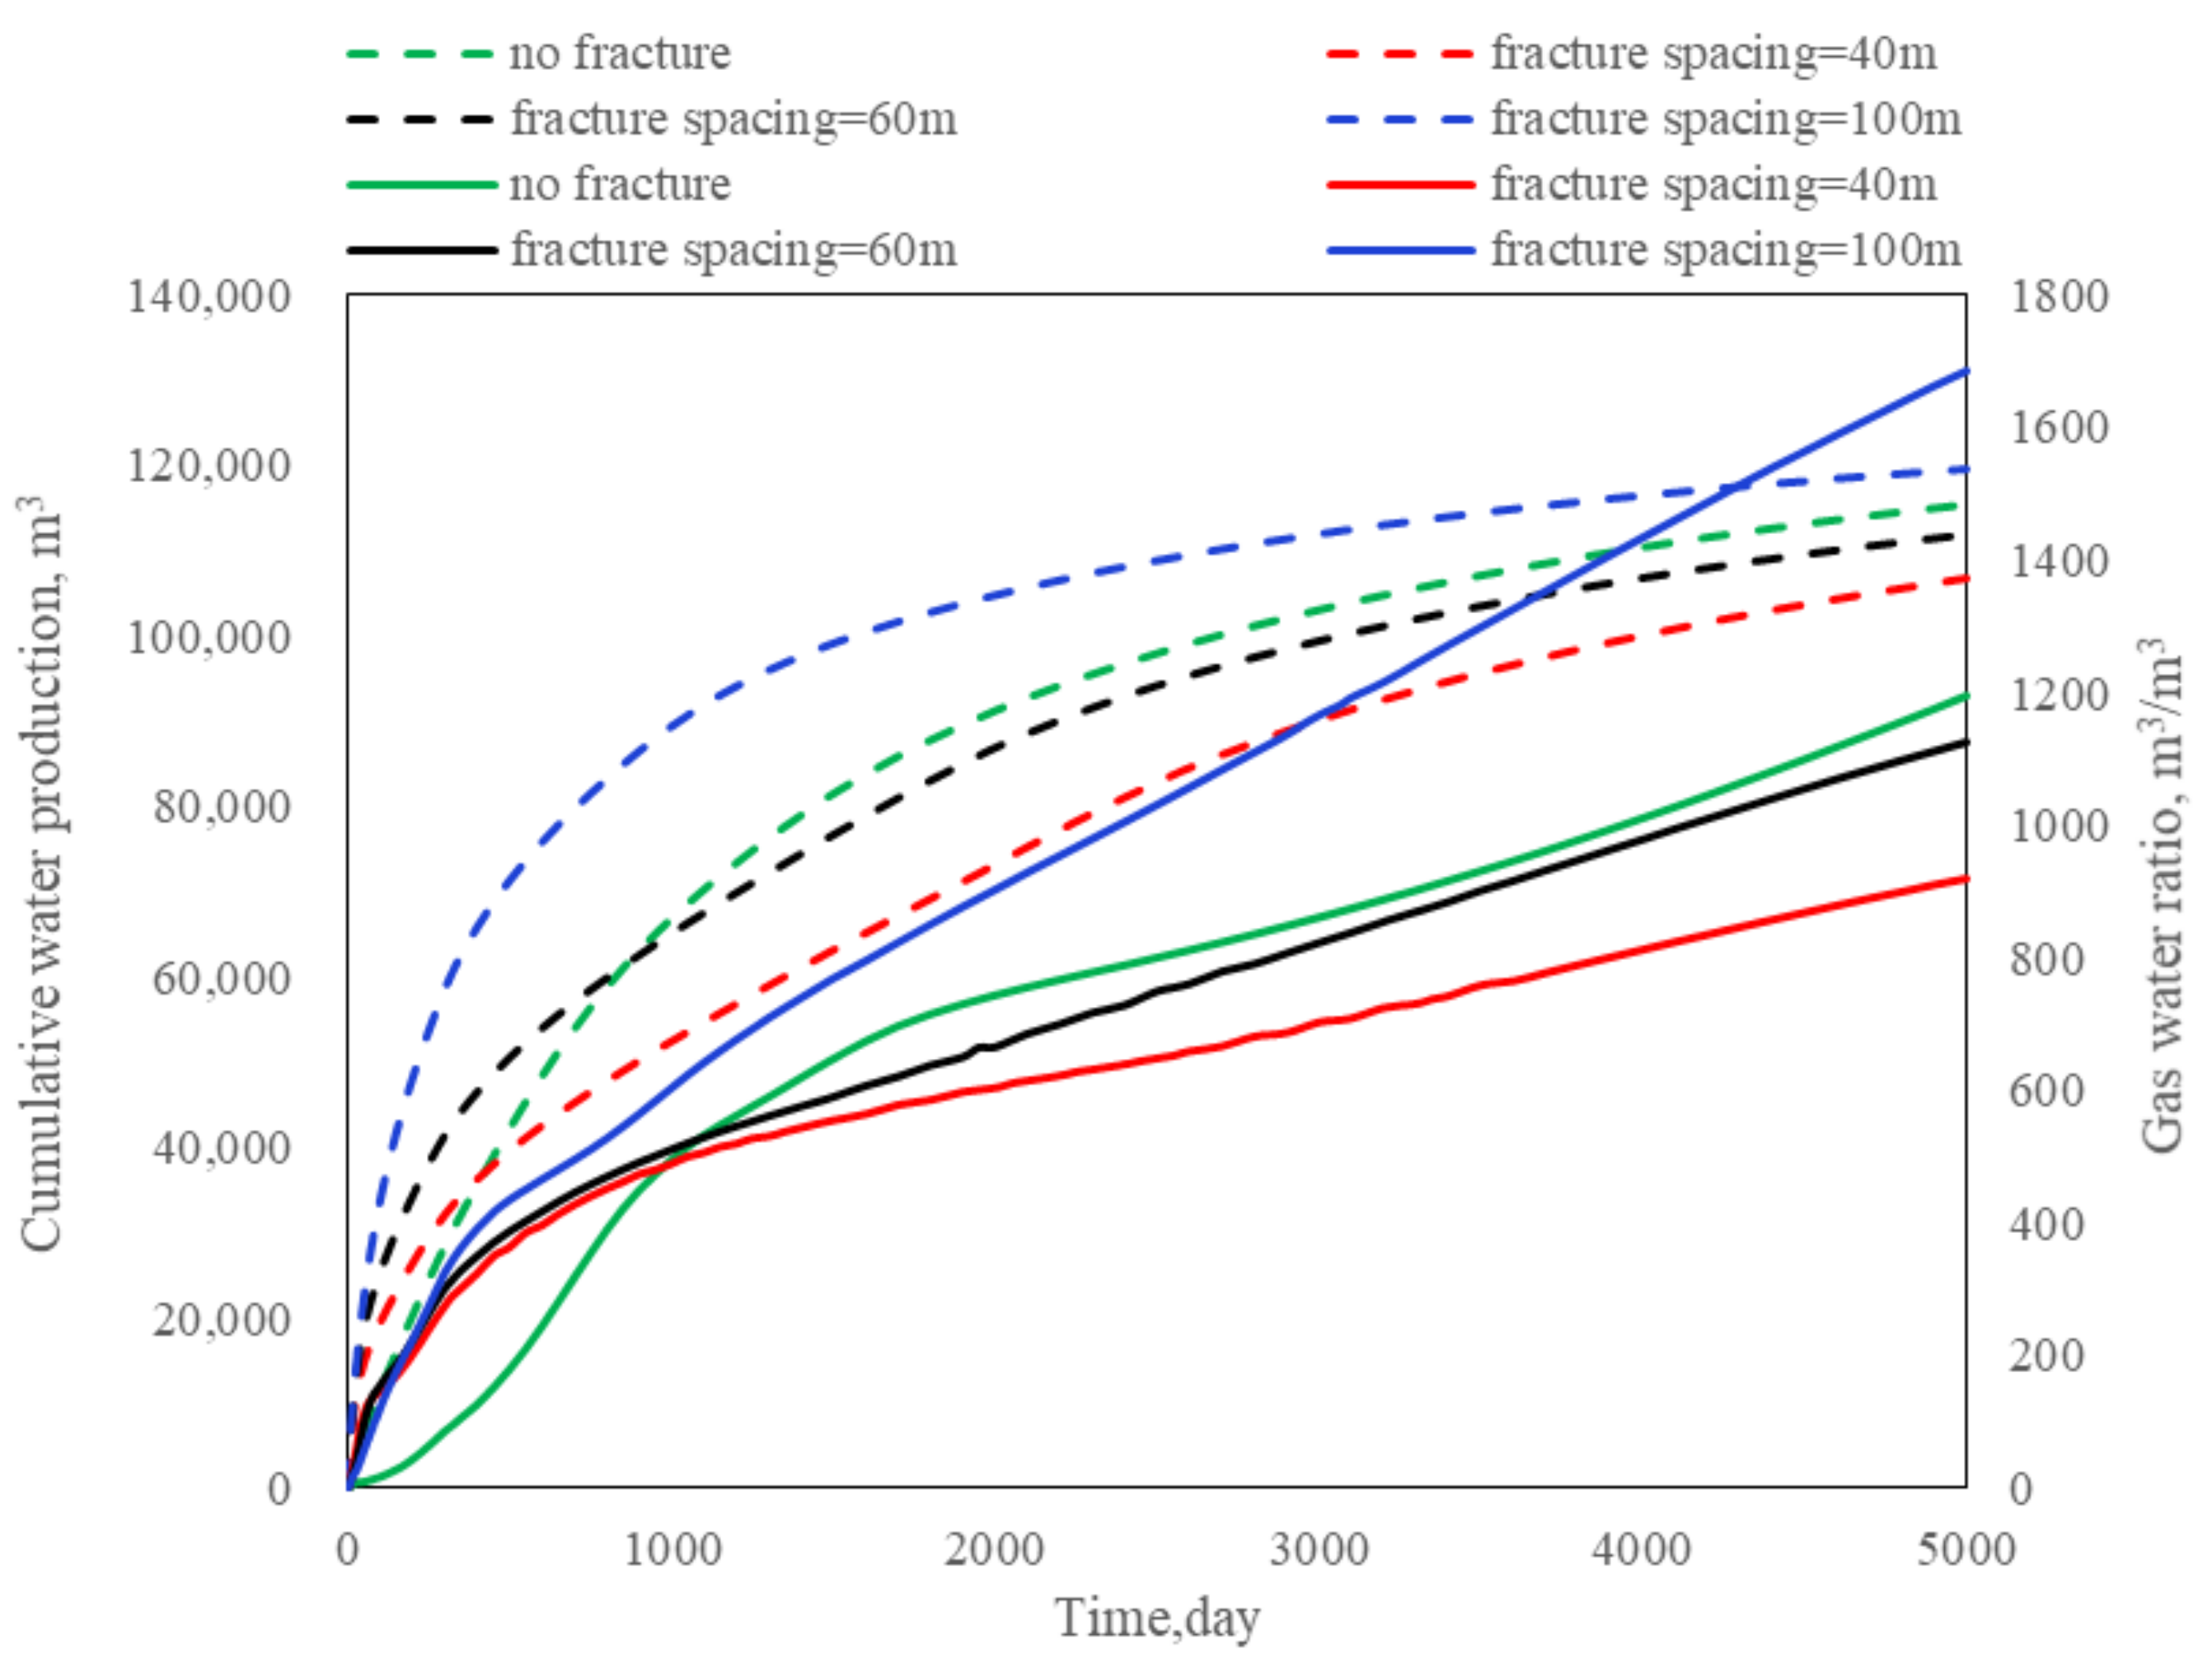
Figure 12 shows the gas production of Class II hydrates under the influence of fracture spacing. It can be seen that big fracture spacing leads to a large cumulative gas amount because the contact area increases. Comparing the gas production dynamics of Figure 12, it can be seen that the too-close fractures have even inhibited the enhancement of gas production, as shown by the cumulative gas production of 4.77 × 10⁷ m3 at a spacing of 40 m, which is lower than the cumulative gas production of 4.86 × 10⁷ m3 in the absence of fractures. Although the daily gas production reached a peak earlier than that in the case without fractures, the cumulative production did not increase. In contrast, the wider fracture spacing can bring a considerable increase in production, which shows that the choice of fracture location has an impact on hydrate exploitation. Combining the trends of water production and gas-water ratio in Figure 13, we can find that the fractures improve the seepage environment and increase the water production at the same time, but if the spacing is too small, the gas production will be inhibited and the gas-water ratio will be inferior to that in the case without fractures. This is evident in the green curve without fractures in Figure 13, where the gas-to-water ratio is consistently higher after 1,000 days than in the curves with fracture spacing of 40 and 60 m. In summary, even though adjusting the fracture spacing is not a significant improvement in production, it is a factor that must be considered for commercial production.
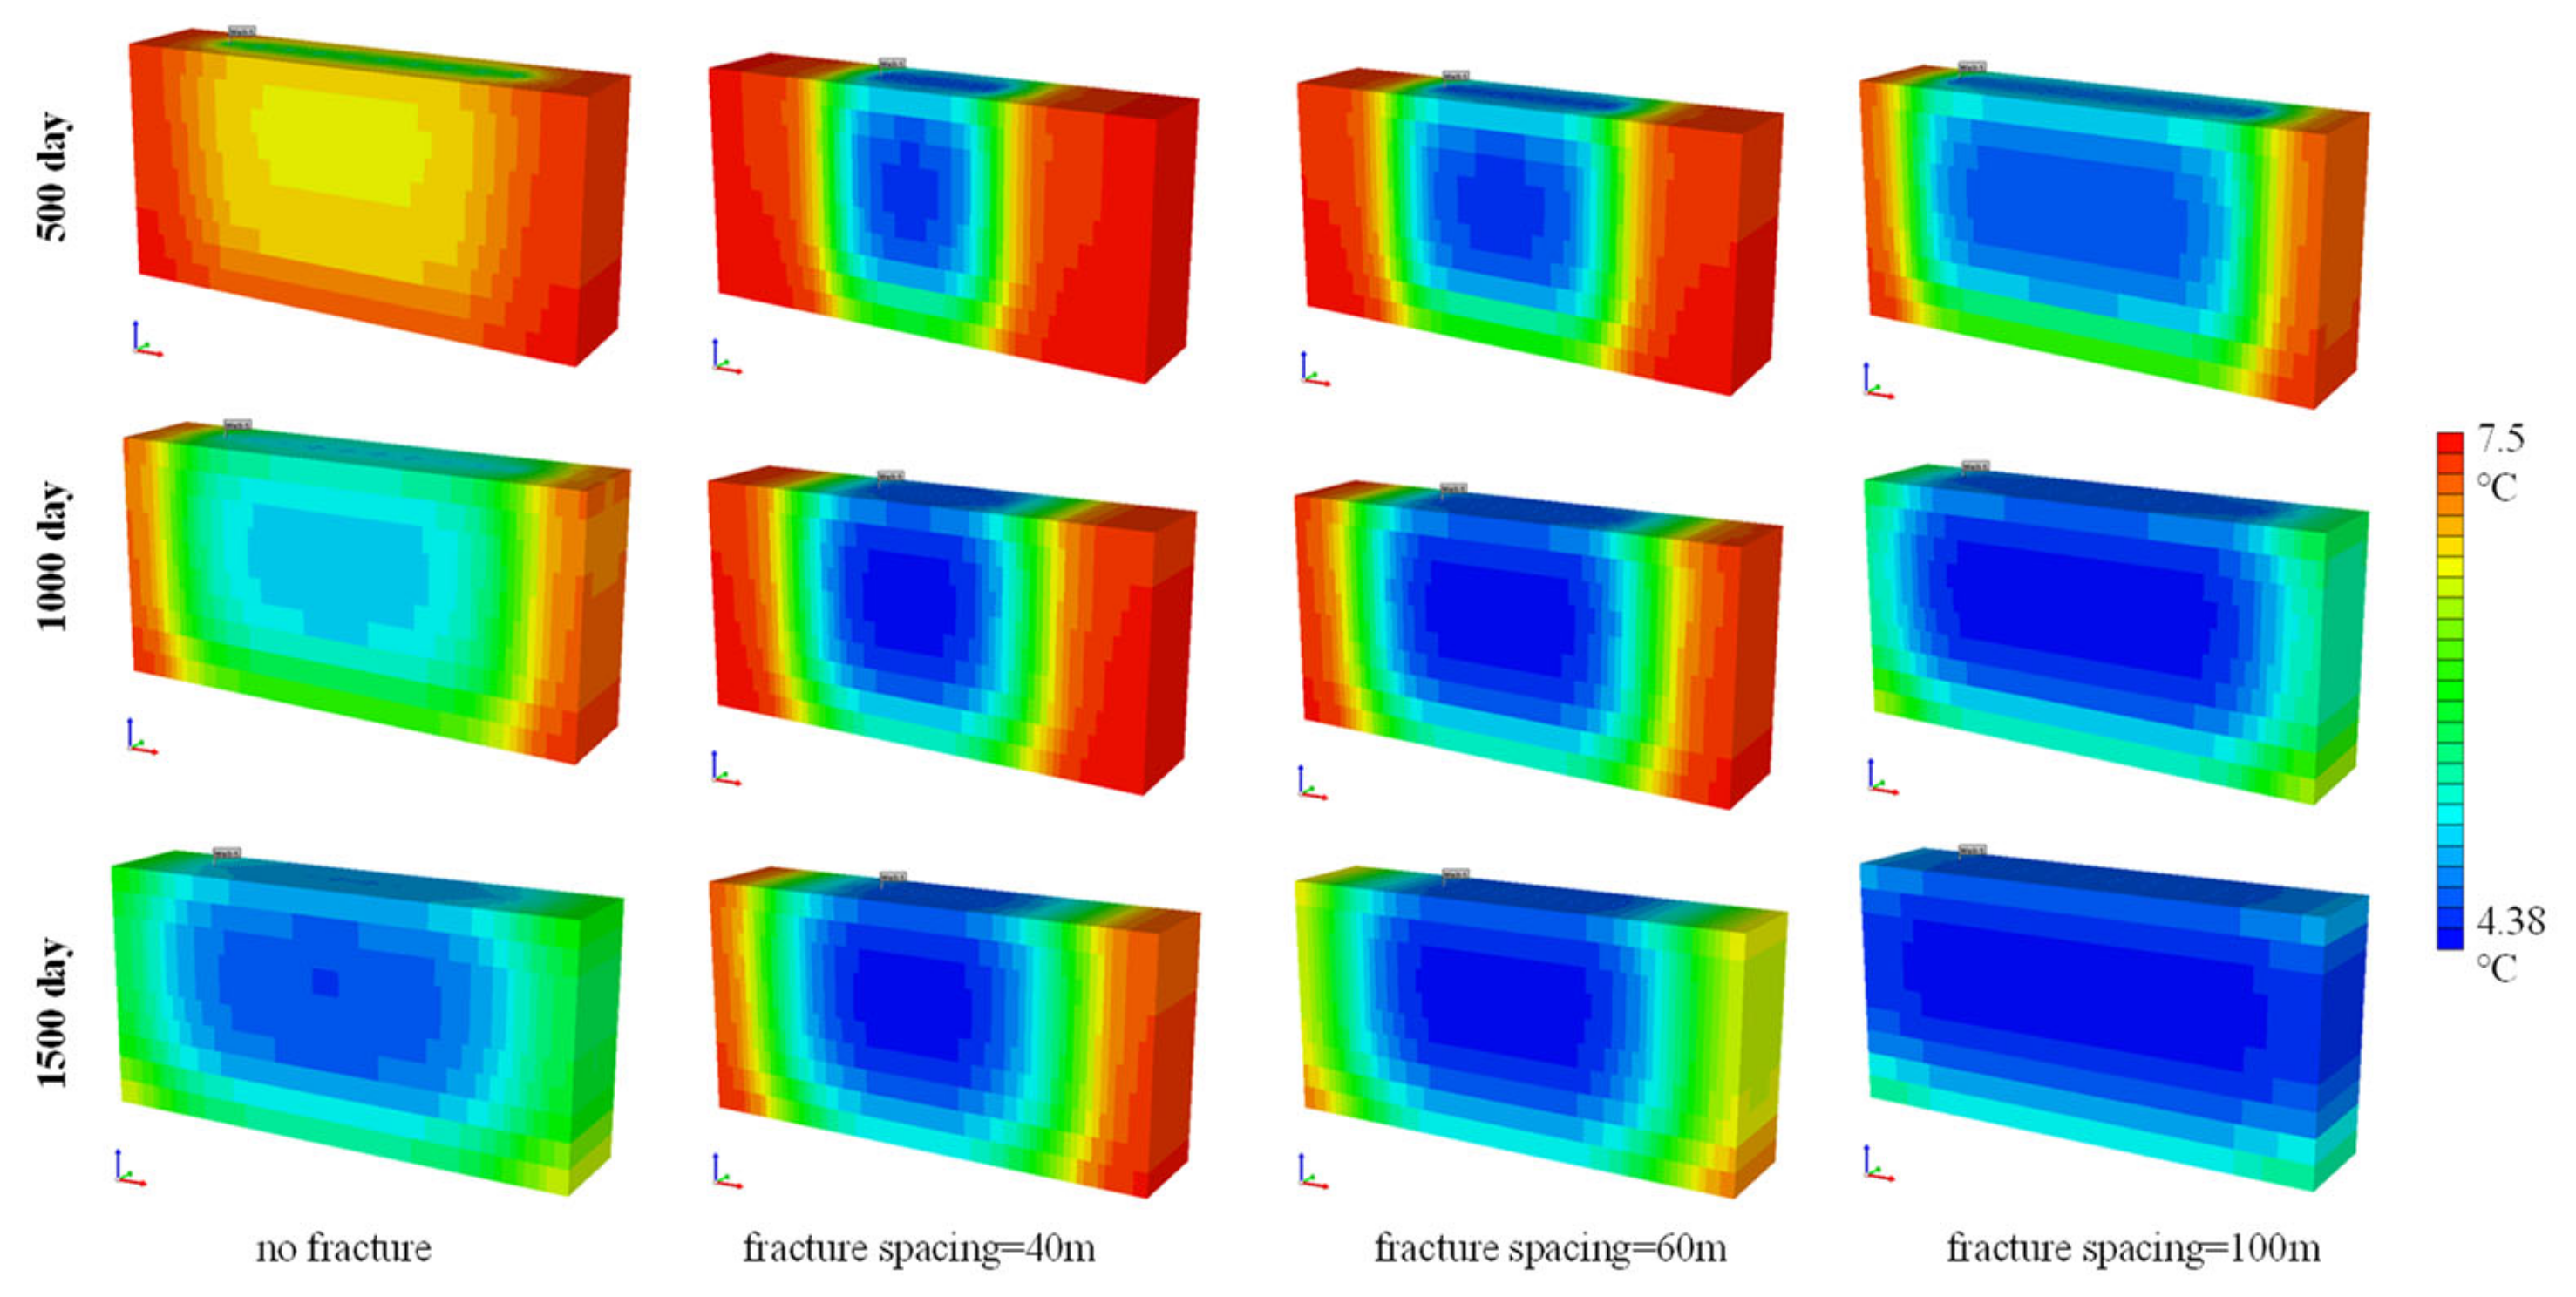
From Figure 14, Figure 15 and Figure 16, we can see that in the early production period, the reservoir pressure decreases rapidly around the wellbore and fracture. When fracture spacing is equal to 100 m, the pressure and temperature drop the fastest. As a result, the hydrate decomposes rapidly. However, when the fracture spacing is short, the area affected by the fracture is correspondingly reduced. When the fracture spacing is 40 m and 60 m, the pressure spreads slowly and the hydrate cannot be decomposed far from the fracture. Therefore, choosing the proper fracture spacing is an important factor to influence reservoir production.

4.3. Effect of Different Fracture Number

This section analyzed the effect of different fracture numbers on the production of Class II hydrate reservoirs. The number of fractures is 3, 6 and 10, respectively, with a fracture length of 100 m, dimensionless fracture conductivity of 10 and fracture spacing of 100 m.
Figure 17 shows the gas production under the influence of different fracture numbers. The cumulative gas increases with the increase in the number of fractures. The cumulative gas production for 10 fractures is 5.10 × 10⁷ m3. The time to reach the peak daily gas production also shortens with the increase in the number of fractures. As can be found in Figure 18, from the trends of cumulative gas production and gas-water ratio, it can be found that there is a small difference between the simulation results of no fractures, three fractures and six fractures, and there are even some obvious overlapping parts. However, combining the gas production effects of 10 fractures, the cumulative gas production for 10 fractures is 5.10 × 10⁷ m3 and the cumulative water production reaches 1.20 × 10⁵ m3. It is easy to find that the number of fractures is helpful to increase production, but this effect may require a certain number of fractures to have a significant improvement. We speculate that there may be a minimum value of the number of fractures below which the production increase effect cannot be brought. This is very meaningful as a guide for practical construction, and for selected formations to be hydraulically fractured, the minimum number of fractures must be evaluated in advance in order to meet the economics of development.
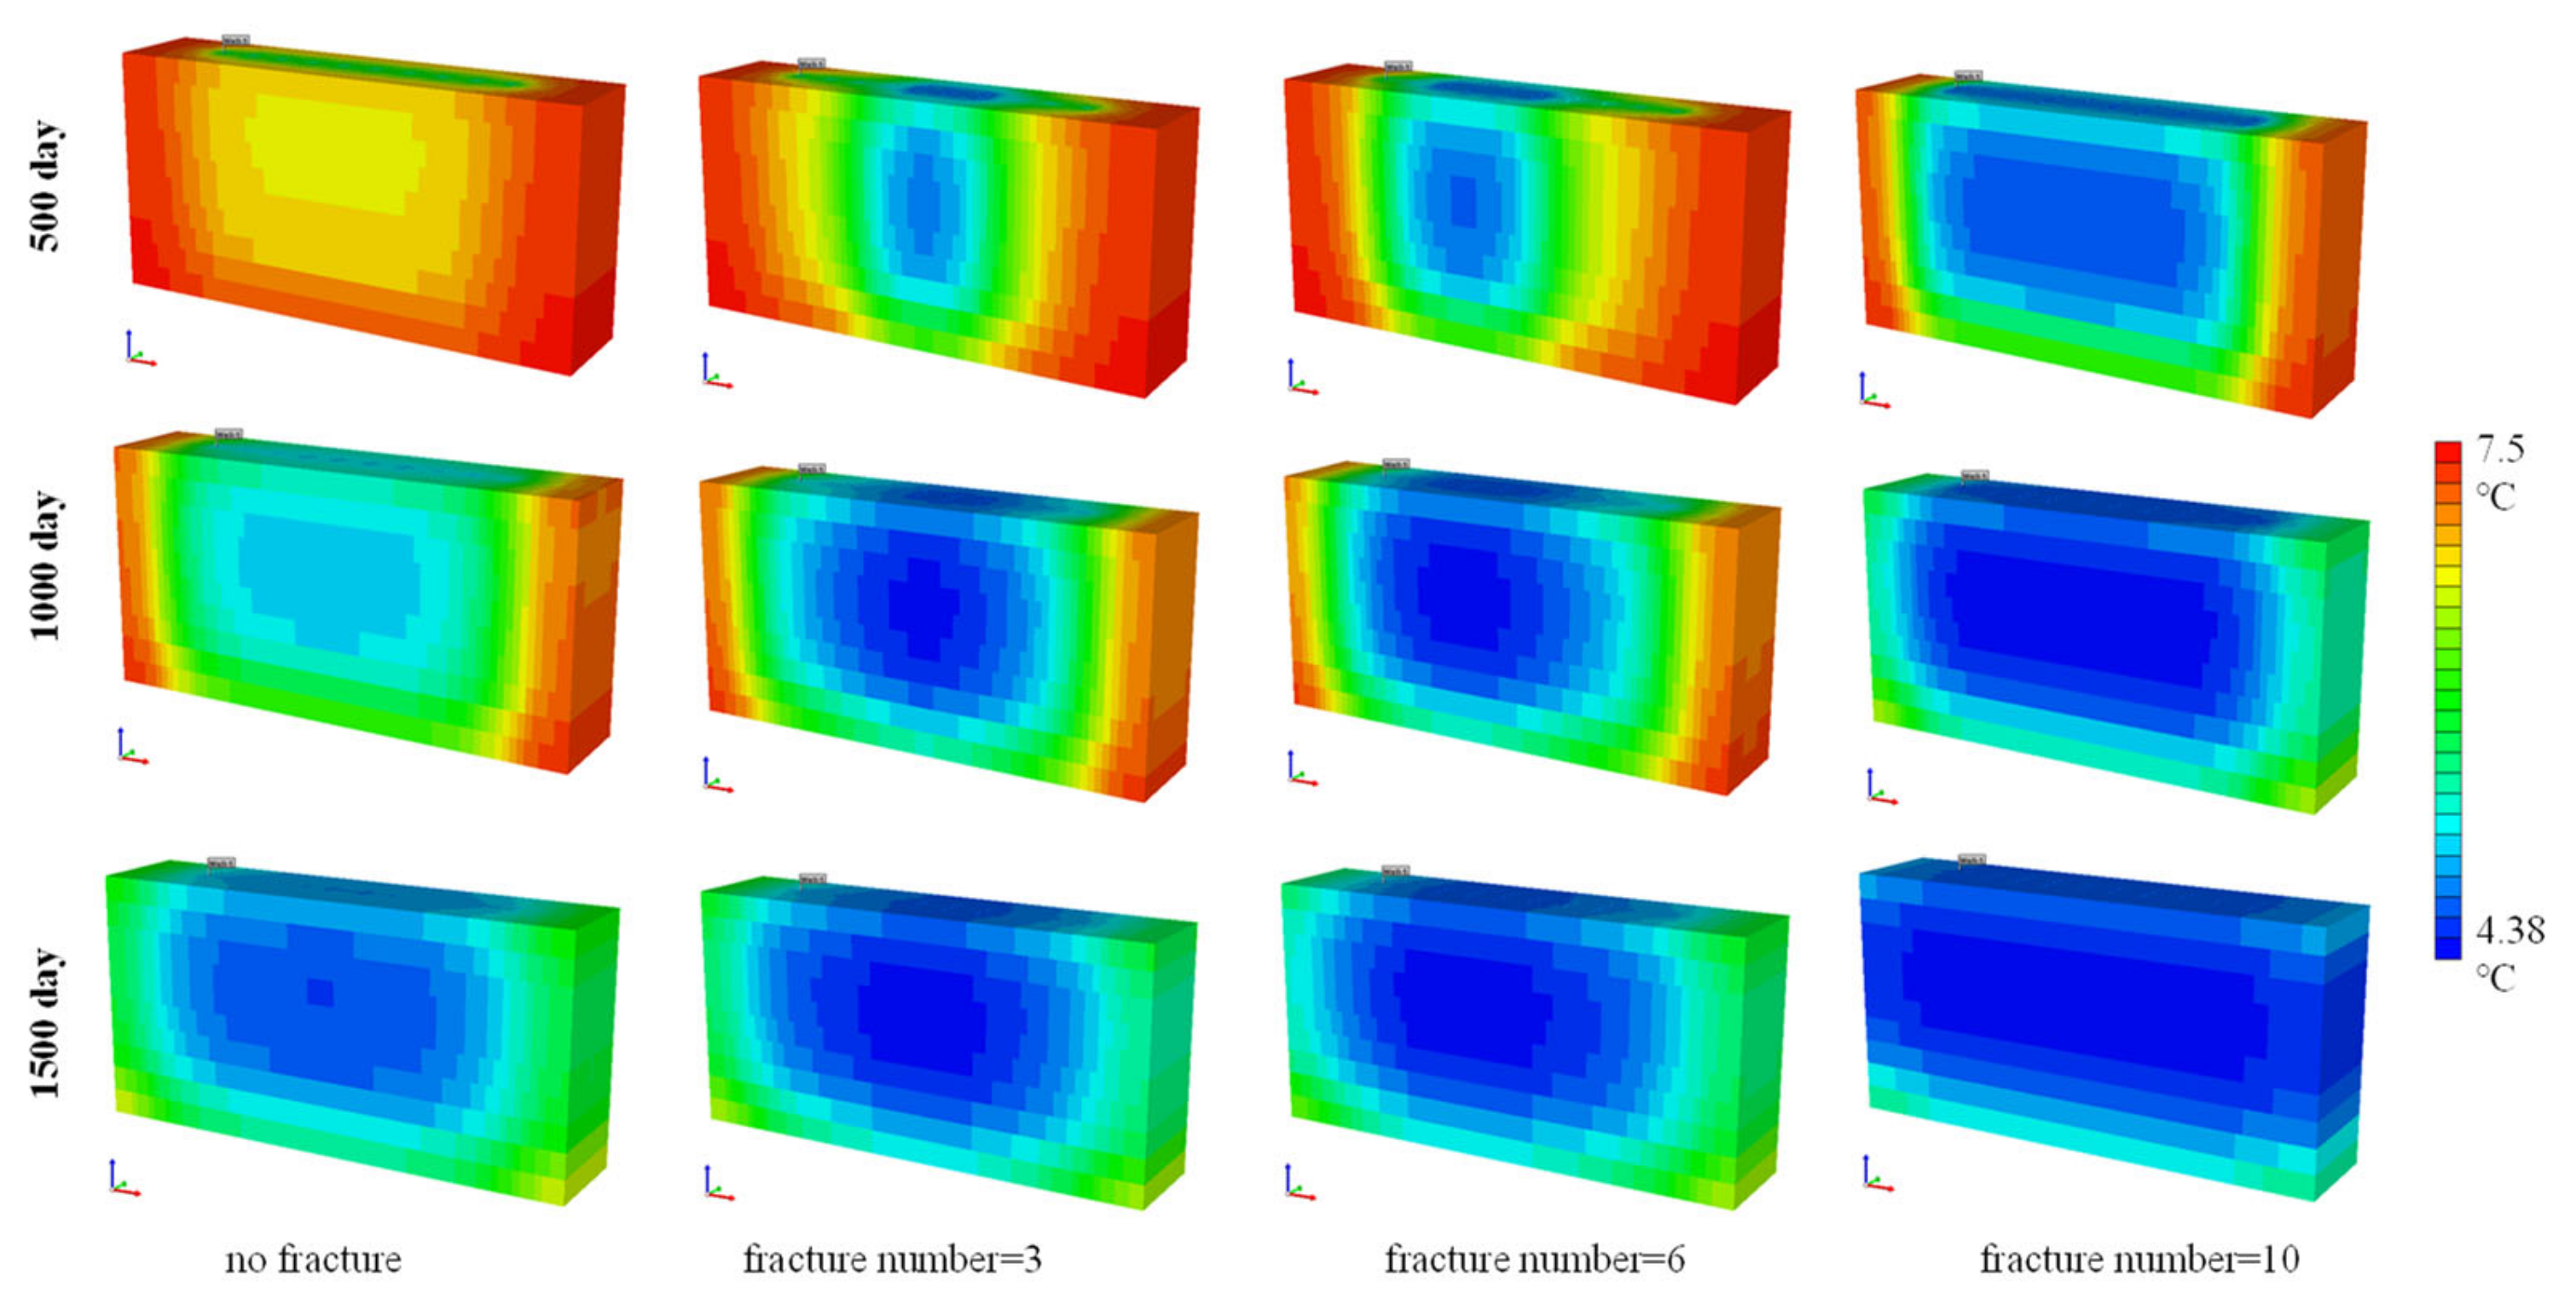
The reason for the above changes is that when more fractures exist in a reservoir, the reservoir pressure dropped faster due to the flow resistance decreasing greatly. This caused a large amount of hydrate decomposition around the production well. From Figure 19, Figure 20 and Figure 21, we can see that in the early production period, the pressure and temperature decrease rapidly around the production wells, especially around the fractures. A low-temperature and low-pressure zone appears clearly. As the production continues, the area of hydrate decomposition slowly spreads. The decomposition zone increases when the number of fractures increases.

4.4. Effect of Different Dimensionless Fracture Conductivity

This section analyzed the effect of different dimensionless fracture conductivity on gas production from Class II hydrate reservoirs. The dimensionless fracture conductivity is set as 0.1, 1 and 10, respectively, the fracture length is 100 m, fracture spacing is 100 m and the fracture number is 10.
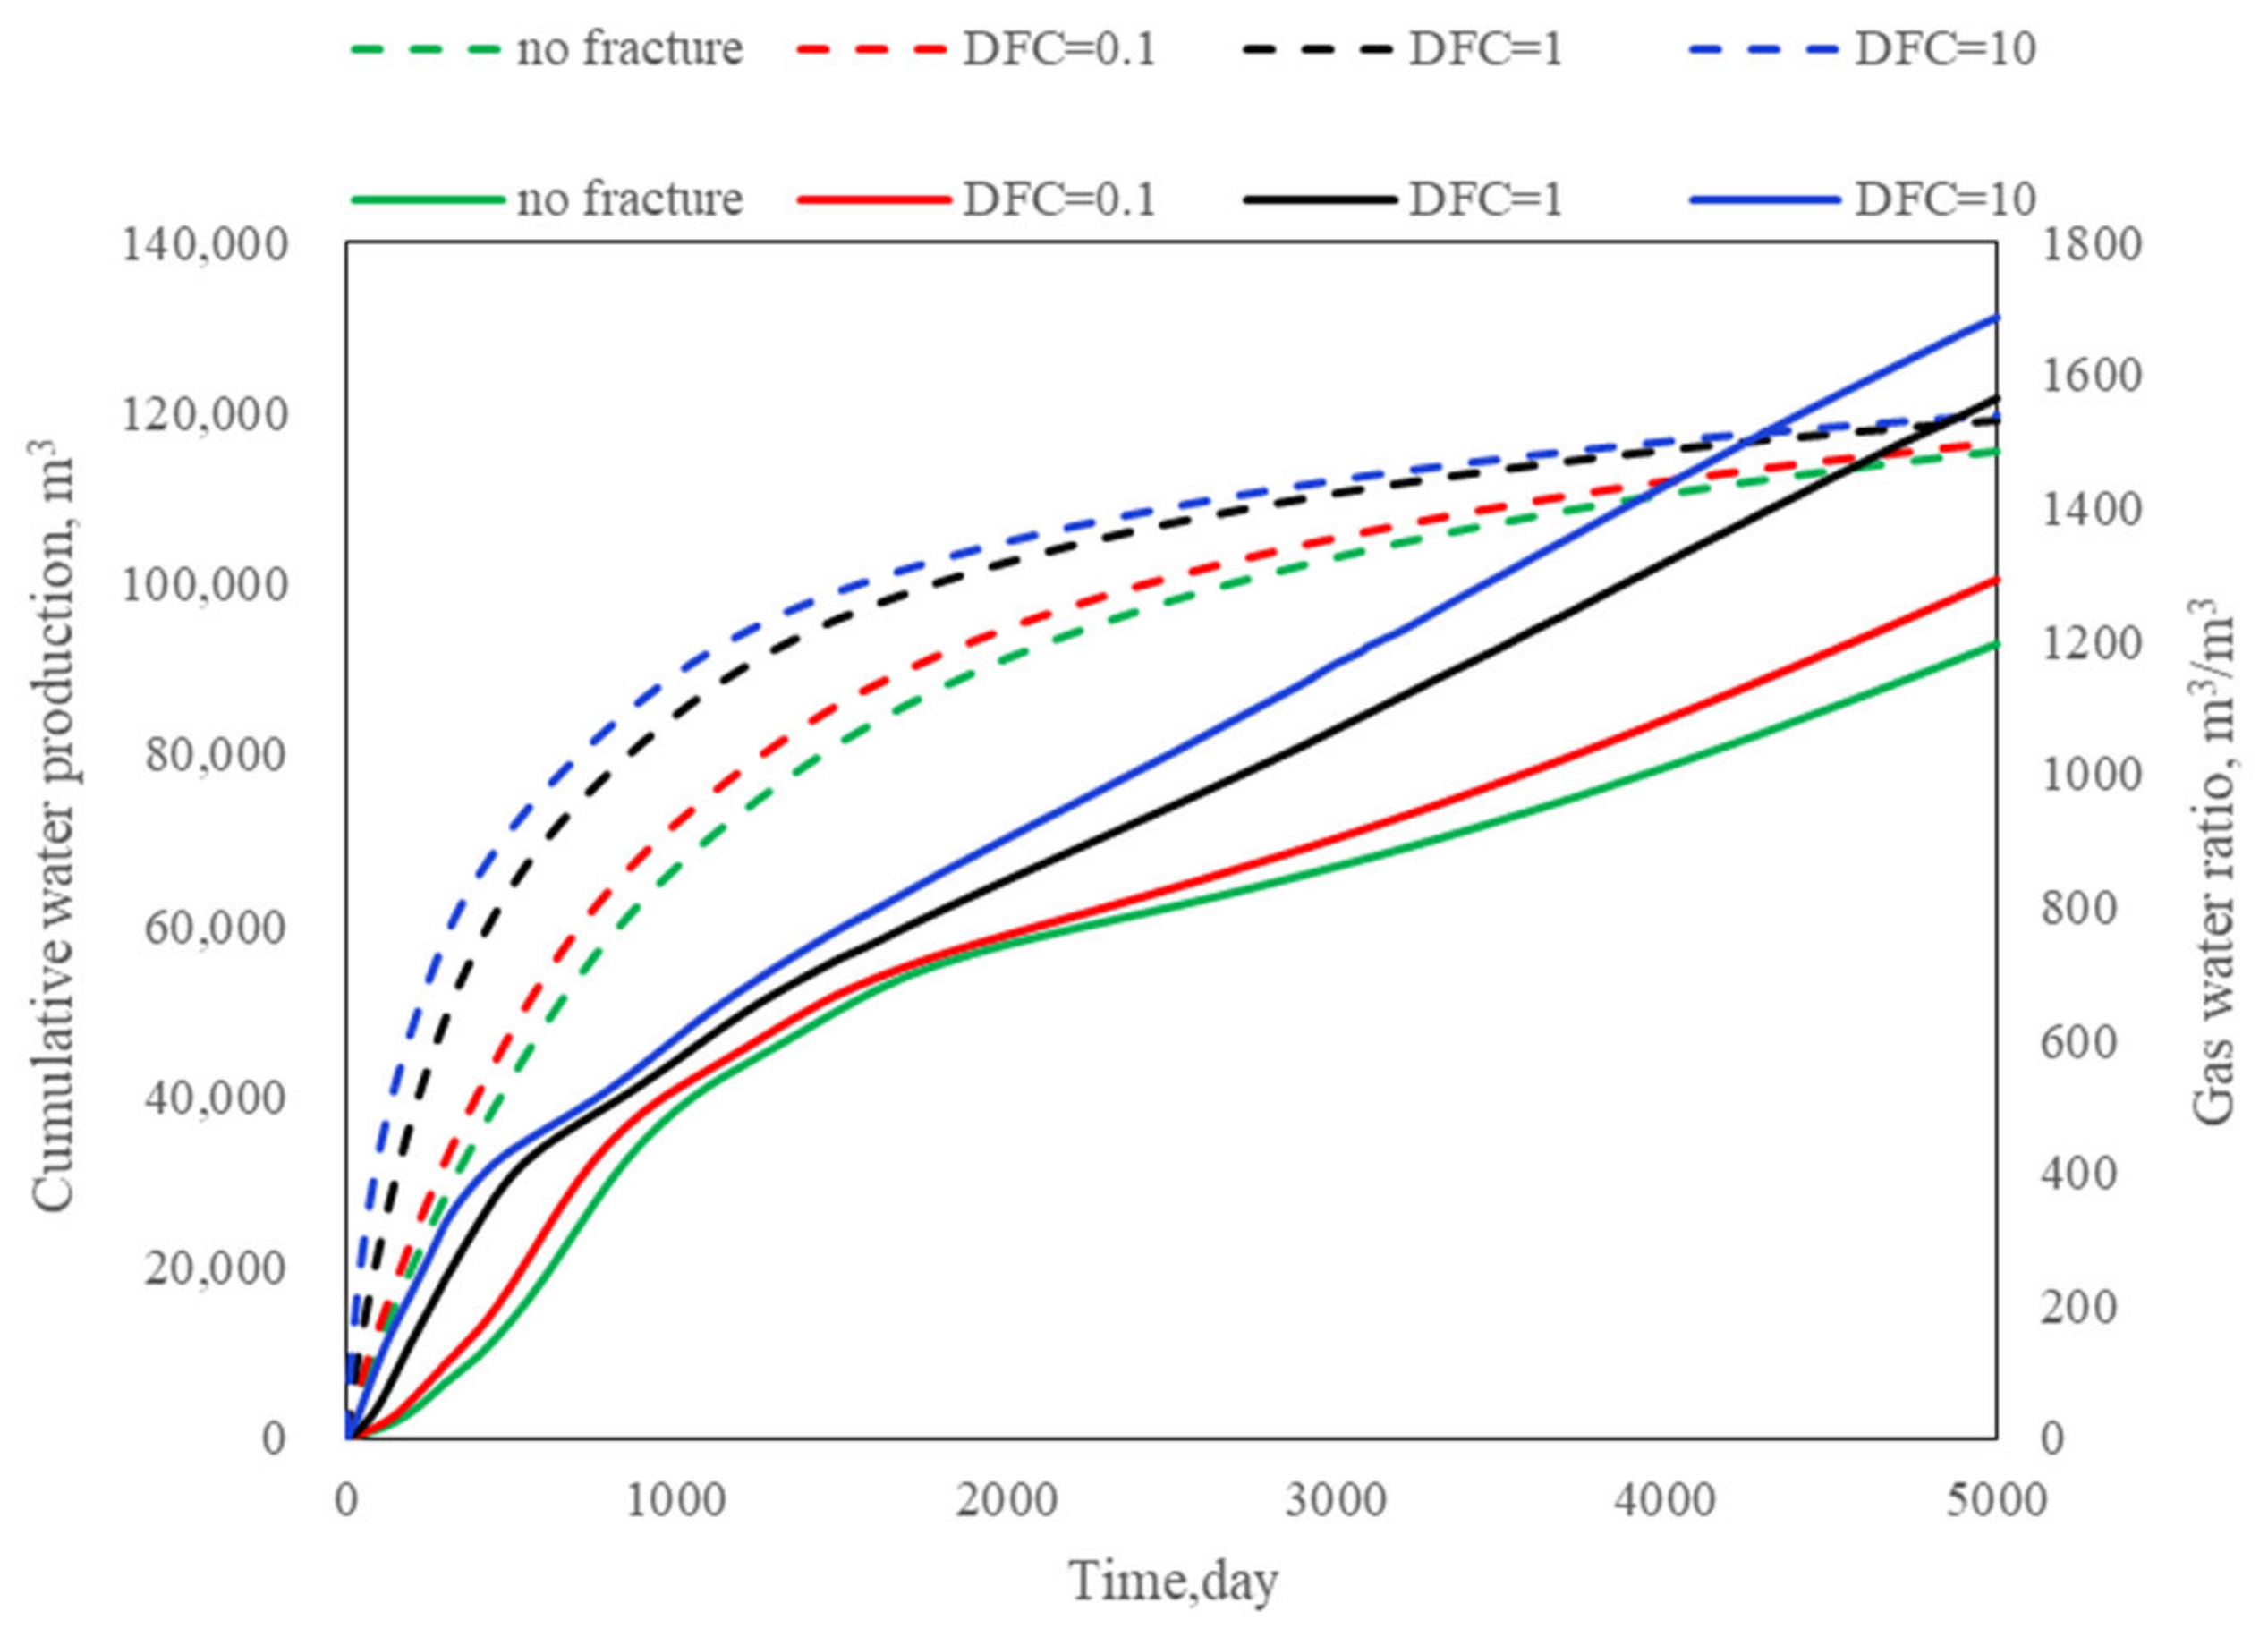
Figure 22 shows the results of gas production with the effect of different dimensionless fracture conductivity. The gas production increases with the increase in fracture conductivity, where the cumulative gas production increases from 4.86 × 10⁷ m3 (without fractures) to 5.10 × 10⁷ m3 (DFC = 10); the maximum daily gas production increases from 900 days of 18,663.41 m3/day (without fractures) to 300 days of 30,155.98 m3/day (DFC = 10). The time to peak is gradually reduced. However, the increase in gas production from 0.1 to 1 is greater than that from 1 to 10, which is also reflected in the variation of cumulative water production in Figure 23. This indicates that there is a limit to the impact of increasing the fracture conductivity to a constant value, this is consistent with the findings of Zhong et al. [47] and Feng et al. [24].
Based on Figure 24, Figure 25 and Figure 26, it can also be seen that hydraulic fracturing has a huge effect on increasing the production of Class II reservoirs. When the dimensionless fracture conductivity value is 10, the pressure around the fracture region drops faster to 4000 kPa in the early production period, which in turn makes the pressure spread faster. It can be seen that at 1500 days, the higher the fracture conductivity, the lower the hydrate saturation in the late production period, which means more hydrate decomposition. This also proves that fracture conductivity is an important factor for gas production.

4.5. Effect of Different Fracture Length

This section analyzed the effect of different fracture lengths on gas production from Class II hydrate reservoirs. The fracture lengths are set as 20 m, 60 m and 100 m, respectively. The fracture spacing is 100 m. The fracture number is 10. The dimensionless fracture conductivity is 10.
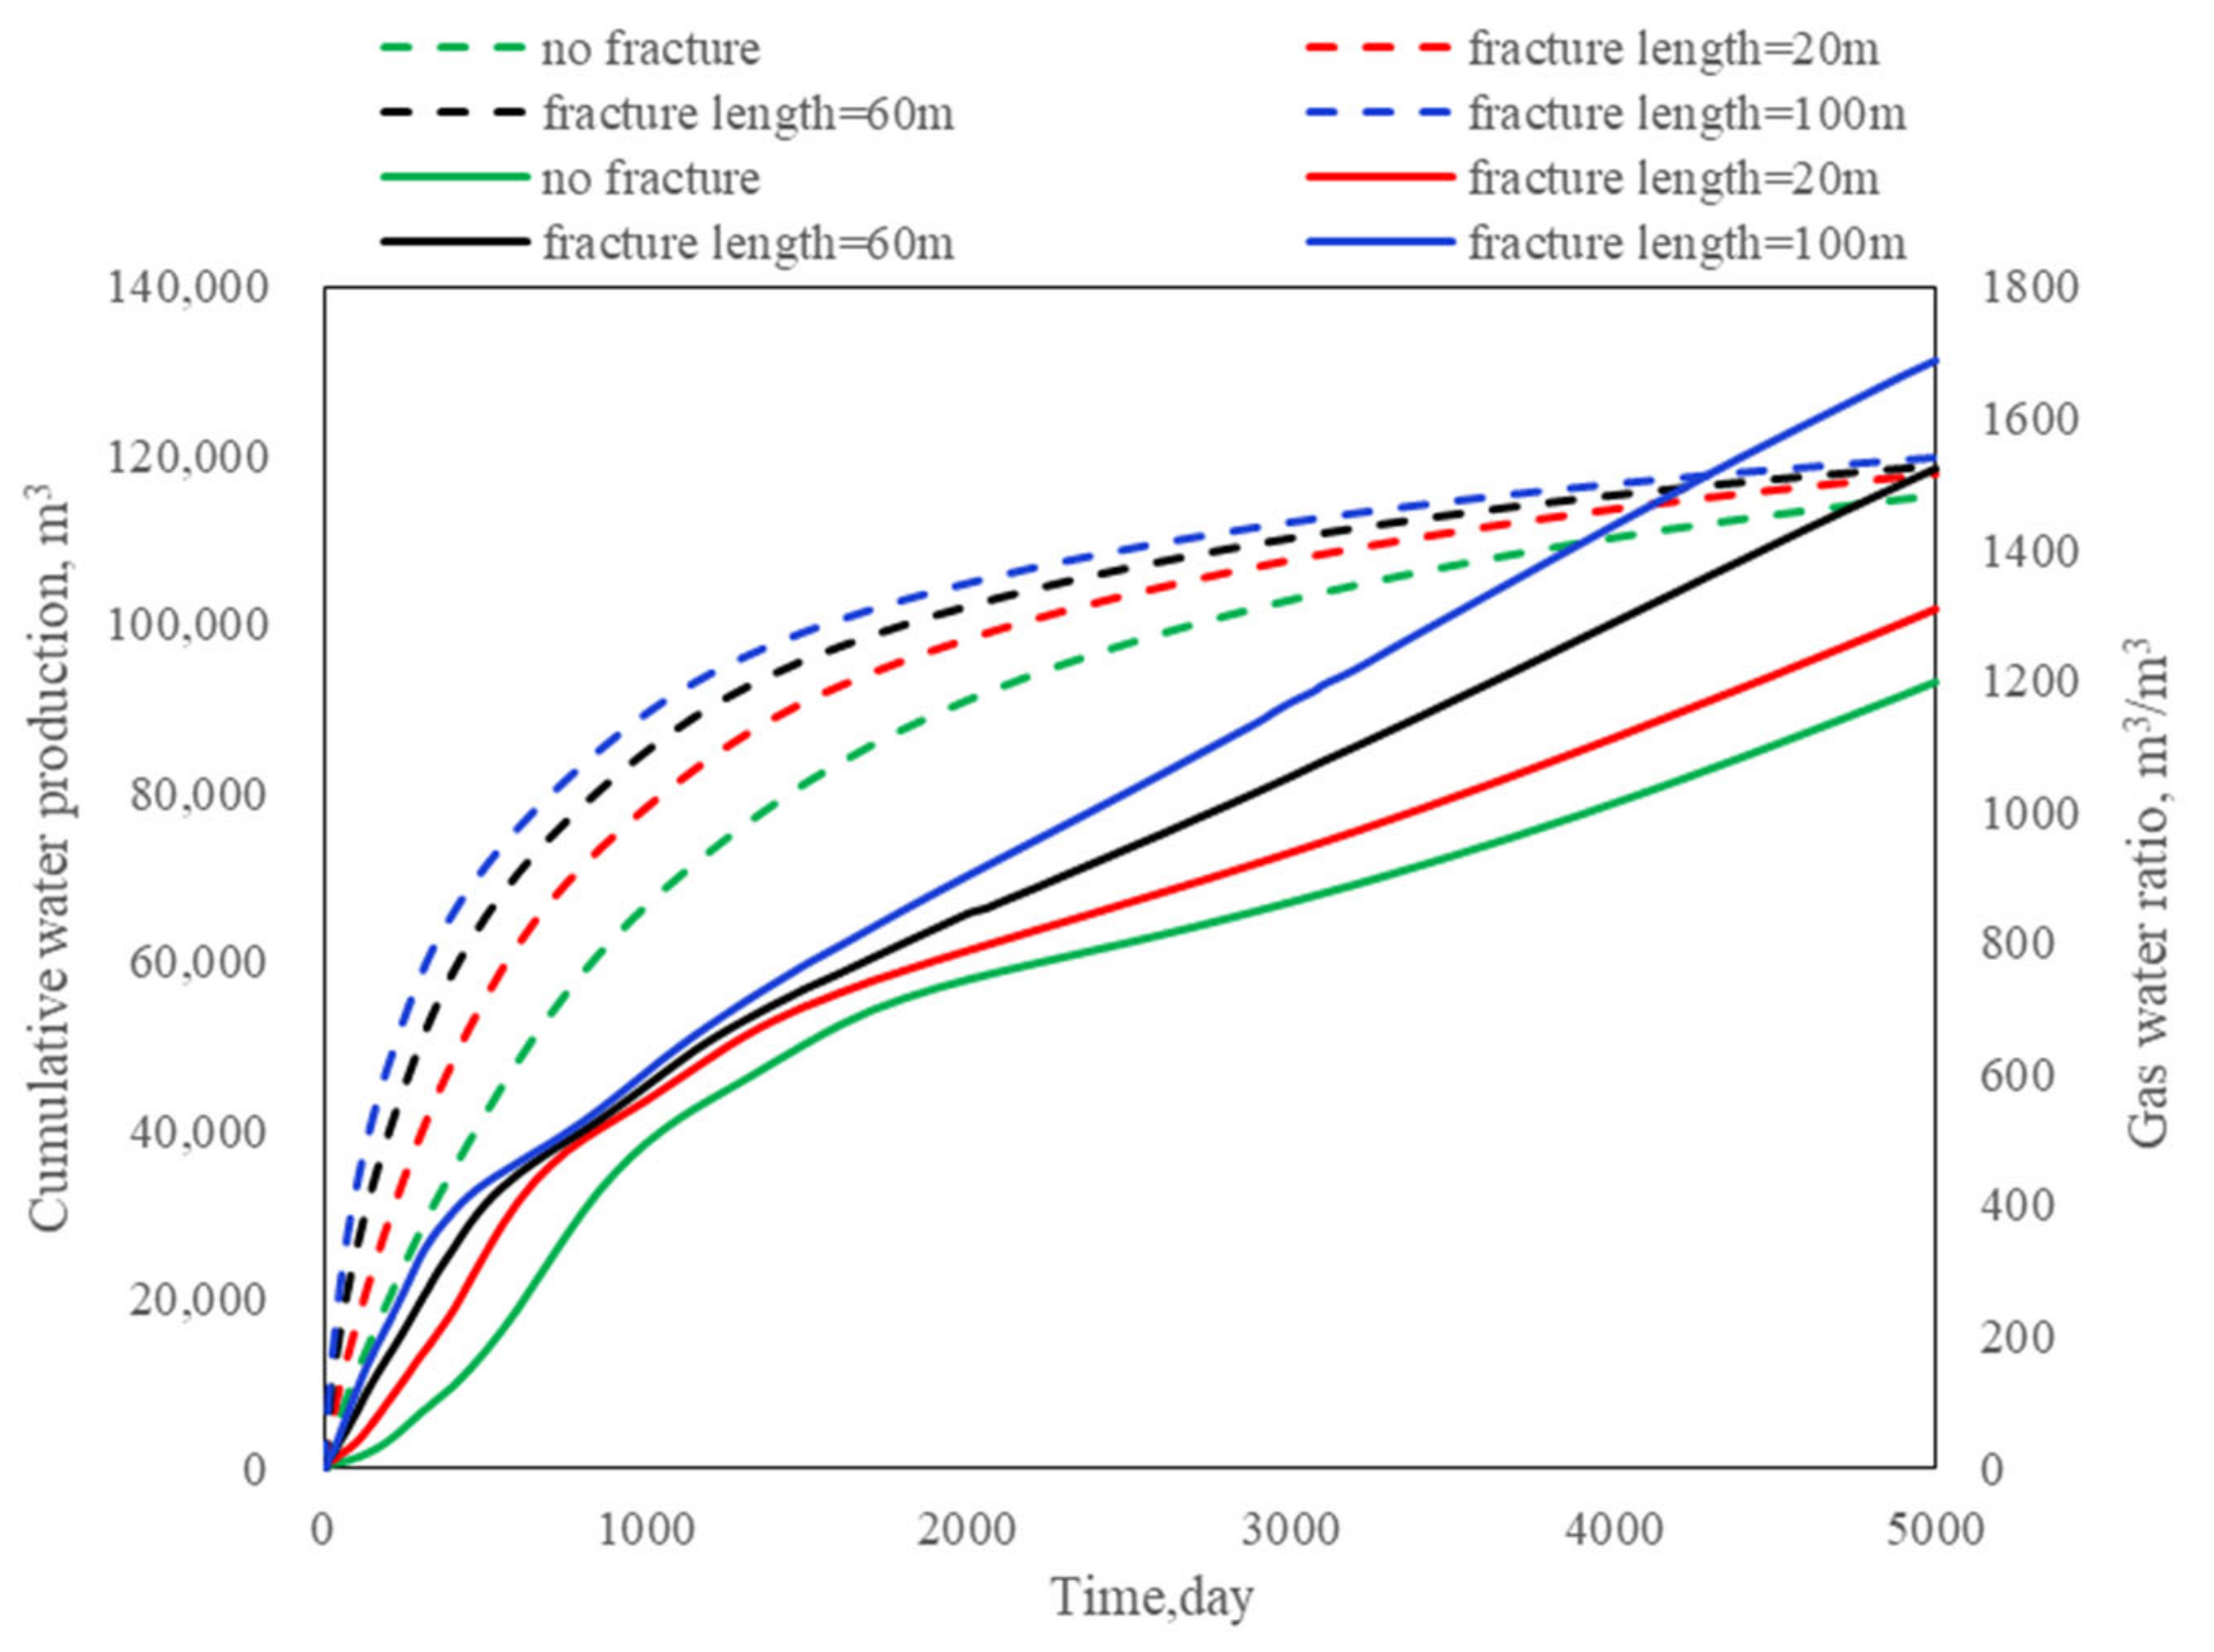
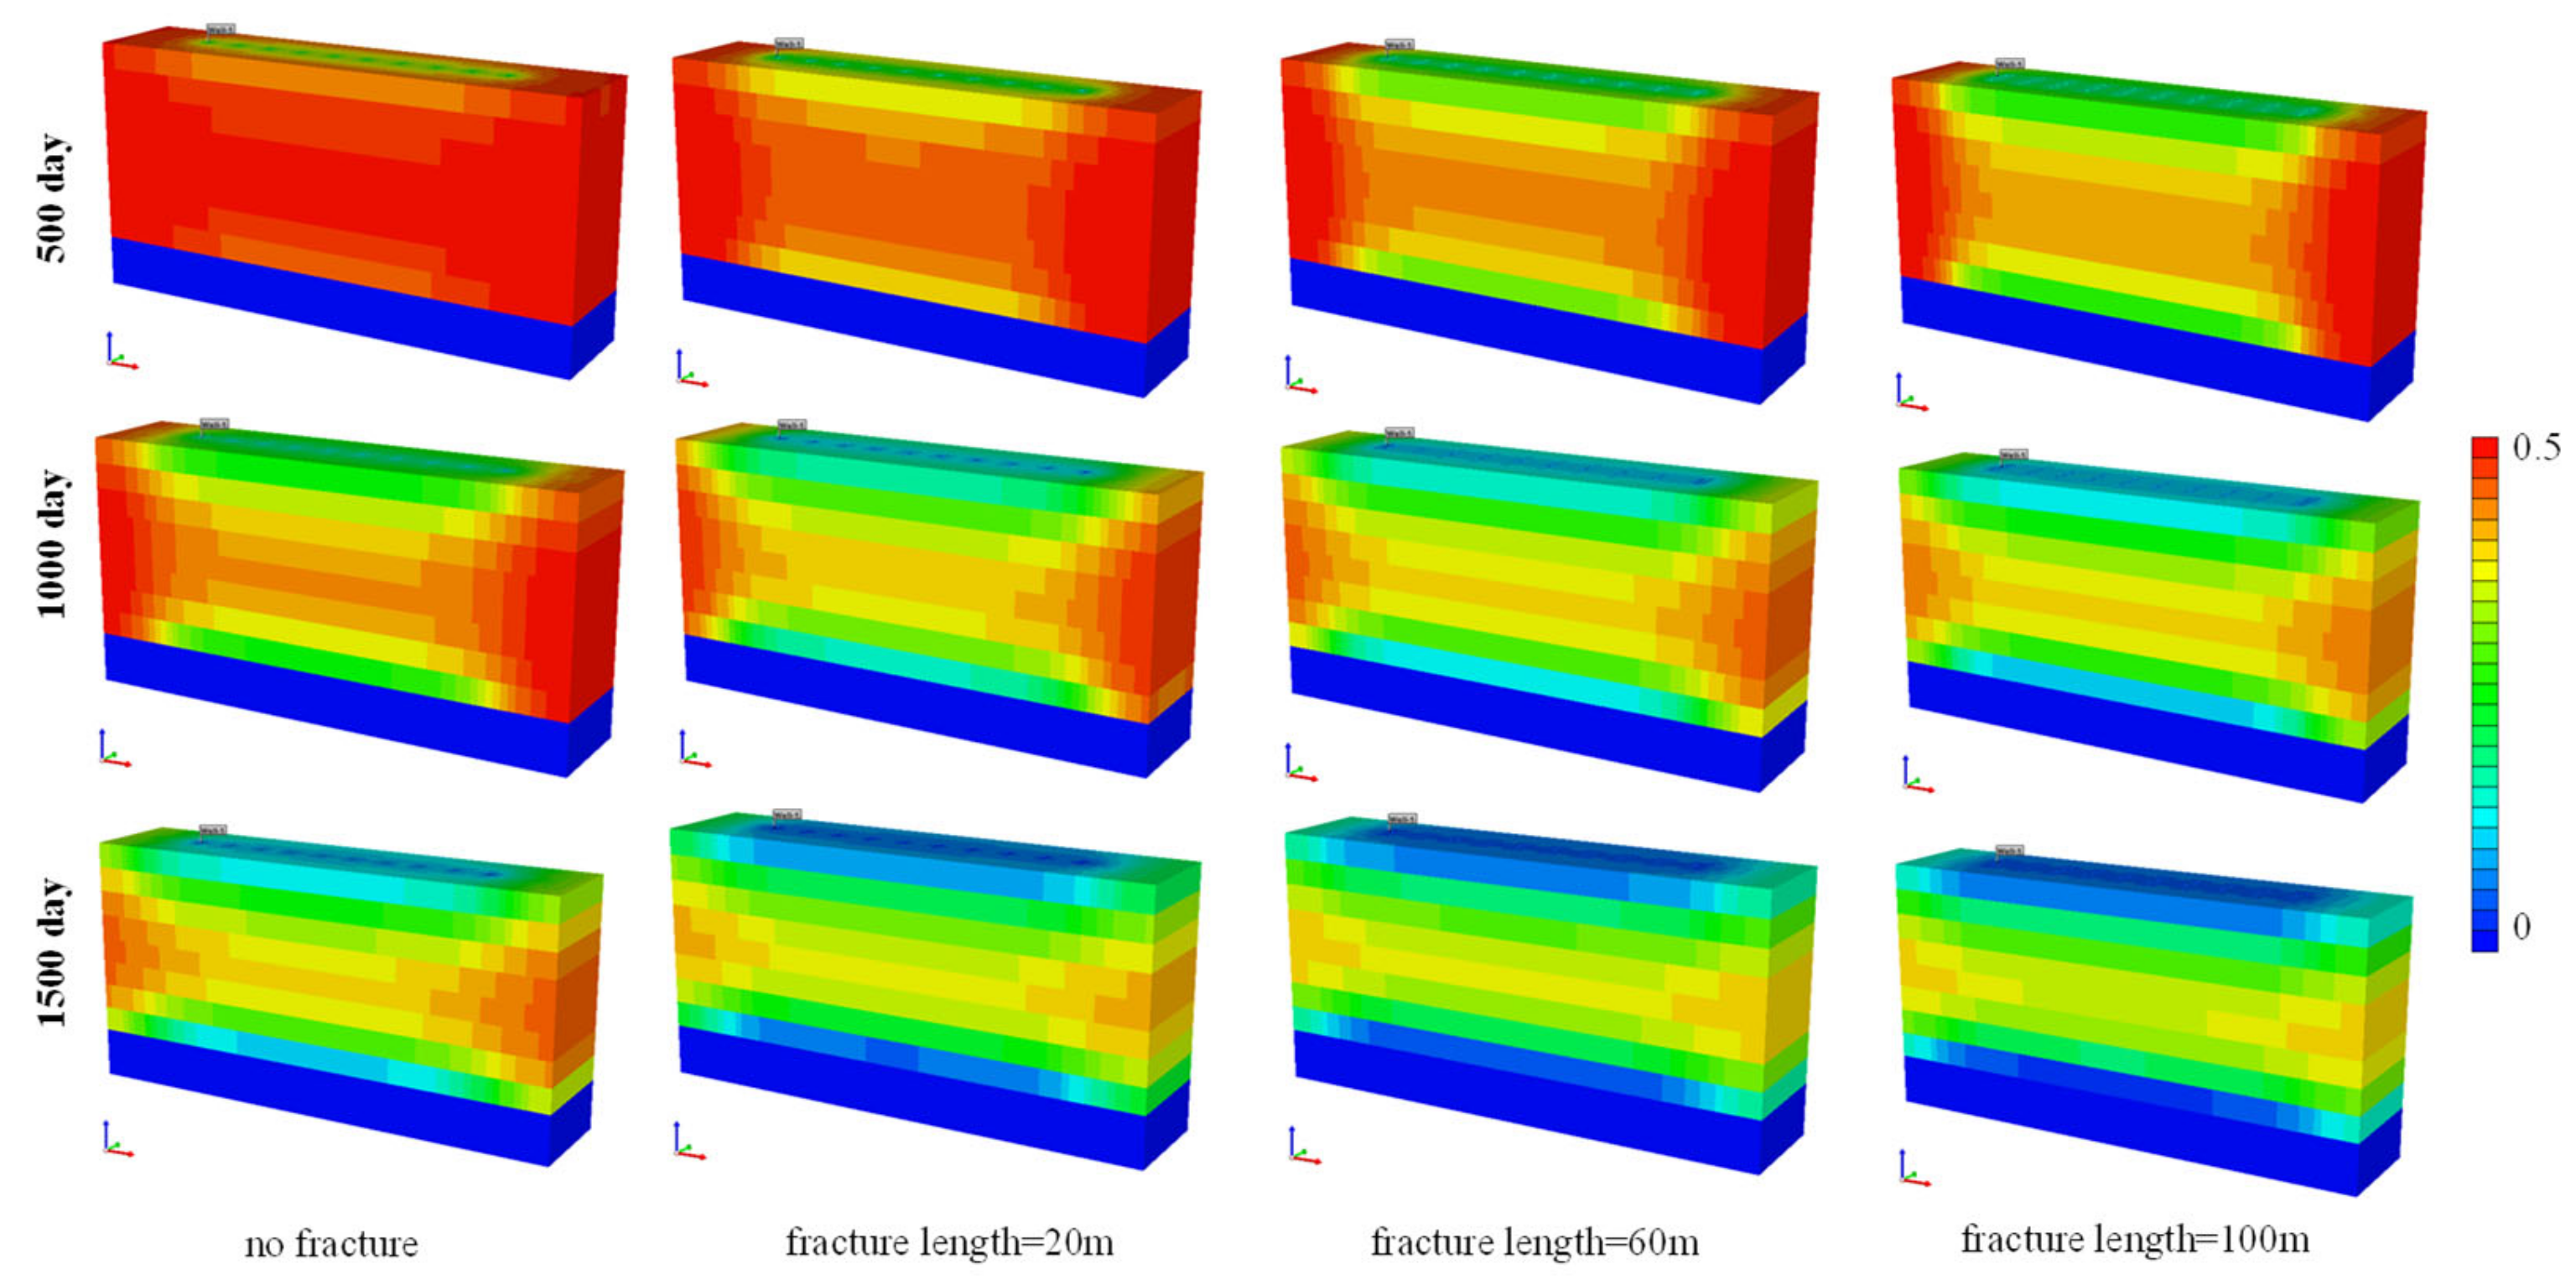
Figure 27 shows the comparison of gas production for Class II hydrate reservoirs with different fracture lengths. Compared with the case without fracture, the multistage fractured horizontal wells have a significant effect on the gas production increase in the Class II reservoir. Meanwhile, the gas production increases with the increase inf fracture length, and the cumulative gas production increases from 5.02 × 10⁷ m3 (fracture length 20 m) to 5.10 × 10⁷ m3 (fracture length 100 m). The daily gas production shortened from 550 days to reach the maximum value of 24,124.35 m3/day to 300 days to reach the maximum value of 30155.95 m3/day. And from the change of the curve shown in Figure 28, it can be seen that the enhancement of the gas-to-water ratio remains uniform in every 40 m increase in the fracture length, which is due to the fact that the fracture length affects the contact area between the fracture and the reservoir. More hydrate will be dissociated at an early stage when the fracture length increases.
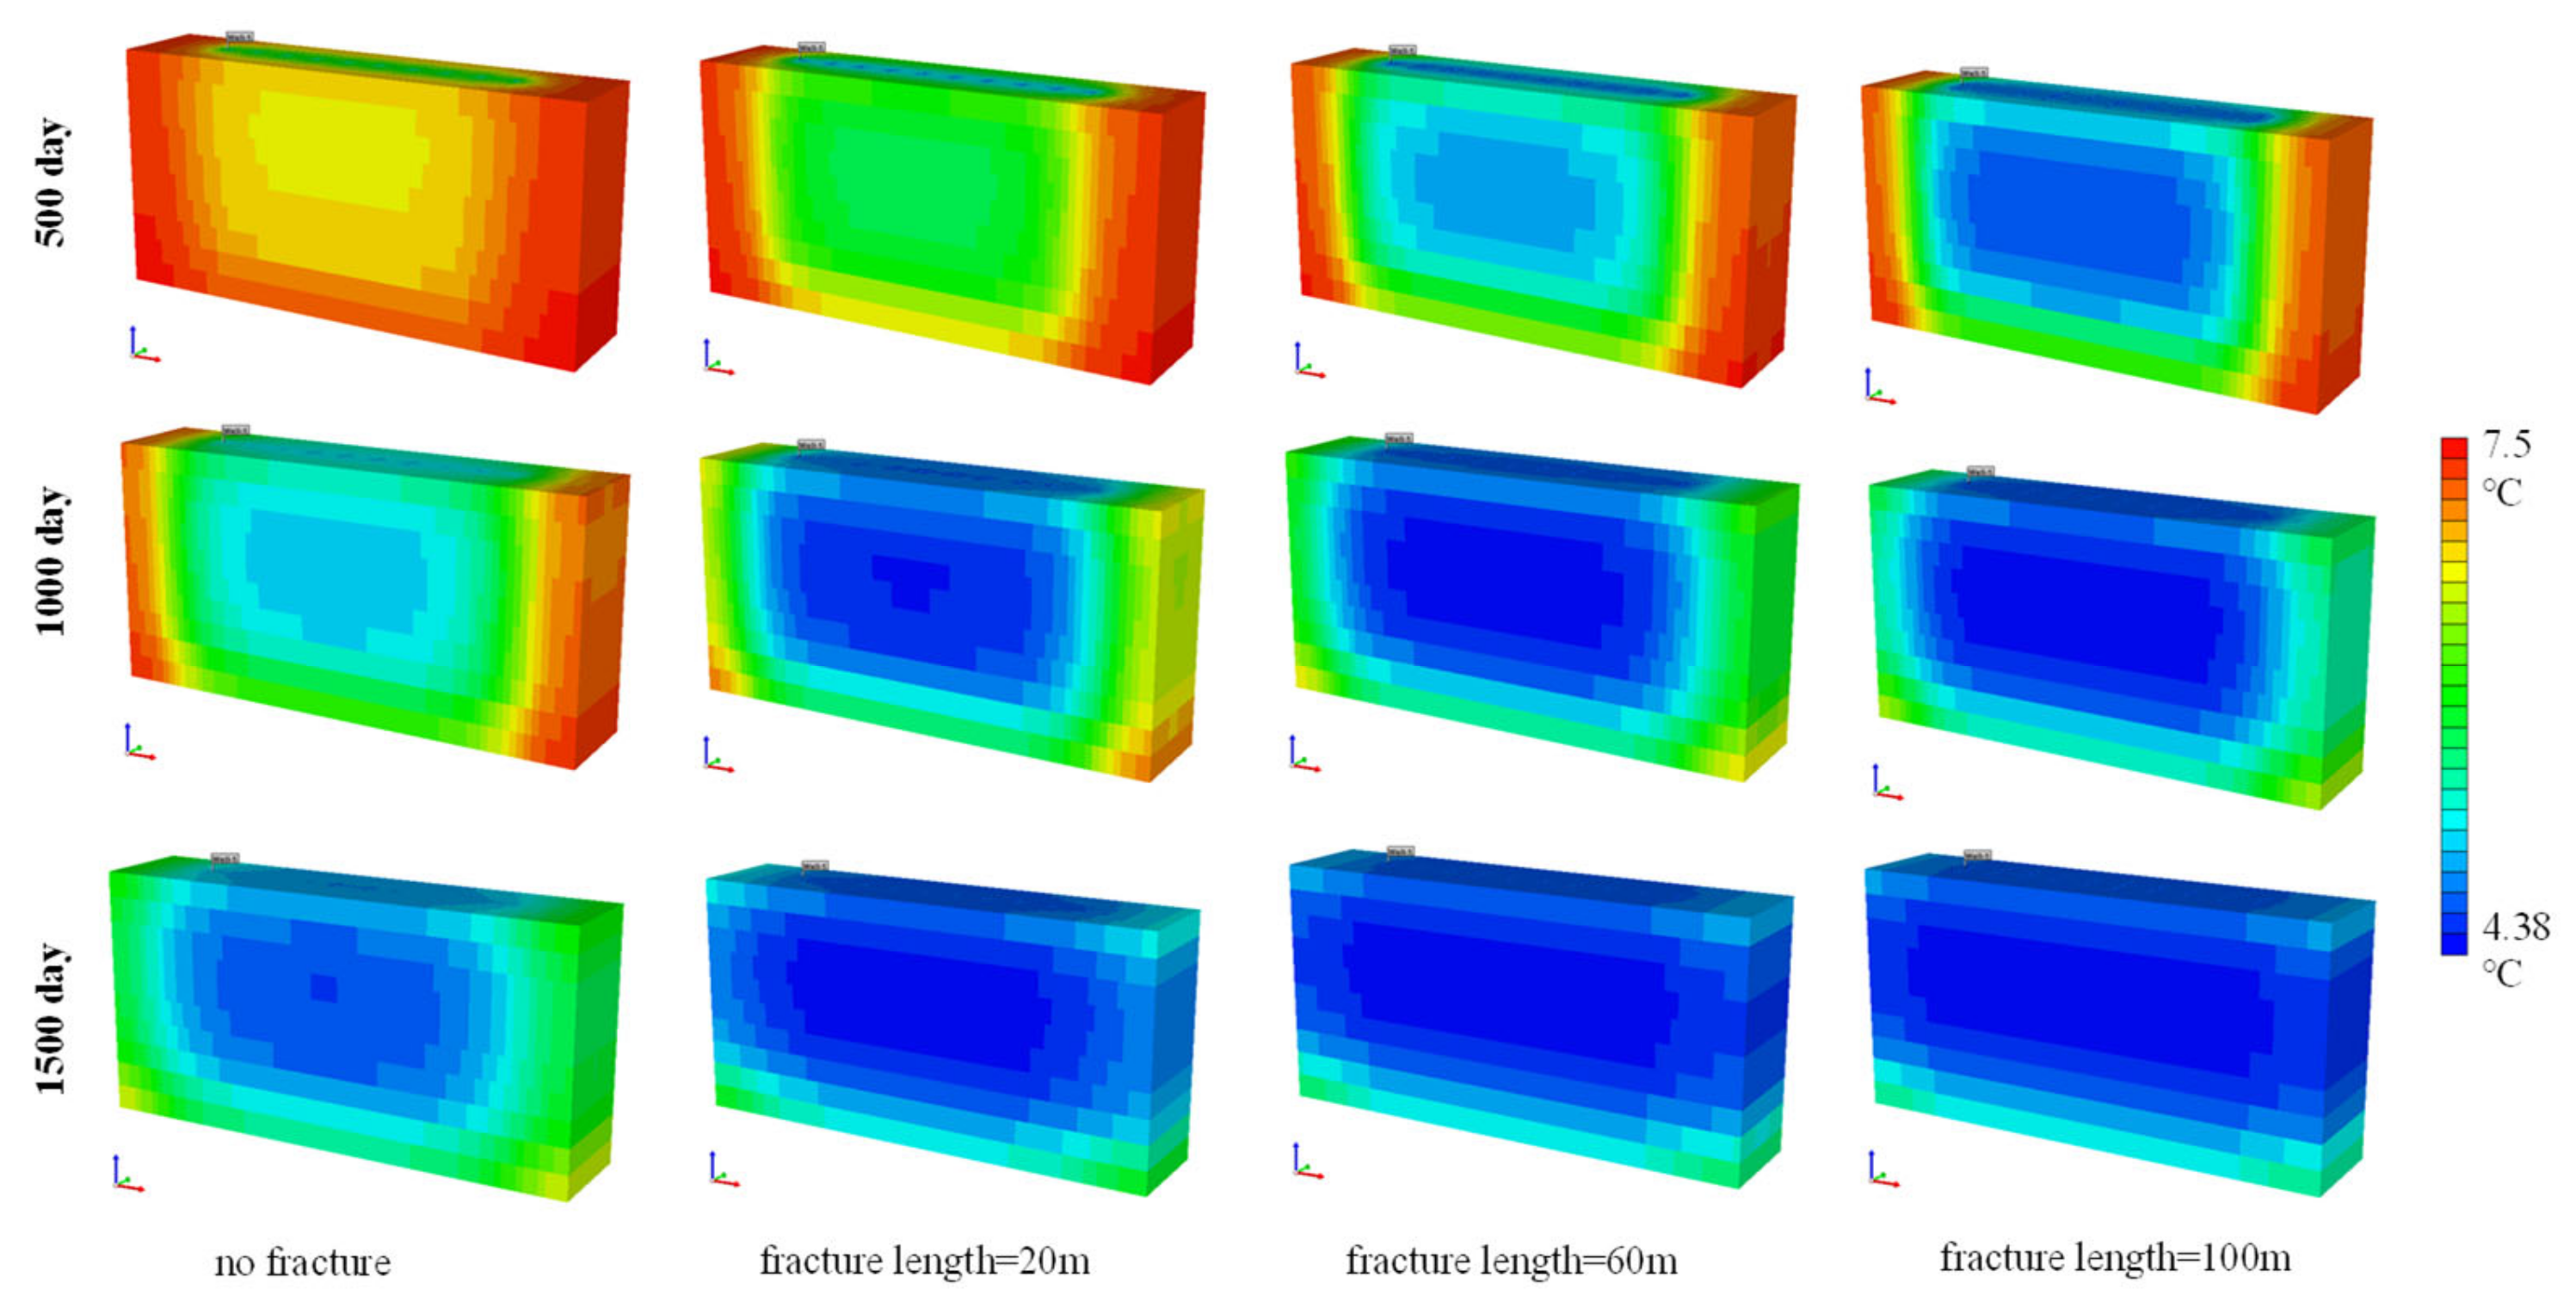
Figure 29, Figure 30 and Figure 31 show the characteristics of the variation of temperature, pressure and hydrate saturation. As the fracture length increases, the decomposition area increases accordingly. Figure 29 through Figure 31 better explain these characteristics by the variation in temperature, pressure and hydrate saturation. In Class II reservoirs, hydrate decomposition in the production well and fracture area is preferred during production and spreads outward in a roughly “elliptical” trend. As the fracture length increases, the area of the “ellipse” increases accordingly, and the area where hydrates can be rapidly decomposed in the early stage is expanded. However, the effect of fracture length on yield is relatively small compared to the effect of fracture-free conductivity in the previous section. This is similar to the results of one of our previous studies on the fracture length of vertical wells [44].

5. Conclusions

In this study, we proposed a production enhancement method of multistage fractured horizontal wells to exploit Class II hydrate reservoirs. In order to evaluate the production enhancement effect of this method, we compared the gas production effect of four types of production methods, including a single vertical well, a vertical fractured well, a horizontal well, and a multistage fractured horizontal well, respectively, through numerical simulation. Meanwhile, we also simulated the gas production behavior of a Class II hydrate reservoir under the different conditions of fracture spacing, fracture number, fracture conductivity, and fracture length. From the concept numerical simulation model analysis, it indicates that the multistage fractured horizontal well shows great potential in the development of gas hydrate reservoirs. Some conclusions were drawn:
(1)
The increase in production from hydraulic fracturing is substantial for both vertical wells and horizontal wells. Furthermore, horizontal well production also produces more gas than single vertical well production. The multistage fractured horizontal well is very effective in increasing the early production rate.
(2)
Proper fracture spacing can bring a good production increase. The wider-spaced fractures can bring a considerable increase in production, which shows that the choice of fracture location has an impact on hydrate exploitation. The fractures improve the seepage environment and increase the water production at the same time, but if the spacing is too small, the gas production will be inhibited and the gas-water ratio will be inferior to that in the case without fractures.
(3)
The number of fractures is helpful to increase production, but this effect may require a certain number of fractures to have a significant increase. We speculate that there may be a minimum value for the number of fractures, below which no production enhancement can be achieved.
(4)
Gas and water production increases with increasing fracture conductivity, with maximum daily gas production increasing from 900 days to 18,663.41 m3/day (without fractures) to 300 days to 30,155.98 m3/day (DFC = 10), and the time to peak is progressively shorter. However, there is a limit to the impact of increasing the dimensionless fracture conductivity to a constant value.
(5)
The gas production is uniformly increased with the increase in the fracture length, and the cumulative gas production increases from 5.02 × 10⁷ (fracture length 20 m) to 5.10 × 10⁷ (fracture length 100 m). Daily gas production shortened from 550 days to reach the maximum value of 24,124.35 m3/day to 300 days to reach the maximum value of 30,155.95 m3/day. The cumulative water production increased from 1.18 × 10⁵ m3 to 1.20 × 10⁵ m3.

Author Contributions

W.S.: Writing—original draft preparation. G.L.: Writing—review and editing. H.Q.: Validation, investigation. S.L.: Investigation, data curation. J.X.: Conceptualization, Methodology. All authors have read and agreed to the published version of the manuscript.

Funding

This work was supported by Key Laboratory of Gas Hydrate, Guangzhou Institute of Energy Conversion, Chinese Academy of Sciences (No. Y907ki1001), and National Natural Science Foundation of China (51991365).

Data Availability Statement

The data used to support the findings of this study are available from the corresponding author upon request.

Conflicts of Interest

The authors declare that they have no conflict of interest.

References

  1. Yin, Z.; Linga, P. Methane hydrates: A future clean energy resource. Chin. J. Chem. Eng. 2019, 27, 2026–2036. [Google Scholar] [CrossRef]
  2. Collett, T.; Bahk, J.-J.; Baker, R.; Boswell, R.; Divins, D.; Frye, M.; Goldberg, D.; Husebø, J.; Koh, C.; Malone, M.; et al. Methane Hydrates in Nature—Current Knowledge and Challenges. J. Chem. Eng. Data 2015, 60, 319–329. [Google Scholar] [CrossRef]
  3. Cheng, F.; Wu, Z.; Sun, X.; Shen, S.; Wu, P.; Liu, W.; Chen, B.; Liu, X.; Li, Y. Compression-induced dynamic change in effective permeability of hydrate-bearing sediments during hydrate dissociation by depressurization. Energy 2023, 264, 126137. [Google Scholar] [CrossRef]
  4. Wu, P.; Li, Y.; Yu, T.; Wu, Z.; Huang, L.; Wang, H.; Song, Y. Microstructure evolution and dynamic permeability anisotropy during hydrate dissociation in sediment under stress state. Energy 2023, 263, 126126. [Google Scholar] [CrossRef]
  5. Wang, H.; Wu, P.; Li, Y.; Liu, W.; Pan, X.; Li, Q.; He, Y.; Song, Y. Gas permeability variation during methane hydrate dissociation by depressurization in marine sediments. Energy 2023, 263, 125749. [Google Scholar] [CrossRef]
  6. Cai, J.; Xia, Y.; Lu, C.; Bian, H.; Zou, S. Creeping microstructure and fractal permeability model of natural gas hydrate reservoir. Mar. Pet. Geol. 2020, 115, 104282. [Google Scholar] [CrossRef]
  7. Yamamoto, K.; Dallimore, S. Aurora-JOGMEC-NRCan Mallik 2006-2008 gas hydrate research project progress. Nat. Gas Oil 2008, 304, 285–4541. [Google Scholar]
  8. Hancock, S.; Collett, T.S.; Dallimore, S.R.; Satoh, T.; Inoue, T.; Huenges, E.; Henninges, J.; Weatherill, B. Overview of thermal-stimulation production-test results for the JAPEX/JNOC/GSC et al. Mallik 5L-38 gas hydrate production research well. In Scientific Results from the Mallik 2002 Gas Hydrate Production Research Well Program, Mackenzie Delta, Northwest Territories, Canada; Geological Survey of Canada: Ottawa, ON, Canada, 2005. [Google Scholar]
  9. Schoderbek, D.; Farrell, H.; Howard, J.; Raterman, K.; Silpngarmlert, S.; Martin, K.; Bruce, S.; Perry, K. ConocoPhillips Gas Hydrate Production Test. ConocoPhillips, Co.: Houston, TX, USA, 2013. [Google Scholar]
  10. Boswell, R. Japan completes first offshore methane hydrate production test—Methane successfully produced from deepwater hydrate layers. Cent. Nat. Gas Oil 2013, 412, 386–7614. [Google Scholar]
  11. Yamamoto, K.; Wang, X.-X.; Tamaki, M.; Suzuki, K. The second offshore production of methane hydrate in the Nankai Trough and gas production behavior from a heterogeneous methane hydrate reservoir. RSC Adv. 2019, 9, 25987–26013. [Google Scholar] [CrossRef] [PubMed] [Green Version]
  12. Sun, Y.; Li, B.; Guo, W.; Lü, X.; Zhang, Y.; Li, K.; Wang, P.; Jin, G.; Jia, R.; Qu, L. Comparative analysis of the production trial and numerical simulations of gas production from multilayer hydrate deposits in the Qilian Mountain permafrost. J. Nat. Gas Sci. Eng. 2014, 21, 456–466. [Google Scholar] [CrossRef]
  13. Li, J.; Ye, J.; Qin, X.; Qiu, H.J.; Wu, N.Y.; Lu, H.L.; Xie, W.W.; Lu, J.A.; Peng, F.; Xu, Z.Q.; et al. The first offshore natural gas hydrate production test in South China Sea. China Geol. 2018, 1, 5–16. [Google Scholar] [CrossRef]
  14. Li, B.; Li, G.; Li, X.; Li, Q.; Yang, B.; Zhang, Y.; Chen, Z. Gas Production from Methane Hydrate in a Pilot-Scale Hydrate Simulator Using the Huff and Puff Method by Experimental and Numerical Studies. Energy Fuels 2012, 26, 7183–7194. [Google Scholar] [CrossRef]
  15. Moridis, G.J.; Kim, J.; Reagan, M.T.; Kim, S.J. Feasibility of gas production from a gas hydrate accumulation at the UBGH2-6 site of the Ulleung basin in the Korean East Sea. J. Pet. Sci. Eng. 2013, 108, 180–210. [Google Scholar] [CrossRef]
  16. Sun, J.; Ning, F.; Li, S.; Zhang, K.; Liu, T.; Zhang, L.; Jiang, J.; Wu, N. Numerical simulation of gas production from hydrate-bearing sediments in the Shenhu area by depressurising: The effect of burden permeability. J. Unconv. Oil Gas Resour. 2015, 12, 23–33. [Google Scholar] [CrossRef]
  17. Li, Y.; Guan, G.; Wang, D.; Song, Y.; Abuliti, A. Gas production enhancement from a multilayered hydrate reservoir in the South China Sea by hydraulic fracturing. Energy Fuels 2021, 35, 12104–12118. [Google Scholar]
  18. Qin, X.; Liang, Q.; Ye, J.; Yang, L.; Qiu, H.; Xie, W.; Liang, J.; Lu, J.; Lu, C.; Lu, H.; et al. The response of temperature and pressure of hydrate reservoirs in the first gas hydrate production test in South China Sea. Appl. Energy 2020, 278, 115649. [Google Scholar] [CrossRef]
  19. Konno, Y.; Jin, Y.; Yoneda, J.; Uchiumi, T.; Shinjou, K.; Nagao, J. Hydraulic fracturing in methane-hydrate-bearing sand. RSC Adv. 2016, 6, 73148–73155. [Google Scholar] [CrossRef] [Green Version]
  20. Too, J.L.; Cheng, A.; Khoo, B.C.; Palmer, A.; Linga, P. Hydraulic fracturing in a penny-shaped crack. Part II: Testing the frackability of methane hydrate-bearing sand. J. Nat. Gas Sci. Eng. 2018, 52, 619–628. [Google Scholar] [CrossRef]
  21. Ito, T.; Igarashi, A.; Yamamoto, K. Laboratory experiments of hydraulic fracturing in unconsolidated sands. J. MMIJ 2011, 127, 243–248. [Google Scholar] [CrossRef] [Green Version]
  22. Chen, C.; Yang, L.; Jia, R.; Sun, Y.; Guo, W.; Chen, Y.; Li, X. Simulation Study on the Effect of Fracturing Technology on the Production Efficiency of Natural Gas Hydrate. Energies 2017, 10, 1241. [Google Scholar] [CrossRef] [Green Version]
  23. Feng, Y.; Chen, L.; Suzuki, A.; Kogawa, T.; Okajima, J.; Komiya, A.; Maruyama, S. Enhancement of gas production from methane hydrate reservoirs by the combination of hydraulic fracturing and depressurization method. Energy Convers. Manag. 2019, 184, 194–204. [Google Scholar] [CrossRef]
  24. Feng, Y.; Chen, L.; Kanda, Y.; Suzuki, A.; Komiya, A.; Maruyama, S. Numerical analysis of gas production from large-scale methane hydrate sediments with fractures. Energy 2021, 236, 121485. [Google Scholar] [CrossRef]
  25. Zhao, J.; Xu, L.; Guo, X.; Li, Q.; Lv, X.; Fan, Q.; Zhao, J.; Dong, H.; Wang, B.; Yang, L. Enhancing the gas production efficiency of depressurization-induced methane hydrate exploitation via fracturing. Fuel 2021, 288, 119740. [Google Scholar] [CrossRef]
  26. Liu, X.; Zhang, W.; Qu, Z.; Guo, T.; Sun, Y.; Rabiei, M.; Cao, Q. Feasibility evaluation of hydraulic fracturing in hydrate-bearing sediments based on analytic hierarchy process-entropy method (AHP-EM). J. Nat. Gas Sci. Eng. 2020, 81, 103434. [Google Scholar] [CrossRef]
  27. Chong, Z.R.; Zhao, J.; Chan JH, R.; Yin, Z.; Linga, P. Effect of horizontal wellbore on the production behavior from marine hydrate bearing sediment. Appl. Energy 2018, 214, 117–130. [Google Scholar] [CrossRef]
  28. Chong, Z.R.; Yin, Z.; Zhao, J.; Linga, P. Recovering natural gas from gas hydrates using horizontal wellbore. Energy Procedia 2017, 143, 780–785. [Google Scholar] [CrossRef]
  29. Feng, J.C.; Wang, Y.; Li, X.S.; Li, G.; Zhang, Y.; Chen, Z.Y. Effect of horizontal and vertical well patterns on methane hydrate dissociation behaviors in pilot-scale hydrate simulator. Appl. Energy 2015, 145, 69–79. [Google Scholar] [CrossRef]
  30. Feng, J.C.; Wang, Y.; Li, X.S.; Li, G.; Zhang, Y.; Chen, Z.Y. Entropy generation analysis of hydrate dissociation by depressurization with horizontal well in different scales of hydrate reservoirs. Energy 2017, 125, 62–71. [Google Scholar] [CrossRef]
  31. Yang, S.; Lang, X.; Wang, Y.; Wen, Y.; Fan, S. Numerical simulation of Class 3 hydrate reservoirs exploiting using horizontal well by depressurization and thermal co-stimulation. Energy Convers. Manag. 2014, 77, 298–305. [Google Scholar] [CrossRef]
  32. Reagan, M.; Moridis, G.J.; Reagan, M.T.; Zhang, K. The Use of Horizontal Wells in Gas Production from Hydrate Accumulations; Lawrence Berkeley National Lab. (LBNL): Berkeley, CA, USA, 2008. [Google Scholar]
  33. Li, B.; Li, X.-S.; Li, G.; Chen, Z.-Y. Evaluation of gas production from Qilian Mountain permafrost hydrate deposits in two-spot horizontal well system. Cold Reg. Sci. Technol. 2015, 109, 87–98. [Google Scholar] [CrossRef]
  34. Liu, Y.; Hou, J.; Chen, Z.; Bai, Y.; Su, H.; Zhao, E.; Li, G. Enhancing hot water flooding in hydrate bearing layers through a novel staged production method. Energy 2021, 217, 119319. [Google Scholar] [CrossRef]
  35. Liu, Y.; Hou, J.; Zhao, H.; Liu, X.; Xia, Z. Numerical simulation of simultaneous exploitation of geothermal energy and natural gas hydrates by water injection into a geothermal heat exchange well. Renew. Sustain. Energy Rev. 2019, 109, 467–481. [Google Scholar] [CrossRef]
  36. Feng, Y.; Chen, L.; Suzuki, A.; Kogawa, T.; Okajima, J.; Komiya, A.; Maruyama, S. Numerical analysis of gas production from reservoir-scale methane hydrate by depressurization with a horizontal well: The effect of permeability anisotropy. Mar. Pet. Geol. 2019, 102, 817–828. [Google Scholar] [CrossRef]
  37. Ma, X.; Sun, Y.; Guo, W.; Jia, R.; Li, B. Numerical simulation of horizontal well hydraulic fracturing technology for gas production from hydrate reservoir. Appl. Ocean Res. 2021, 112, 102674. [Google Scholar] [CrossRef]
  38. Xu, J. Productivity and Development Strategy for Fractured Well in Low Permeability Reservoirs. Master’s Thesis, China University of Petroleum (East China), Qingdao, China, 2013. [Google Scholar]
  39. Uddin, M.; Coombe, D.; Wright, F. Modeling of CO2-hydrate formation in geological reservoirs by injection of CO2 gas. J. Energy Resour. Technol. 2008, 130, 032502. [Google Scholar] [CrossRef]
  40. Kim, H.C.; Bishnoi, P.R.; Heidemann, R.A.; Rizvi, S.S. Kinetics of methane hydrate decomposition. Chem. Eng. Sci. 1987, 42, 1645–1653. [Google Scholar] [CrossRef]
  41. Gaddipati, M. Code Comparison of Methane Hydrate Reservoir Simulators Using CMG STARS. Master’s Thesis, West Virginia University, Morgantown, WV, USA, 2008. [Google Scholar]
  42. Yin, F.; Gao, Y.; Chen, Y.; Sun, B.; Li, S.; Zhao, D. Numerical investigation on the long-term production behavior of horizontal well at the gas hydrate production site in South China Sea. Appl. Energy 2022, 311, 118603. [Google Scholar] [CrossRef]
  43. Uddin, M.; Coombe, D.; Law, D.; Gunter, B. Numerical Studies of Gas Hydrate Formation and Decomposition in a Geological Reservoir. J. Energy Resour. Technol. 2008, 130, 032501. [Google Scholar] [CrossRef]
  44. Xu, J.; Qin, H.; Li, H.; Lu, C.; Li, S.; Wu, D. Enhanced gas production efficiency of class 1, 2, 3 hydrate reservoirs using hydraulic fracturing technique. Energy 2023, 263, 126003. [Google Scholar] [CrossRef]
  45. Li, S.; Li, S.; Zheng, R.; Li, Q.; Pang, W. Strategies for gas production from Class 2 hydrate accumulations by depressurization. Fuel 2021, 286, 119380. [Google Scholar] [CrossRef]
  46. Wilder, J.W.; Moridis, G.J.; Wilson, S.J.; Kurihara, M.; White, M.D.; Masuda, Y.; Anderson, B.J.; Collett, T.S.; Hunter, R.B.; Narita, H.; et al. An international effort to compare gas hydrate reservoir simulators. In Proceedings of the 6th International Conference on Gas Hydrates, Vancouver, BC, Canada, 6–10 July 2008; pp. 1–12. [Google Scholar]
  47. Zhong, X.; Pan, D.; Zhai, L.; Zhu, Y.; Zhang, H.; Zhang, Y.; Wang, Y.; Li, X.; Chen, C. Evaluation of the gas production enhancement effect of hydraulic fracturing on combining depressurization with thermal stimulation from challenging ocean hydrate reservoirs. J. Nat. Gas Sci. Eng. 2020, 83, 103621. [Google Scholar] [CrossRef]
Figure 1. Schematic diagram of gas hydrate production by using a multistage fractured horizontal well.
Energies 16 03354 g001
Figure 2. Class II hydrate reservoirs and multi-stage fractured horizontal wells.
Energies 16 03354 g002
Figure 3. Schematic diagram of fracture setting.
Energies 16 03354 g003
Figure 4. Flow chart of simulated hydrate development.
Energies 16 03354 g004
Figure 5. Multistage fractured horizontal well numerical simulation model (Z/X aspect ratio of 70 in the physical model ).
Energies 16 03354 g005
Figure 6. Comparison chart of simulation results with different grid divisions: gas production from horizontal well production as an example.
Energies 16 03354 g006
Figure 7. Effect of different production enhancement methods on gas production in Class II reservoirs. (The solid line corresponds to the right axis of the coordinate axis, and the dashed line corresponds to the right axis).
Energies 16 03354 g007
Figure 8. Effect of different production enhancement methods on water production in Class II reservoirs. (The solid line corresponds to the right axis of the coordinate axis, and the dashed line corresponds to the right axis).
Energies 16 03354 g008
Figure 9. Schematic diagram of pressure distribution with different production enhancement methods.
Energies 16 03354 g009
Figure 10. Schematic diagram of temperature distribution with different production enhancement methods.
Energies 16 03354 g010
Figure 11. Schematic diagram of hydrate saturation distribution with different production enhancement methods.
Energies 16 03354 g011
Figure 12. Effect of different fracture spacing on gas production in Class II reservoirs. (The solid line corresponds to the right axis of the coordinate axis, and the dashed line corresponds to the right axis).
Energies 16 03354 g012
Figure 13. Effect of different fracture spacing on water production in Class II reservoirs. (The solid line corresponds to the right axis of the coordinate axis, and the dashed line corresponds to the right axis).
Energies 16 03354 g013
Figure 14. Schematic diagram of pressure distribution with different fracture spacing.
Energies 16 03354 g014
Figure 15. Schematic diagram of temperature distribution with different fracture spacing.
Energies 16 03354 g015
Figure 16. Schematic diagram of hydrate saturation distribution with different fracture spacing.
Energies 16 03354 g016
Figure 17. Effect of different fracture number on gas production in Class II reservoirs. (The solid line corresponds to the right axis of the coordinate axis, and the dashed line corresponds to the right axis).
Energies 16 03354 g017
Figure 18. Effect of different fracture number on water production in Class II reservoirs. (The solid line corresponds to the right axis of the coordinate axis, and the dashed line corresponds to the right axis).
Energies 16 03354 g018
Figure 19. Schematic diagram of pressure distribution with different fracture number.
Energies 16 03354 g019
Figure 20. Schematic diagram of temperature distribution with different fracture number.
Energies 16 03354 g020
Figure 21. Schematic diagram of hydrate saturation distribution with different fracture number.
Energies 16 03354 g021
Figure 22. Effect of different fracture conductivity on gas production in Class II reservoirs. (The solid line corresponds to the right axis of the coordinate axis, and the dashed line corresponds to the right axis).
Energies 16 03354 g022
Figure 23. Effect of different fracture conductivity on water production in Class II reservoirs. (The solid line corresponds to the right axis of the coordinate axis, and the dashed line corresponds to the right axis).
Energies 16 03354 g023
Figure 24. Schematic diagram of pressure distribution with different fracture conductivity.
Energies 16 03354 g024
Figure 25. Schematic diagram of temperature distribution with different fracture conductivity.
Energies 16 03354 g025
Figure 26. Schematic diagram of hydrate saturation distribution with different fracture conductivity.
Energies 16 03354 g026
Figure 27. Effect of different fracture length on gas production in Class II reservoirs. (The solid line corresponds to the right axis of the coordinate axis, and the dashed line corresponds to the right axis).
Energies 16 03354 g027
Figure 28. Effect of different fracture length on water production in Class II reservoirs. (The solid line corresponds to the right axis of the coordinate axis, and the dashed line corresponds to the right axis).
Energies 16 03354 g028
Figure 29. Schematic diagram of pressure distribution with different fracture length.
Energies 16 03354 g029
Figure 30. Schematic diagram of temperature distribution with different fracture length.
Energies 16 03354 g030
Figure 31. Schematic diagram of hydrate saturation distribution with different fracture length.
Energies 16 03354 g031
Table 1. Geological model parameters for Class II hydrate reservoirs.
ParameterWater ZoneHydrate Zone
Permeability/mD1010
Porosity0.210.21
Sg00
Sh00.5
Sw10.5
Thickness/m28
Initial temperature/°C7.55 (bottom layer)
Initial pressure/kPa9000 (bottom layer)
Disclaimer/Publisher’s Note: The statements, opinions and data contained in all publications are solely those of the individual author(s) and contributor(s) and not of MDPI and/or the editor(s). MDPI and/or the editor(s) disclaim responsibility for any injury to people or property resulting from any ideas, methods, instructions or products referred to in the content.