
Enhanced Gas Production from Class II Gas Hydrate Reservoirs by the Multistage Fractured Horizontal Well
Abstract
:1. Introduction
2. Mathematical Models
2.1. Kinetic Model of Hydrate Dissociation
2.2. Mass Balance Equation
2.3. Equation of Energy Conservation
2.4. The Relation between Porosity and Permeability
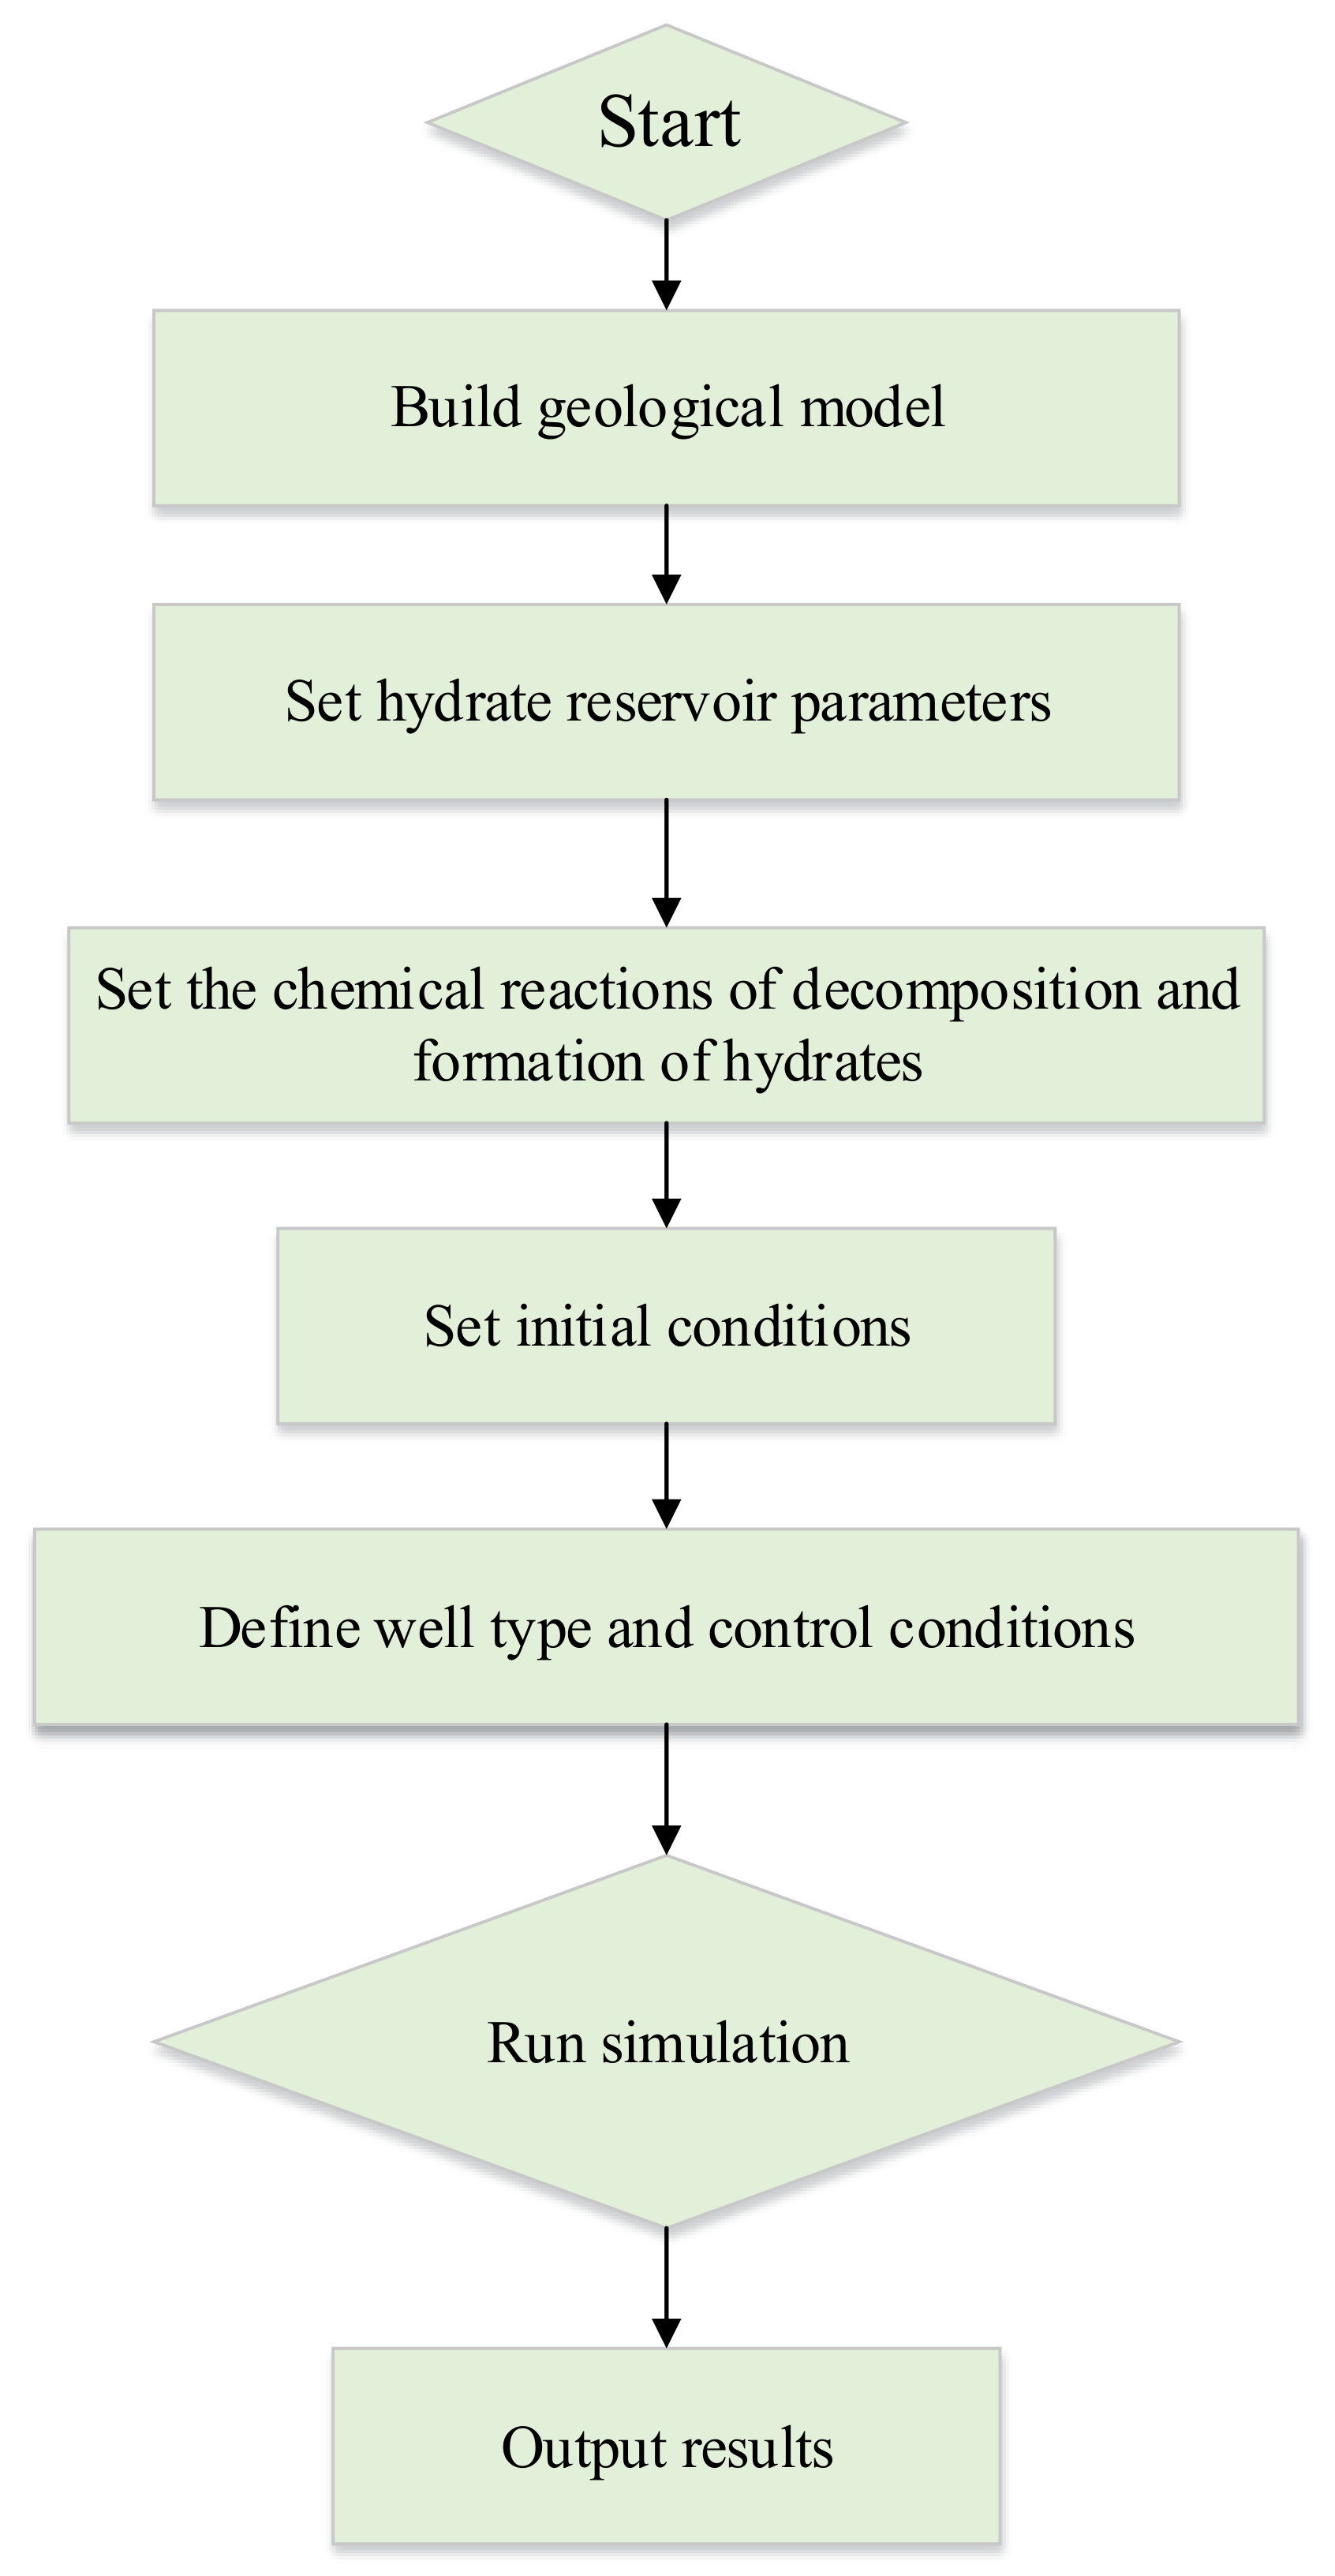
3. Numerical Simulation Model
4. Discussion
4.1. Impact of Different Methods of Production Enhancement
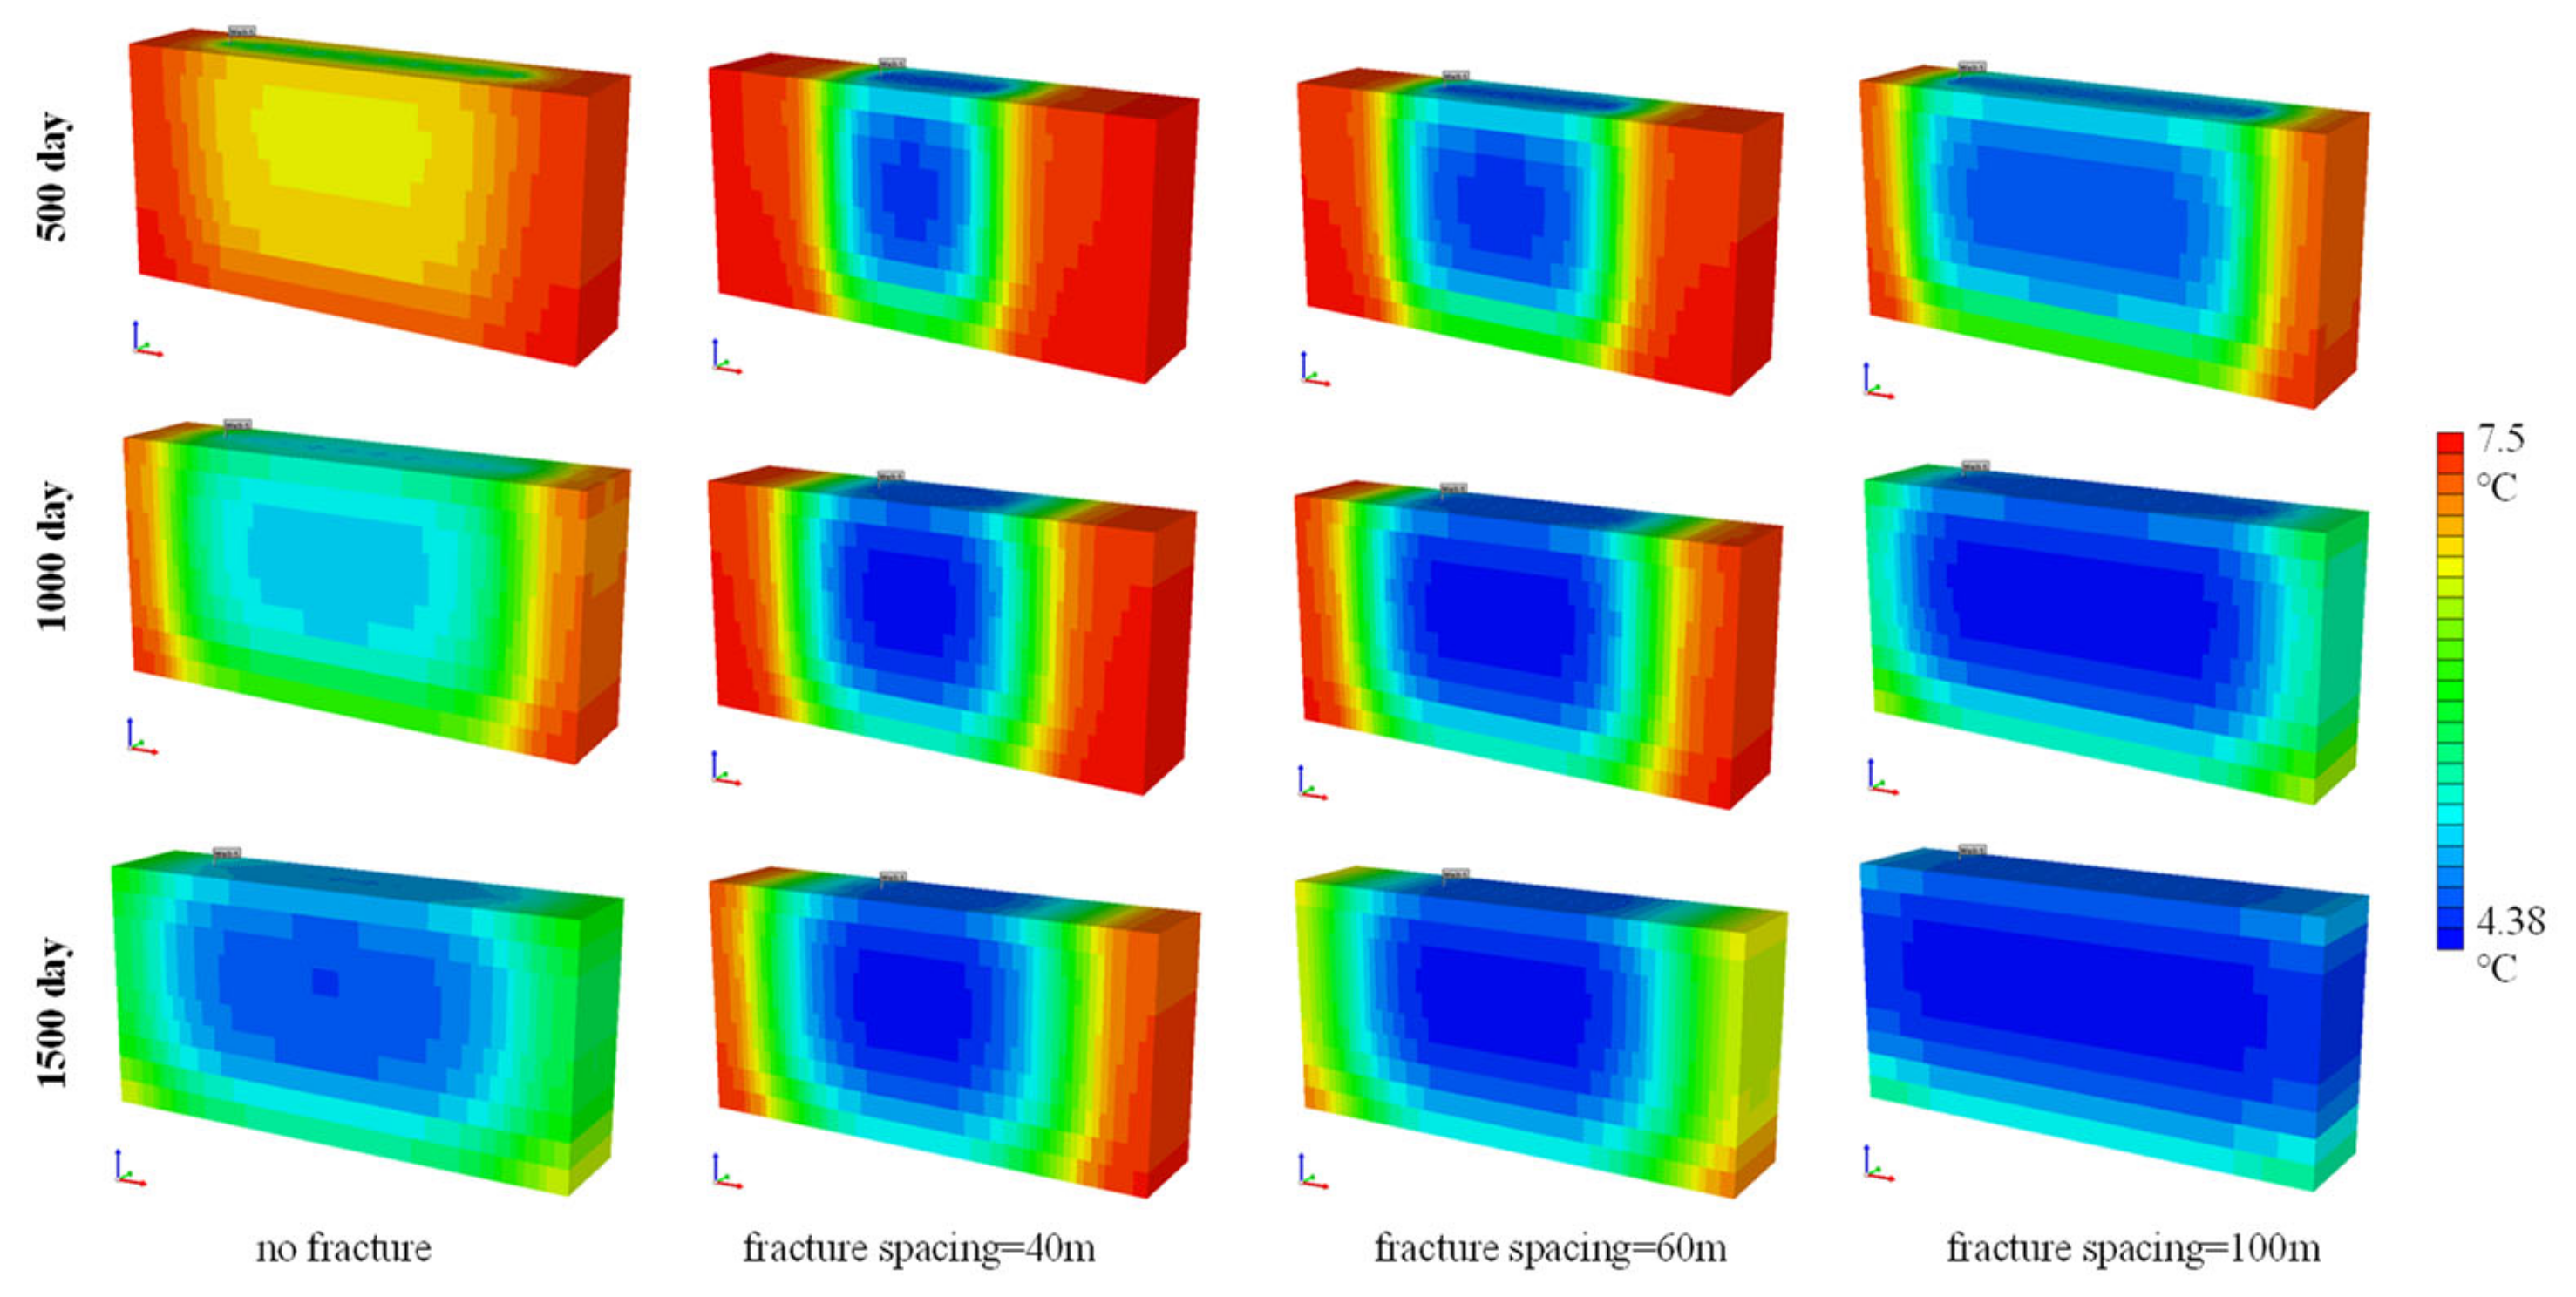
4.2. Effect of Different Fracture Spacing
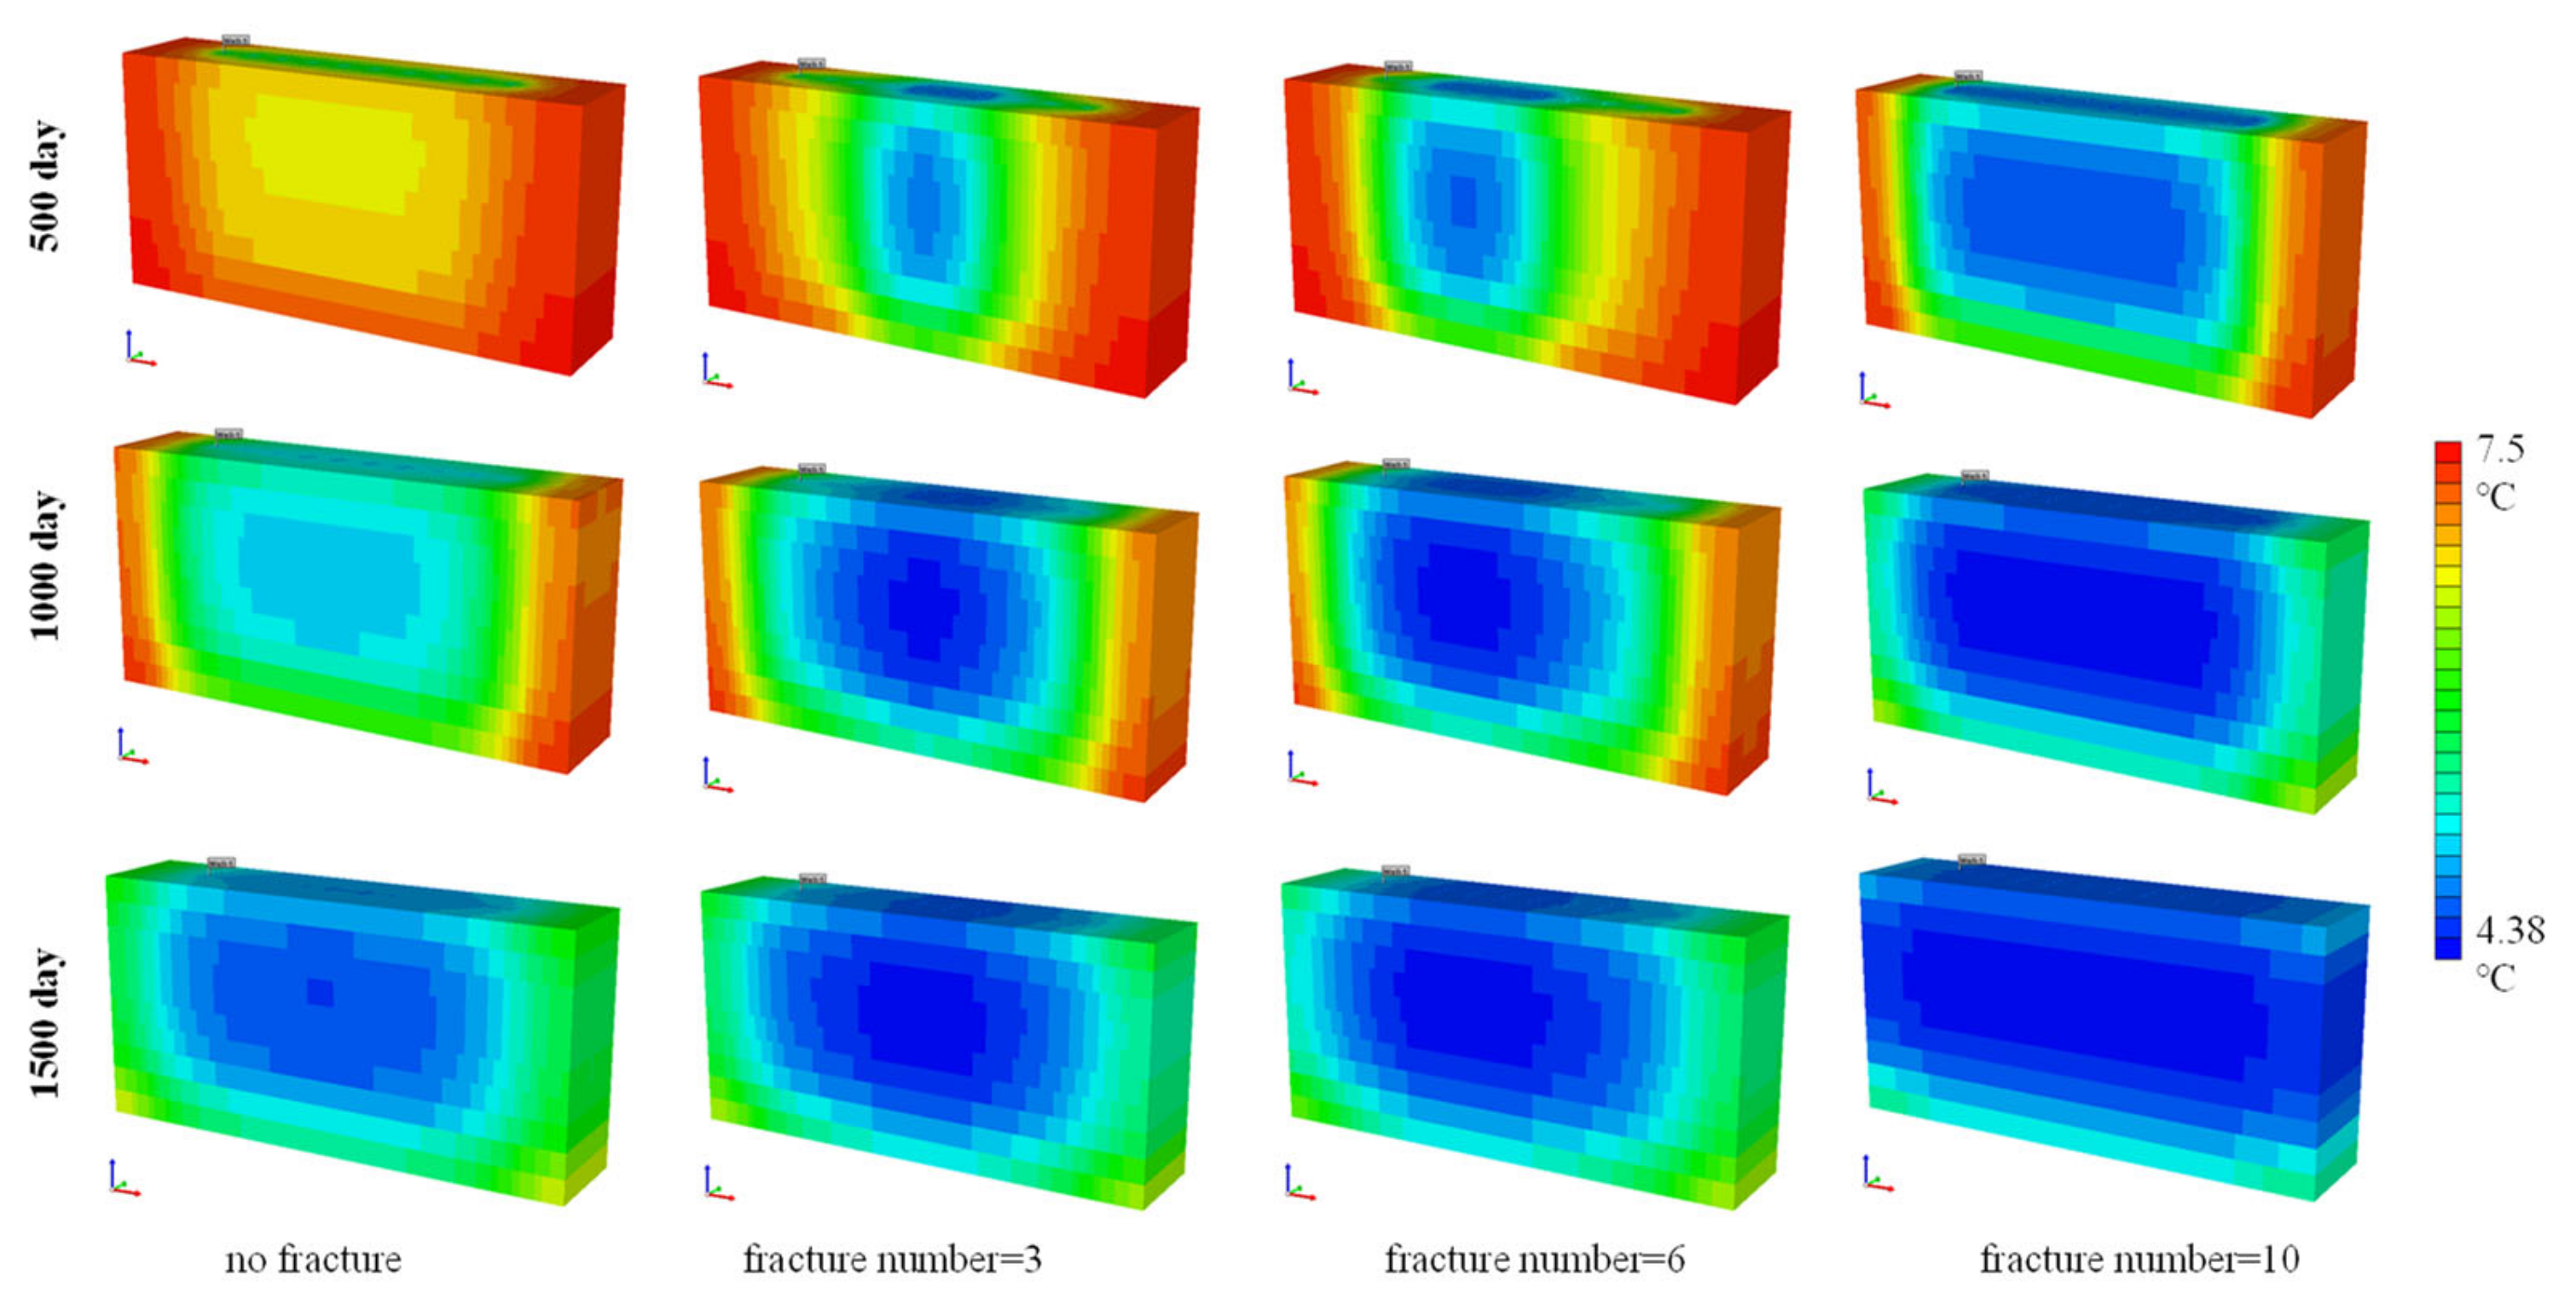
4.3. Effect of Different Fracture Number
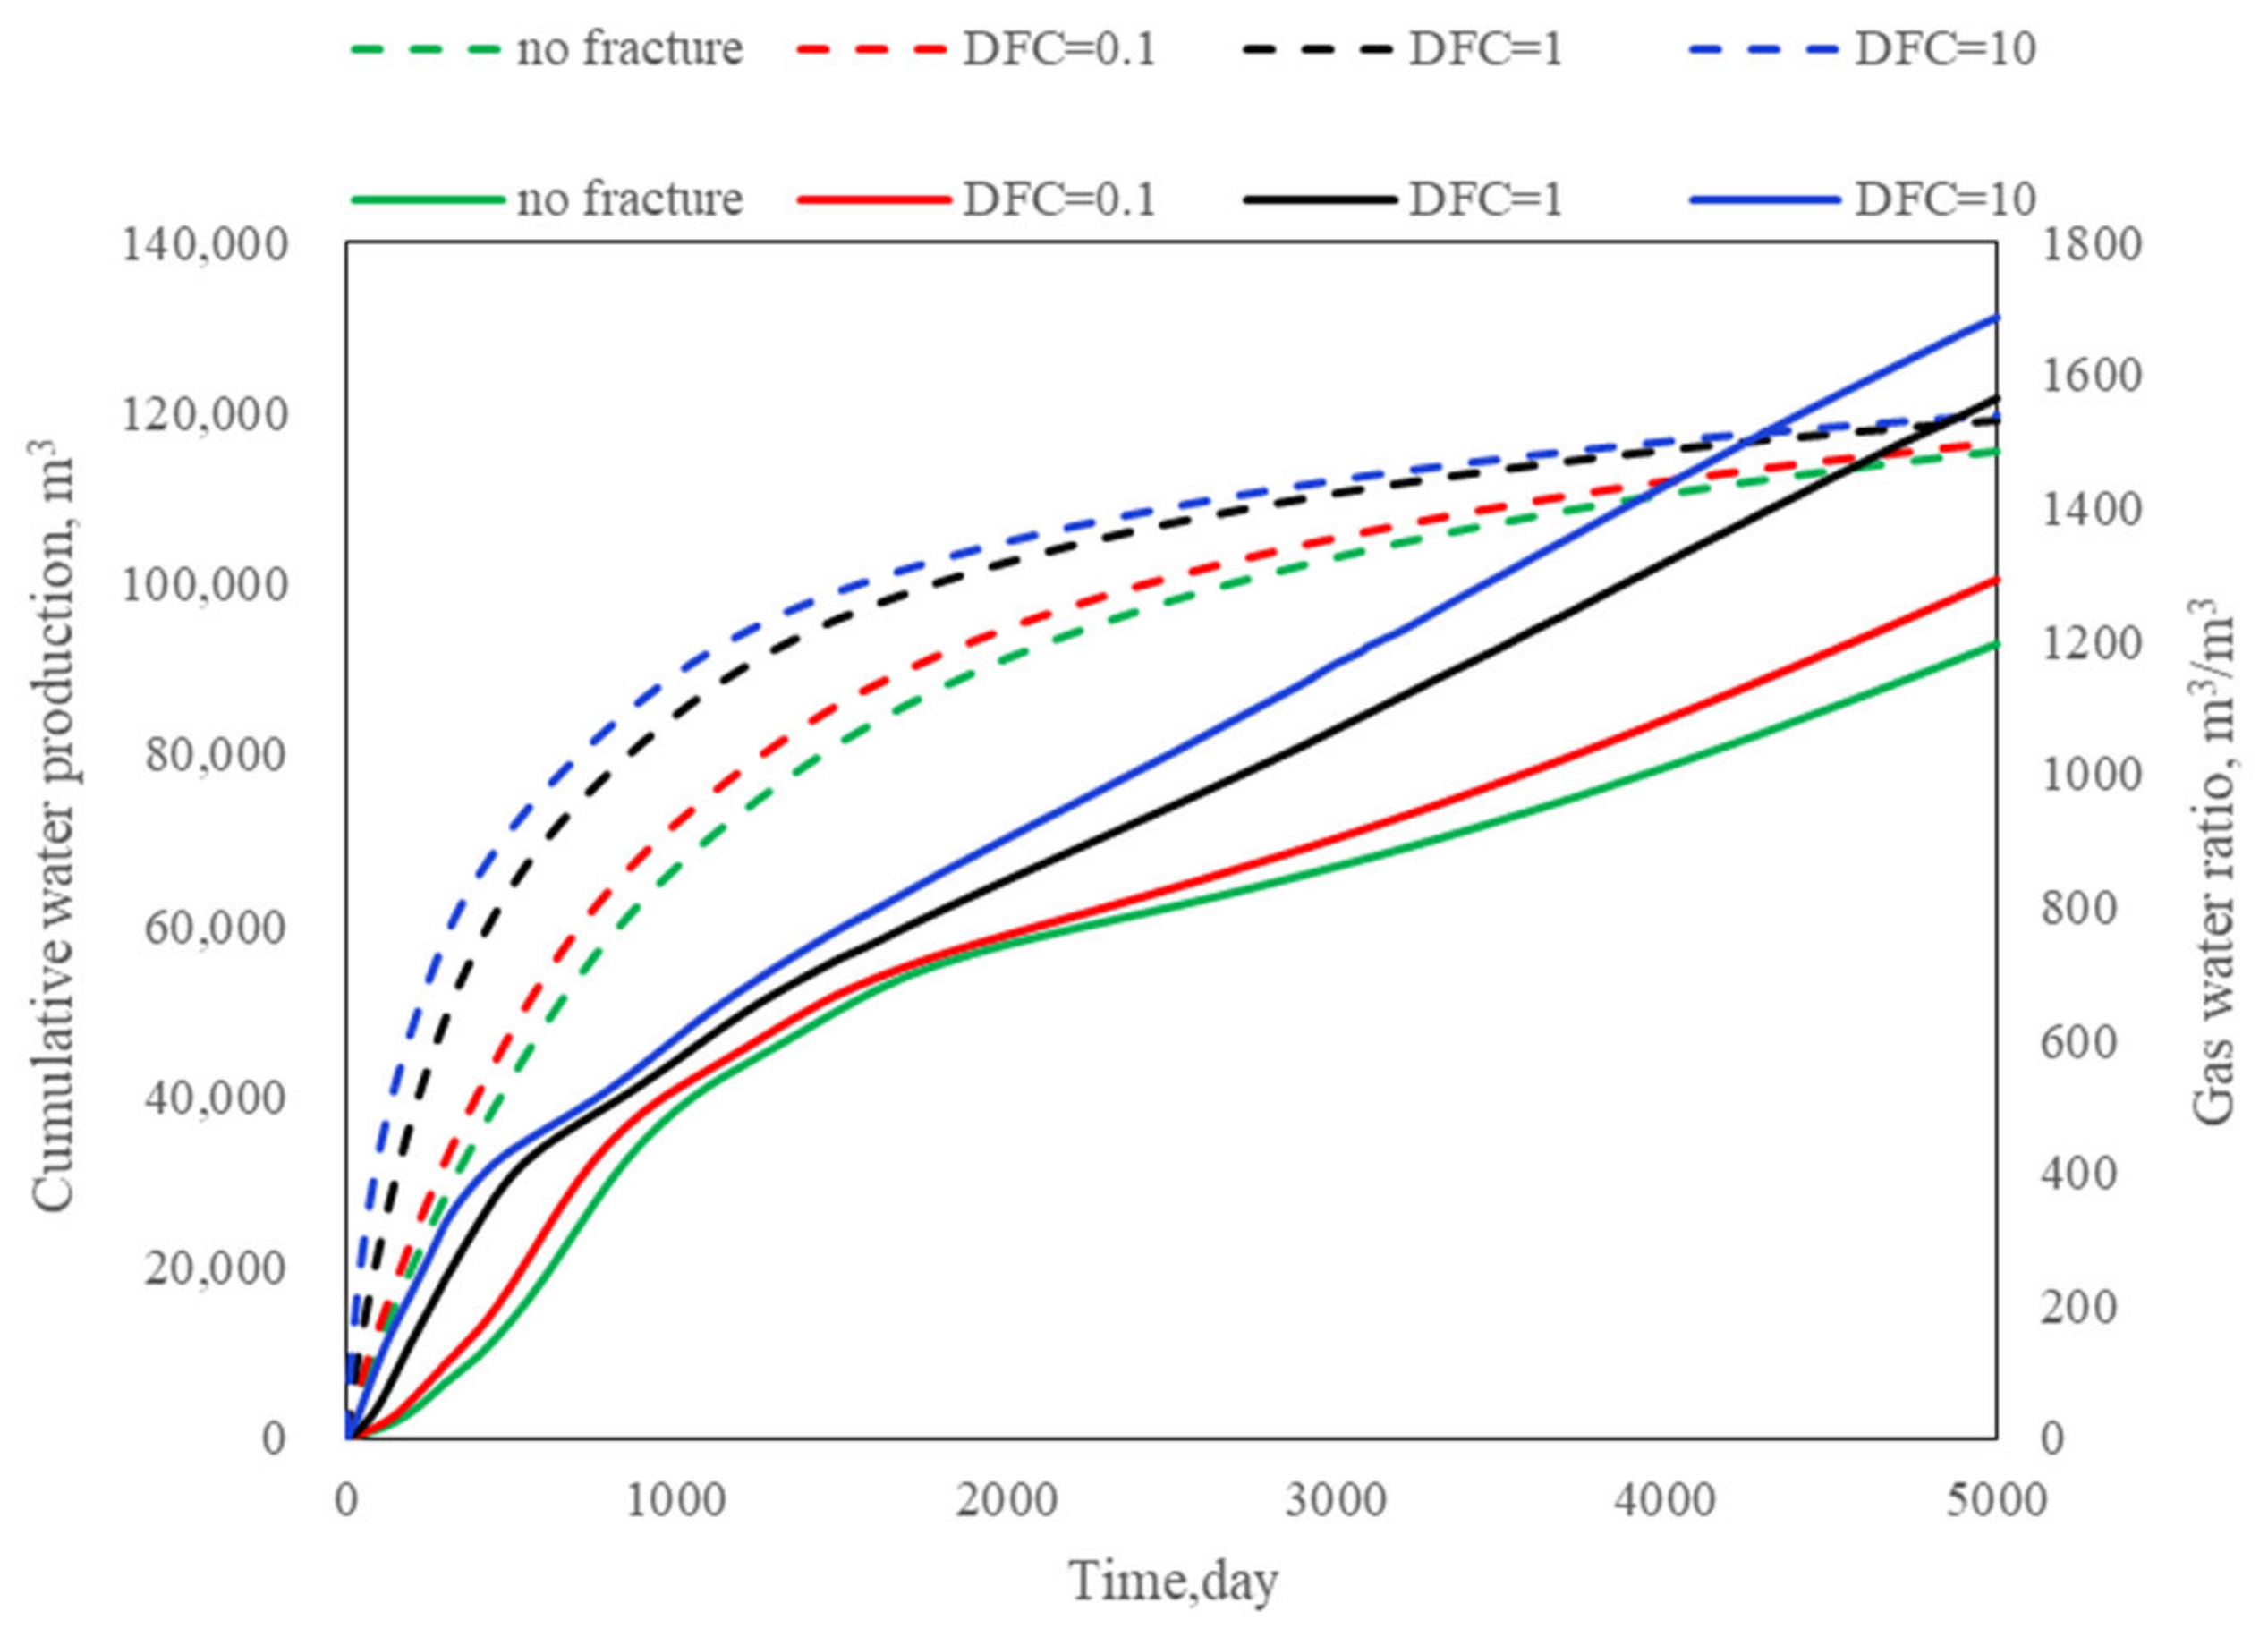
4.4. Effect of Different Dimensionless Fracture Conductivity
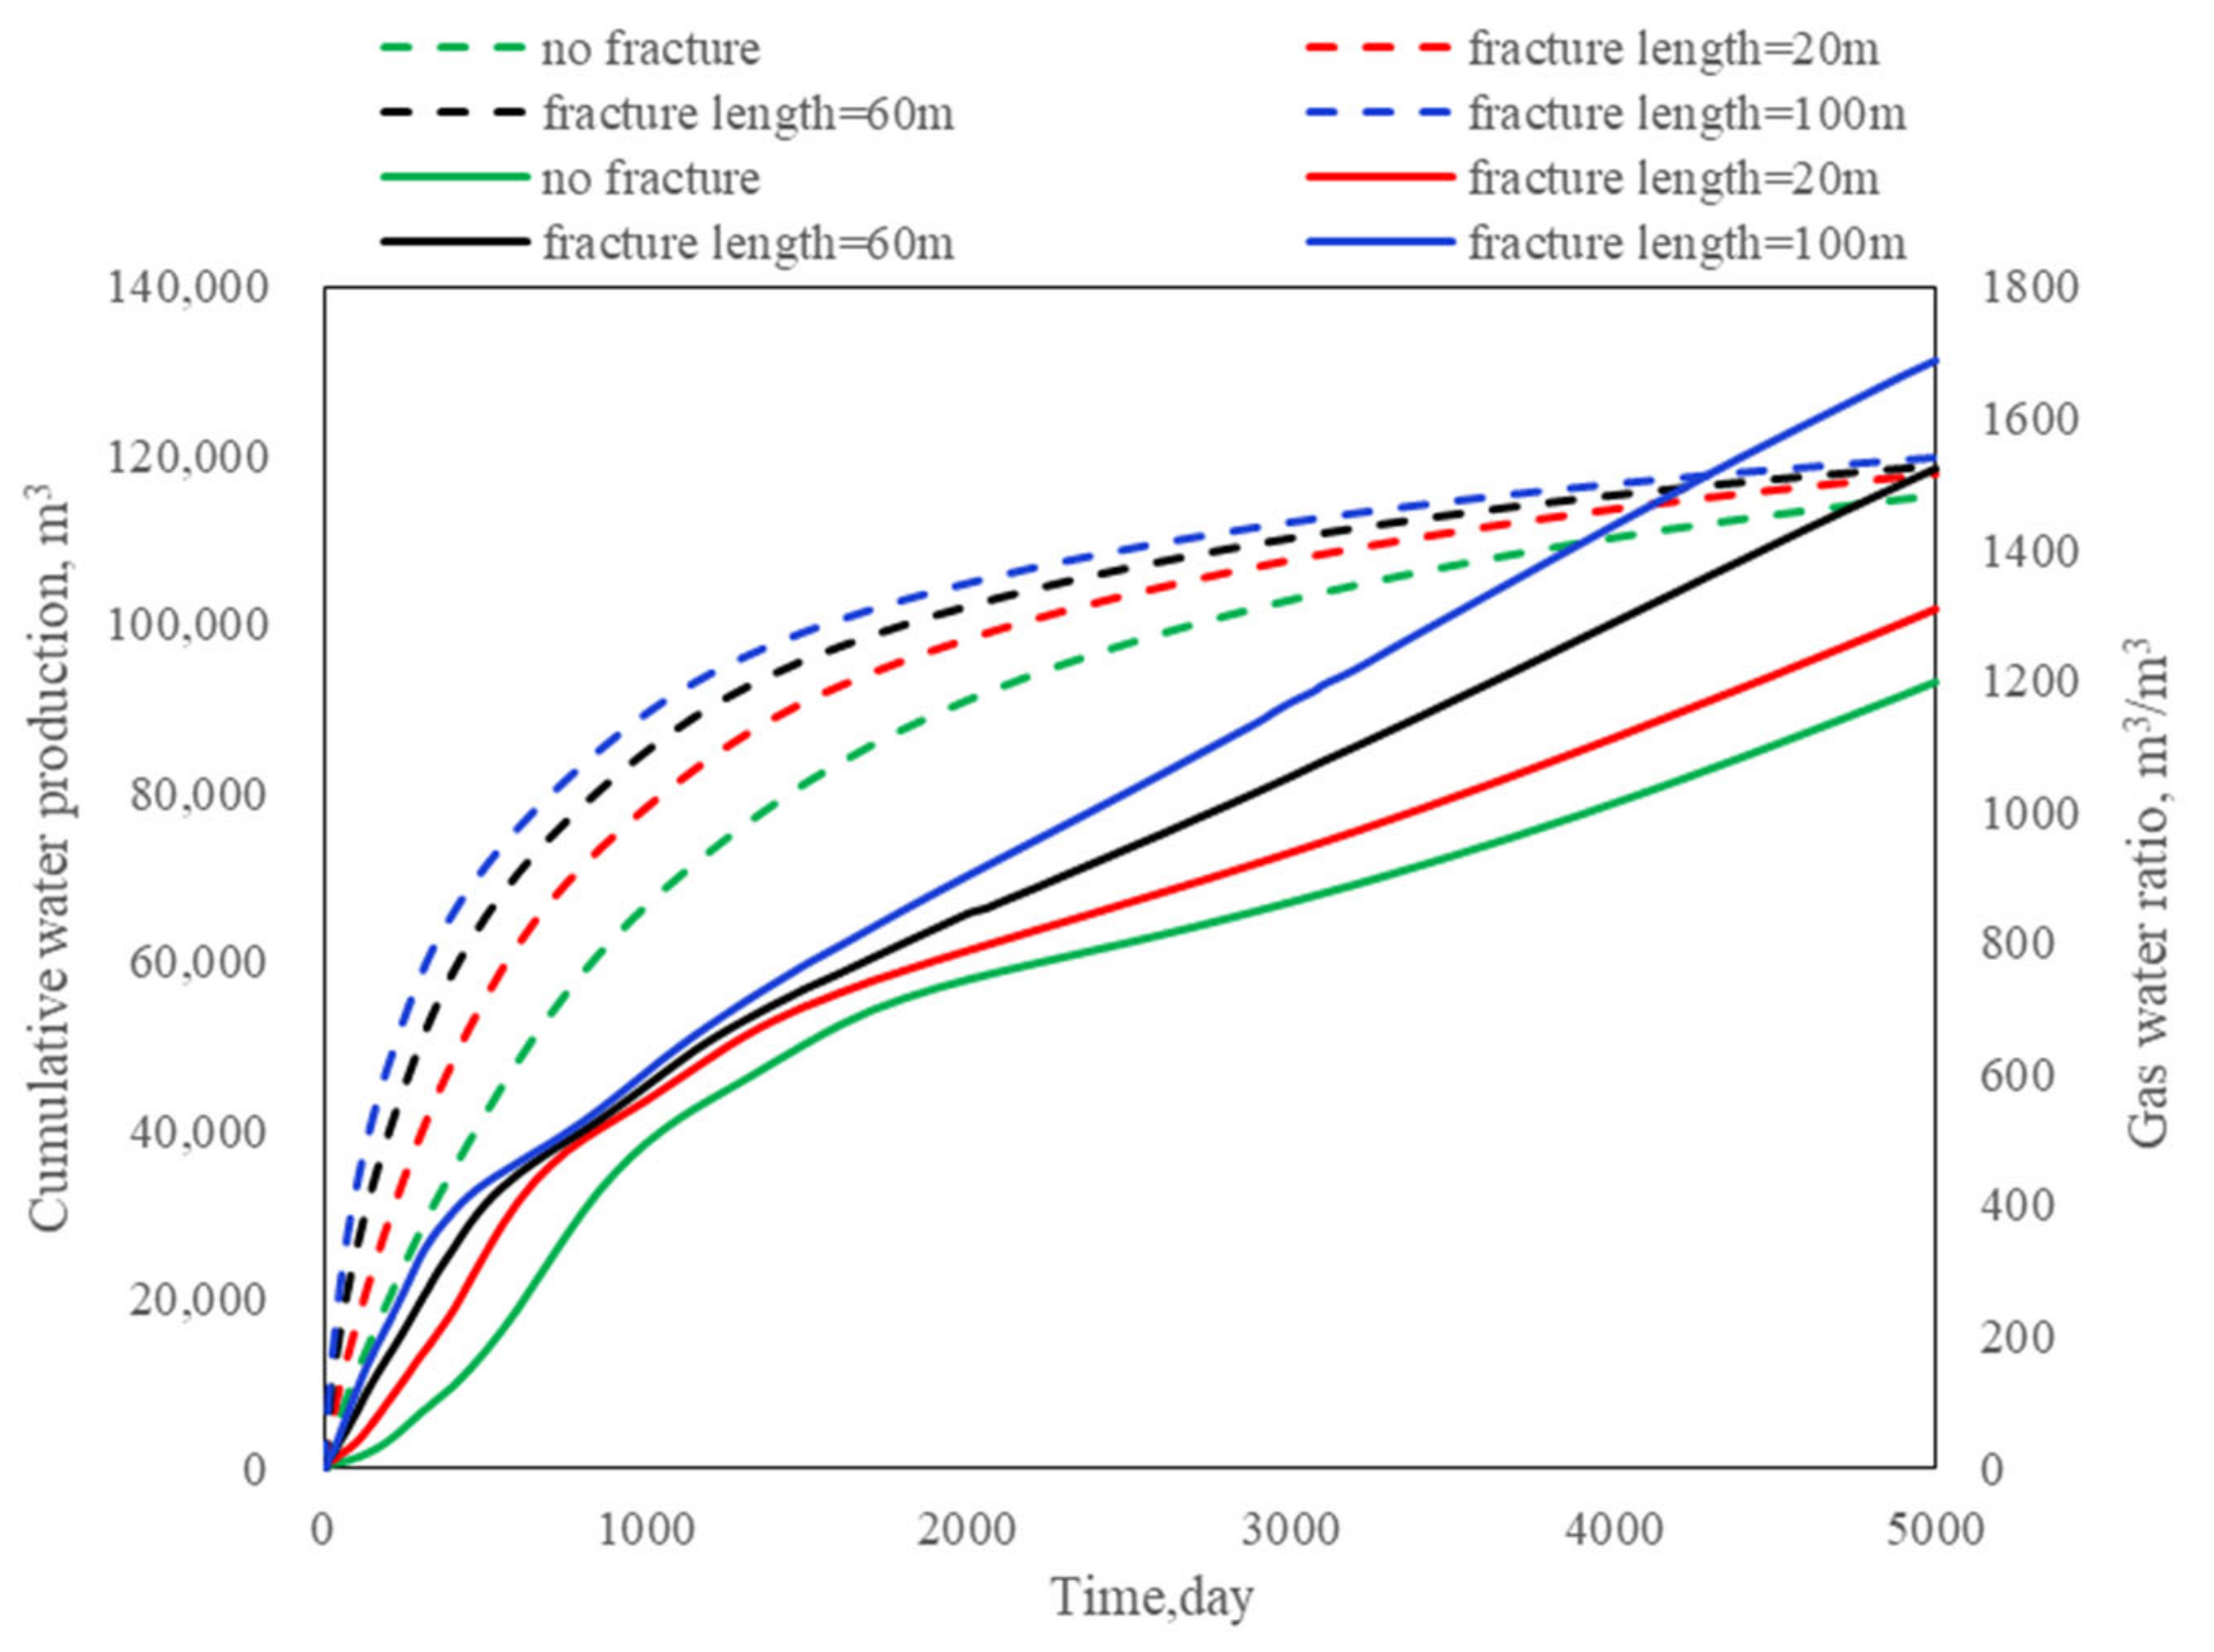
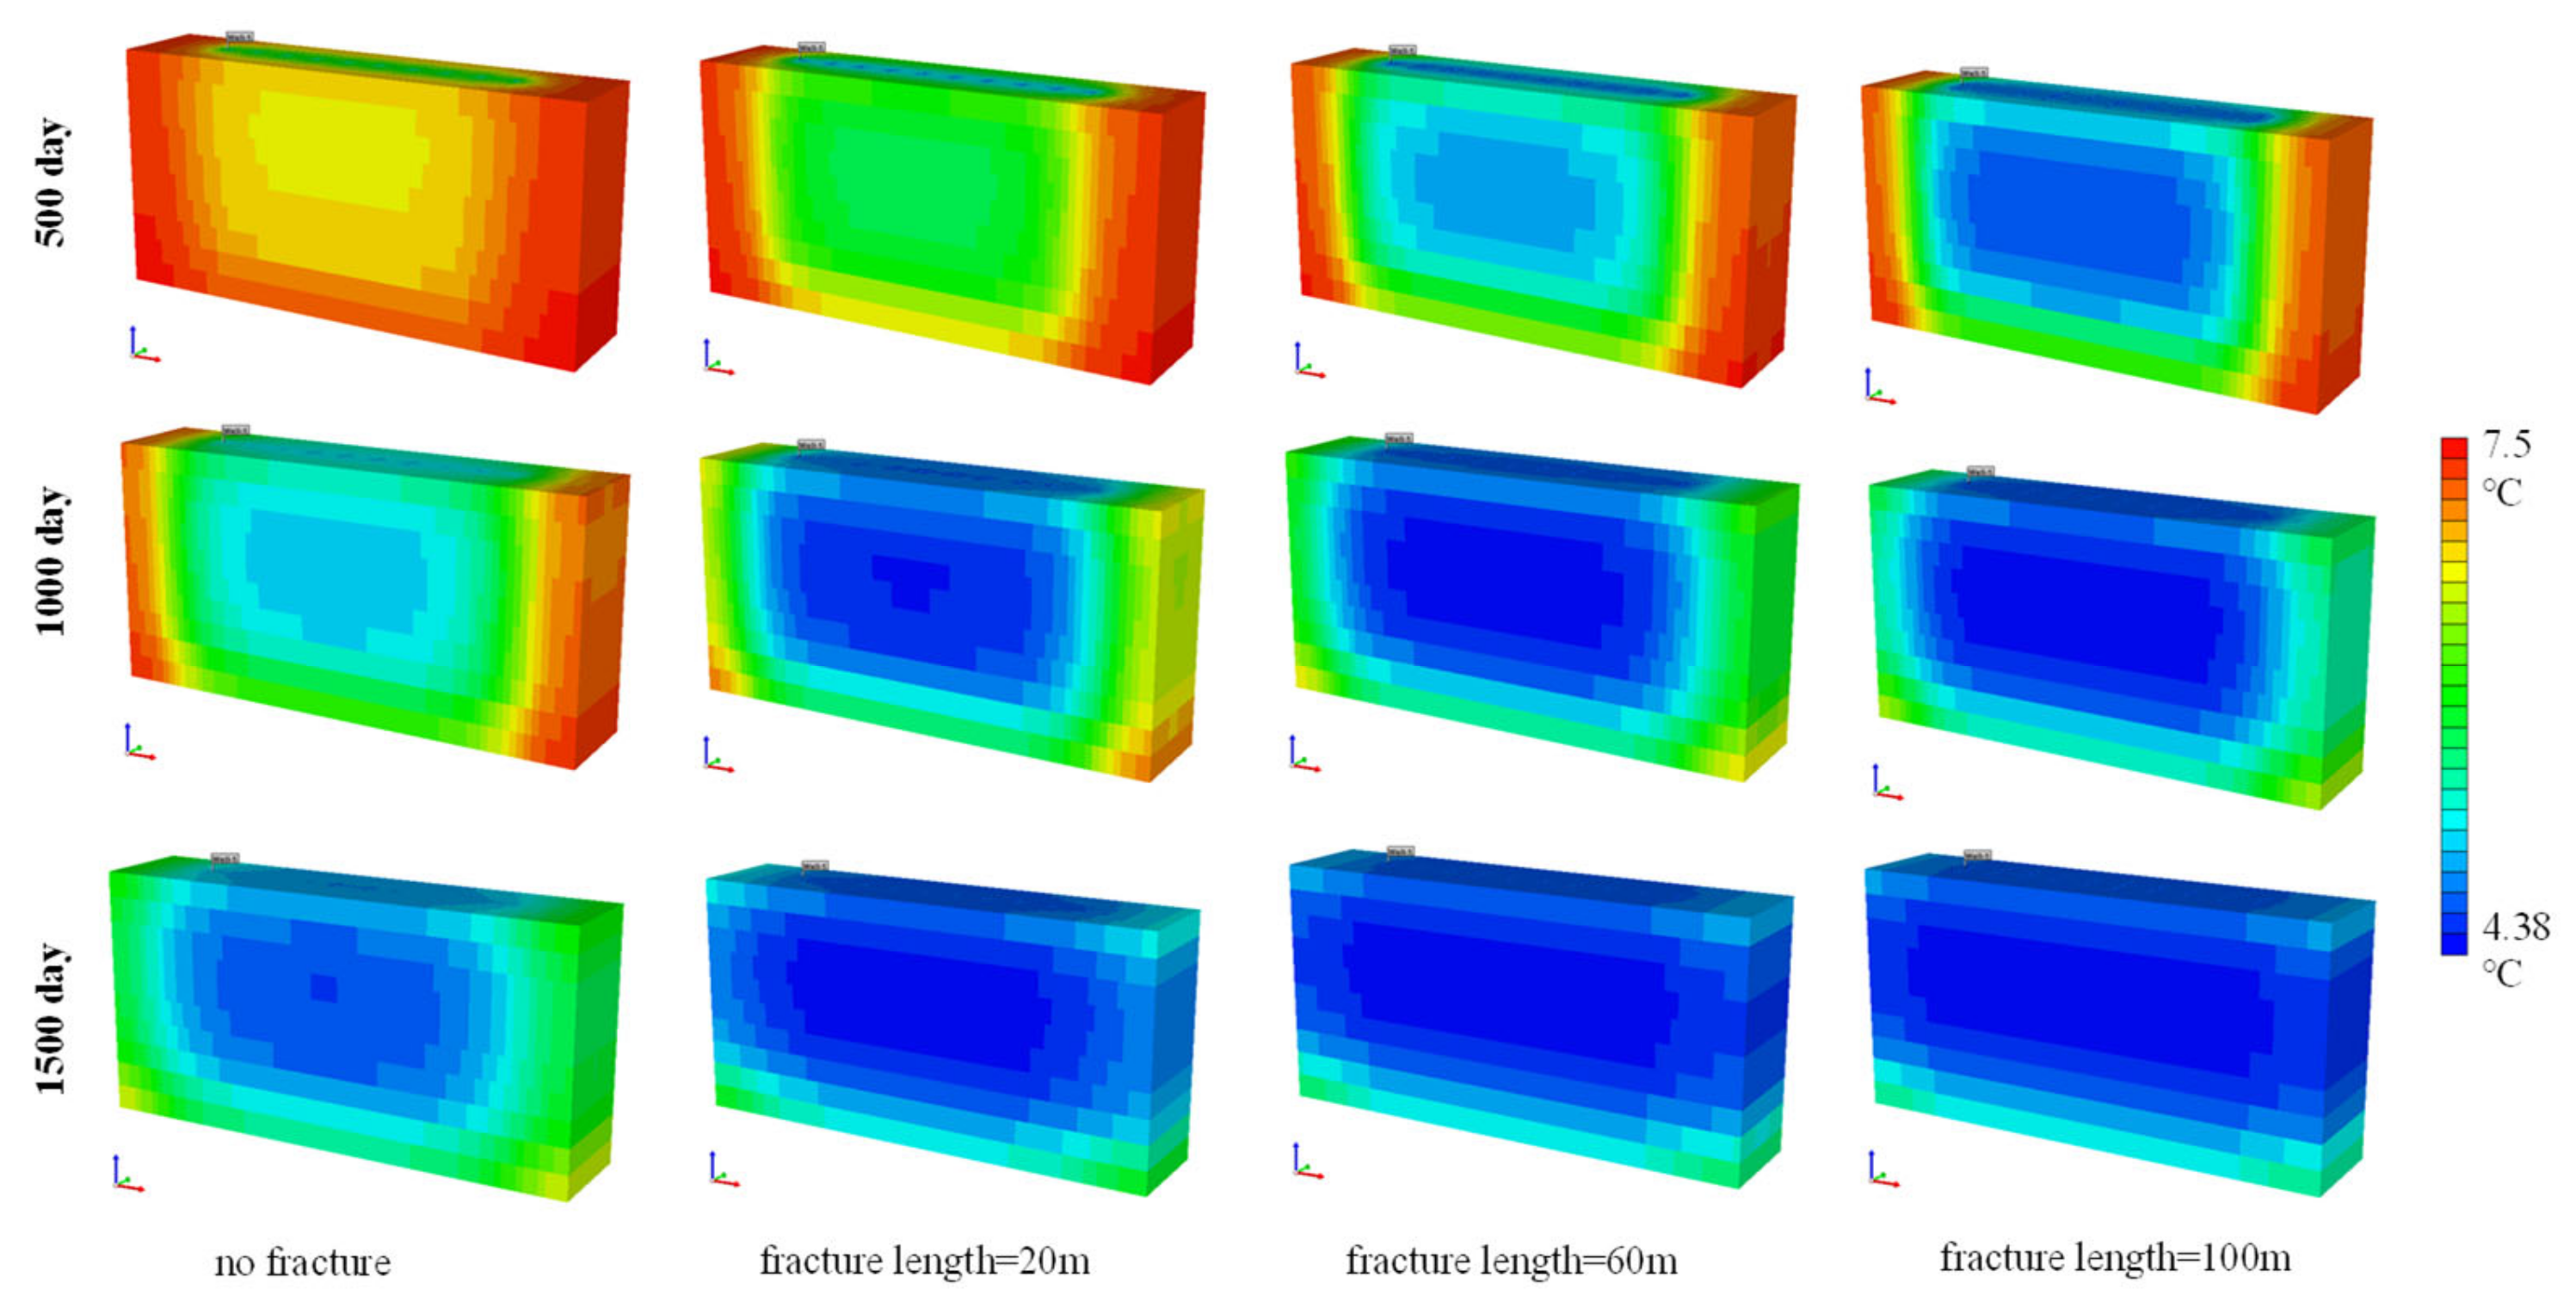
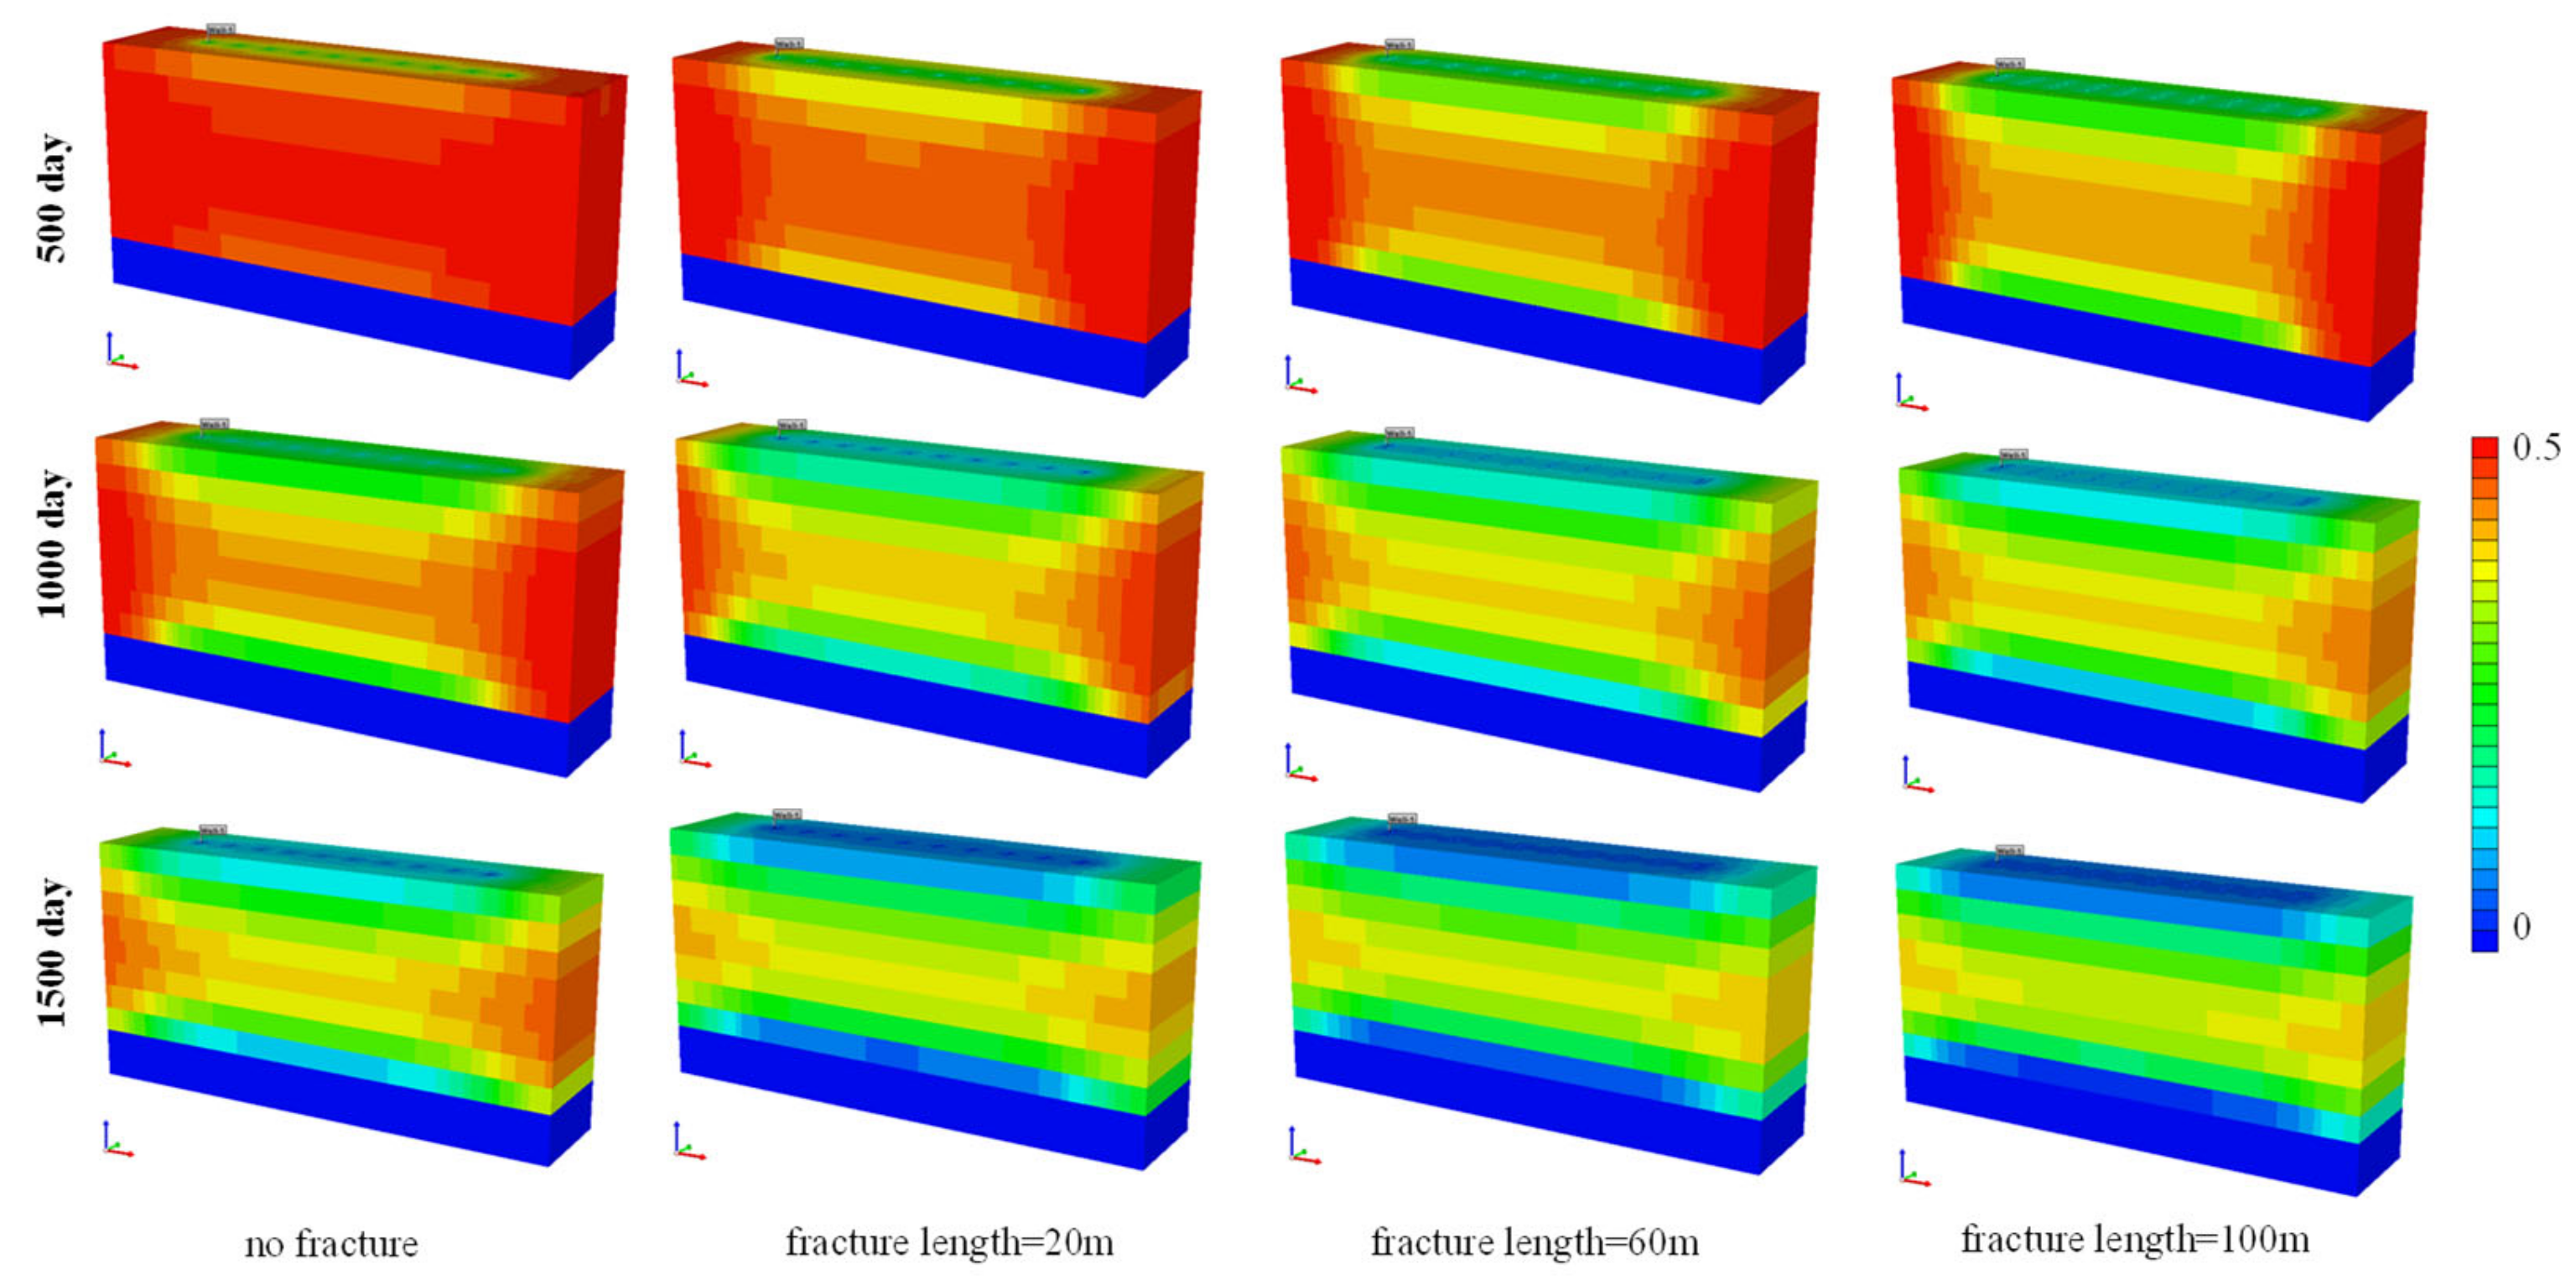
4.5. Effect of Different Fracture Length
5. Conclusions
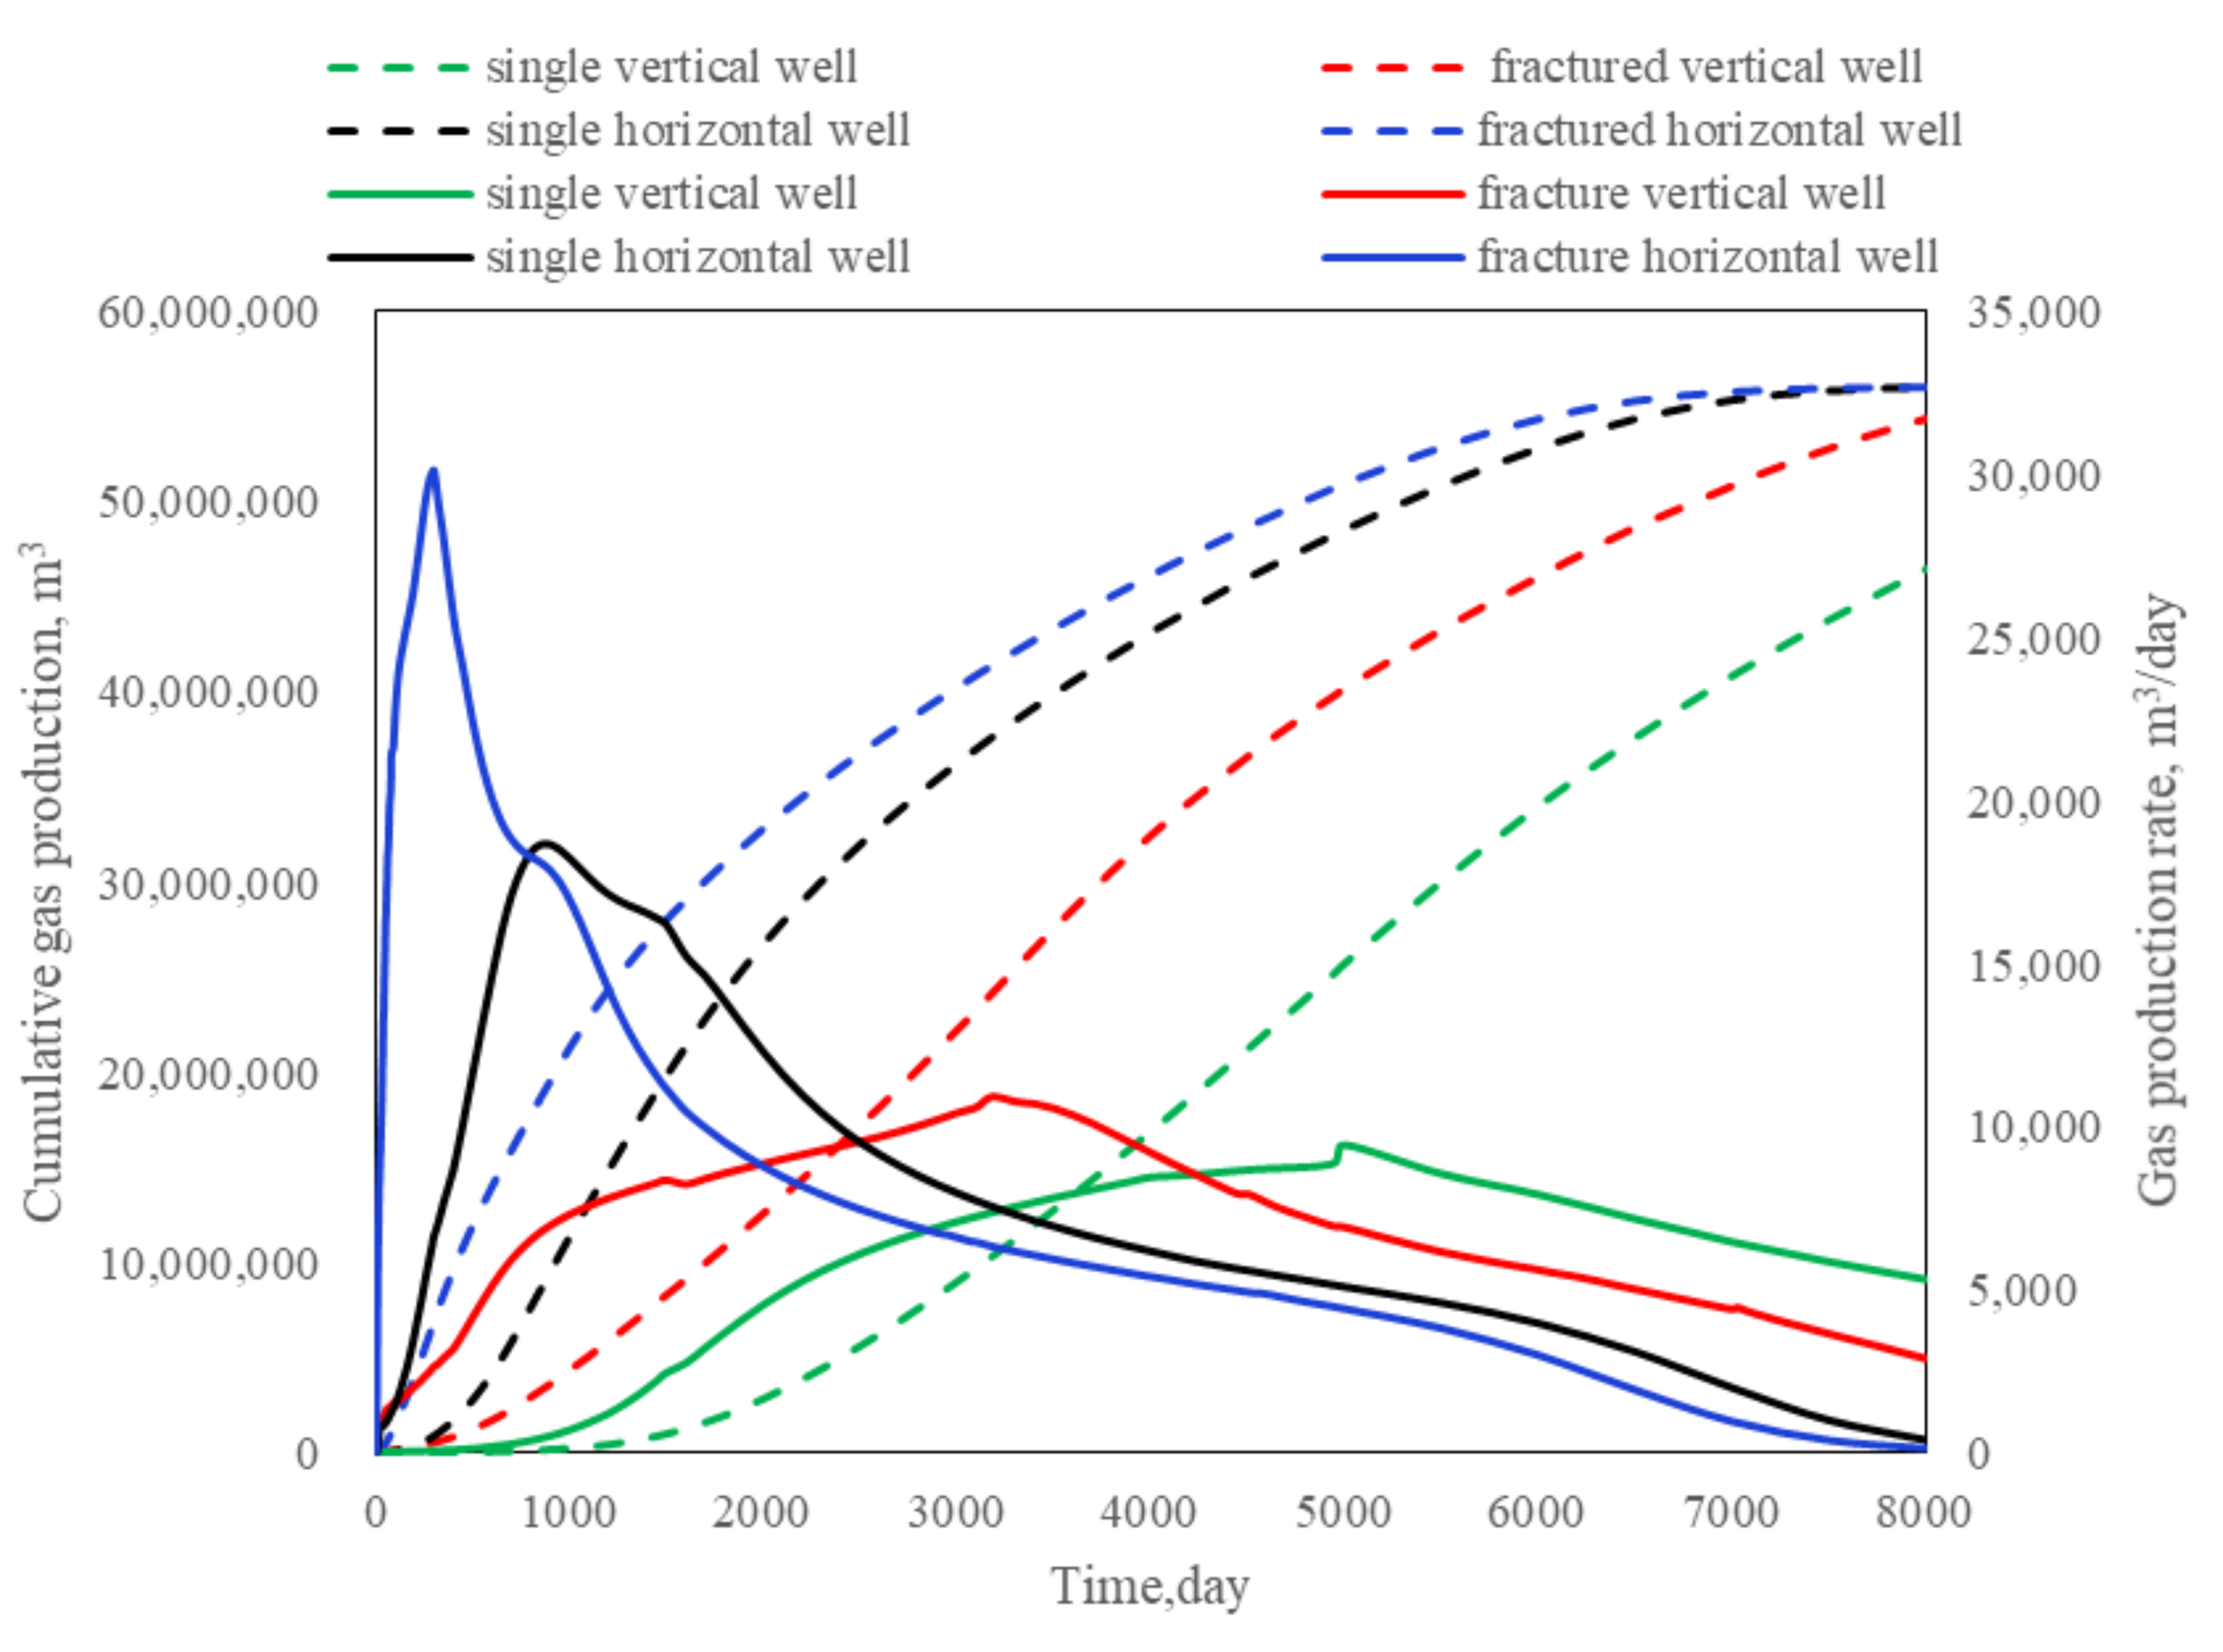
- (1)
- The increase in production from hydraulic fracturing is substantial for both vertical wells and horizontal wells. Furthermore, horizontal well production also produces more gas than single vertical well production. The multistage fractured horizontal well is very effective in increasing the early production rate.
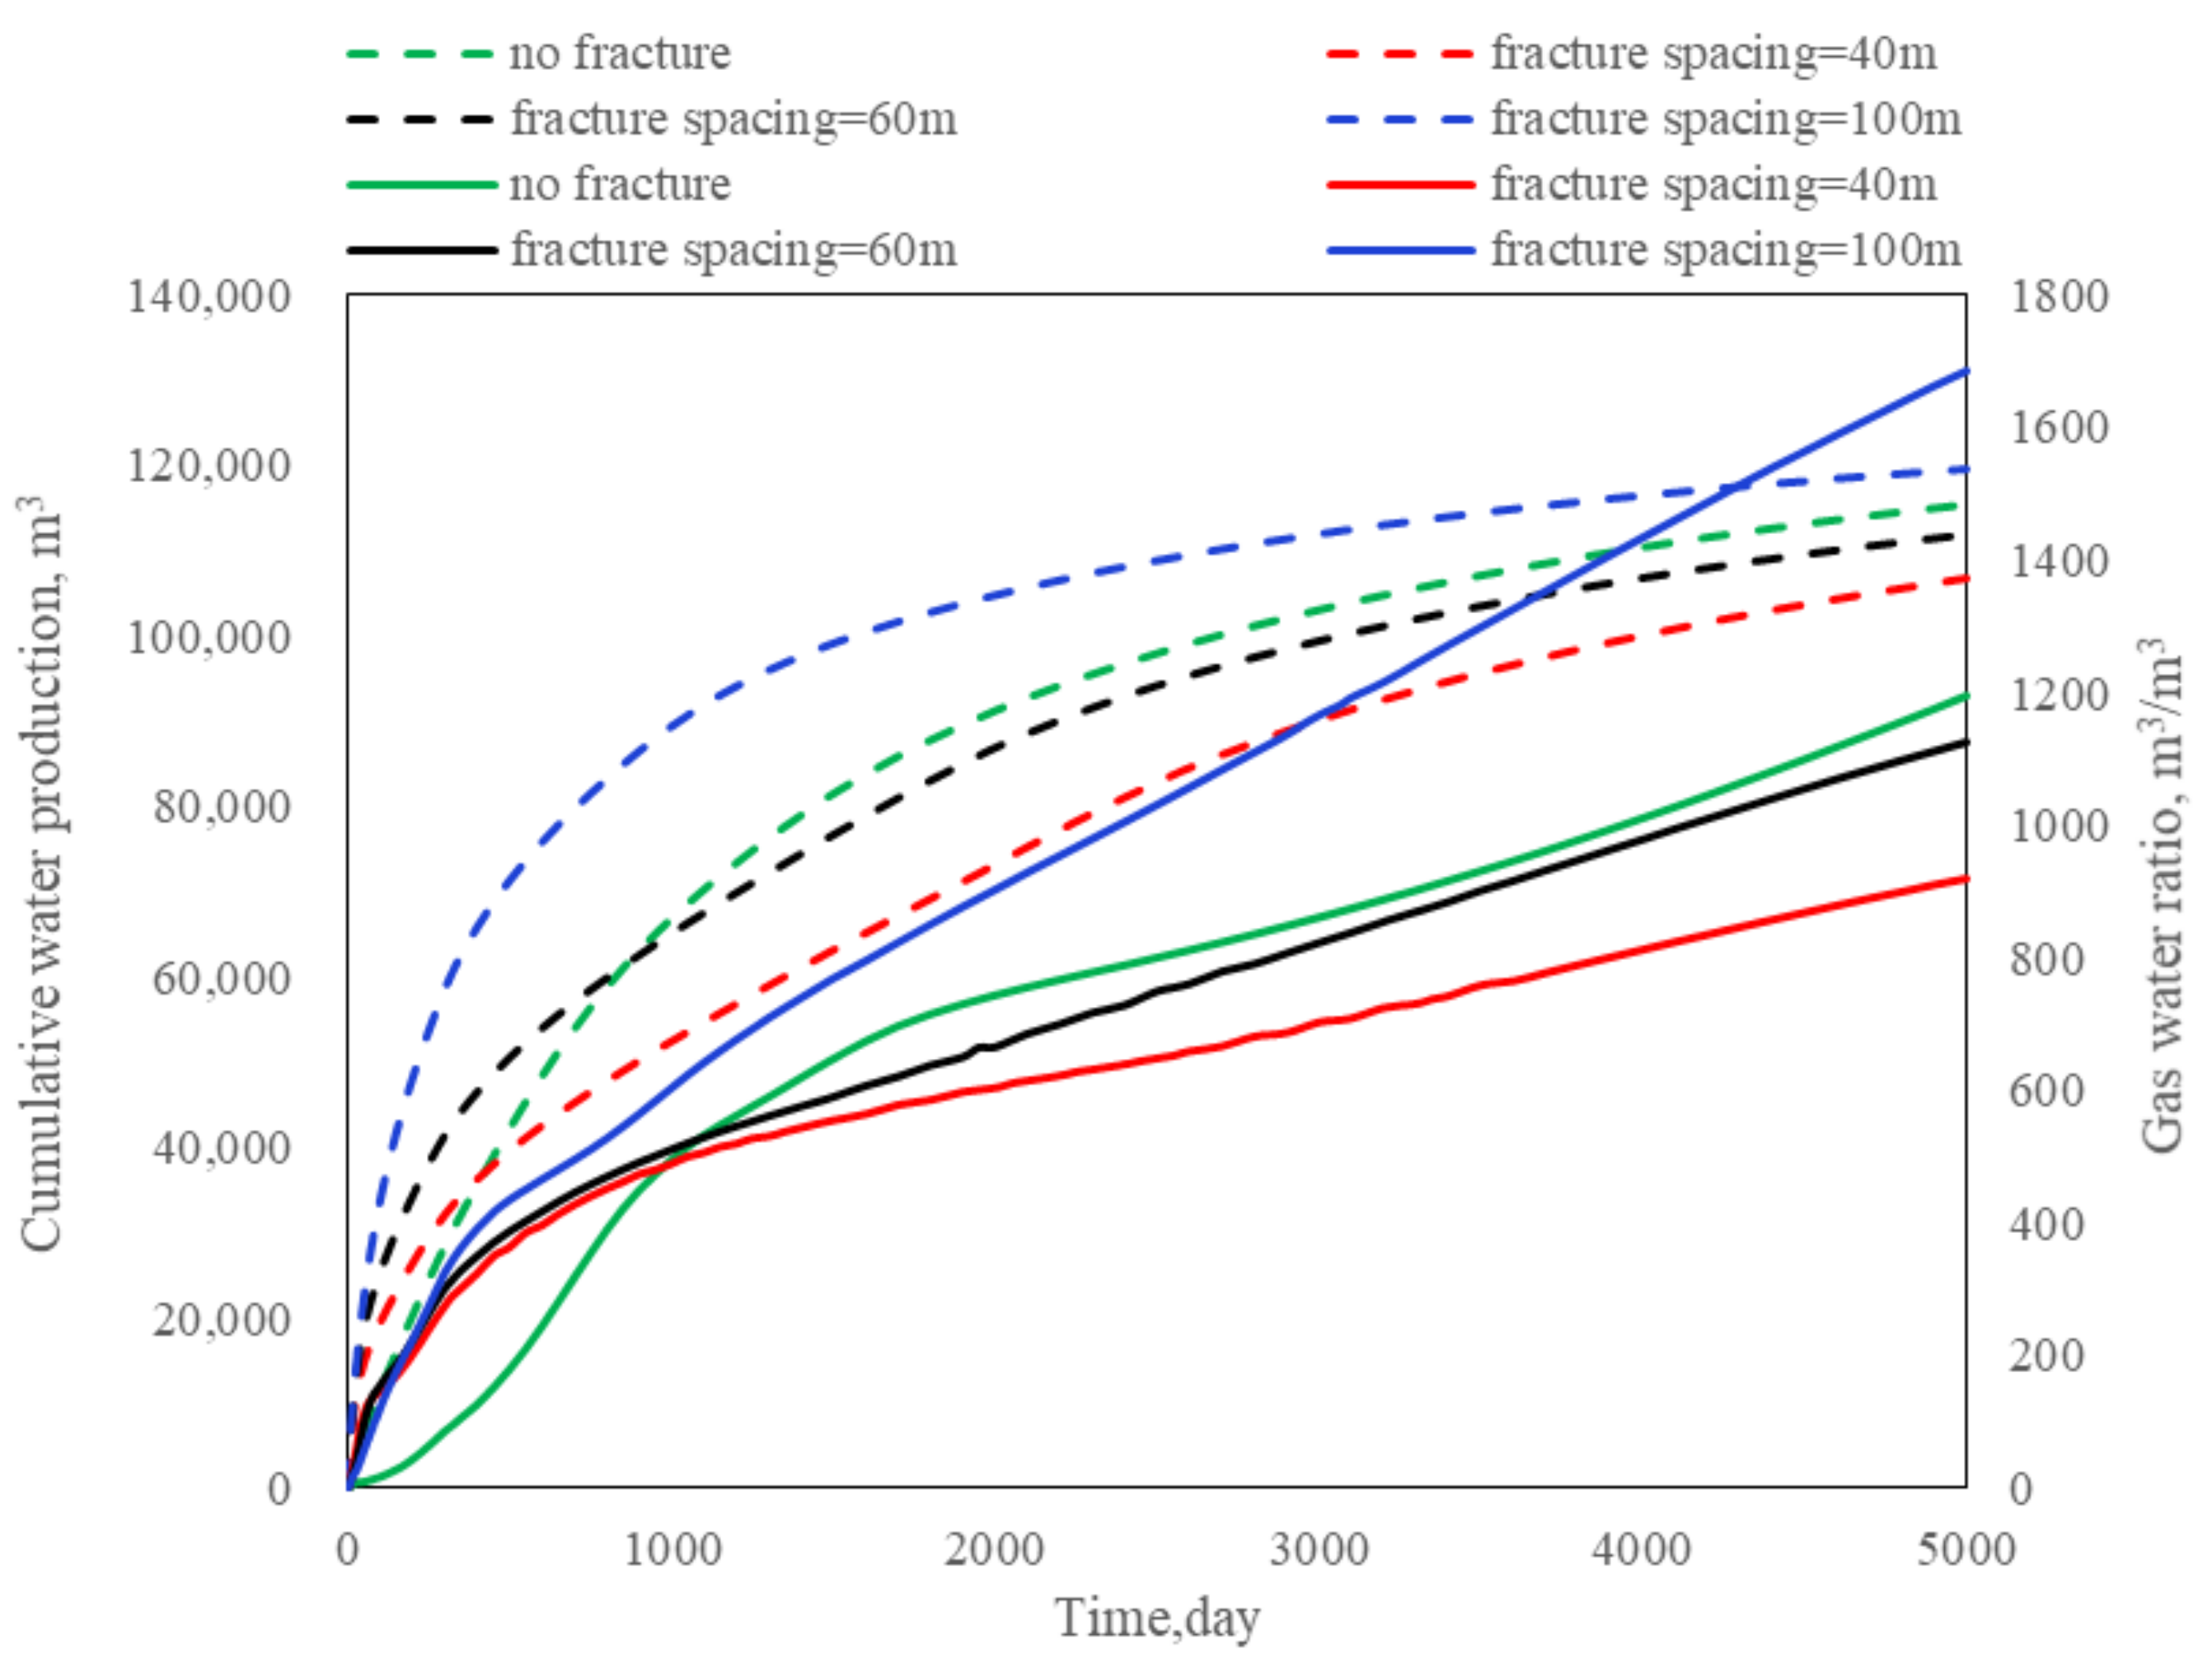
- (2)
- Proper fracture spacing can bring a good production increase. The wider-spaced fractures can bring a considerable increase in production, which shows that the choice of fracture location has an impact on hydrate exploitation. The fractures improve the seepage environment and increase the water production at the same time, but if the spacing is too small, the gas production will be inhibited and the gas-water ratio will be inferior to that in the case without fractures.
- (3)
- The number of fractures is helpful to increase production, but this effect may require a certain number of fractures to have a significant increase. We speculate that there may be a minimum value for the number of fractures, below which no production enhancement can be achieved.
- (4)
- Gas and water production increases with increasing fracture conductivity, with maximum daily gas production increasing from 900 days to 18,663.41 m3/day (without fractures) to 300 days to 30,155.98 m3/day (DFC = 10), and the time to peak is progressively shorter. However, there is a limit to the impact of increasing the dimensionless fracture conductivity to a constant value.
- (5)
- The gas production is uniformly increased with the increase in the fracture length, and the cumulative gas production increases from 5.02 × 10⁷ (fracture length 20 m) to 5.10 × 10⁷ (fracture length 100 m). Daily gas production shortened from 550 days to reach the maximum value of 24,124.35 m3/day to 300 days to reach the maximum value of 30,155.95 m3/day. The cumulative water production increased from 1.18 × 10⁵ m3 to 1.20 × 10⁵ m3.
Author Contributions
Funding
Data Availability Statement
Conflicts of Interest
References
- Yin, Z.; Linga, P. Methane hydrates: A future clean energy resource. Chin. J. Chem. Eng. 2019, 27, 2026–2036. [Google Scholar] [CrossRef]
- Collett, T.; Bahk, J.-J.; Baker, R.; Boswell, R.; Divins, D.; Frye, M.; Goldberg, D.; Husebø, J.; Koh, C.; Malone, M.; et al. Methane Hydrates in Nature—Current Knowledge and Challenges. J. Chem. Eng. Data 2015, 60, 319–329. [Google Scholar] [CrossRef]
- Cheng, F.; Wu, Z.; Sun, X.; Shen, S.; Wu, P.; Liu, W.; Chen, B.; Liu, X.; Li, Y. Compression-induced dynamic change in effective permeability of hydrate-bearing sediments during hydrate dissociation by depressurization. Energy 2023, 264, 126137. [Google Scholar] [CrossRef]
- Wu, P.; Li, Y.; Yu, T.; Wu, Z.; Huang, L.; Wang, H.; Song, Y. Microstructure evolution and dynamic permeability anisotropy during hydrate dissociation in sediment under stress state. Energy 2023, 263, 126126. [Google Scholar] [CrossRef]
- Wang, H.; Wu, P.; Li, Y.; Liu, W.; Pan, X.; Li, Q.; He, Y.; Song, Y. Gas permeability variation during methane hydrate dissociation by depressurization in marine sediments. Energy 2023, 263, 125749. [Google Scholar] [CrossRef]
- Cai, J.; Xia, Y.; Lu, C.; Bian, H.; Zou, S. Creeping microstructure and fractal permeability model of natural gas hydrate reservoir. Mar. Pet. Geol. 2020, 115, 104282. [Google Scholar] [CrossRef]
- Yamamoto, K.; Dallimore, S. Aurora-JOGMEC-NRCan Mallik 2006-2008 gas hydrate research project progress. Nat. Gas Oil 2008, 304, 285–4541. [Google Scholar]
- Hancock, S.; Collett, T.S.; Dallimore, S.R.; Satoh, T.; Inoue, T.; Huenges, E.; Henninges, J.; Weatherill, B. Overview of thermal-stimulation production-test results for the JAPEX/JNOC/GSC et al. Mallik 5L-38 gas hydrate production research well. In Scientific Results from the Mallik 2002 Gas Hydrate Production Research Well Program, Mackenzie Delta, Northwest Territories, Canada; Geological Survey of Canada: Ottawa, ON, Canada, 2005. [Google Scholar]
- Schoderbek, D.; Farrell, H.; Howard, J.; Raterman, K.; Silpngarmlert, S.; Martin, K.; Bruce, S.; Perry, K. ConocoPhillips Gas Hydrate Production Test. ConocoPhillips, Co.: Houston, TX, USA, 2013. [Google Scholar]
- Boswell, R. Japan completes first offshore methane hydrate production test—Methane successfully produced from deepwater hydrate layers. Cent. Nat. Gas Oil 2013, 412, 386–7614. [Google Scholar]
- Yamamoto, K.; Wang, X.-X.; Tamaki, M.; Suzuki, K. The second offshore production of methane hydrate in the Nankai Trough and gas production behavior from a heterogeneous methane hydrate reservoir. RSC Adv. 2019, 9, 25987–26013. [Google Scholar] [CrossRef] [PubMed] [Green Version]
- Sun, Y.; Li, B.; Guo, W.; Lü, X.; Zhang, Y.; Li, K.; Wang, P.; Jin, G.; Jia, R.; Qu, L. Comparative analysis of the production trial and numerical simulations of gas production from multilayer hydrate deposits in the Qilian Mountain permafrost. J. Nat. Gas Sci. Eng. 2014, 21, 456–466. [Google Scholar] [CrossRef]
- Li, J.; Ye, J.; Qin, X.; Qiu, H.J.; Wu, N.Y.; Lu, H.L.; Xie, W.W.; Lu, J.A.; Peng, F.; Xu, Z.Q.; et al. The first offshore natural gas hydrate production test in South China Sea. China Geol. 2018, 1, 5–16. [Google Scholar] [CrossRef]
- Li, B.; Li, G.; Li, X.; Li, Q.; Yang, B.; Zhang, Y.; Chen, Z. Gas Production from Methane Hydrate in a Pilot-Scale Hydrate Simulator Using the Huff and Puff Method by Experimental and Numerical Studies. Energy Fuels 2012, 26, 7183–7194. [Google Scholar] [CrossRef]
- Moridis, G.J.; Kim, J.; Reagan, M.T.; Kim, S.J. Feasibility of gas production from a gas hydrate accumulation at the UBGH2-6 site of the Ulleung basin in the Korean East Sea. J. Pet. Sci. Eng. 2013, 108, 180–210. [Google Scholar] [CrossRef]
- Sun, J.; Ning, F.; Li, S.; Zhang, K.; Liu, T.; Zhang, L.; Jiang, J.; Wu, N. Numerical simulation of gas production from hydrate-bearing sediments in the Shenhu area by depressurising: The effect of burden permeability. J. Unconv. Oil Gas Resour. 2015, 12, 23–33. [Google Scholar] [CrossRef]
- Li, Y.; Guan, G.; Wang, D.; Song, Y.; Abuliti, A. Gas production enhancement from a multilayered hydrate reservoir in the South China Sea by hydraulic fracturing. Energy Fuels 2021, 35, 12104–12118. [Google Scholar]
- Qin, X.; Liang, Q.; Ye, J.; Yang, L.; Qiu, H.; Xie, W.; Liang, J.; Lu, J.; Lu, C.; Lu, H.; et al. The response of temperature and pressure of hydrate reservoirs in the first gas hydrate production test in South China Sea. Appl. Energy 2020, 278, 115649. [Google Scholar] [CrossRef]
- Konno, Y.; Jin, Y.; Yoneda, J.; Uchiumi, T.; Shinjou, K.; Nagao, J. Hydraulic fracturing in methane-hydrate-bearing sand. RSC Adv. 2016, 6, 73148–73155. [Google Scholar] [CrossRef] [Green Version]
- Too, J.L.; Cheng, A.; Khoo, B.C.; Palmer, A.; Linga, P. Hydraulic fracturing in a penny-shaped crack. Part II: Testing the frackability of methane hydrate-bearing sand. J. Nat. Gas Sci. Eng. 2018, 52, 619–628. [Google Scholar] [CrossRef]
- Ito, T.; Igarashi, A.; Yamamoto, K. Laboratory experiments of hydraulic fracturing in unconsolidated sands. J. MMIJ 2011, 127, 243–248. [Google Scholar] [CrossRef] [Green Version]
- Chen, C.; Yang, L.; Jia, R.; Sun, Y.; Guo, W.; Chen, Y.; Li, X. Simulation Study on the Effect of Fracturing Technology on the Production Efficiency of Natural Gas Hydrate. Energies 2017, 10, 1241. [Google Scholar] [CrossRef] [Green Version]
- Feng, Y.; Chen, L.; Suzuki, A.; Kogawa, T.; Okajima, J.; Komiya, A.; Maruyama, S. Enhancement of gas production from methane hydrate reservoirs by the combination of hydraulic fracturing and depressurization method. Energy Convers. Manag. 2019, 184, 194–204. [Google Scholar] [CrossRef]
- Feng, Y.; Chen, L.; Kanda, Y.; Suzuki, A.; Komiya, A.; Maruyama, S. Numerical analysis of gas production from large-scale methane hydrate sediments with fractures. Energy 2021, 236, 121485. [Google Scholar] [CrossRef]
- Zhao, J.; Xu, L.; Guo, X.; Li, Q.; Lv, X.; Fan, Q.; Zhao, J.; Dong, H.; Wang, B.; Yang, L. Enhancing the gas production efficiency of depressurization-induced methane hydrate exploitation via fracturing. Fuel 2021, 288, 119740. [Google Scholar] [CrossRef]
- Liu, X.; Zhang, W.; Qu, Z.; Guo, T.; Sun, Y.; Rabiei, M.; Cao, Q. Feasibility evaluation of hydraulic fracturing in hydrate-bearing sediments based on analytic hierarchy process-entropy method (AHP-EM). J. Nat. Gas Sci. Eng. 2020, 81, 103434. [Google Scholar] [CrossRef]
- Chong, Z.R.; Zhao, J.; Chan JH, R.; Yin, Z.; Linga, P. Effect of horizontal wellbore on the production behavior from marine hydrate bearing sediment. Appl. Energy 2018, 214, 117–130. [Google Scholar] [CrossRef]
- Chong, Z.R.; Yin, Z.; Zhao, J.; Linga, P. Recovering natural gas from gas hydrates using horizontal wellbore. Energy Procedia 2017, 143, 780–785. [Google Scholar] [CrossRef]
- Feng, J.C.; Wang, Y.; Li, X.S.; Li, G.; Zhang, Y.; Chen, Z.Y. Effect of horizontal and vertical well patterns on methane hydrate dissociation behaviors in pilot-scale hydrate simulator. Appl. Energy 2015, 145, 69–79. [Google Scholar] [CrossRef]
- Feng, J.C.; Wang, Y.; Li, X.S.; Li, G.; Zhang, Y.; Chen, Z.Y. Entropy generation analysis of hydrate dissociation by depressurization with horizontal well in different scales of hydrate reservoirs. Energy 2017, 125, 62–71. [Google Scholar] [CrossRef]
- Yang, S.; Lang, X.; Wang, Y.; Wen, Y.; Fan, S. Numerical simulation of Class 3 hydrate reservoirs exploiting using horizontal well by depressurization and thermal co-stimulation. Energy Convers. Manag. 2014, 77, 298–305. [Google Scholar] [CrossRef]
- Reagan, M.; Moridis, G.J.; Reagan, M.T.; Zhang, K. The Use of Horizontal Wells in Gas Production from Hydrate Accumulations; Lawrence Berkeley National Lab. (LBNL): Berkeley, CA, USA, 2008. [Google Scholar]
- Li, B.; Li, X.-S.; Li, G.; Chen, Z.-Y. Evaluation of gas production from Qilian Mountain permafrost hydrate deposits in two-spot horizontal well system. Cold Reg. Sci. Technol. 2015, 109, 87–98. [Google Scholar] [CrossRef]
- Liu, Y.; Hou, J.; Chen, Z.; Bai, Y.; Su, H.; Zhao, E.; Li, G. Enhancing hot water flooding in hydrate bearing layers through a novel staged production method. Energy 2021, 217, 119319. [Google Scholar] [CrossRef]
- Liu, Y.; Hou, J.; Zhao, H.; Liu, X.; Xia, Z. Numerical simulation of simultaneous exploitation of geothermal energy and natural gas hydrates by water injection into a geothermal heat exchange well. Renew. Sustain. Energy Rev. 2019, 109, 467–481. [Google Scholar] [CrossRef]
- Feng, Y.; Chen, L.; Suzuki, A.; Kogawa, T.; Okajima, J.; Komiya, A.; Maruyama, S. Numerical analysis of gas production from reservoir-scale methane hydrate by depressurization with a horizontal well: The effect of permeability anisotropy. Mar. Pet. Geol. 2019, 102, 817–828. [Google Scholar] [CrossRef]
- Ma, X.; Sun, Y.; Guo, W.; Jia, R.; Li, B. Numerical simulation of horizontal well hydraulic fracturing technology for gas production from hydrate reservoir. Appl. Ocean Res. 2021, 112, 102674. [Google Scholar] [CrossRef]
- Xu, J. Productivity and Development Strategy for Fractured Well in Low Permeability Reservoirs. Master’s Thesis, China University of Petroleum (East China), Qingdao, China, 2013. [Google Scholar]
- Uddin, M.; Coombe, D.; Wright, F. Modeling of CO2-hydrate formation in geological reservoirs by injection of CO2 gas. J. Energy Resour. Technol. 2008, 130, 032502. [Google Scholar] [CrossRef]
- Kim, H.C.; Bishnoi, P.R.; Heidemann, R.A.; Rizvi, S.S. Kinetics of methane hydrate decomposition. Chem. Eng. Sci. 1987, 42, 1645–1653. [Google Scholar] [CrossRef]
- Gaddipati, M. Code Comparison of Methane Hydrate Reservoir Simulators Using CMG STARS. Master’s Thesis, West Virginia University, Morgantown, WV, USA, 2008. [Google Scholar]
- Yin, F.; Gao, Y.; Chen, Y.; Sun, B.; Li, S.; Zhao, D. Numerical investigation on the long-term production behavior of horizontal well at the gas hydrate production site in South China Sea. Appl. Energy 2022, 311, 118603. [Google Scholar] [CrossRef]
- Uddin, M.; Coombe, D.; Law, D.; Gunter, B. Numerical Studies of Gas Hydrate Formation and Decomposition in a Geological Reservoir. J. Energy Resour. Technol. 2008, 130, 032501. [Google Scholar] [CrossRef]
- Xu, J.; Qin, H.; Li, H.; Lu, C.; Li, S.; Wu, D. Enhanced gas production efficiency of class 1, 2, 3 hydrate reservoirs using hydraulic fracturing technique. Energy 2023, 263, 126003. [Google Scholar] [CrossRef]
- Li, S.; Li, S.; Zheng, R.; Li, Q.; Pang, W. Strategies for gas production from Class 2 hydrate accumulations by depressurization. Fuel 2021, 286, 119380. [Google Scholar] [CrossRef]
- Wilder, J.W.; Moridis, G.J.; Wilson, S.J.; Kurihara, M.; White, M.D.; Masuda, Y.; Anderson, B.J.; Collett, T.S.; Hunter, R.B.; Narita, H.; et al. An international effort to compare gas hydrate reservoir simulators. In Proceedings of the 6th International Conference on Gas Hydrates, Vancouver, BC, Canada, 6–10 July 2008; pp. 1–12. [Google Scholar]
- Zhong, X.; Pan, D.; Zhai, L.; Zhu, Y.; Zhang, H.; Zhang, Y.; Wang, Y.; Li, X.; Chen, C. Evaluation of the gas production enhancement effect of hydraulic fracturing on combining depressurization with thermal stimulation from challenging ocean hydrate reservoirs. J. Nat. Gas Sci. Eng. 2020, 83, 103621. [Google Scholar] [CrossRef]


| Parameter | Water Zone | Hydrate Zone |
|---|---|---|
| Permeability/mD | 10 | 10 |
| Porosity | 0.21 | 0.21 |
| Sg | 0 | 0 |
| Sh | 0 | 0.5 |
| Sw | 1 | 0.5 |
| Thickness/m | 2 | 8 |
| Initial temperature/°C | 7.55 (bottom layer) | |
| Initial pressure/kPa | 9000 (bottom layer) | |
Disclaimer/Publisher’s Note: The statements, opinions and data contained in all publications are solely those of the individual author(s) and contributor(s) and not of MDPI and/or the editor(s). MDPI and/or the editor(s) disclaim responsibility for any injury to people or property resulting from any ideas, methods, instructions or products referred to in the content. |
© 2023 by the authors. Licensee MDPI, Basel, Switzerland. This article is an open access article distributed under the terms and conditions of the Creative Commons Attribution (CC BY) license (https://creativecommons.org/licenses/by/4.0/).
Share and Cite
Sun, W.; Li, G.; Qin, H.; Li, S.; Xu, J. Enhanced Gas Production from Class II Gas Hydrate Reservoirs by the Multistage Fractured Horizontal Well. Energies 2023, 16, 3354. https://doi.org/10.3390/en16083354
Sun W, Li G, Qin H, Li S, Xu J. Enhanced Gas Production from Class II Gas Hydrate Reservoirs by the Multistage Fractured Horizontal Well. Energies. 2023; 16(8):3354. https://doi.org/10.3390/en16083354
Chicago/Turabian StyleSun, Wei, Guiwang Li, Huating Qin, Shuxia Li, and Jianchun Xu. 2023. "Enhanced Gas Production from Class II Gas Hydrate Reservoirs by the Multistage Fractured Horizontal Well" Energies 16, no. 8: 3354. https://doi.org/10.3390/en16083354