
Low Carbon Economic Dispatch of Integrated Energy System Considering Power-to-Gas Heat Recovery and Carbon Capture
Abstract
:
1. Introduction
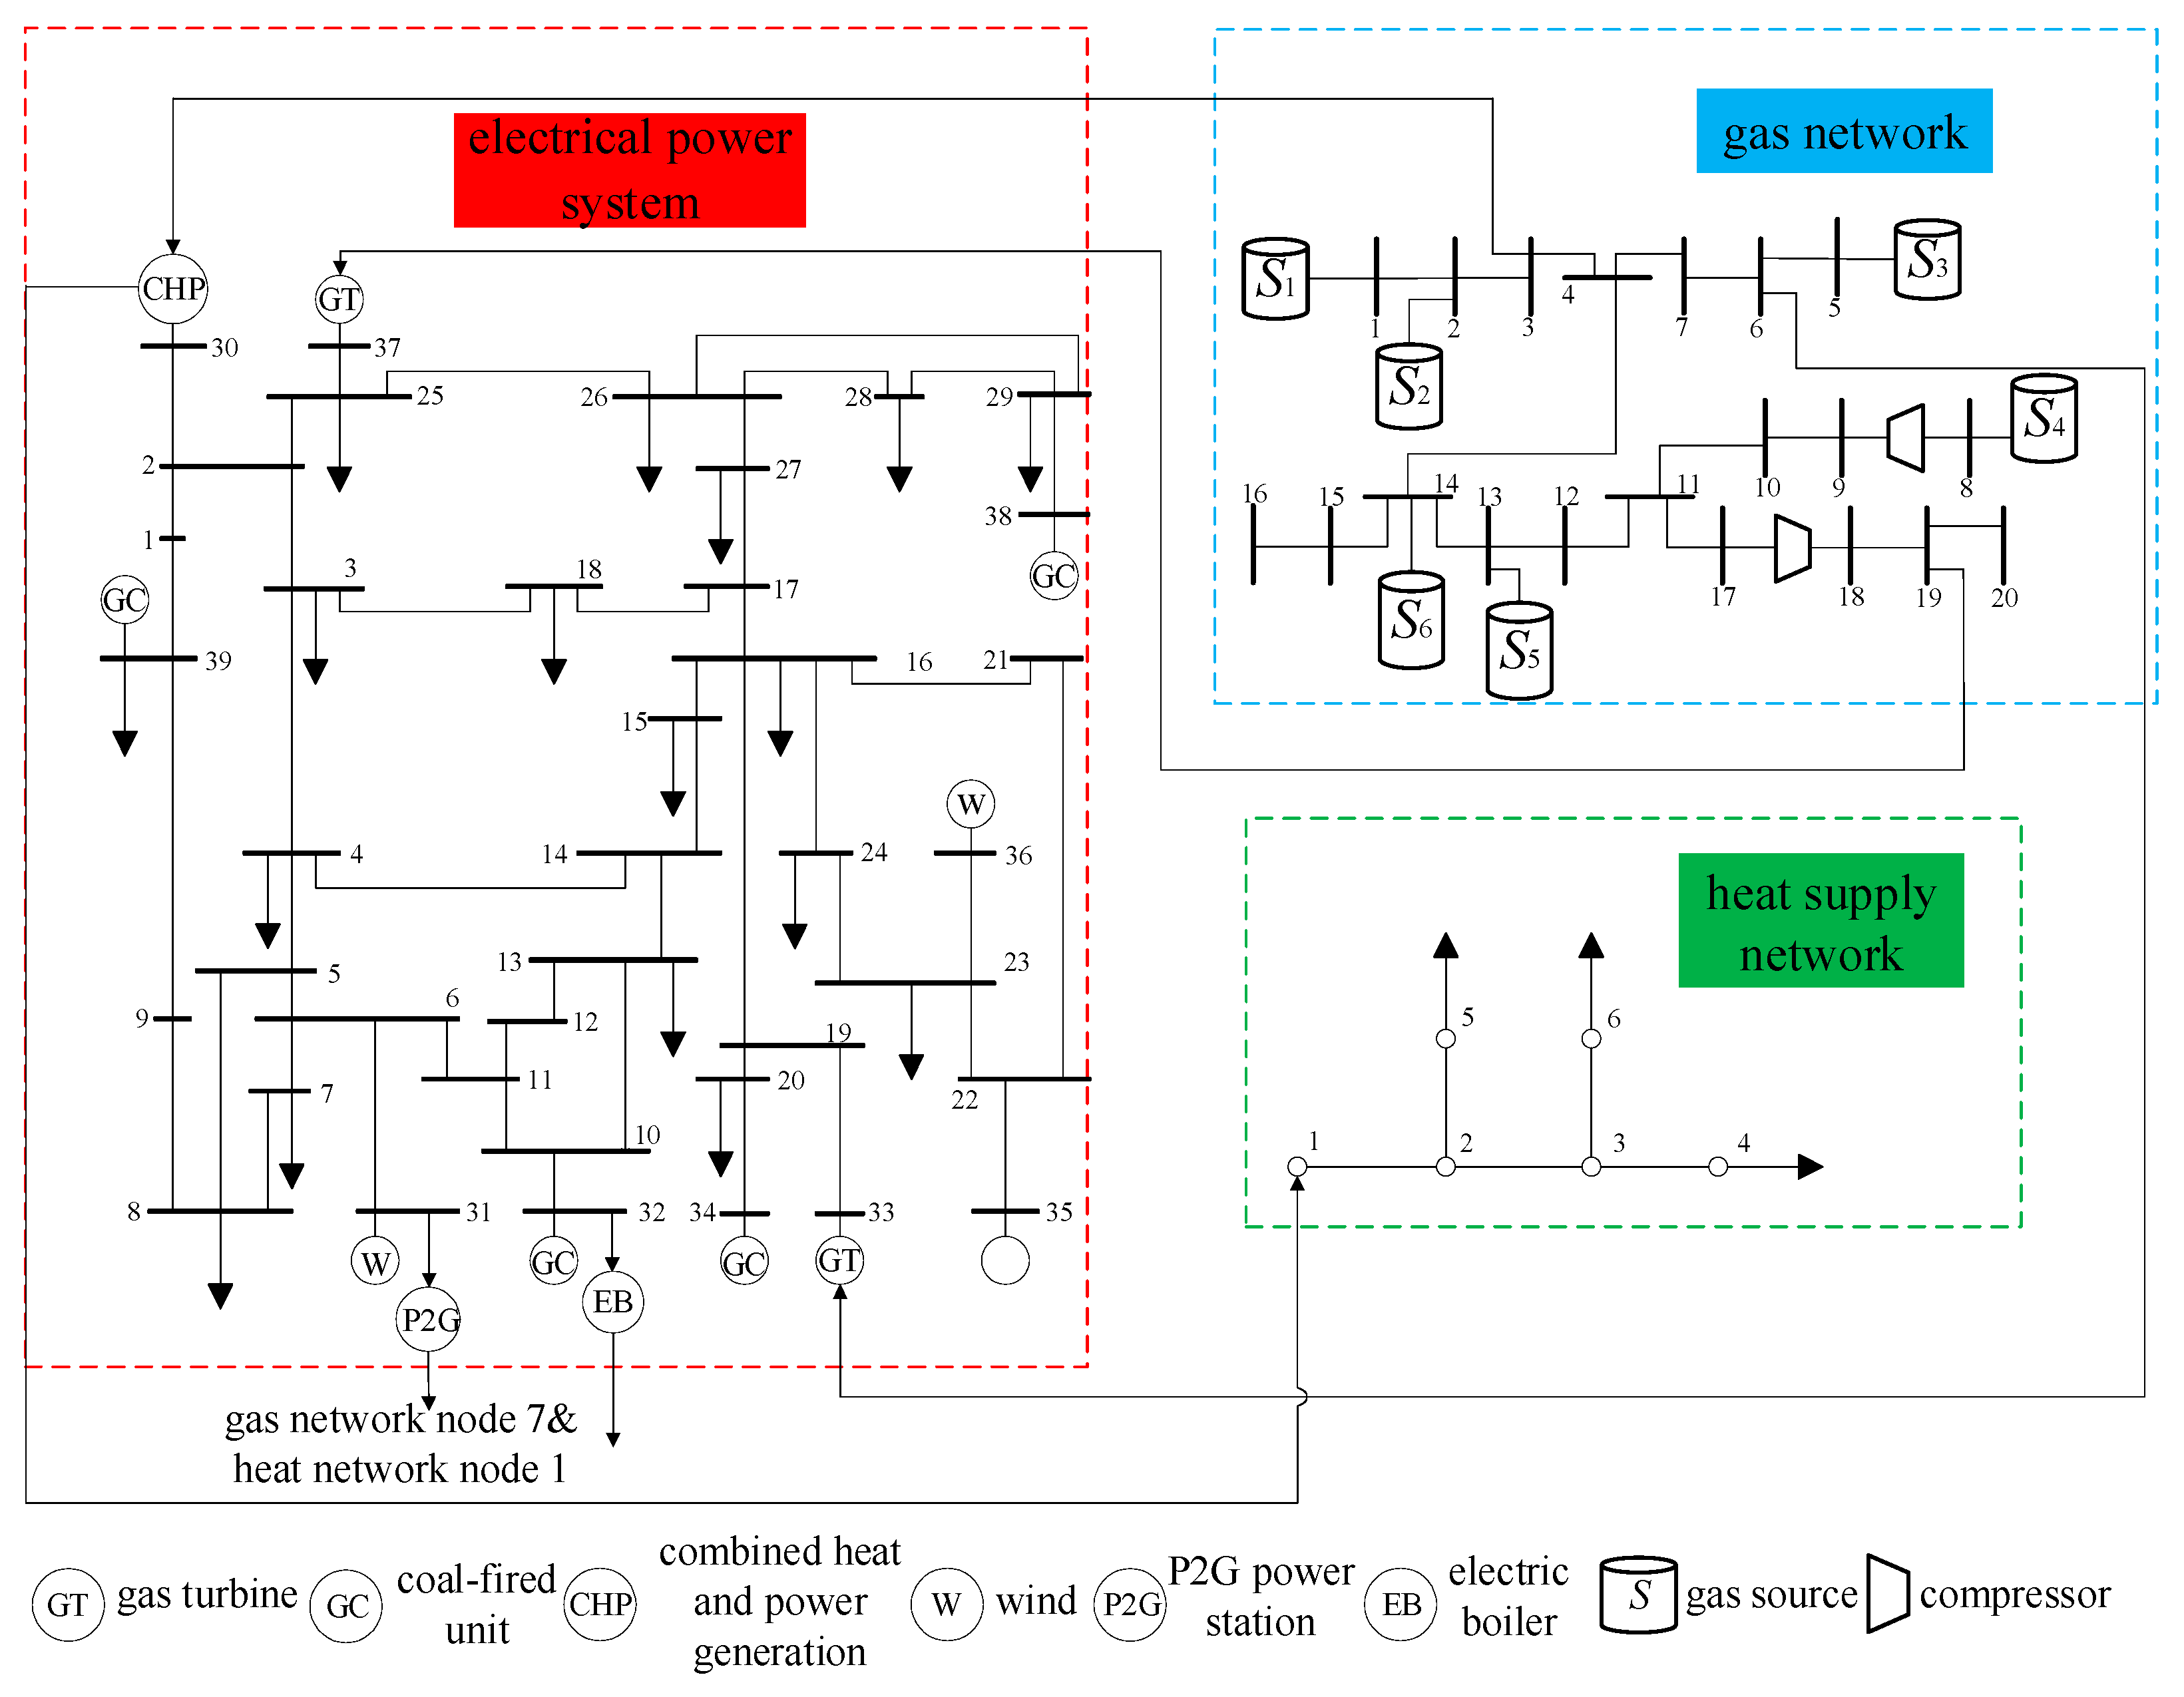
2. Electricity–Gas–Heat Integrated Energy System Model
2.1. P2G Model
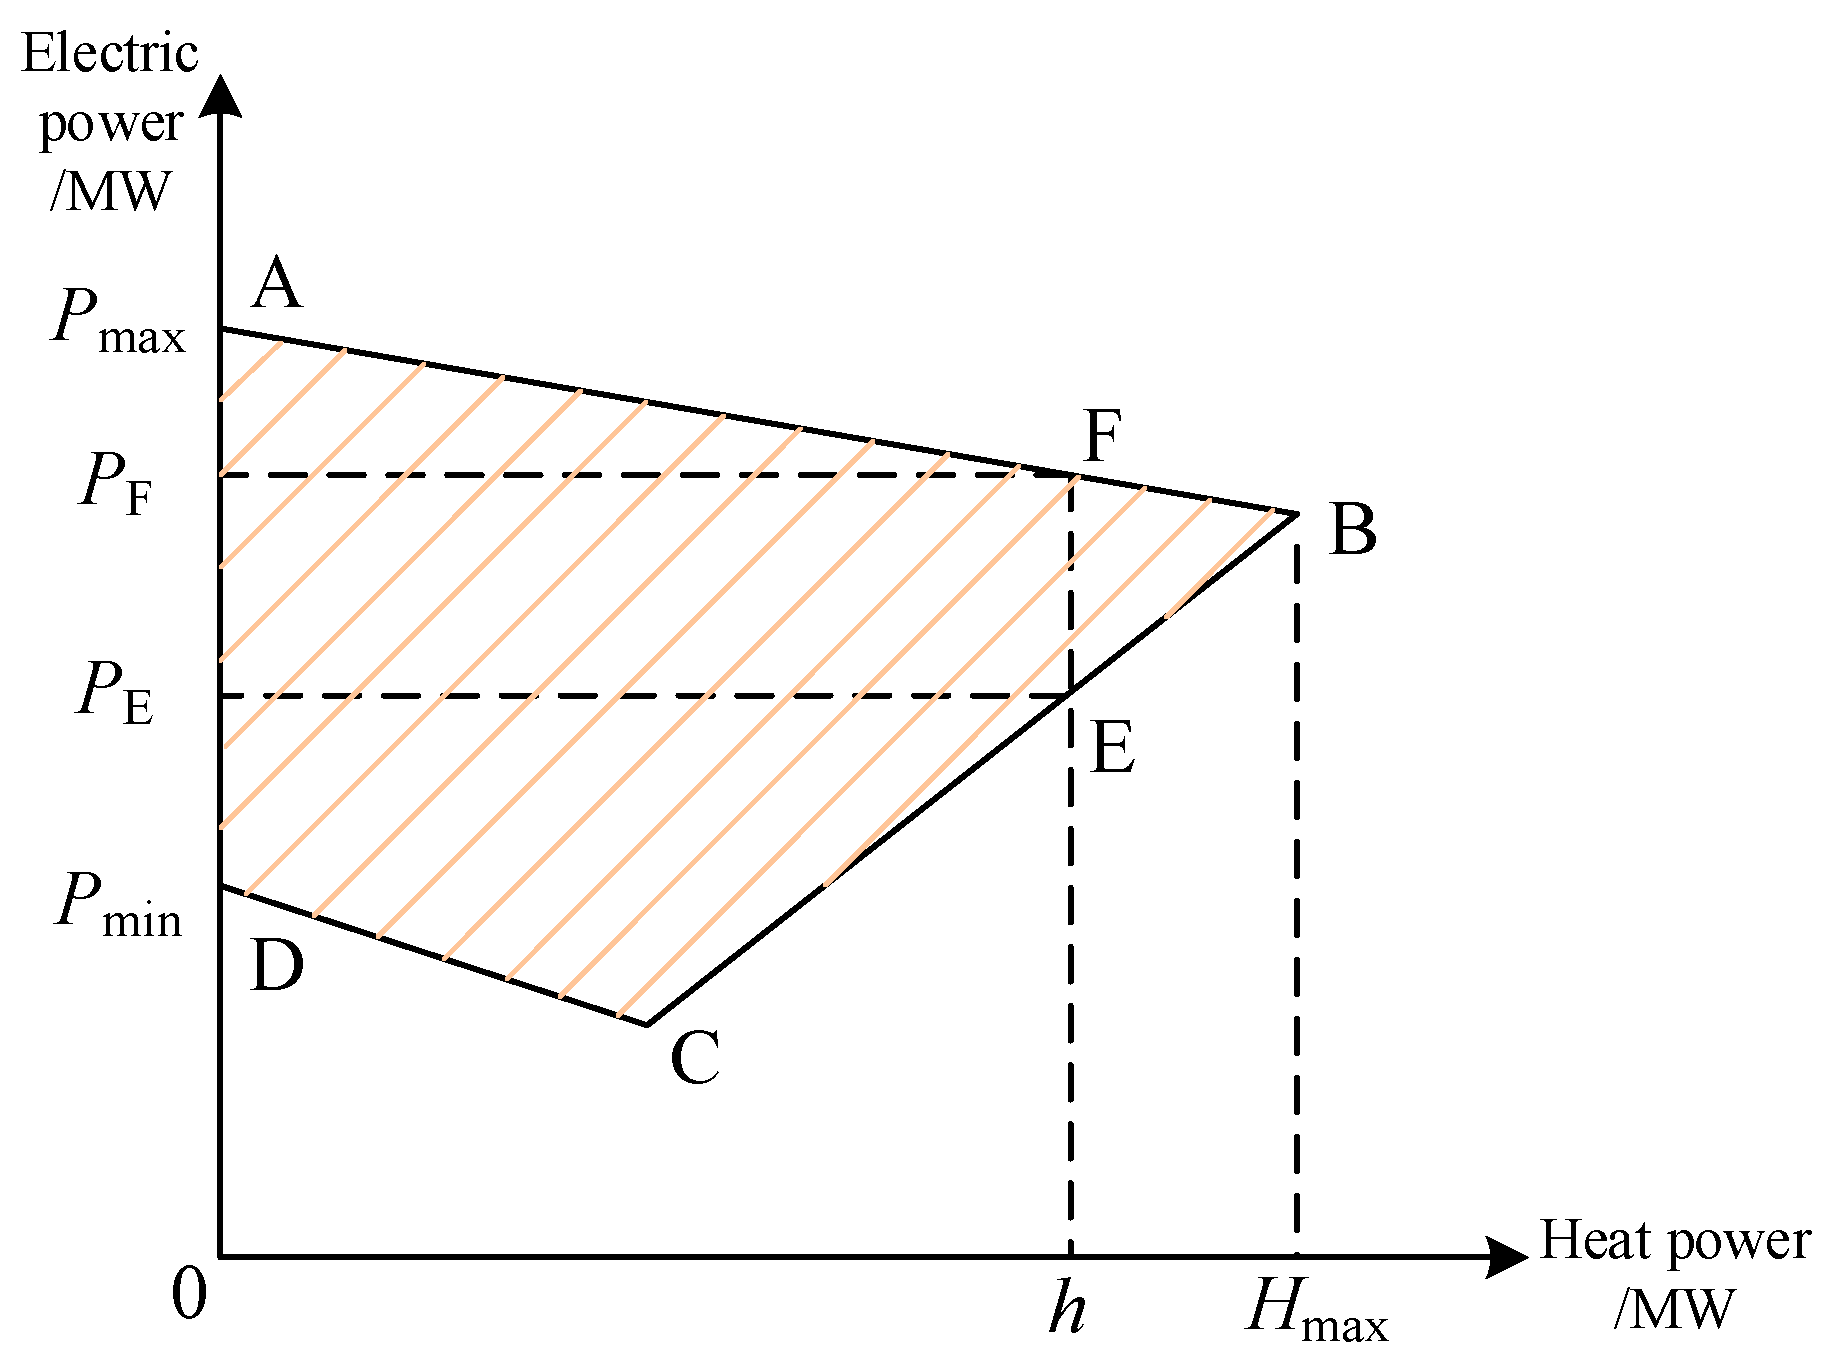
2.2. CHP Model
3. Low-Carbon Economic Dispatch of Integrated Energy System Considering P2G Heat Recovery and Carbon Capture
3.1. Carbon Capture System Model
3.2. Carbon Trading Model
3.2.1. Carbon Trading Quota
3.2.2. Ladder-Type Carbon Trading Mechanism
3.3. Objective Function
3.3.1. Operating Cost of Coal-Fired Units
3.3.2. Start and Stop Costs
3.3.3. Gas Purchase Cost
3.3.4. Cost of Wind Abandonment
3.3.5. Carbon Purchase Cost
3.4. Constraints
3.4.1. Power Flow Constraints
- (1)
- Constraints on node power balance
- (2)
- Constraints on upper and lower limits of unit power
- (3)
- Minimum start–stop time constraints
- (4)
- Constraint on unit climbing rate
- (5)
- DC power flow constraints
3.4.2. Natural Gas Network Constraints
- (1)
- Gas source point
- (2)
- Natural gas pipeline
- (3)
- Compressor
- (4)
- Natural gas flow balance
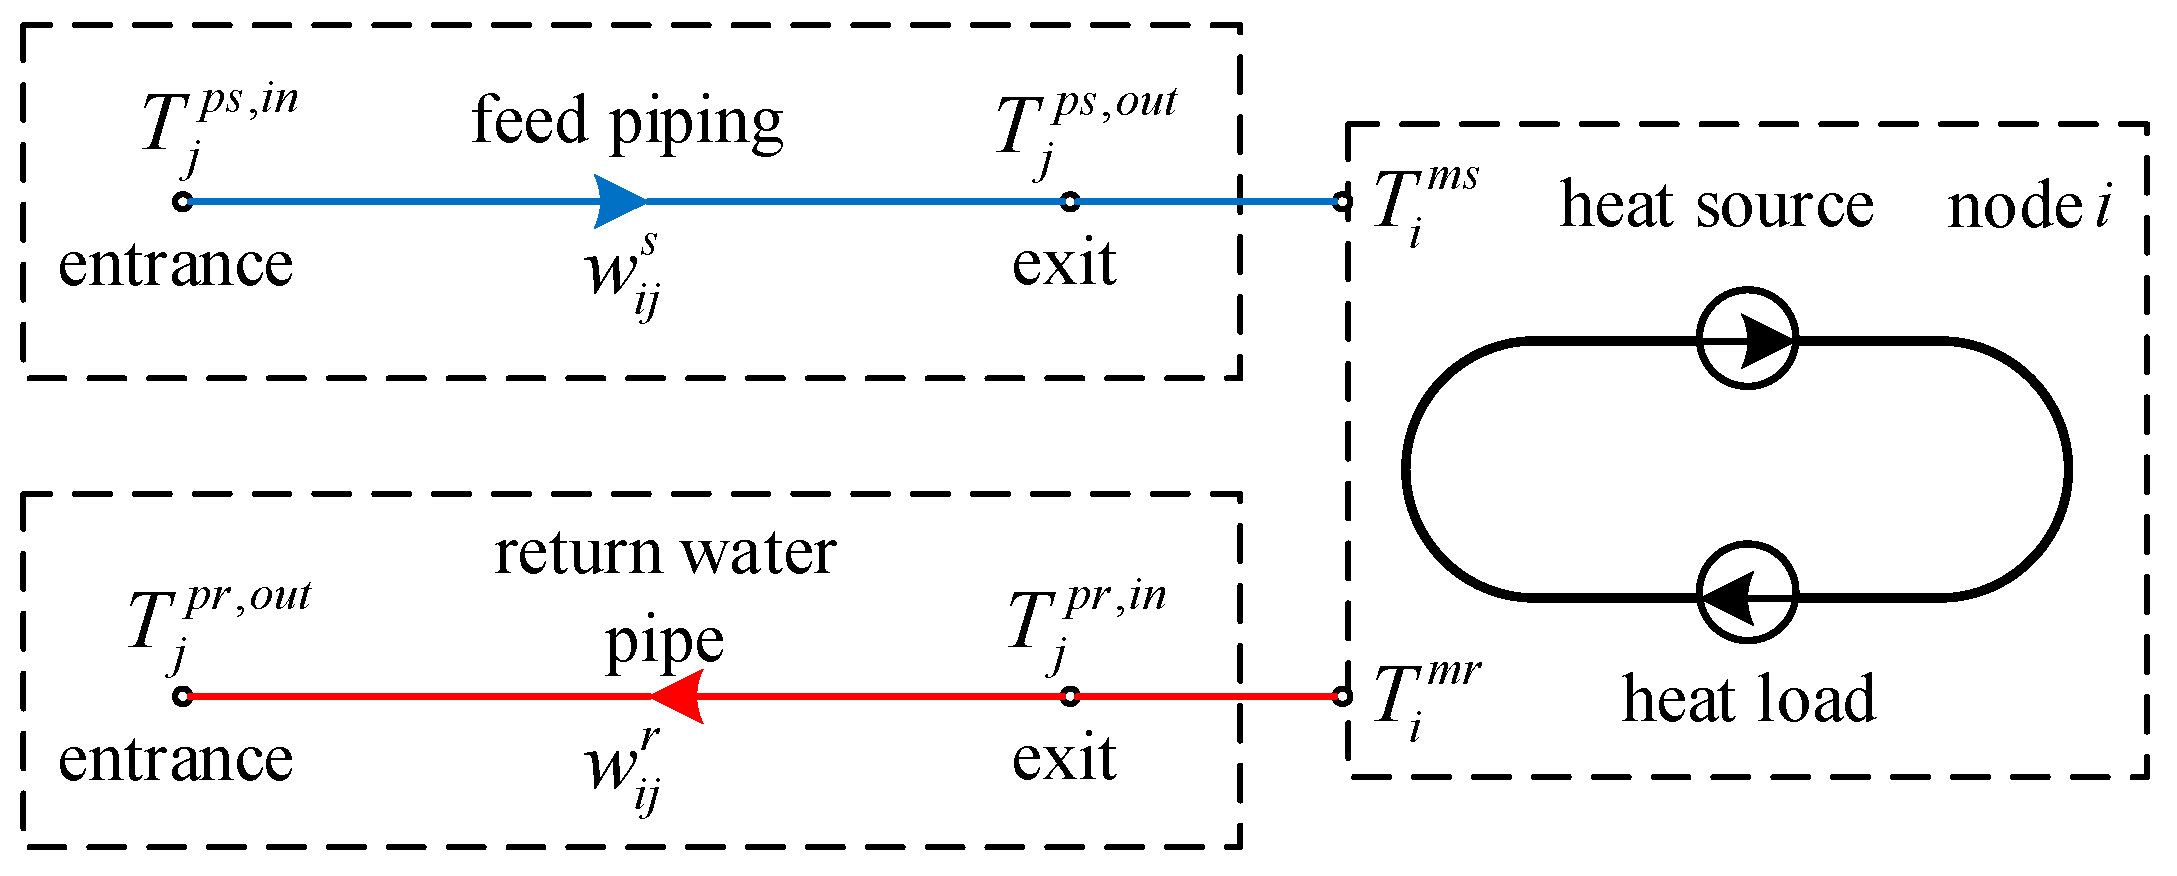
3.4.3. Heat System Constraints
- (1)
- Heat source model
- (2)
- Heat network model
- (3)
- Heat storage device model
- (4)
- Thermodynamic equilibrium
3.4.4. Carbon Capture Related Constraints
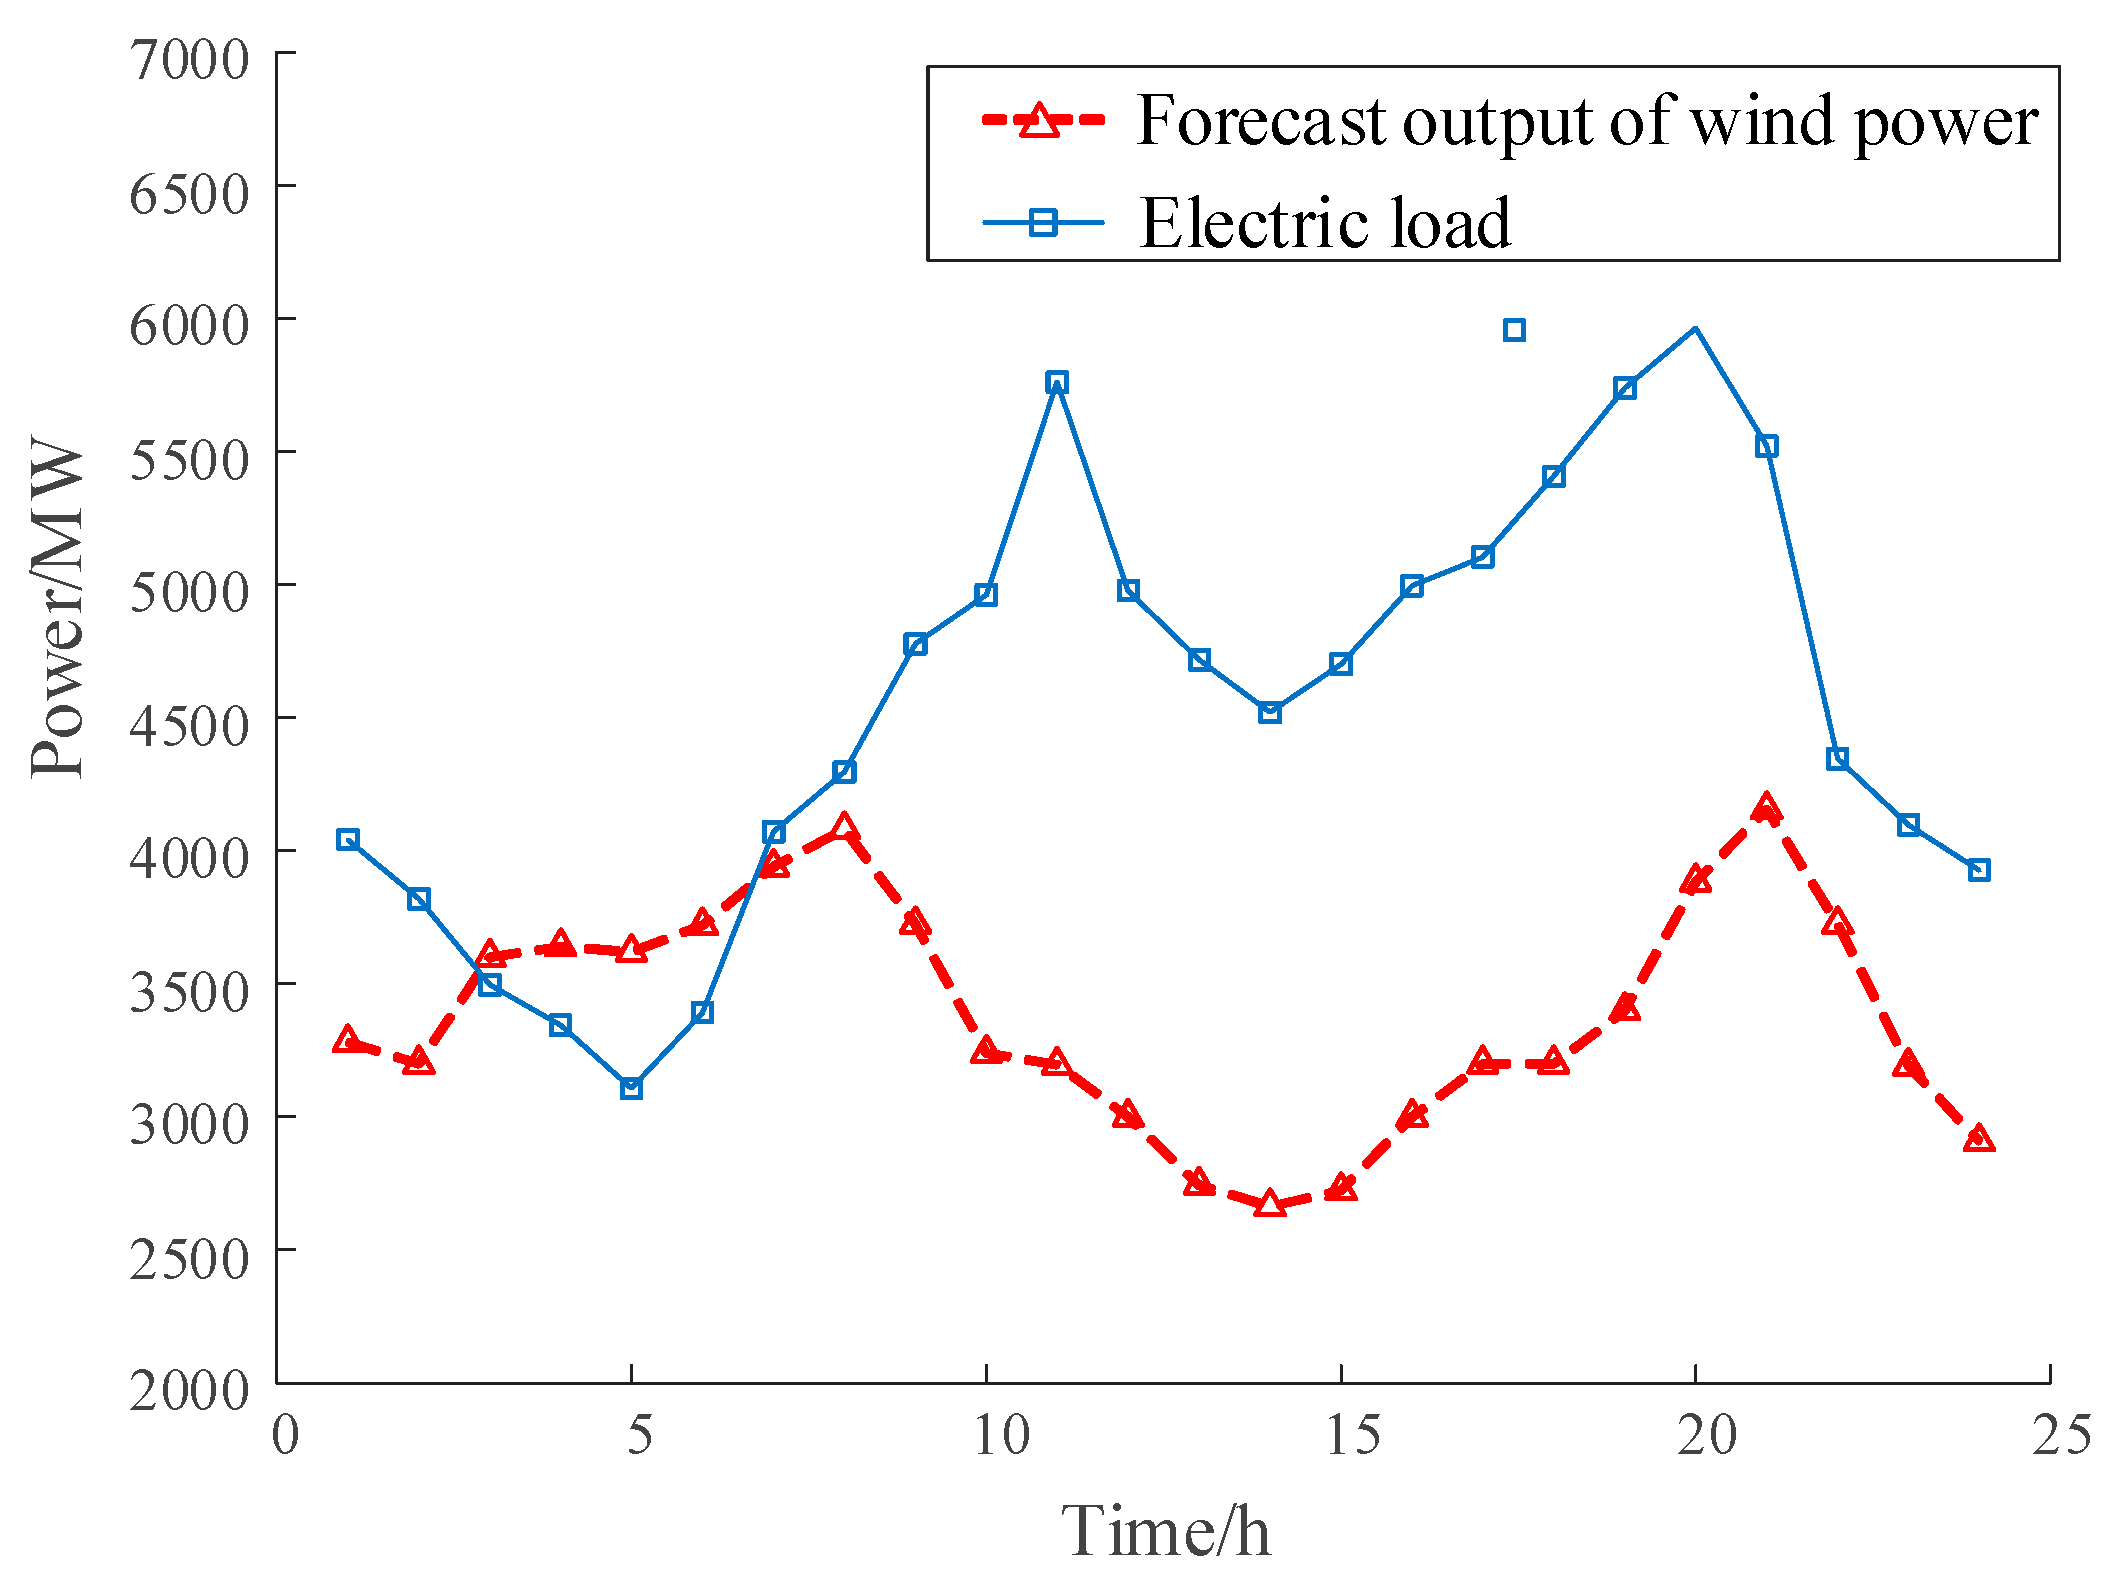
4. Case Study
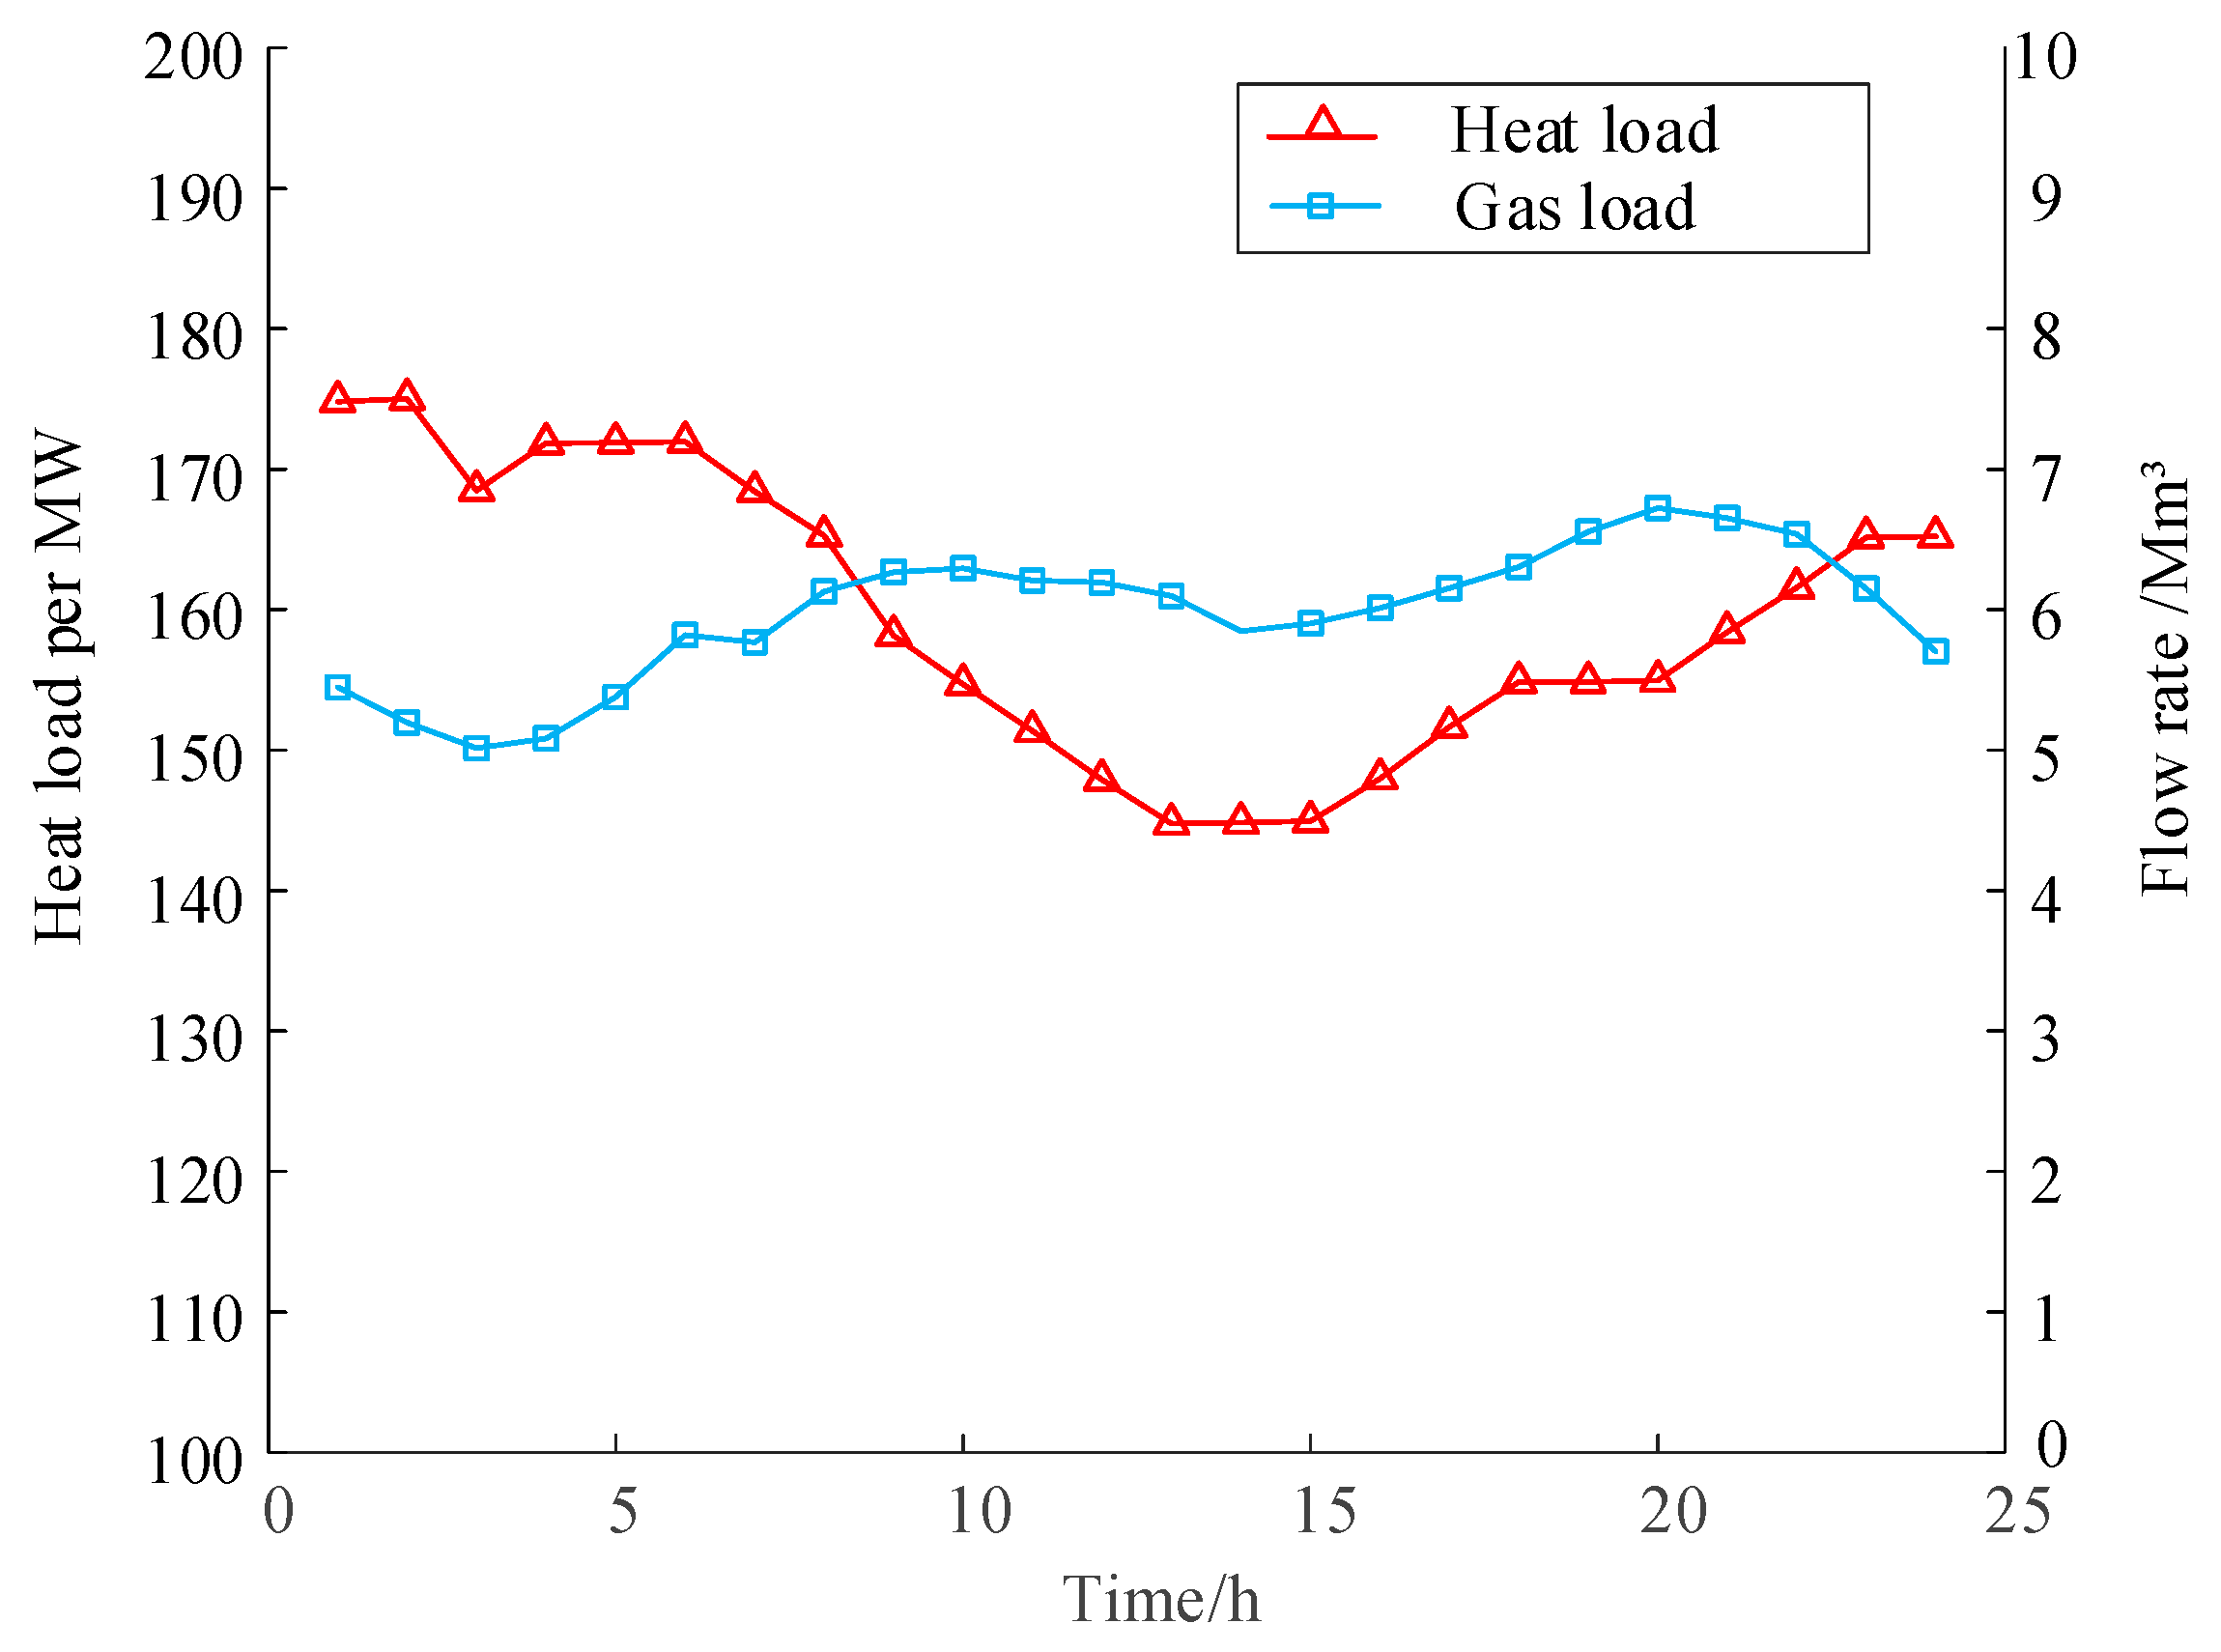
4.1. Case Setting
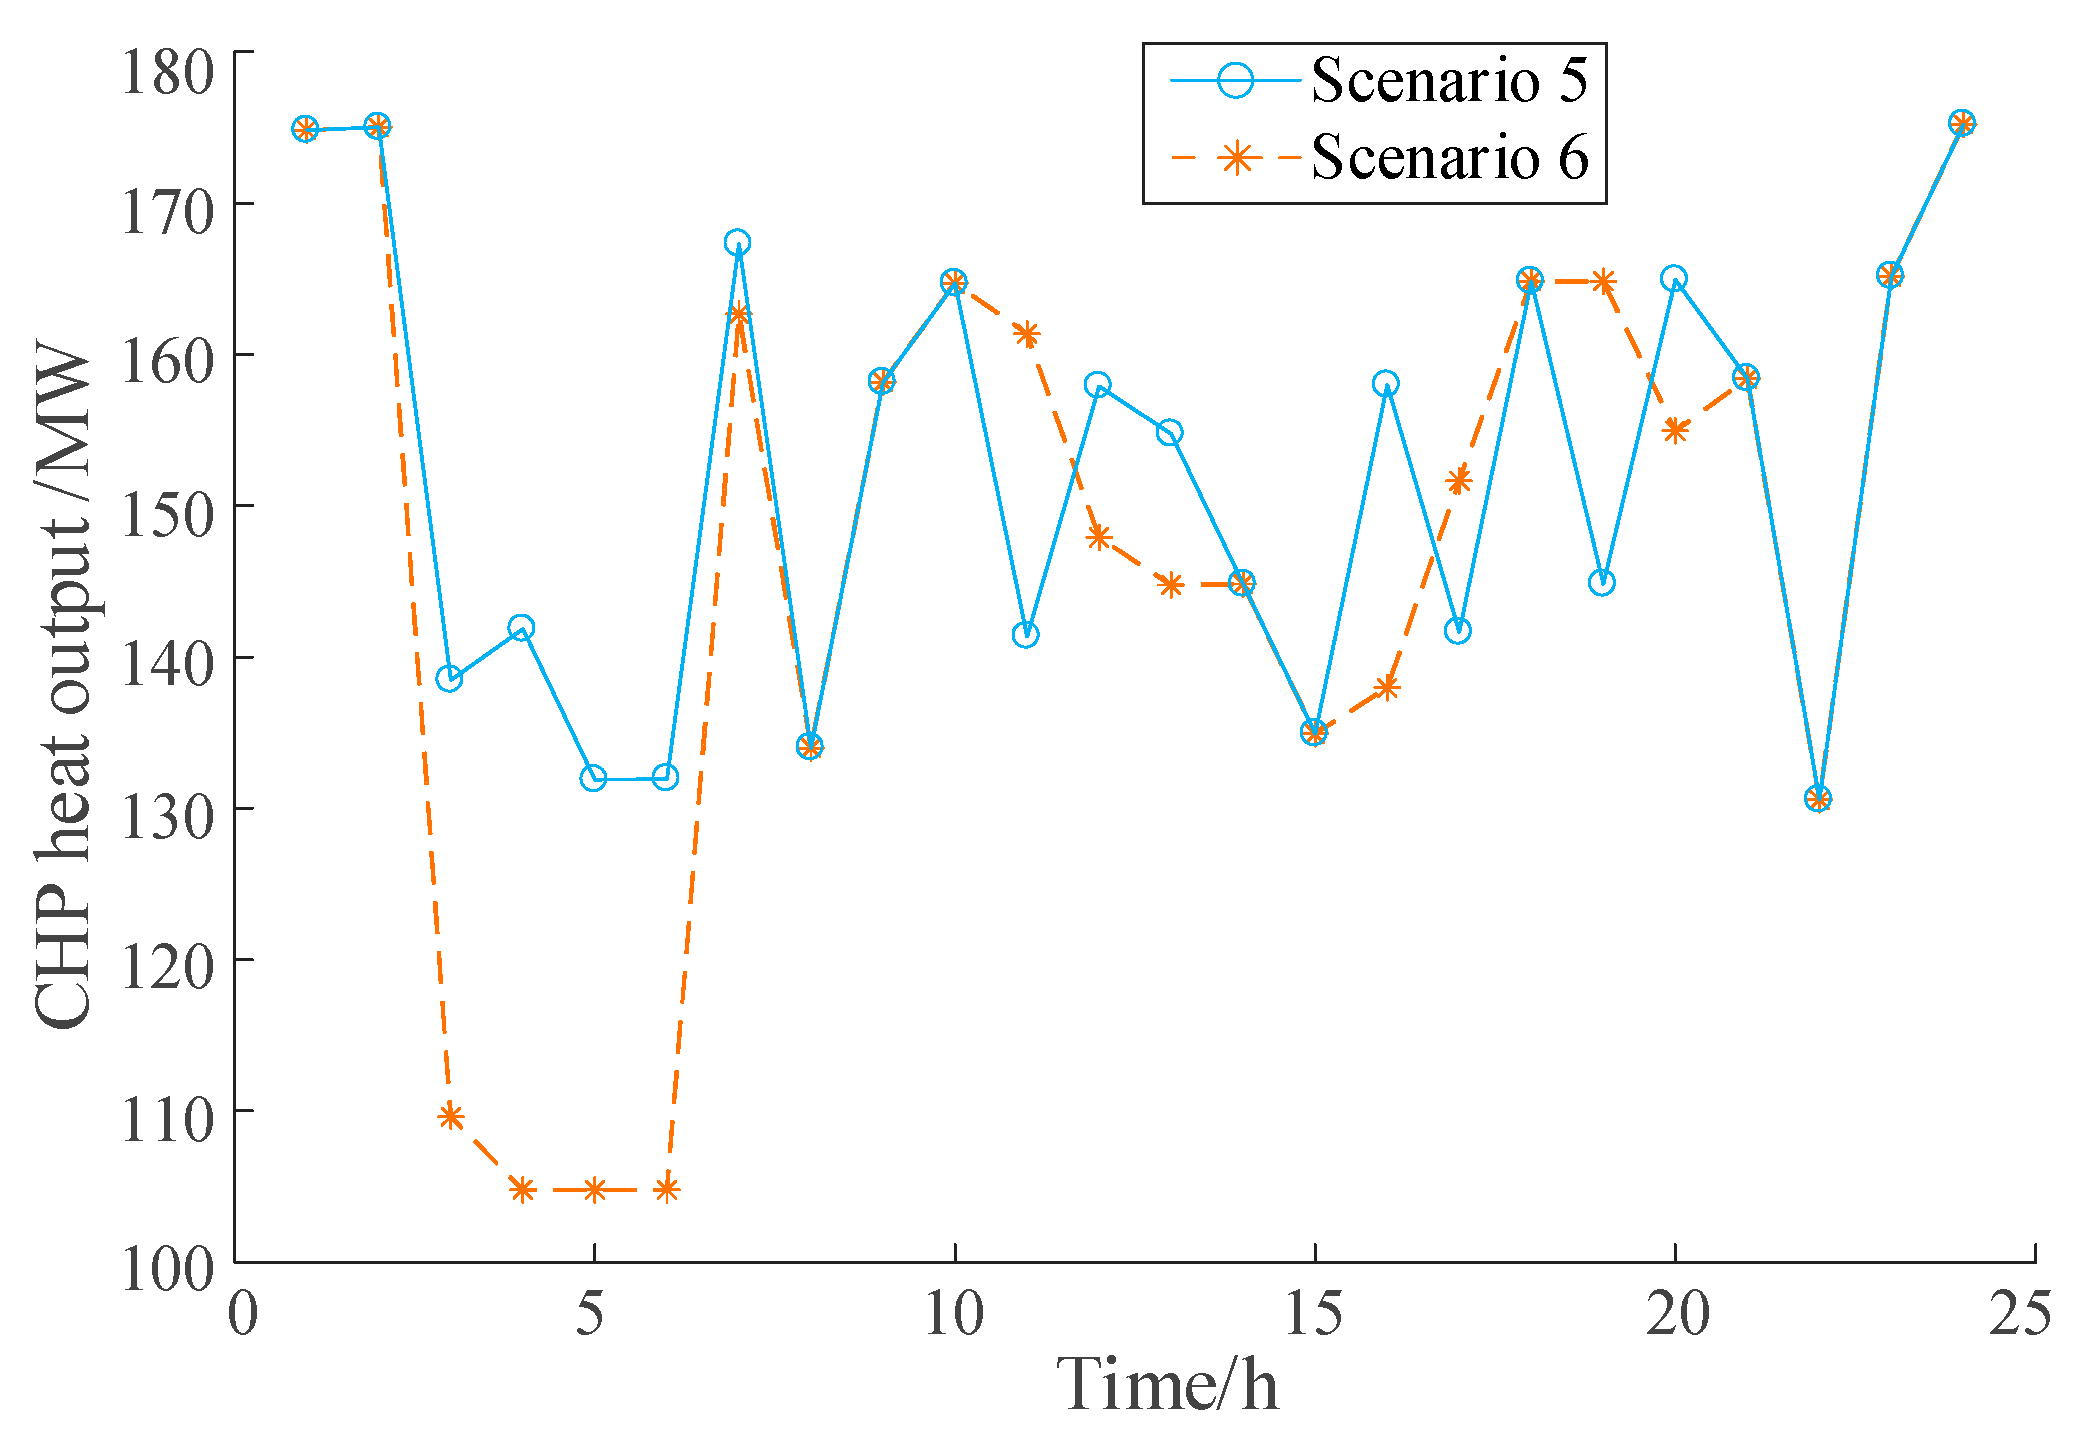
4.2. Simulation Results and Analysis
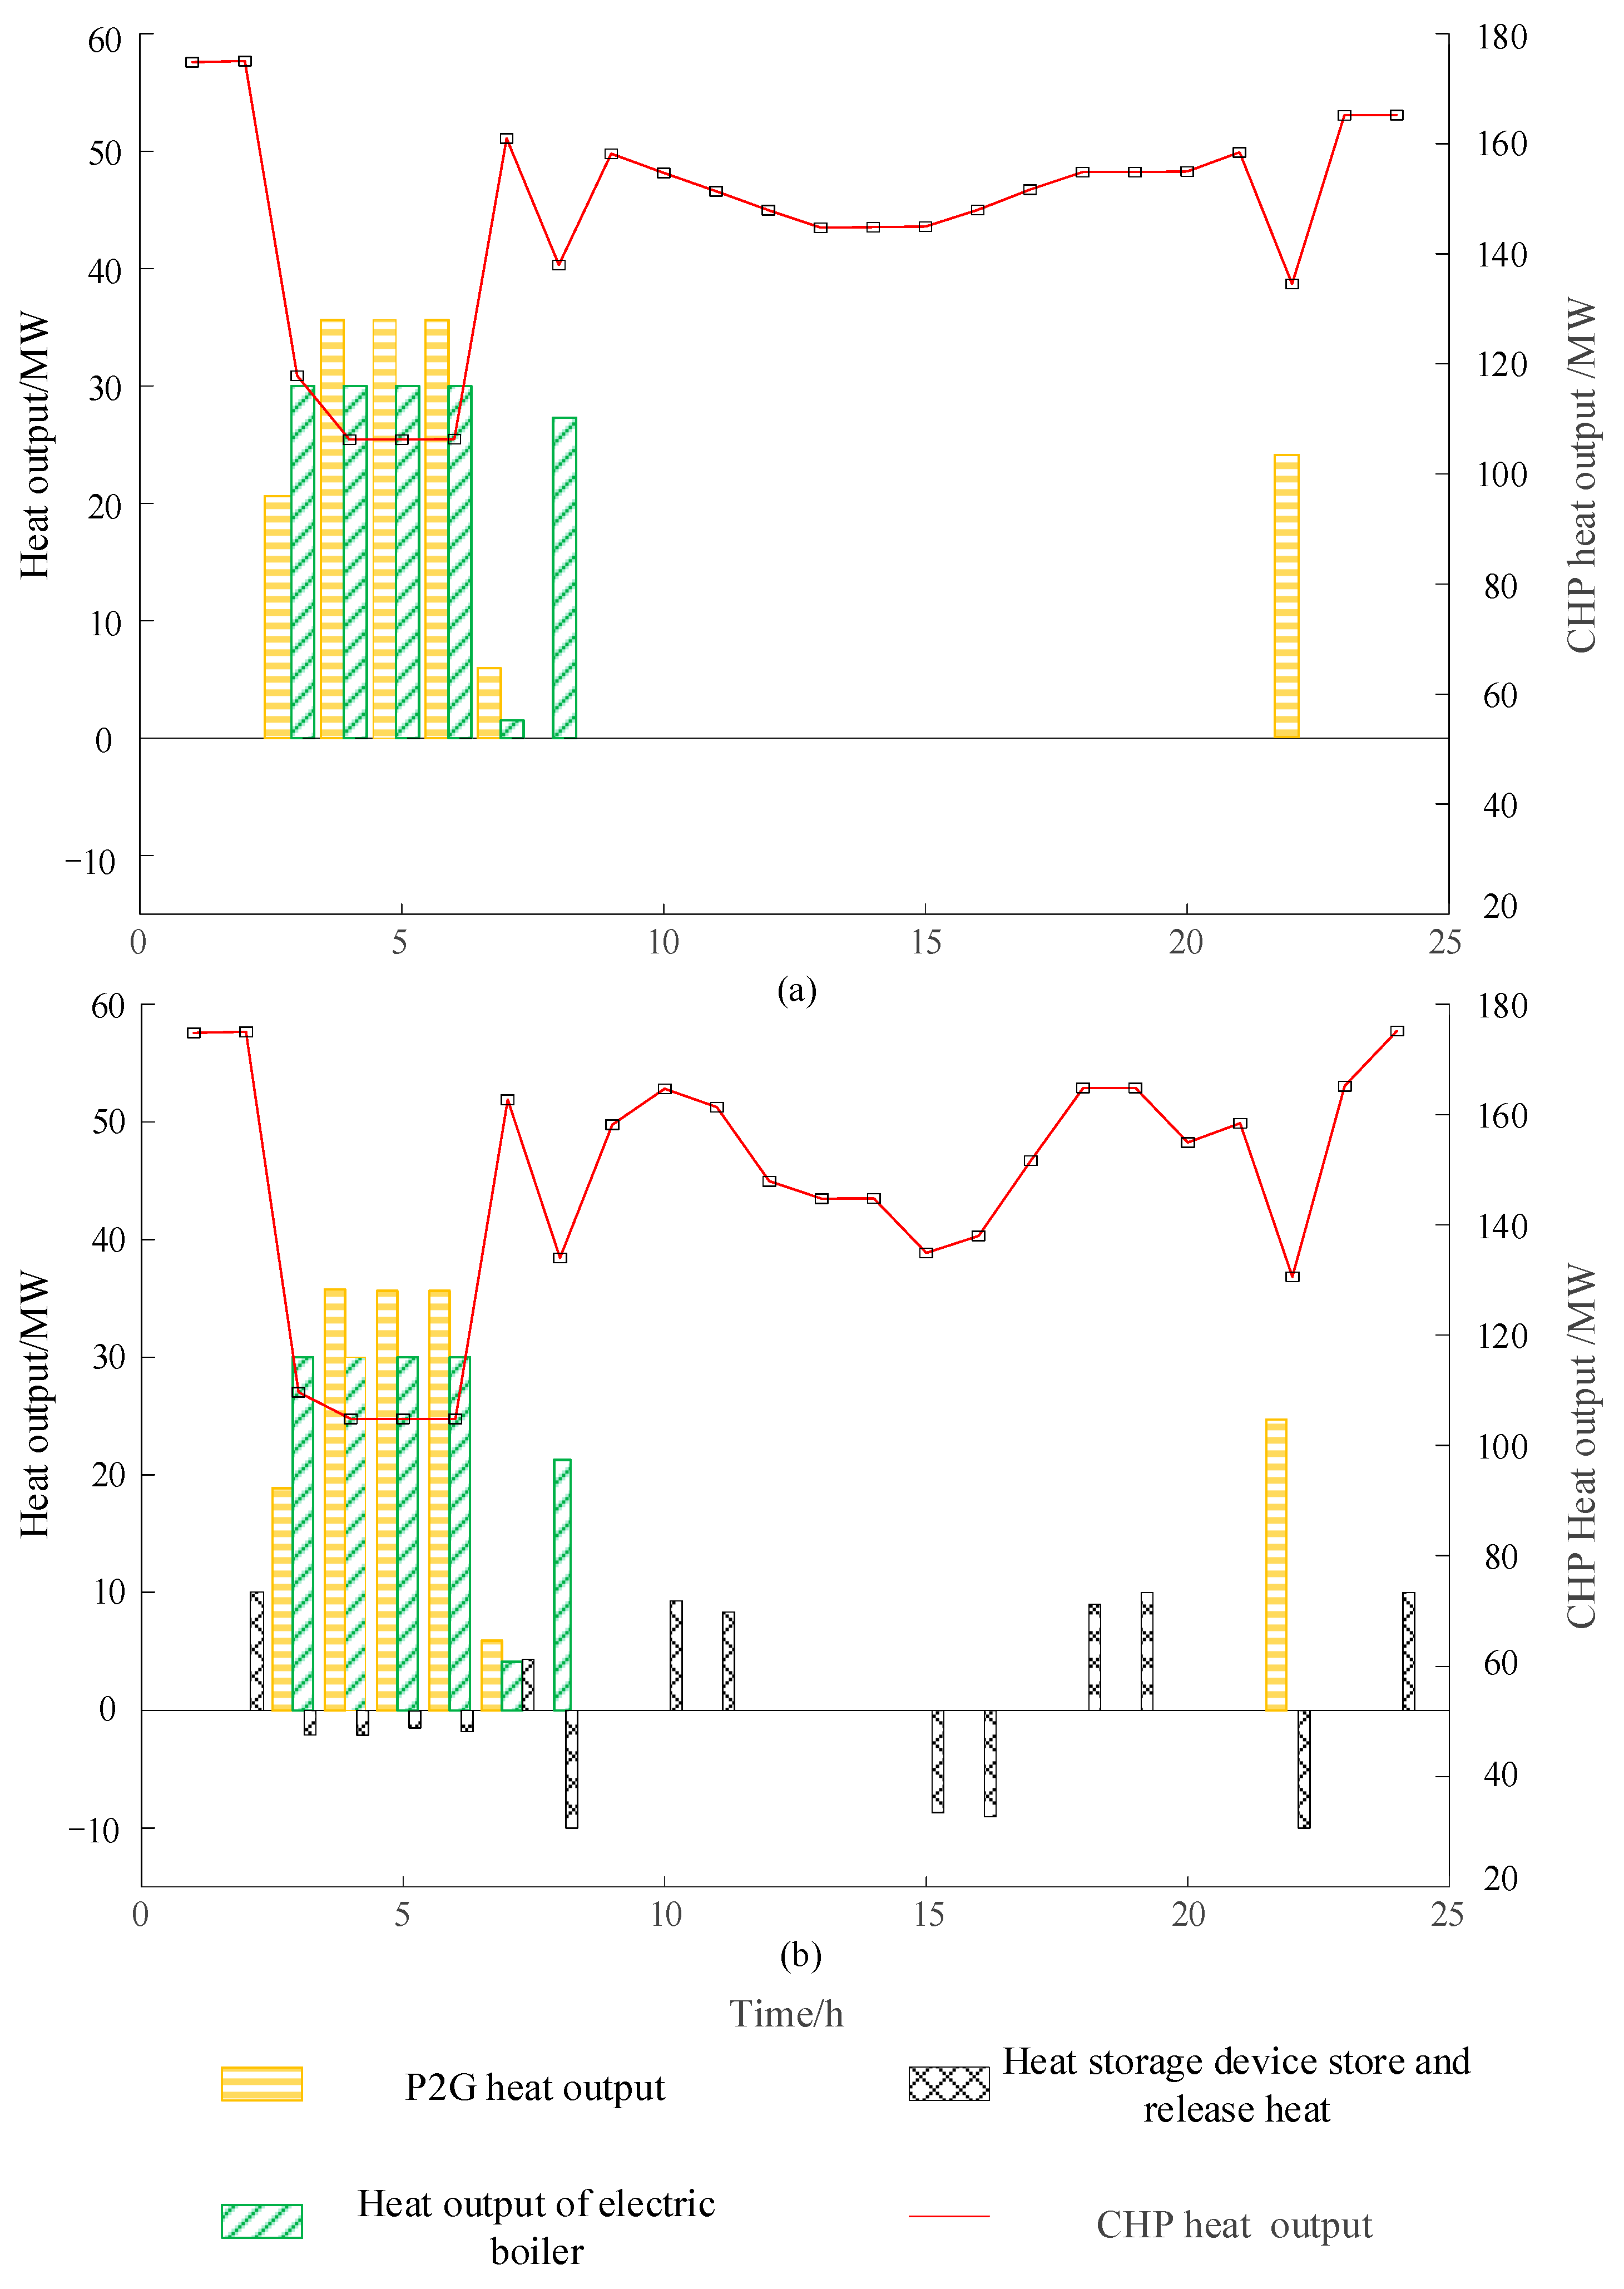
4.3. Influence of Heat Storage Device on Operation Results
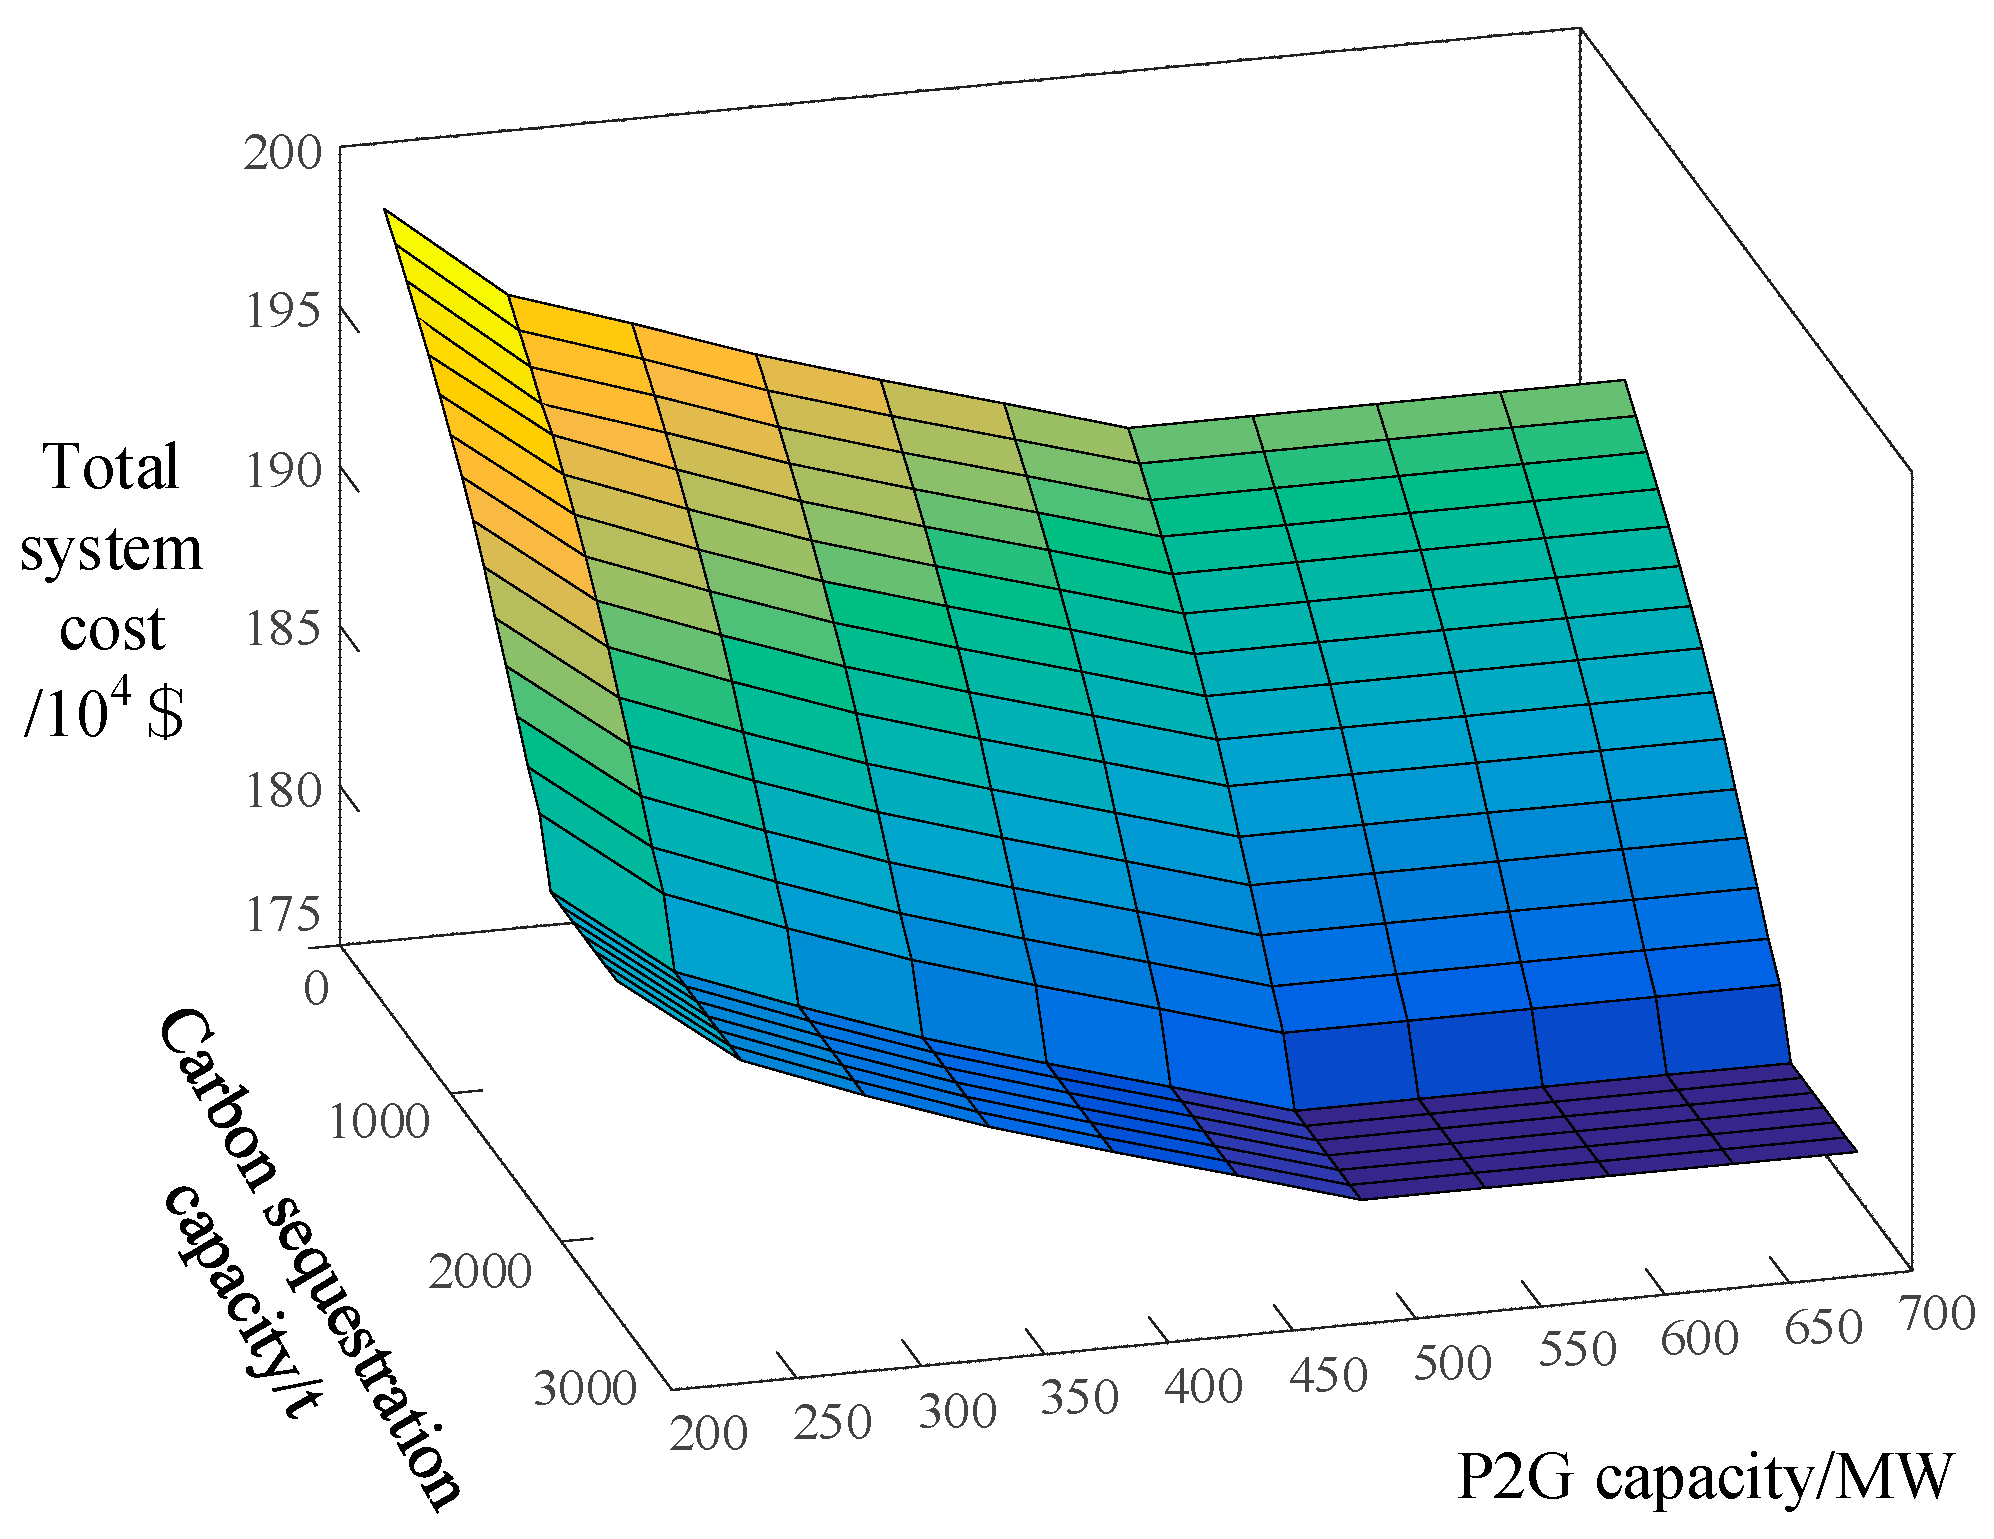
4.4. Influence of P2G Capacity and Carbon Sequestration Capacity on Operation Results
5. Discussion
6. Conclusions
- (1)
- Neither CCS nor P2G heat recovery alone can achieve the low-carbon and economic optimization of the system. Combining P2G heat recovery with CCS can effectively improve the system’s wind power consumption and reduce CO2 emissions.
- (2)
- Considering the heat storage device, the operating flexibility of the CHP unit can be improved, and the total operating cost of the system can be reduced.
- (3)
- The larger the capacity of P2G and carbon sequestration capacity is not better. The wind power that P2G can absorb is limited. When its capacity is higher than 500 MW, the total cost of the system will not change. When carbon sequestration capacity is increased by 1900 t, the excess CO2 that is not used to produce methane can be sequestered by means of carbon sequestration. Although increasing carbon sequestration capacity can effectively reduce carbon trading costs, its high carbon sequestration costs cannot be ignored.
Author Contributions
Funding
Data Availability Statement
Conflicts of Interest
References
- Wang, T.; Wang, X.; Gong, Y.; Jiang, C.; Xiong, F.; Li, L.; Zhao, Y. Initial allocation of carbon emission permits in power systems. J. Mod. Power Syst. Clean Energy 2017, 5, 239–247. [Google Scholar] [CrossRef] [Green Version]
- Li, Y.; Wang, C.; Li, G.; Wang, J.; Zhao, D.; Chen, C. Improving operational flexibility of integrated energy system with uncertain renewable generations considering thermal inertia of buildings. Energy Convers. Manag. 2020, 207, 112526. [Google Scholar] [CrossRef] [Green Version]
- Fan, F.; Zhang, R.; Xu, Y.; Ren, S. Robustly Coordinated Operation of an Emission-free Microgrid with Hybrid Hydrogen-Battery Energy Storage. CSEE J. Power Energy Syst. 2022, 8, 11. [Google Scholar]
- Schneider, L.; Kotter, E. The geographic potential of Power-to-Gas in a German model region—Trier-Amprion 5. J. Energy Stor. 2015, 1, 1–6. [Google Scholar] [CrossRef]
- Ang, X.; Shen, X.; Guo, Q.; Sun, H. Two-stage planning for electricity-gas coupled integrated energy system with CCUS considering carbon tax and price uncertainty. IEEE Trans. Power Syst. 2021, 1–13. [Google Scholar] [CrossRef]
- He, C.; Liu, T.; Wu, L.; Shahidehpour, M. Robust coordination of interdependent electricity and natural gas systems in day-ahead scheduling for facilitating volatile renewable generations via power-to-gas technology. Mod. Power Syst. Clean. Energy 2017, 5, 375–388. [Google Scholar] [CrossRef] [Green Version]
- Wang, Y.; Qiu, J.; Tao, Y.; Zhang, X.; Wang, G. Low-carbon oriented optimal energy dispatch in coupled natural gas and electricity systems. Appl. Energy 2020, 280, 115948. [Google Scholar] [CrossRef]
- Zhang, Y.; Zheng, F.; Shu, S.; Le, J.; Zhu, S. Distributionally robust optimization scheduling of electricity and natural gas integrated energy system considering confidence bands for probability density functions. Int. J. Electr. Power Energy Syst. 2020, 123, 106321. [Google Scholar] [CrossRef]
- He, C.; Wu, L.; Liu, T.; Shahidehpour, M. Robust co-optimization scheduling of electricity and natural gas systems via ADMM. IEEE Trans. Sustain. Energy 2016, 8, 658–670. [Google Scholar] [CrossRef]
- Zeng, Z.; Ding, T.; Xu, Y.; Yang, Y.; Dong, Z. Reliability evaluation for integrated power-gas systems with power-to-gas and gas storages. IEEE Trans. Power Syst. 2020, 35, 571–583. [Google Scholar] [CrossRef]
- Wang, C.; Gao, R.; Wei, W.; Shafie-Khah, M.; Bi, T.; Catalao, J.P.S. Risk-based distributionally robust optimal gas-power flow with wasserstein distance. IEEE Trans. Power Syst. 2018, 34, 2190–2204. [Google Scholar] [CrossRef]
- Wang, X.; Huang, W.; Wei, W.; Tai, N.; Huang, Y. Day-ahead optimal economic dispatching of integrated port energy systems considering hydrogen. IEEE Trans. Ind. Appl. 2021, 58, 2619–2629. [Google Scholar] [CrossRef]
- Götz, M.; Lefebvre, J.; Mörs, F.; Koch, A.; Graf, F.; Bajohr, S.; Reimert, R.; Kolb, T. Renewable power-to-gas: A technological and economic review. Renew. Energy 2016, 85, 1371–1390. [Google Scholar] [CrossRef] [Green Version]
- Alizad, E.; Rastegar, H.; Hasanzad, F. Dynamic planning of Power-to-Gas integrated energy hub considering demand response programs and future market conditions. Int. J. Electr. Power Energy Syst. 2022, 143, 108503. [Google Scholar] [CrossRef]
- Mansouri, S.; Nematbakhsh, E.; Ahmarinejad, A.; Jordehi, A.; Javadi, M.; Matin, S. A Multi-objective dynamic framework for design of energy hub by considering energy storage system, power-to-gas technology and integrated demand response program. J. Energy Storage 2022, 50, 104206. [Google Scholar] [CrossRef]
- Chauvy, R.; Dubois, L.; Thomas, D.; De Guy, W. Environmental impacts of the production of synthetic natural gas from industrial carbon dioxide. Sustain. Prod. Consum. 2022, 30, 301–315. [Google Scholar] [CrossRef]
- Hosseini, S.; Ahmarinejad, A.; Tabrizian, M.; Bidgoli, M. Resilience enhancement of integrated electricity-gas-heating networks through automatic switching in the presence of energy storage systems. J. Energy Storage 2022, 47, 103662. [Google Scholar] [CrossRef]
- Lee, H.; Lee, J.; Koo, Y. Economic impacts of carbon capture and storage on the steel industry–A hybrid energy system model incorporating technological change. Appl. Energy 2022, 317, 119208. [Google Scholar] [CrossRef]
- Ali, A.; Nayereh, H.; Jurandir, Y. Carbon capture and storage energy consumption and performance optimization using metamodels and response surface methodology. J. Energy Resour. Technol. 2022, 144, 050901. [Google Scholar]
- Reddy, S.; Panwar, L.; Panigrahi, B.; Kumar, R. Modeling of carbon capture technology attributes for unit commitment in emission-constrained environment. IEEE Trans. Power Syst. 2016, 32, 662–671. [Google Scholar] [CrossRef]
- Akbari, A.; Mohammadi, B.; Zare, K.; Khalili, T.; Bidram, A. Economic-emission dispatch problem in power systems with carbon capture power plants. IEEE Trans. Ind. Appl. 2021, 57, 3341–3351. [Google Scholar] [CrossRef]
- Lou, S.; Lu, S.; Wu, Y.; Kirschen, S. Optimizing spinning reserve requirement of power system with carbon capture plants. IEEE Trans. Power Syst. 2015, 30, 1056–1063. [Google Scholar] [CrossRef]
- Sunghoon, L.; Jin-Kuk, K. Process-integrated design of a sub-ambient membrane process for CO2 removal from natural gas power plants. Appl. Energy 2020, 260, 114255. [Google Scholar]
- Stefania, M.; Laura, P. Operating the CO2 absorption plant in a post-combustion unit in flexible mode for cost reduction. Chem. Eng. Res. Des. 2019, 147, 604–614. [Google Scholar]
- Du, Y.; Gao, T.; Rochelle, G.; Bhown, A. Zero- and negative-emissions fossil-fired power plants using CO2 capture by conventional aqueous amines. Int. J. Greenh. Gas Control. 2021, 111, 103473. [Google Scholar] [CrossRef]
- Akinola, T.; Oko, E.; Wang, M. Study of CO2 removal in natural gas process using mixture of ionic liquid and MEA through process simulation. Fuel 2019, 236, 135–146. [Google Scholar] [CrossRef] [Green Version]
- Stefania, M.; Laura, P. Fixed and Capture Level Reduction operating modes for carbon dioxide removal in a Natural Gas Combined Cycle power plant. J. Clean. Prod. 2020, 254, 120016. [Google Scholar]
- Yuan, Y.; Gary, R. CO2 absorption rate and capacity of semi-aqueous piperazine for CO2 capture. Int. J. Greenh. Gas Control. 2019, 85, 182–186. [Google Scholar] [CrossRef]
- Liu, E.; Lu, X.; Wang, D. A Systematic Review of Carbon Capture, Utilization and Storage: Status, Progress and Challenges. Energies 2023, 16, 2865. [Google Scholar] [CrossRef]
- Galina, N.; Arce, G.; Maroto-Valer, M.; Ávila, I. Experimental Study on Mineral Dissolution and Carbonation Efficiency Applied to pH-Swing Mineral Carbonation for Improved CO2 Sequestration. Energies 2023, 16, 2449. [Google Scholar] [CrossRef]
- Bielka, P.; Kuczyński, S.; Nagy, S. CO2 Compression and Dehydration for Transport and Geological Storage. Energies 2023, 16, 1804. [Google Scholar] [CrossRef]
- Tanja, S.; Jochen, G.; Markus, R.; Tobias, R. Methanation of CO2-storage of renewable energy in a gas distribution system. Energy Sustain. Soc. 2014, 4, 2. [Google Scholar]
- Madejski, P.; Chmiel, K.; Subramanian, N.; Kuś, T. Methods and Techniques for CO2 Capture: Review of Potential Solutions and Applications in Modern Energy Technologies. Energies 2022, 15, 887. [Google Scholar] [CrossRef]
- Gładysz, P.; Strojny, M.; Bartela, L.; Hacaga, M.; Froehlich, T. Merging Climate Action with Energy Security through CCS—A Multi-Disciplinary Framework for Assessment. Energies 2023, 16, 35. [Google Scholar] [CrossRef]
- Yin, C.; Huang, Z. The development of carbon capture and storage in China: Progress, challenge and collaboration. In Proceedings of the 2018 Portland International Conference on Management of Engineering and Technology (PICMET), Honolulu, HI, USA, 19–23 August 2018. [Google Scholar]
- Chalmers, H.; Gibbins, J. Initial evaluation of the impact of post-combustion capture of carbon dioxide on supercritical pulverised coal power plant part load performance. Fuel 2007, 86, 2109–2123. [Google Scholar] [CrossRef]
- Tabar, V.; Hagh, M.; Jirdehi, A. Achieving a nearly zero energy structure by a novel framework including energy recovery and conversion, carbon capture and demand response. Energy Build. 2021, 230, 110563. [Google Scholar] [CrossRef]
- Zhou, X.; Zhao, Q.; Zhang, Y.; Sun, L. Integrated energy production unit: An innovative concept and design for energy transition toward low-carbon development. CSEE J. Power Energy Syst. 2021, 7, 1133–1139. [Google Scholar]
- Li, G.; Wang, C.; Lei, S.; Wang, X. Bi-level optimal allocation of power system considering carbon capture technology. Electr. Power Autom. Equip. 2023, 43, 25–31. [Google Scholar]
- Moskalenko, N.; Lombardi, P.; Komarnicki, P. Multi-criteria optimization for determining installation locations for the power-to-gas technologies. In Proceedings of the 2014 IEEE PES General Meeting|Conference & Exposition, National Harbor, MD, USA, 27–31 July 2014; pp. 1–5. [Google Scholar]


| Vertex Number | Electric Power/MW | Thermal Power/MW |
|---|---|---|
| 1 | 81 | 104.8 |
| 2 | 215.0 | 180.0 |
| 3 | 247.0 | 0 |
| 4 | 98.8 | 0 |
| Scenario | With CCS | With P2G | With Heat Recovery |
|---|---|---|---|
| 1 | × | × | × |
| 2 | × | √ | × |
| 3 | × | √ | √ |
| 4 | √ | × | × |
| 5 | √ | √ | × |
| 6 | √ | √ | √ |
| Scenario | 1 | 2 | 3 | 4 | 5 | 6 |
|---|---|---|---|---|---|---|
| Total cost/104$ | 215.66 | 209.12 | 204.32 | 216.85 | 197.29 | 192.87 |
| Coal-fired units operating cost/104$ | 90.77 | 90.76 | 90.76 | 93.35 | 93.23 | 93.20 |
| Gas purchase cost/104$ | 69.03 | 67.82 | 65.91 | 64.41 | 63.10 | 60.74 |
| Carbon purchase cost/104$ | / | 4.04 | 3.86 | / | 0 | 0 |
| Wind abandonment cost/104$ | 16.50 | 7.12 | 5.63 | 16.50 | 5.41 | 3.77 |
| Transmission and storage cost/104$ | / | / | / | 10.13 | 7.62 | 8.12 |
| Carbon trading cost/104$ | 39.38 | 39.38 | 38.17 | 32.47 | 27.93 | 27.04 |
| Methane production/m3 | / | 71,462 | 68,317 | / | 83,819 | 80,103 |
| Carbon emissions/t | 8503.37 | 8501.16 | 8339.21 | 7615.59 | 6917.02 | 6731.78 |
| Scenario | Total Cost /104$ | Wind Abandonment Cost /104$ |
|---|---|---|
| With thermal energy storage | 192.87 | 3.77 |
| Without thermal energy storage | 195.61 | 3.83 |
Disclaimer/Publisher’s Note: The statements, opinions and data contained in all publications are solely those of the individual author(s) and contributor(s) and not of MDPI and/or the editor(s). MDPI and/or the editor(s) disclaim responsibility for any injury to people or property resulting from any ideas, methods, instructions or products referred to in the content. |
© 2023 by the authors. Licensee MDPI, Basel, Switzerland. This article is an open access article distributed under the terms and conditions of the Creative Commons Attribution (CC BY) license (https://creativecommons.org/licenses/by/4.0/).
Share and Cite
Chen, W.; Zhang, J.; Li, F.; Zhang, R.; Qi, S.; Li, G.; Wang, C. Low Carbon Economic Dispatch of Integrated Energy System Considering Power-to-Gas Heat Recovery and Carbon Capture. Energies 2023, 16, 3472. https://doi.org/10.3390/en16083472
Chen W, Zhang J, Li F, Zhang R, Qi S, Li G, Wang C. Low Carbon Economic Dispatch of Integrated Energy System Considering Power-to-Gas Heat Recovery and Carbon Capture. Energies. 2023; 16(8):3472. https://doi.org/10.3390/en16083472
Chicago/Turabian StyleChen, Wenjin, Jun Zhang, Feng Li, Ruoyi Zhang, Sennan Qi, Guoqing Li, and Chong Wang. 2023. "Low Carbon Economic Dispatch of Integrated Energy System Considering Power-to-Gas Heat Recovery and Carbon Capture" Energies 16, no. 8: 3472. https://doi.org/10.3390/en16083472