Article

Discharge Characteristics and Numerical Simulation of the Oil–Gas Surface under DC Voltage

1
The Wind Solar Storage Division of State Key Lab of Control and Simulation of Power System and Generation Equipment, School of Electrical Engineering, Xinjiang University, Urumqi 830046, China
2
State Key Lab of Control and Simulation of Power System and Generation Equipment, Department of Electrical Engineering, Tsinghua University, Beijing 100089, China
*
Author to whom correspondence should be addressed.
Energies 2023, 16(8), 3558; https://doi.org/10.3390/en16083558
Submission received: 28 February 2023 / Revised: 12 April 2023 / Accepted: 12 April 2023 / Published: 20 April 2023
(This article belongs to the Special Issue Design and Optimization of Power Transformer Diagnostics)

Abstract

:
Low insulation strength at the oil–gas surface due to oil leakage and partial discharge of oil-immersed power equipment is a major threat to the safe and reliable operation of power systems. This paper investigates the initiation and development of the oil–gas surface discharge. The oil–gas surface discharge test platform was established, and discharge tests were carried out at different gap distances (1–2.5 mm). By coupling the electric field and flow field, the multi-layer dielectric discharge streamer model was built, and the characteristics of charge and electric field distribution at different gap distances were studied. The test results show that the liquid surface between the electrodes rises during the discharge process. Furthermore, the surface discharge voltage exceeds the air gap discharge voltage. With the simulation analysis, the oil–gas surface discharge is a typical streamer development process. Under 50 kV applied voltage and 2.5 mm gap distance, the average development speed of the streamer is 12.5 km/s. The larger the gap distance is, the greater the average streamer development speed is. The recording and numerical simulation of the discharge process are of great significance for exploring the mechanism of oil–gas surface discharge, optimizing the discharge process, and diagnosing partial discharges.

1. Introduction

The safe and stable operation of primary power equipment such as oil-immersed reactors and bushing directly determines the reliability of a power system. As an important insulating dielectric of oil-immersed power equipment, the insulation failure of oil can lead to malfunctions in electric transmission and transformation equipment [1,2]. According to the statistical data released by CIGRE (Conference International des Grands Reseaux Electriques, CIGRE), insulation fault accounts for about half of the total power grid malfunctions, and many insulation faults are caused by multiphase dielectric surface discharge [3]. It can be seen that the multiphase dielectric surface, such as the oil–paper surface and the oil–gas surface, is the weak point of insulation. Not only the insulation fault caused by the oil–paper surface flashover but also those caused by the oil–gas surface discharge should be considered.
The research on multiphase dielectric surface discharge is mainly focused on the oil–paper surface. The initial discharge voltage, flashover voltage, and partial discharge characteristic parameters of oil paper surface discharge have been investigated. Studies have also simulated the development process of oil–paper surface streamer discharge. It was found that space charge affects and distorts the electric field, which is also the fundamental reason for the development of streamers [4,5,6,7,8]. However, few studies focus on the discharge characteristics of the oil–gas surface caused by partial discharge, partial overheating, and oil leakage in oil-immersed power equipment [9,10,11].
The challenge of oil–gas surface research is that the surface morphology is susceptible to the electric field, thus affecting the development of the discharge. The morphological evolution of bubbles in static oil along the electric field direction prolongs the gas channel and reduces the insulating properties of the liquid dielectric [12]. The oil flow velocity affects the trajectory of bubbles in the oil channel and the electric field strength. Increased flow velocity can somewhat reduce the electric field strength [13]. Ref. [14] studied the morphological growth law of single bubbles in oil under the electric field, discussed the effect of the electric field on the bubble length-to-diameter ratio, and pointed out that the bubble behavior is mainly influenced by the electric field strength and gap distance. However, the discharge process of the oil–gas surface also requires consideration of the two-phase flow and the difference in the discharge mechanism. Therefore, this study explores the physical process of oil–gas surface discharge by combining two-phase flow and the discharge mechanisms of dielectrics.
A DC discharge platform with a video capture system for the discharge process was first built. It investigates the effects of DC voltage and gap distance on the discharge characteristics at the oil–gas surface. Then, the streamer and two-phase flow model of dielectric discharge were constructed based on finite element analysis software. The analysis highlights the space charge and electric field distribution characteristics and the deformation behavior of the oil–gas surface during the streamer development. Finally, combining the simulation results of streamer development and the dynamic behavior of carriers in the discharge process, mechanisms of influence of gap distance on the discharge characteristics of the oil–gas surface were explored. The research presented in this paper is of great significance not only for a better understanding of the mechanism of gas–liquid surface discharge but also for providing important references and guidance for the study of multiphase medium surface discharge.

2. Materials and Methods

2.1. Sample Preparation

Kramer 25# oil was chosen as the fluid for the experiment. Firstly, impurities, water, gas, and acid were removed from the oil to ensure the accuracy of the experiment. The oil sample was filtered in a vacuum filter. Then, the filtered oil samples were dried in a vacuum oven at 80 °C/100 Pa for 48 h. Finally, the oil with impurities removed was sealed and stored.

2.2. Test Platform

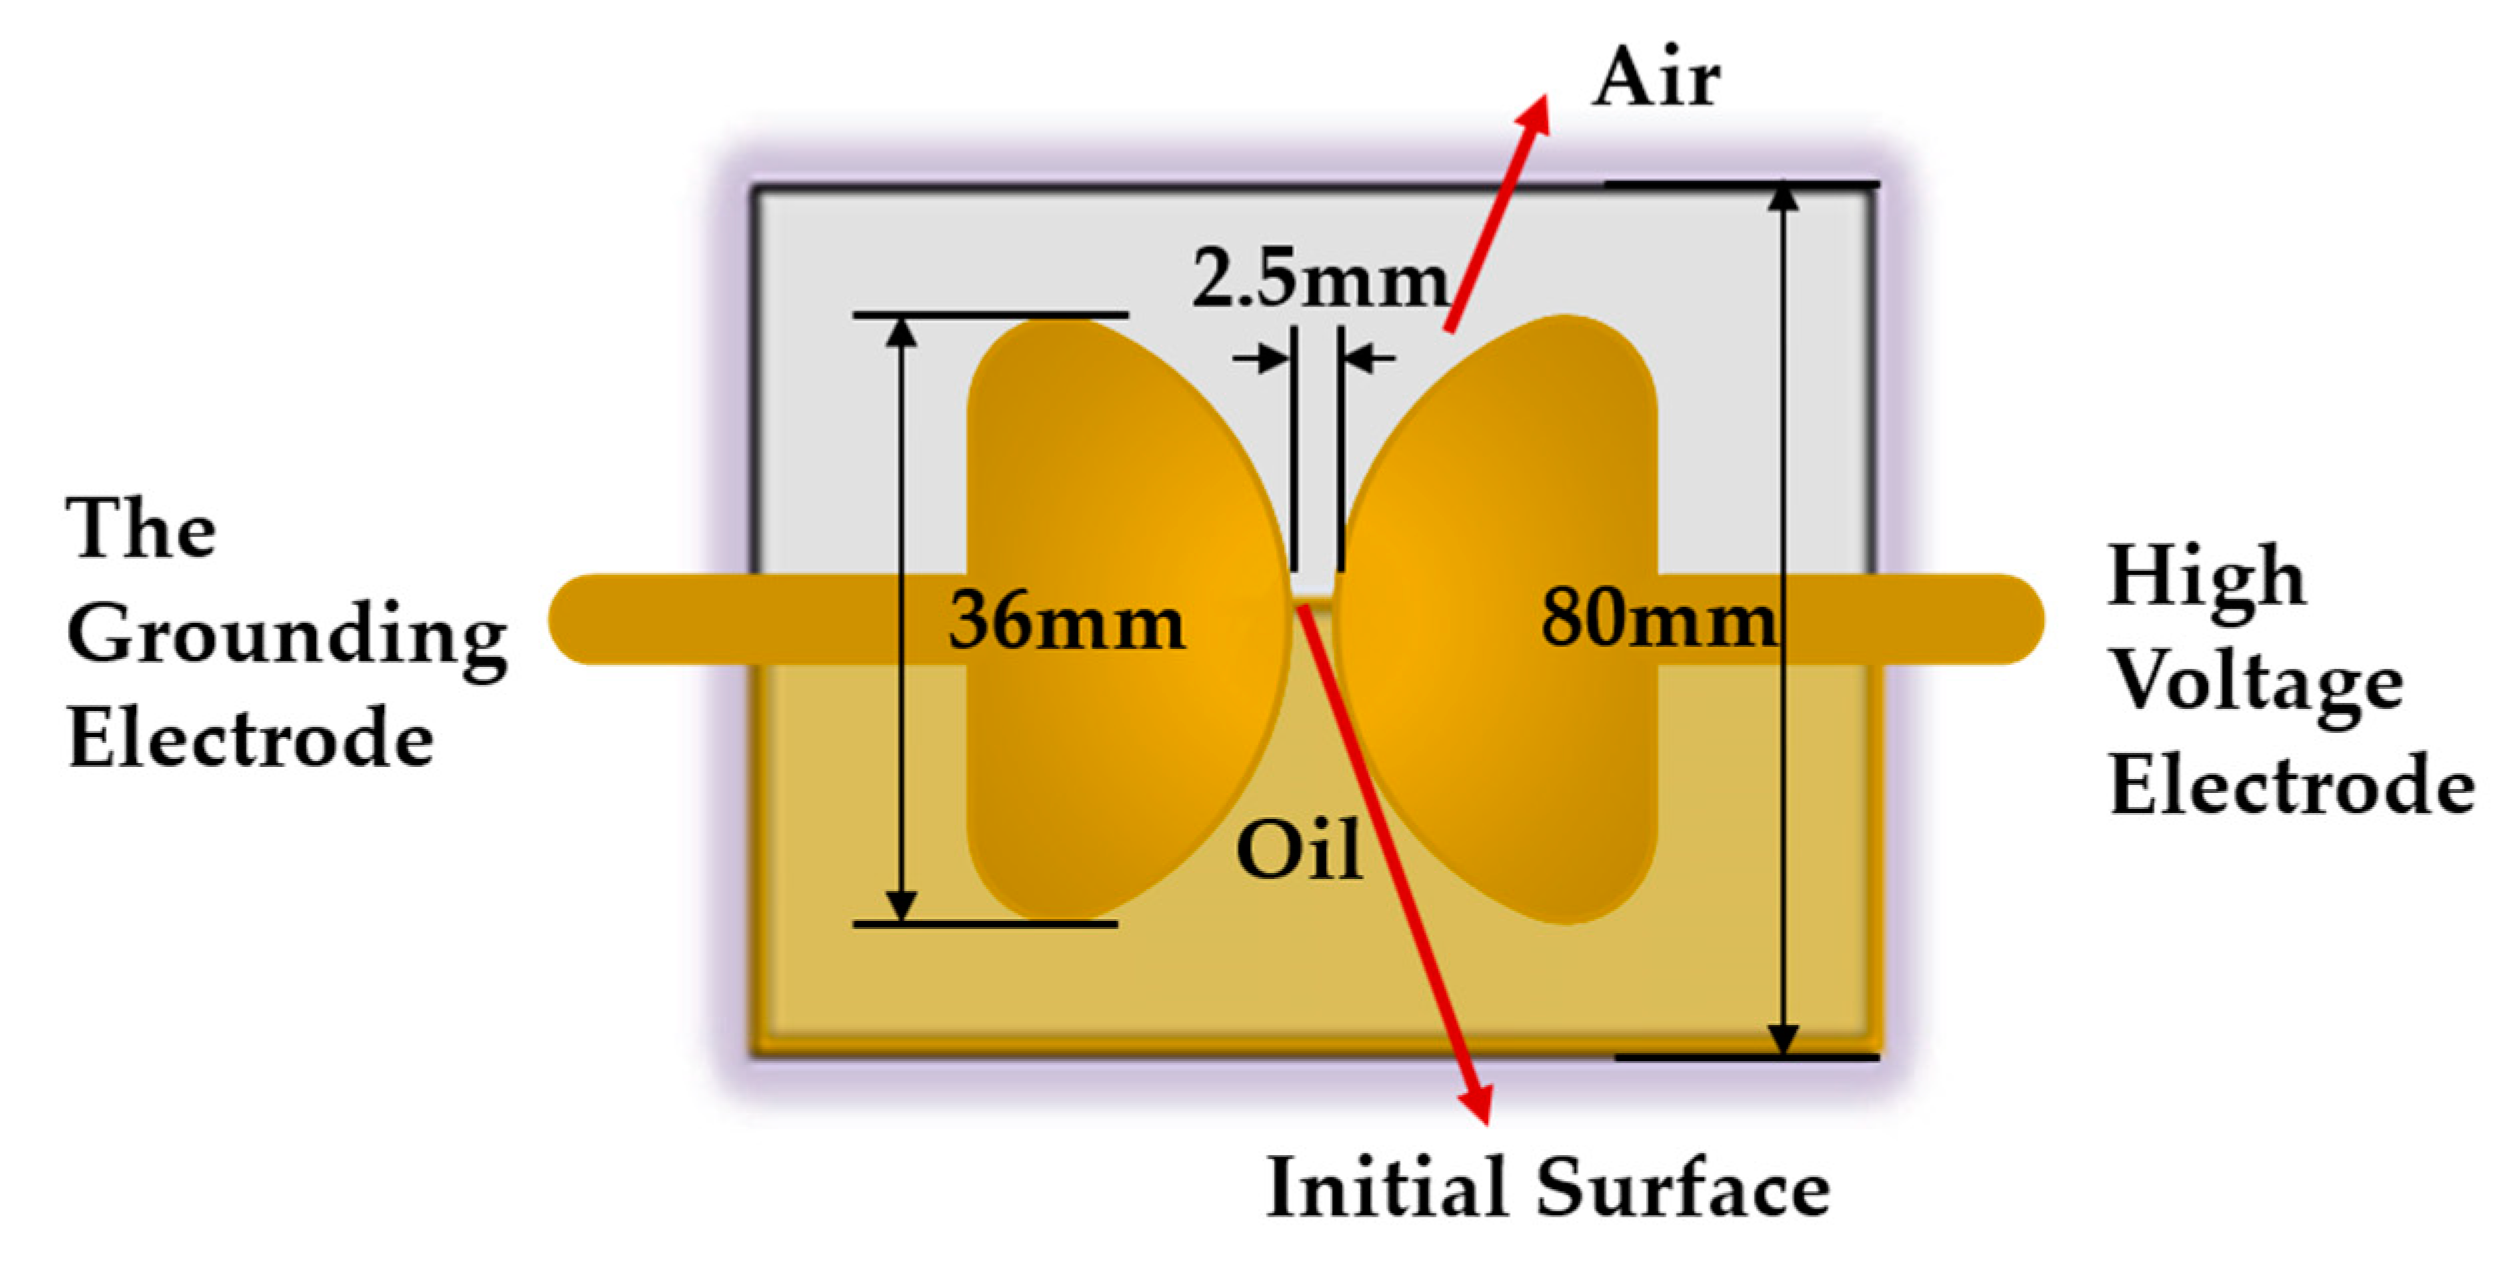
Figure 1 illustrates the DC discharge test platform, which consists of a high-voltage DC power supply, a protection resistor, a resistance–capacitance divider, a test electrode, and an image-capture unit. The working range of the DC high-voltage power supply is 0–100 kV, with a maximum voltage of 80 kV at long-term operation. After passing through a 2 MΩ current-limiting protection resistor K, the DC high-voltage power enters the oven through a high-voltage transmission line and then connects to the high-voltage electrode. The high-voltage electrode applies high voltage to the oil–paper surface, and the discharge voltage is displayed by an oscilloscope after being divided by a resistance–capacitance voltage divider. The image-capture unit is implemented by an internally charge-coupled device (ICCD) for capturing the discharge path on the oil–gas surface. The maximum resolution is 1024 × 1024, and the minimum exposure time of the camera is 2 ns. According to IEC standard 60156, a ball-cap electrode model is selected to construct a slightly inhomogeneous electric field, as shown in Figure 2. The gap distance is from 1 mm to 2.5 mm, with a diameter of 36 mm for both electrodes, and the material is brass.
Oil gap, air gap, and oil–gas surface discharge tests refer to IEC standard 156. Firstly, all tests were conducted at 25 ± 1 °C and a voltage rising rate of 2.0 kV/s ± 0.2 kV/s. Then, the breakdown voltage, which is the maximum voltage value when the circuit is cut, was recorded. After reaching the breakdown voltage, the high-voltage generator was quickly reset to zero, paused for at least 2 min, and then the voltage was re-applied. To ensure the reliability of the test results, 24 discharge tests were conducted on each group of samples. After removing the data points with obvious deviation, 15 valid points were selected to draw the Weibull distribution diagram. In addition, the influence of the gap distance on the discharge voltage was studied. The gap distances were 1 mm, 1.5 mm, 2 mm, and 2.5 mm.

2.3. Simulation Model

Numerical simulation was required to investigate the discharge characteristics of the oil–gas surface under the ball-cap electrode. We used COMSOL Multiphysics to build a model the same size as Figure 2.

2.3.1. Streamer Discharge Model

The streamer model of liquid dielectric discharge was proposed by Morrow and Lowke [15,16,17,18]. The governing equation consists mainly of the continuity equation for charged particles and the Poisson equation:
c p t + ( z p u m , c p f c p V ) = g e n l + c p c e ( R pe ) n a + c p c n ( R pn ) n a
c n t + ( z n u m , c n f c n V ) = c e T a c p c n ( R pn ) n a
c e t + ( z e u m , c e f c e V ) = g e n l c p c e ( R pe ) n a c e T a
E = V
where ci is the ion concentration; i = p, n, and e are positive ions, negative ions, and electrons, respectively; Rpe and Rpn are the recombination rates of positive ions and electrons, and positive ions and negative ions, respectively; f is the Faraday constant; Ta represents the electron adsorption time constant; genl is the source term of charge density generation rate.
Equations (1)–(3) represent the generation, recombination, and capture mechanisms of positive ions, negative ions, and electrons. In contrast, the coupling with Equation (4) represents the development speed, morphology change, and the distribution of different ions in the calculation area. Through the coupling of the continuity equation and Poisson equation, the distribution of charge density and electric field during the discharge process can be obtained [19]. In the discharge of liquid dielectric, scholars believe that collision ionization, thermoelectric ionization, field ionization, and photoionization are the main reasons for the increase in electrical conductivity [20,21,22,23,24,25]. It has been confirmed that collision ionization plays a leading role [26,27,28,29,30]. Devins et al. [31,32] used the Zener breakdown theory to explain how discharge occurs in liquid dielectrics. The source term, genl, depends on the electric field E to produce the electron and positive ion density in the liquid dielectric.
g e n l = q 2 n 0 a | E | h exp ( π 2 m * a Δ 2 q h 2 | E | )
where n0 is the number of ionizable molecules, q is the electric charge quantity, h is the Planck constant, ∆ is the liquid medium’s ionization energy, a is the molecular distance, and m* is the effective electron mass.
In addition, the gas side discharge theory in the oil–gas surface discharge model is based on the collision ionization theory of Townson ionization [33]. Equation (6) represents the source term of charge generation in the discharge channel:
G ( | E | ) = - α 0 exp ( v q λ | E | ) ρ e μ e | E |
where v is the gas molecule ionization energy, α0 indicates the collision ionization coefficient, and λ indicates the electron mean free path. ρe is the electron density, and μe is the electron migration rate. Parameters in this simulation process are mainly from the literature [34,35], as shown in Table 1 and Table 2.

2.3.2. Gas–Liquid Two-Phase Flow Model

References [36,37,38] explored and analyzed the improvement of the multiphase flow model and the accurate approximation of dynamic viscosity. The oil–gas surface is deformed due to the electric field and flow field, which can affect the development of the oil–gas surface discharge. Thus, a gas–liquid two-phase flow model was established to study the dynamic behavior of the oil–gas surface and the characteristics of the electric field distribution. In general, the fluid motion state is determined by the Reynolds number Re. With Re < 2000, the fluid motion state is the laminar flow. The relevant parameters are substituted into Equation (7) to obtain Re = 1118, so the fluid state is laminar flow.
R e = ρ v L μ
where ρ is oil density, and v and u0 represent the oil’s flow velocity and dynamic viscosity. The gas–liquid phase is assumed to be an immiscible and incompressible Newtonian fluid, and its governing equations can be obtained from the Navier–Stokes equation of momentum conservation and the continuity equation of mass conservation [34,35,39]:
ρ u t + ρ ( u · ) = F st + ρ g + F e + · ( p I + τ )
· u = 0
F e = ( E D T 1 2 ( E D ) I )
where u is the fluid velocity; Fst and Fe are the surface tension and electric field force, respectively; p is the pressure; I is the identity matrix; and g is the gravitational acceleration vector. E is the electric field strength, and D is the electrical induction strength. Fe is the electric field force.

3. Test Results and Analysis

3.1. Initiation and Development of the Oil–Gas Surface Discharge

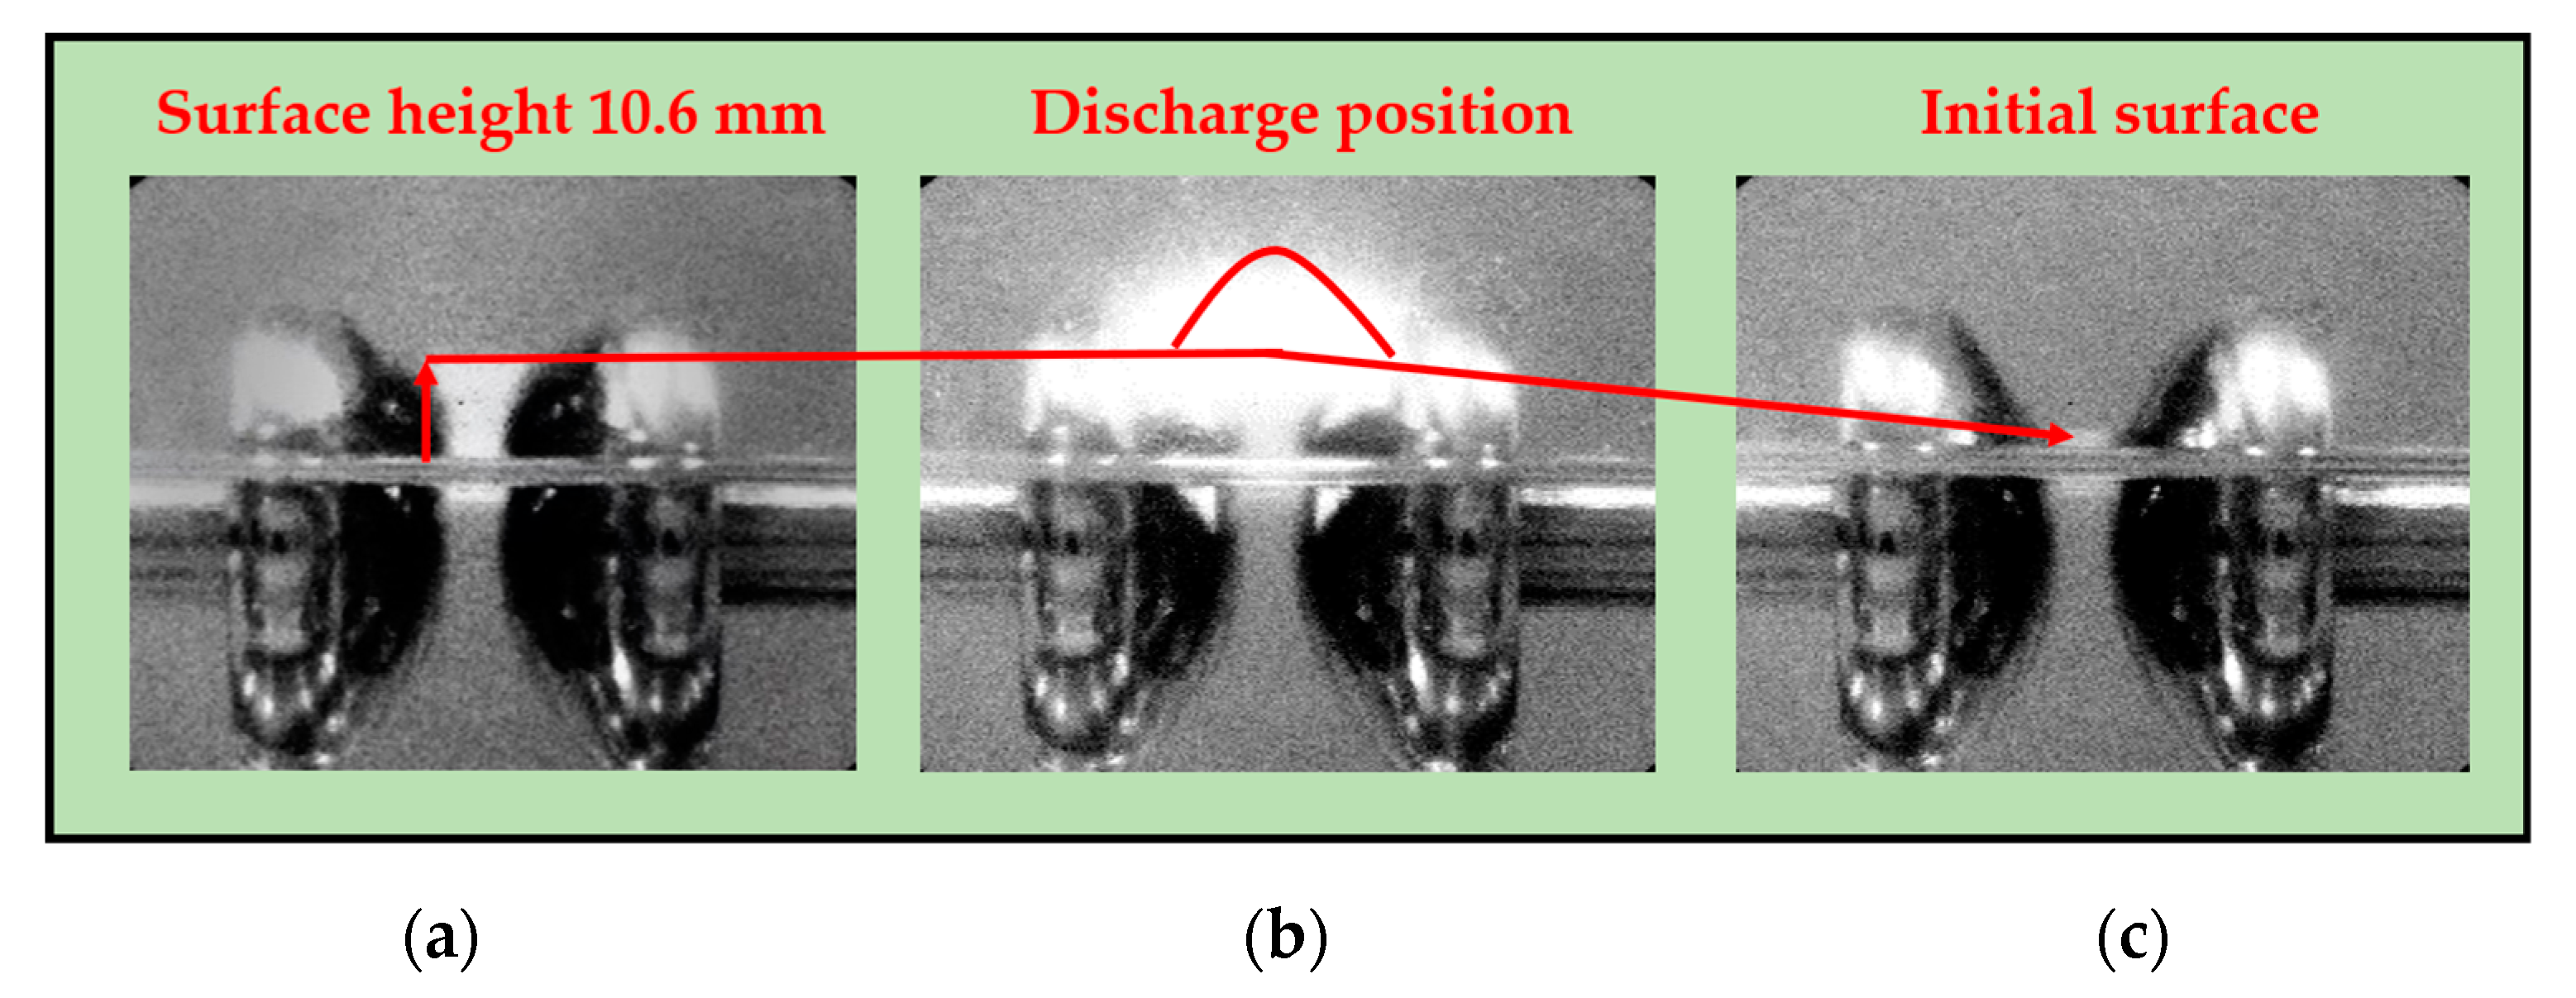
ICCD records the procedure of discharge at the oil–gas surface. Figure 3 shows the change at the surface before and after the discharge during the oil–gas surface discharge. t = −1 s and t = 1 s represent the moment of 1 s before and after discharge; t = 0 s refers to the moment of discharge.
As the applied voltage rises to 20 kV, there comes a “squeaking” sound from the oil, and the liquid surface between the two electrodes rises from the initial surface. At that moment, the space charge in the oil reaches a certain amount, and the charged particle collision becomes more intense, resulting in distortion of the electric field. When the voltage increases to 48.15 kV, the liquid surface reaches about 10.6 mm equilibrium height and forms a bright discharge channel at the surface. By the end of the discharge, the liquid surface returns to the initial surface position. From the discharge process, the liquid surface rise is formed before the discharge, and the liquid surface reaches the equilibrium height while the electric field force balances the surface tension and gravity.
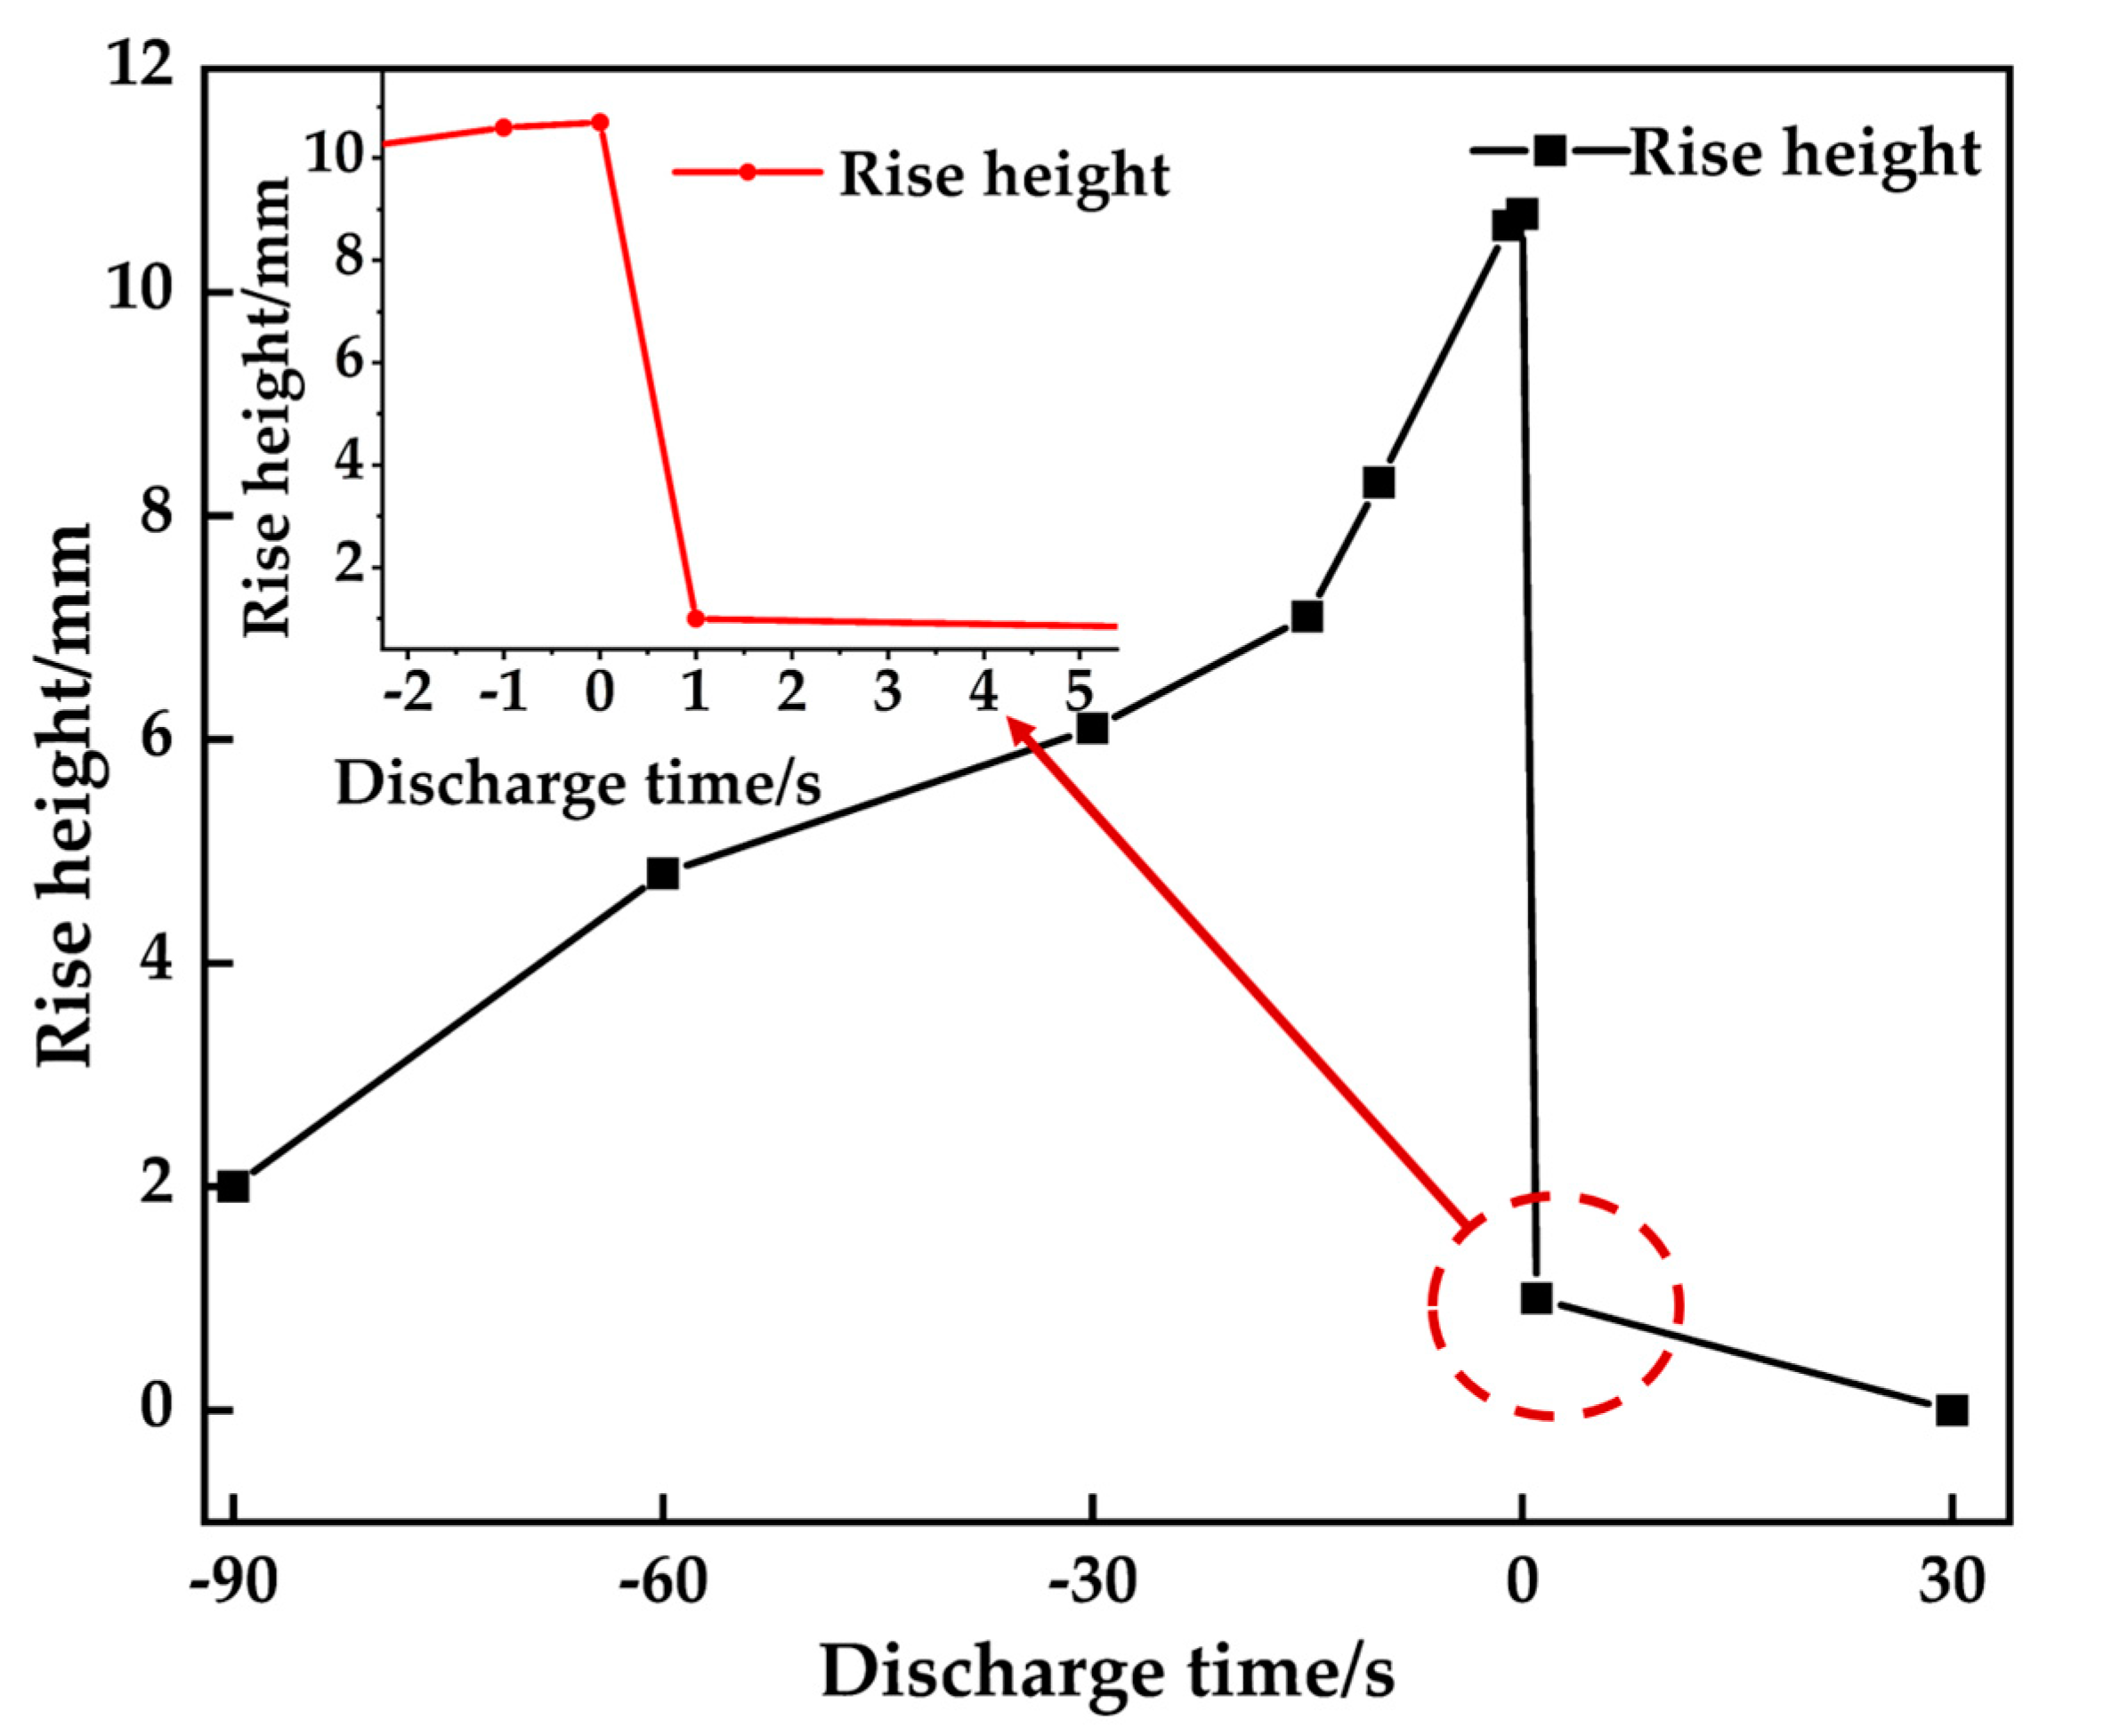
Figure 4 depicts the variation in the liquid surface height with the applied voltage during the oil–gas surface discharge, where 0 s refers to the discharge moment.
The height of the liquid surface between electrodes increases with the increase in the applied voltage. The liquid surface reaches the equilibrium height of 10.6 mm at the moment 1 s before the discharge. The liquid surface height decreases rapidly to 0.6 mm at 1 s after the discharge. Finally, it is restored to the initial surface position.

3.2. Discharge Voltage Distribution at Oil–Gas Surface

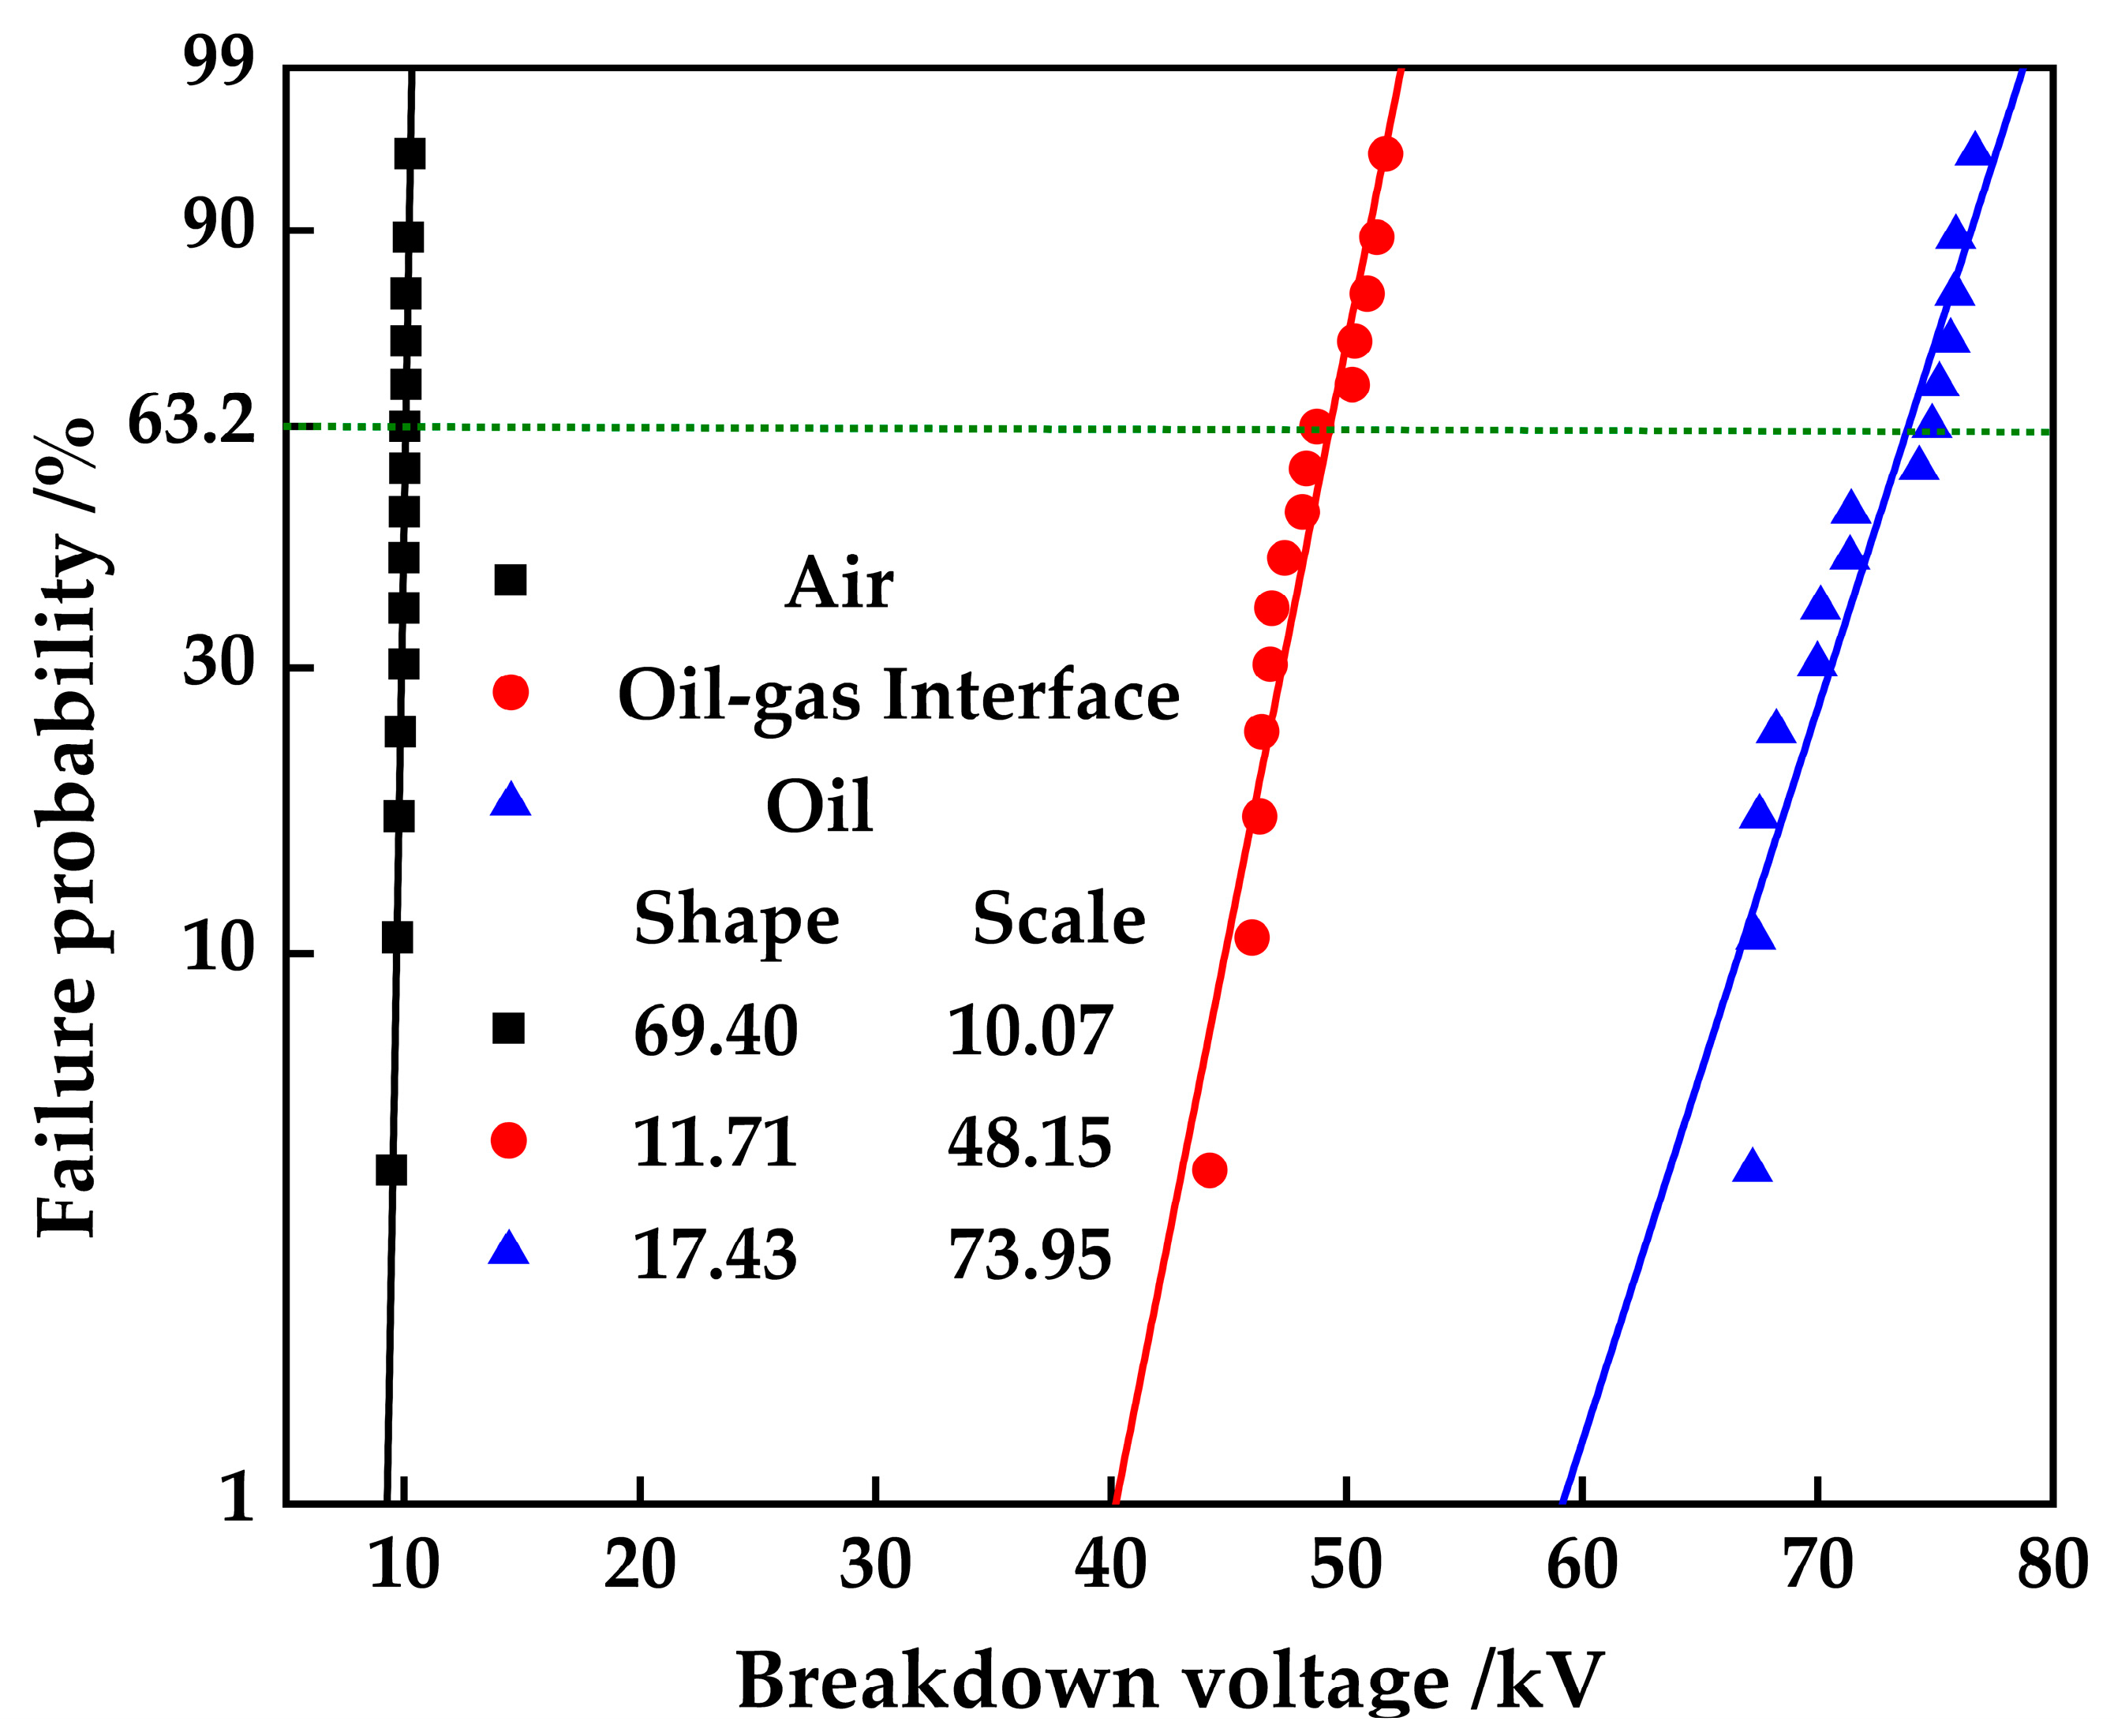
Discharge tests were carried out for the oil–gas surface, air gap, and oil gap. The two-parameter Weibull distribution was employed to illustrate the DC discharge voltage of three different forms, as is shown in Figure 5. The calculated scale parameter and shape parameter are also presented. The scale parameter is the discharge voltage at a cumulative probability of failure equal to 63.2%. The shape parameter indicates the degree of dispersion of the data.
From Figure 5, it can be observed that the oil–gas surface discharge voltage is 48.15 kV, between the air gap discharge voltage of 10.07 kV and the oil gap discharge voltage of 73.95 kV. The oil–gas surface shape parameter is the smallest at 11.71 with the maximum dispersion, while the air gap shape parameter is 69.4 with the minimum dispersion. It is clear from the discharge voltage data that the oil–gas surface discharge is not a single air gap with the oil gap breakdown, which is also confirmed by the discharge process shown in Figure 3.
In general, the flashover voltage along the surface of a multiphase dielectric is lower than the breakdown voltage of a single dielectric, while in the oil–gas surface discharge process, the oil–gas surface discharge voltage is higher than the air gap breakdown voltage. For gas–solid surfaces, the discharge always occurs along the solid surface dielectric as the applied voltage increases. The flashover voltage along the surface is much lower than the air gap breakdown voltage due to the original uniform electric field has been distorted. The initial electrons from the cathode begin to crash with the surface of the solid dielectric under the electric field, producing secondary electrons. Then, some secondary electrons will continue to crash with the dielectric surface, producing more secondary electrons and eventually leading to the electron avalanche and surface flashover. However, during the oil–gas surface discharge, the fluidity of the oil takes away some of the electrons accumulated on the surface and weakens the electron multiplication process, which may be one of the reasons why the discharge voltage is higher than the air gap breakdown voltage.

3.3. Effect of Gap Distance on Discharge Voltage at Oil–Gas Surface

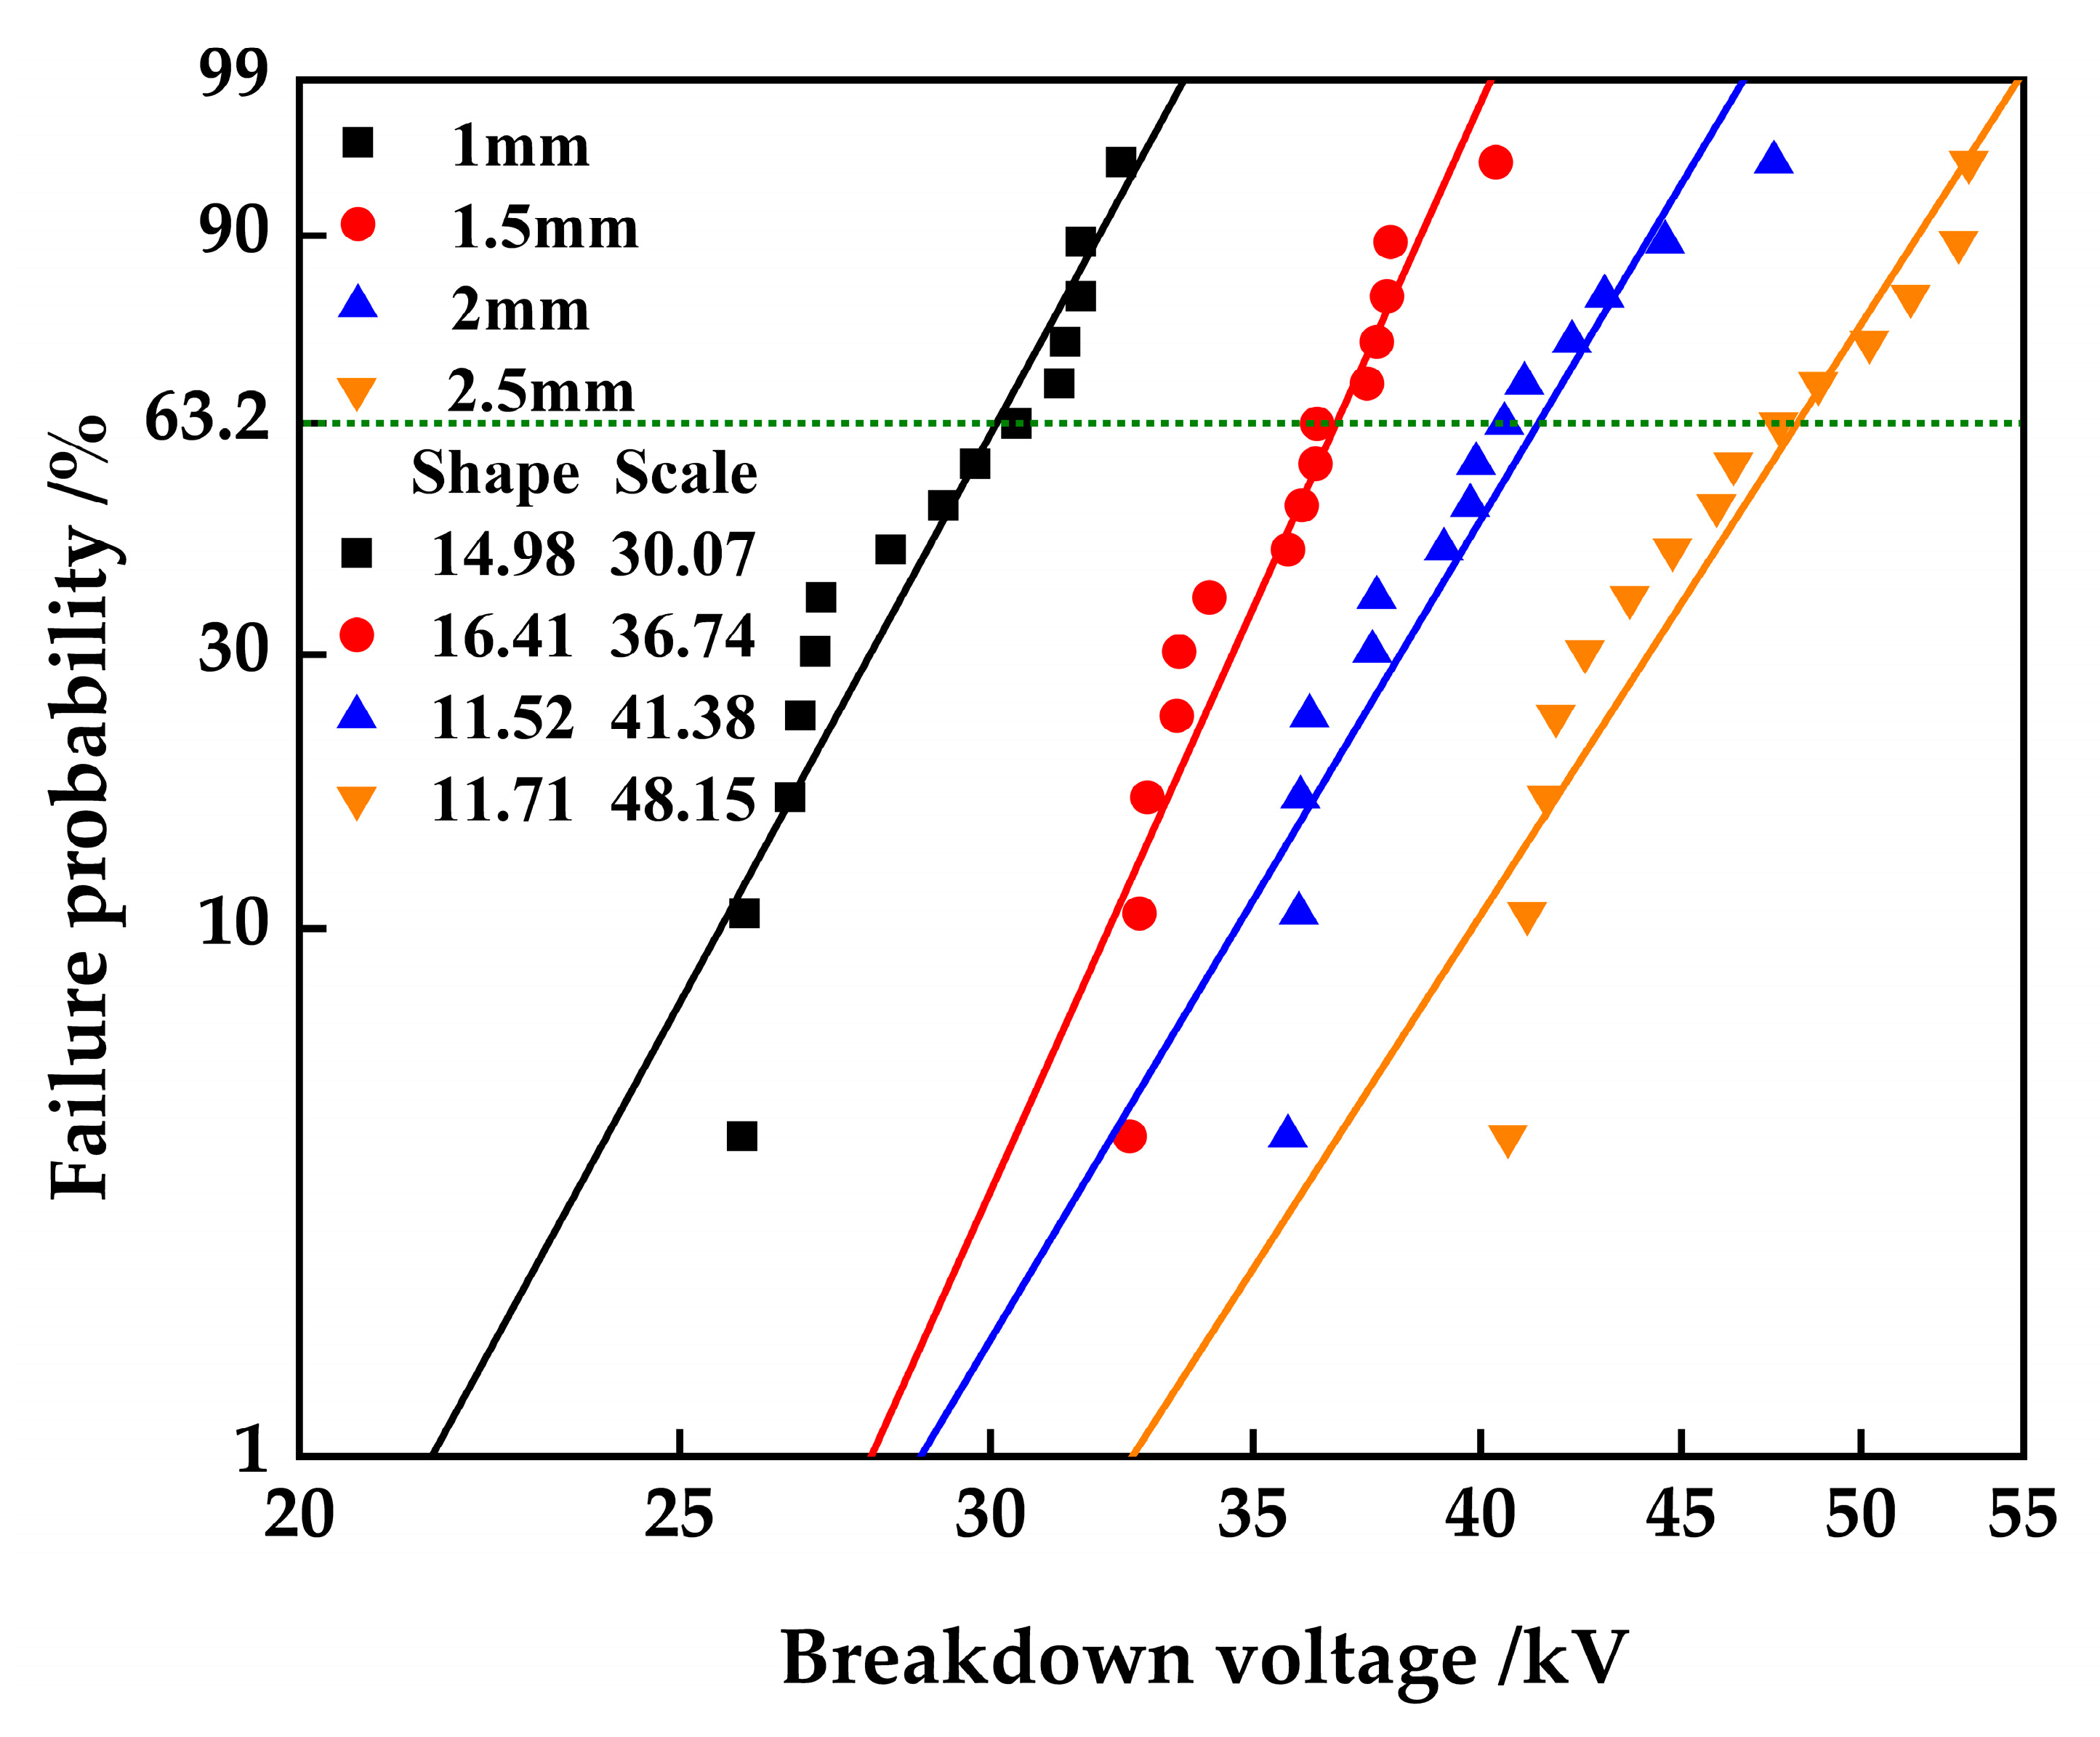
The gap distance is an important factor affecting the electric field distribution and discharge voltage. The oil–gas surface discharge tests with different gap distances were performed to study the effect of the gap distance on the oil–gas surface discharge voltage. Figure 6 shows the probability distribution of the oil–gas surface discharge voltage at different gap distances.
As seen in Figure 6, the oil–gas surface discharge voltage increases with increasing gap distance. At the gap distance of 1 mm, the discharge voltage is 30.07 kV, and it rises to 48.15 kV by increasing the gap distance to 2.5 mm, an increase of 60.13%. In the case of a 0.5 mm gap distance increase, the discharge voltage increase is not equal. When the gap distance rises from 1.5 mm to 2 mm, the discharge voltage increases by 4.64 kV, which is the smallest increase.
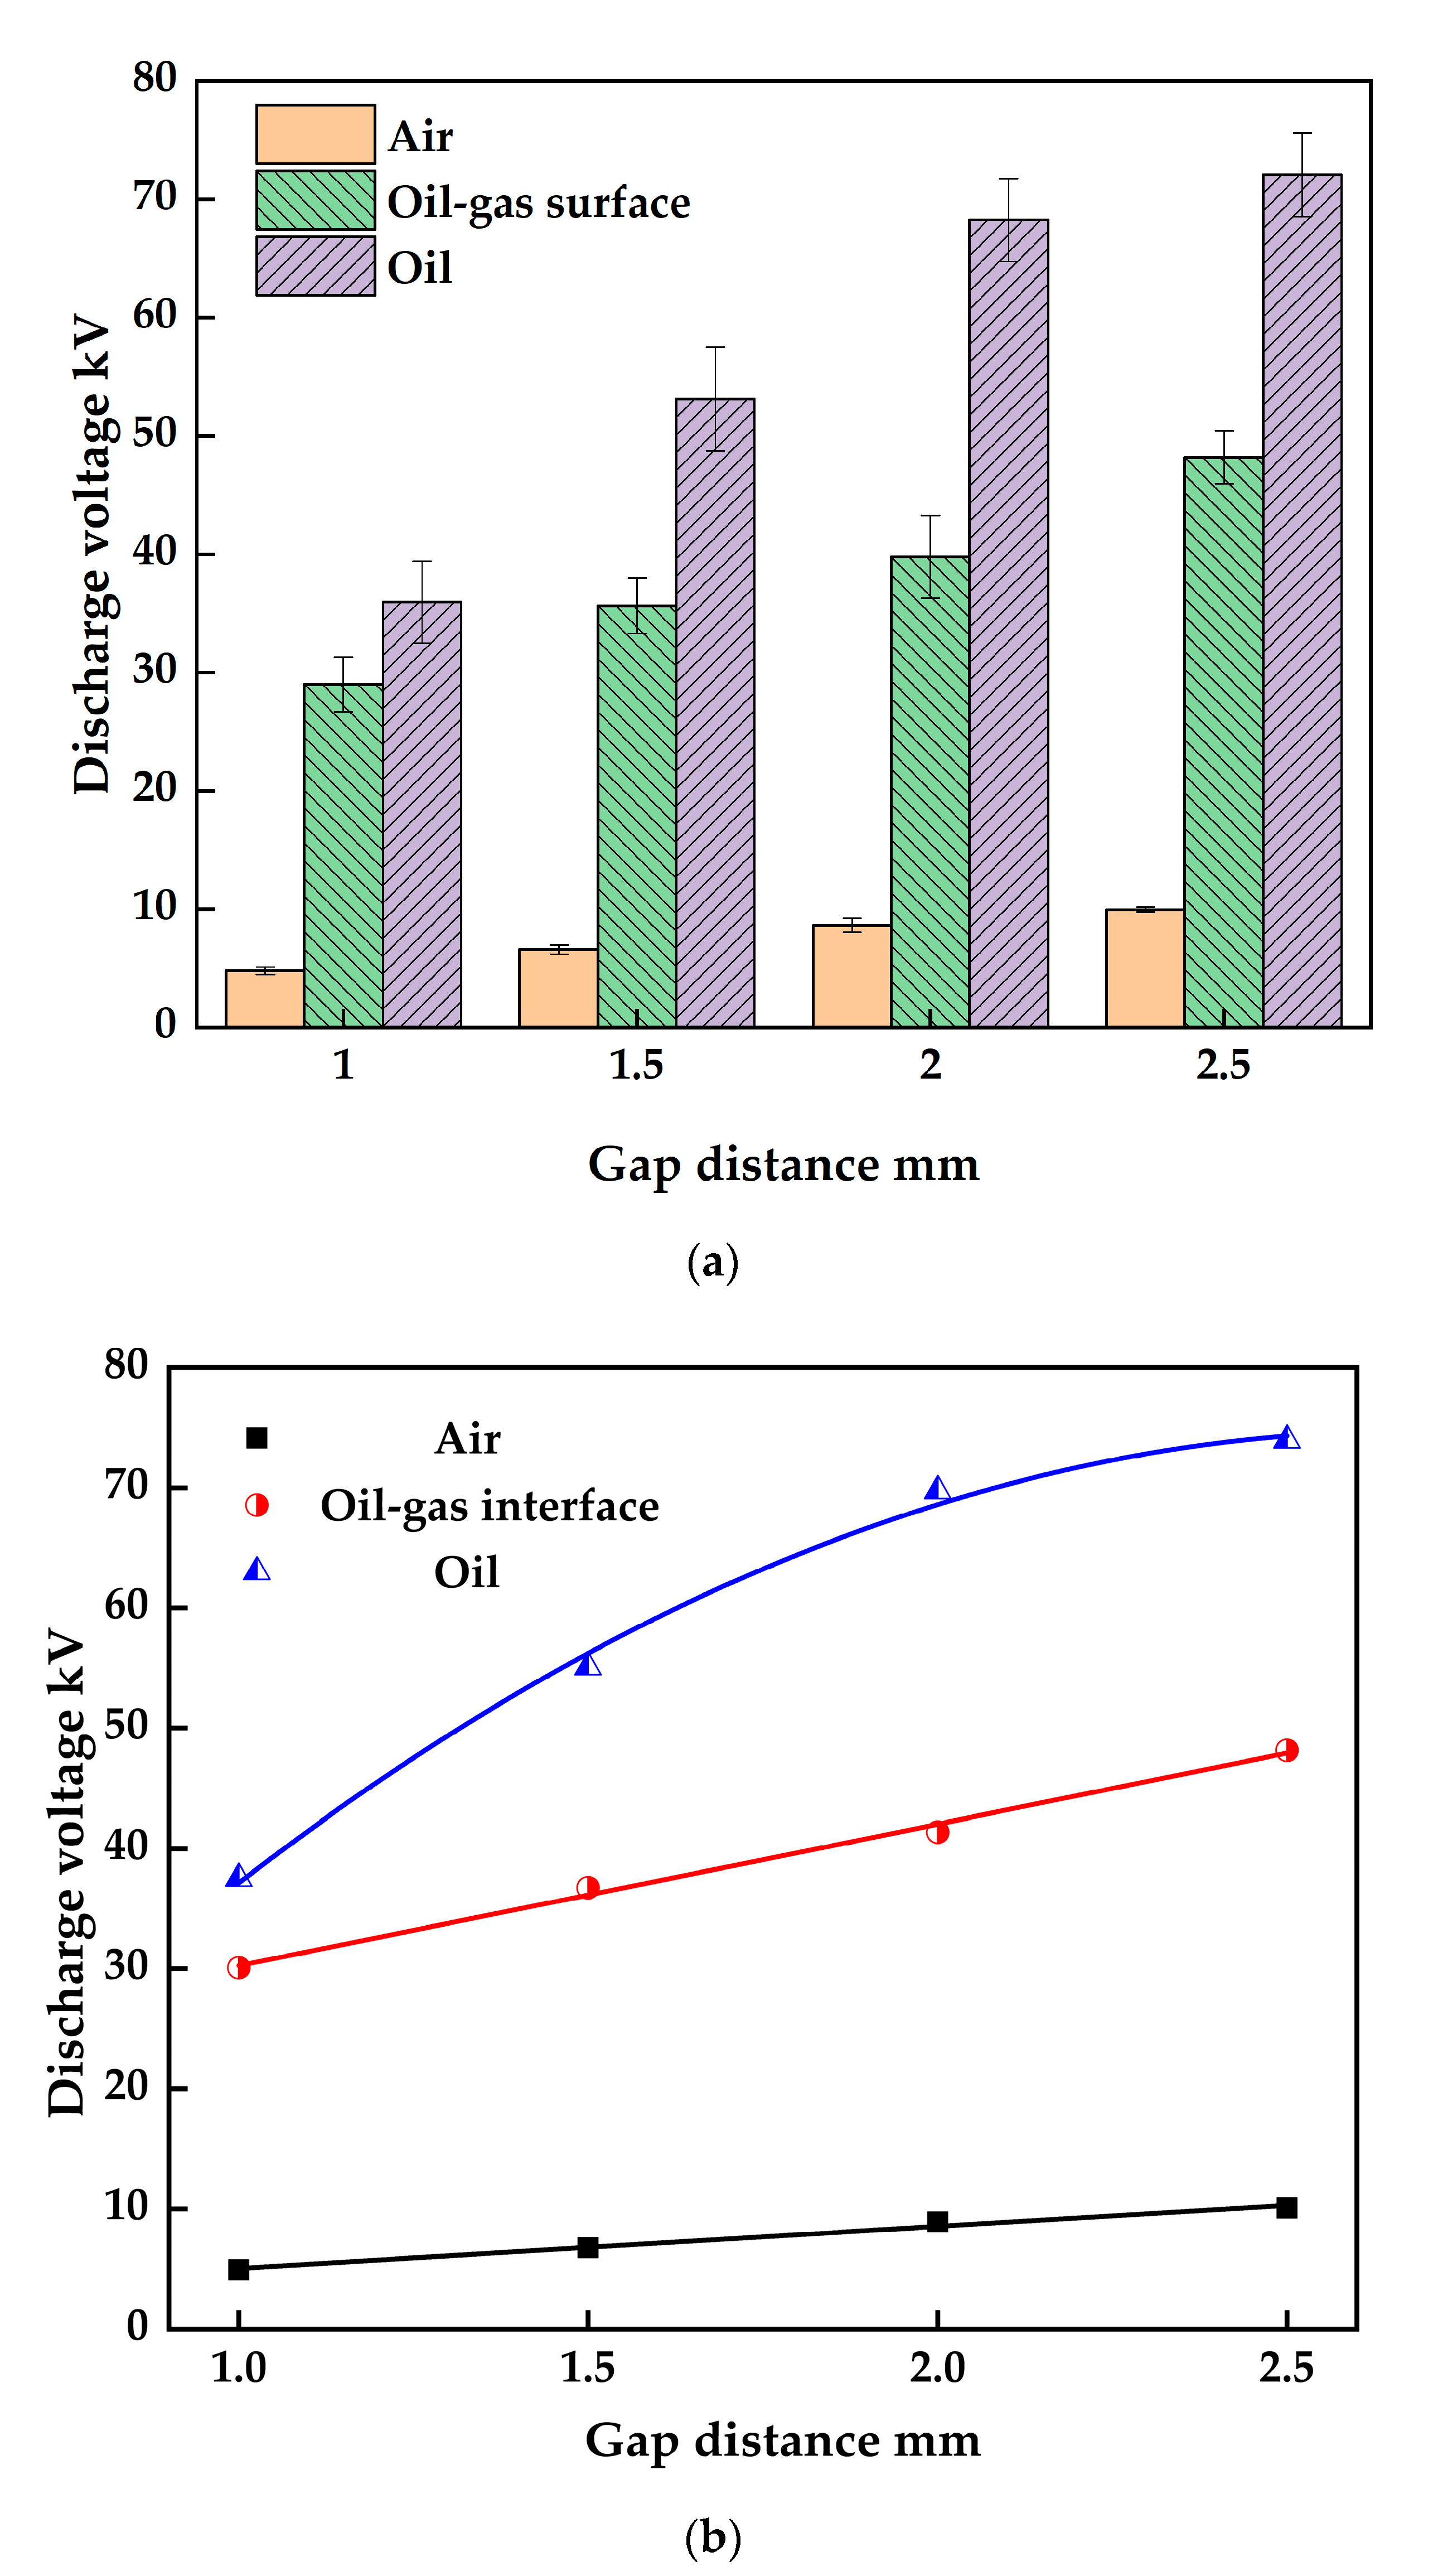
Figure 7a shows that the gap distance has the weakest effect on the air gap discharge and the greatest effect on the oil gap discharge. With the same gap distance, the air gap discharge voltage is the smallest, followed by the oil–gas surface discharge voltage, while the oil gap discharge voltage is the largest. At the gap distance of 2.5 mm, the oil gap discharge voltage is 53.6% higher than the oil–gas surface discharge voltage, which is 7.3 times the air gap discharge voltage.
Figure 7b presents the fitted curves of discharge voltage (y) with gap distance (x) under three cases of oil gap, air gap, and oil–gas surface, and the fitted relationship is as follows:
y air = 1.54 + 3.5 x
y oil - gas = 18.48 + 11.78 x
y oil = 20.98 + 71.47 x 13.34 x 2
From Equations (11)–(13), it can be seen that the discharge voltage of the oil–gas surface and the air gap discharge has a linear relationship with the gap distance. The oil gap discharge voltage has a quadratic polynomial relationship with the gap distance, and the fitting degree is 0.99. For discharge voltage, the oil–gas surface discharge voltage is between the discharge voltage of the air gap and the oil gap and is closer to the discharge voltage of the oil gap. It can be known from the relationship between gap distance and discharge voltage that the variation law of the oil–gas surface discharge voltage with the gap distance is relatively similar to the air gap discharge. The gap distance is the main factor affecting the discharge voltage, the gap distance increases, and the discharge voltage increases. As illustrated by the fitted curve in Figure 7b, Equations (11)–(13) can accurately predict the trend of discharge voltage variation when the gap distance ranges from 1 mm to 2.5 mm.

4. Simulation Results and Analysis

4.1. Development of Oil–Gas Surface Discharge Streamer

Section 2 demonstrates the existence of the oil–gas surface and analyzes the effect of the gap distance on the oil–gas surface discharge. Then, simulations of streamer discharge were carried out to investigate the oil–gas surface discharge development process and discharge mechanism.
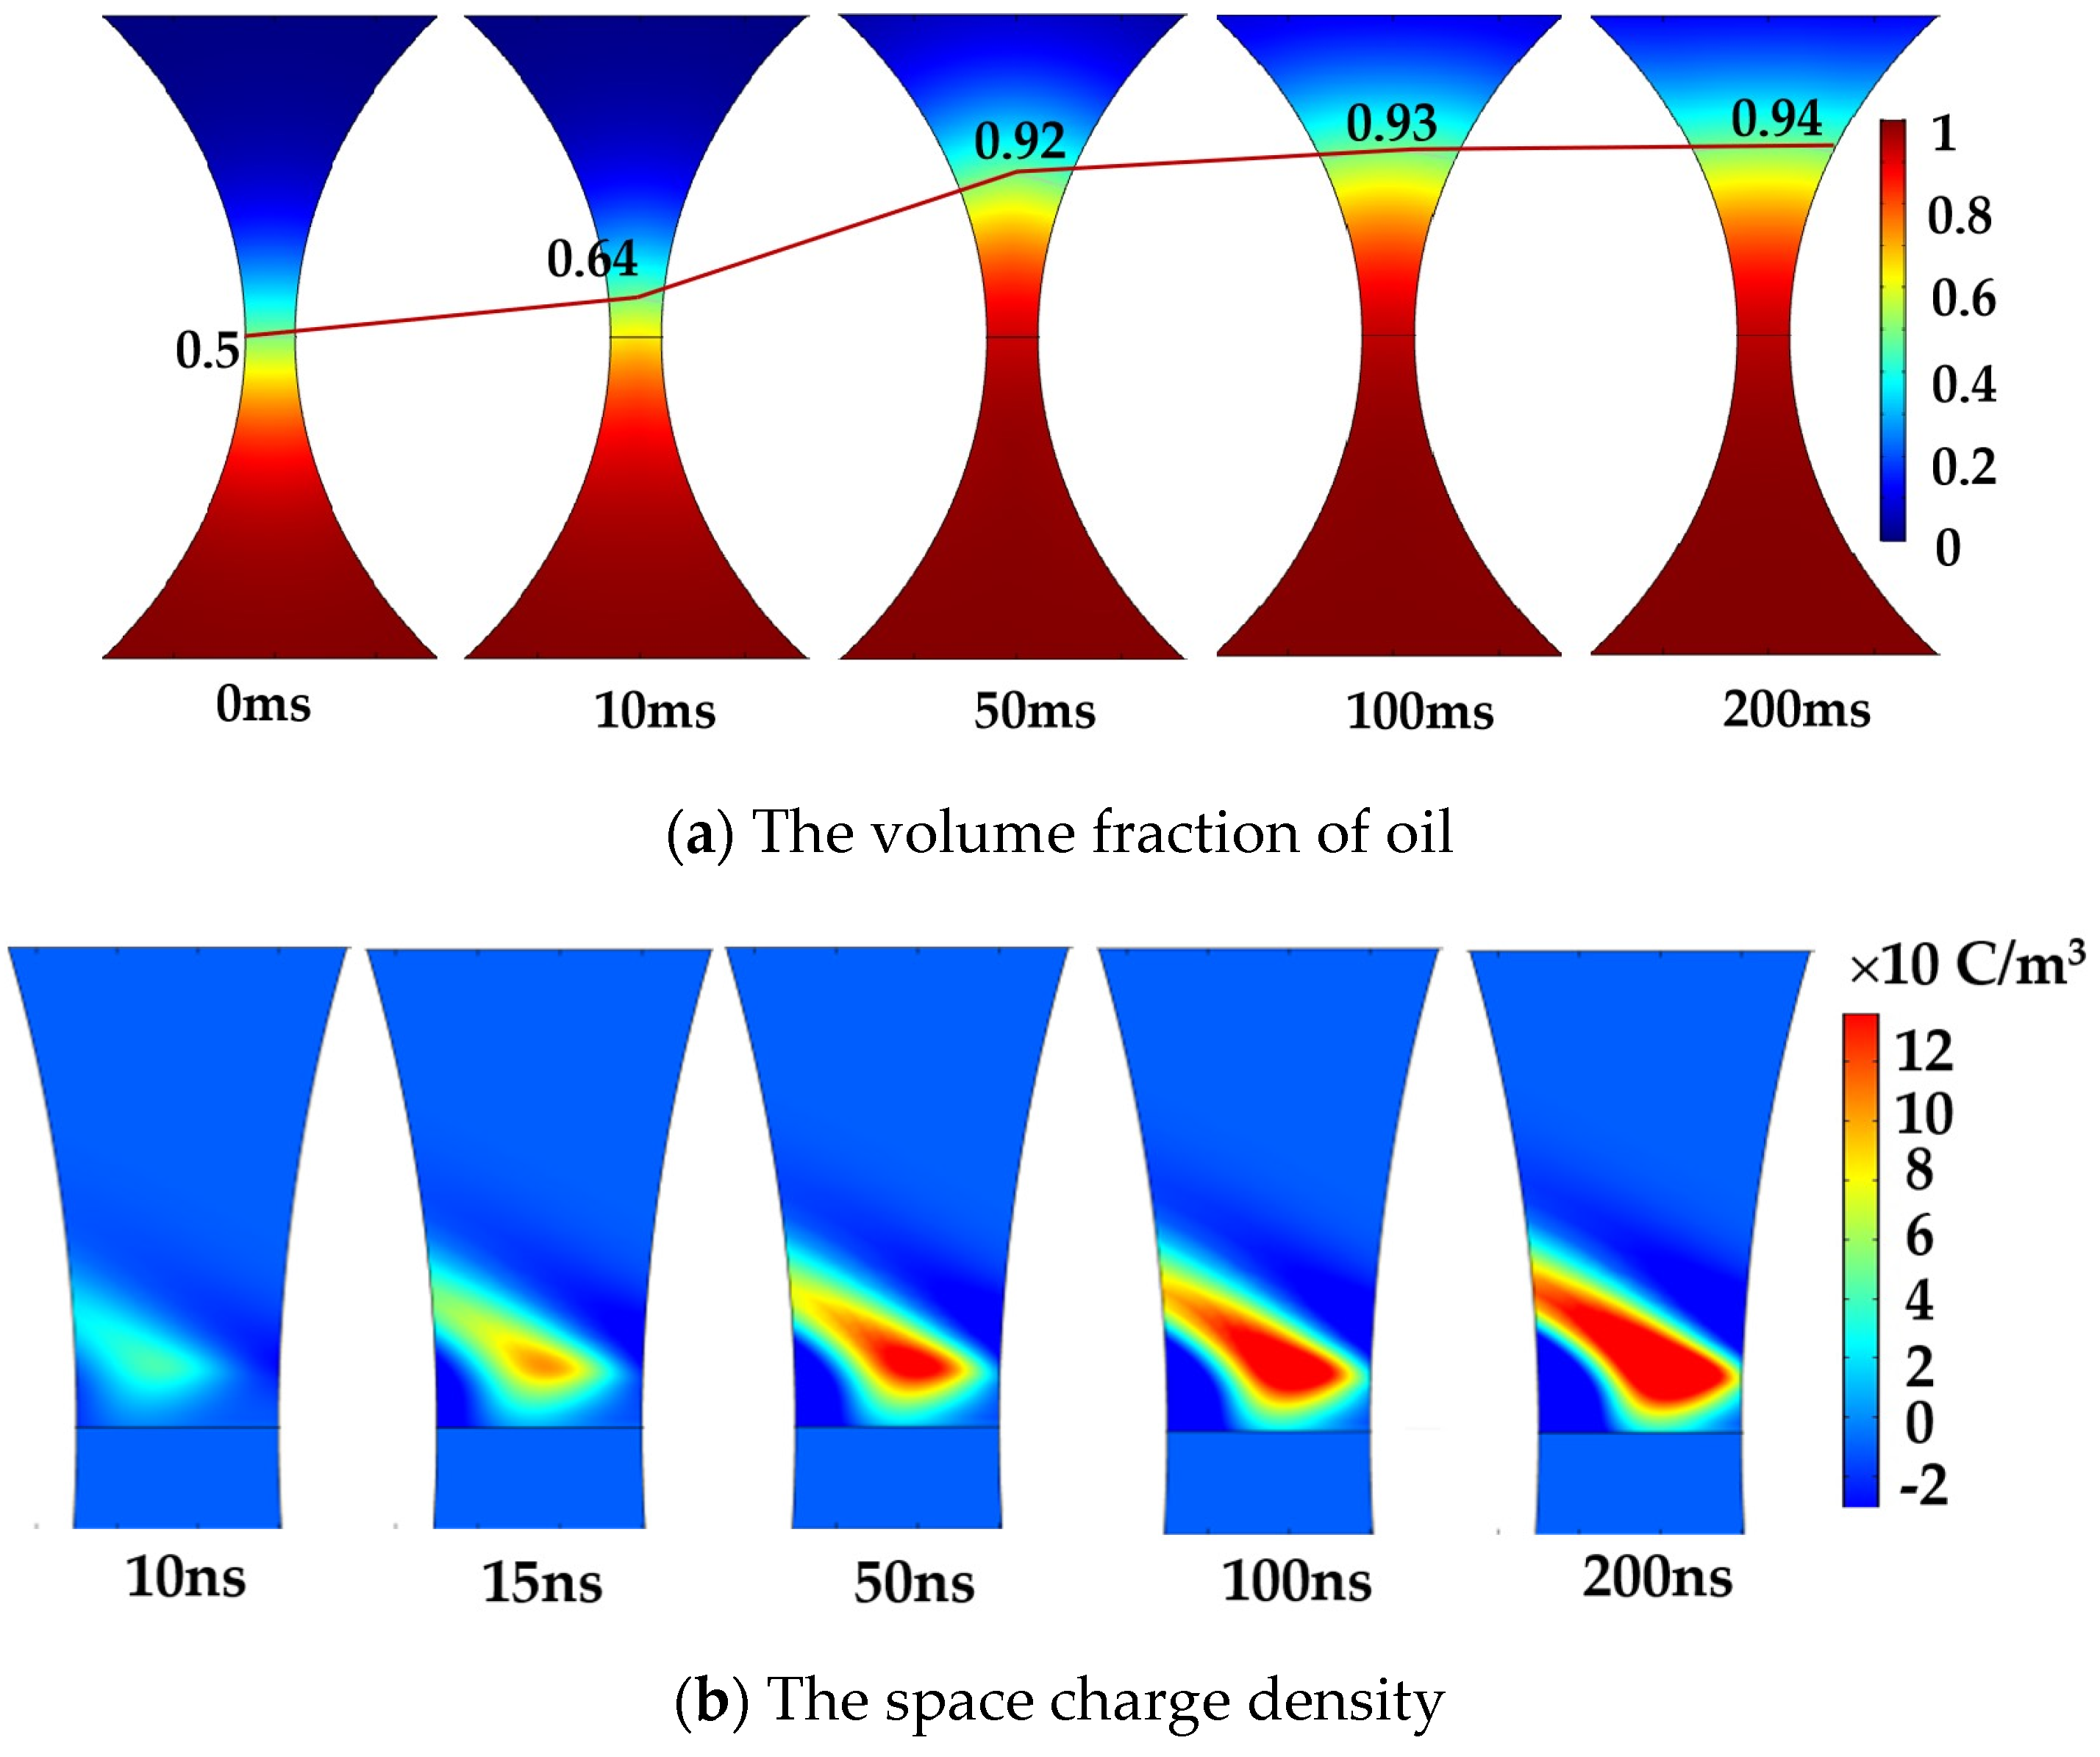
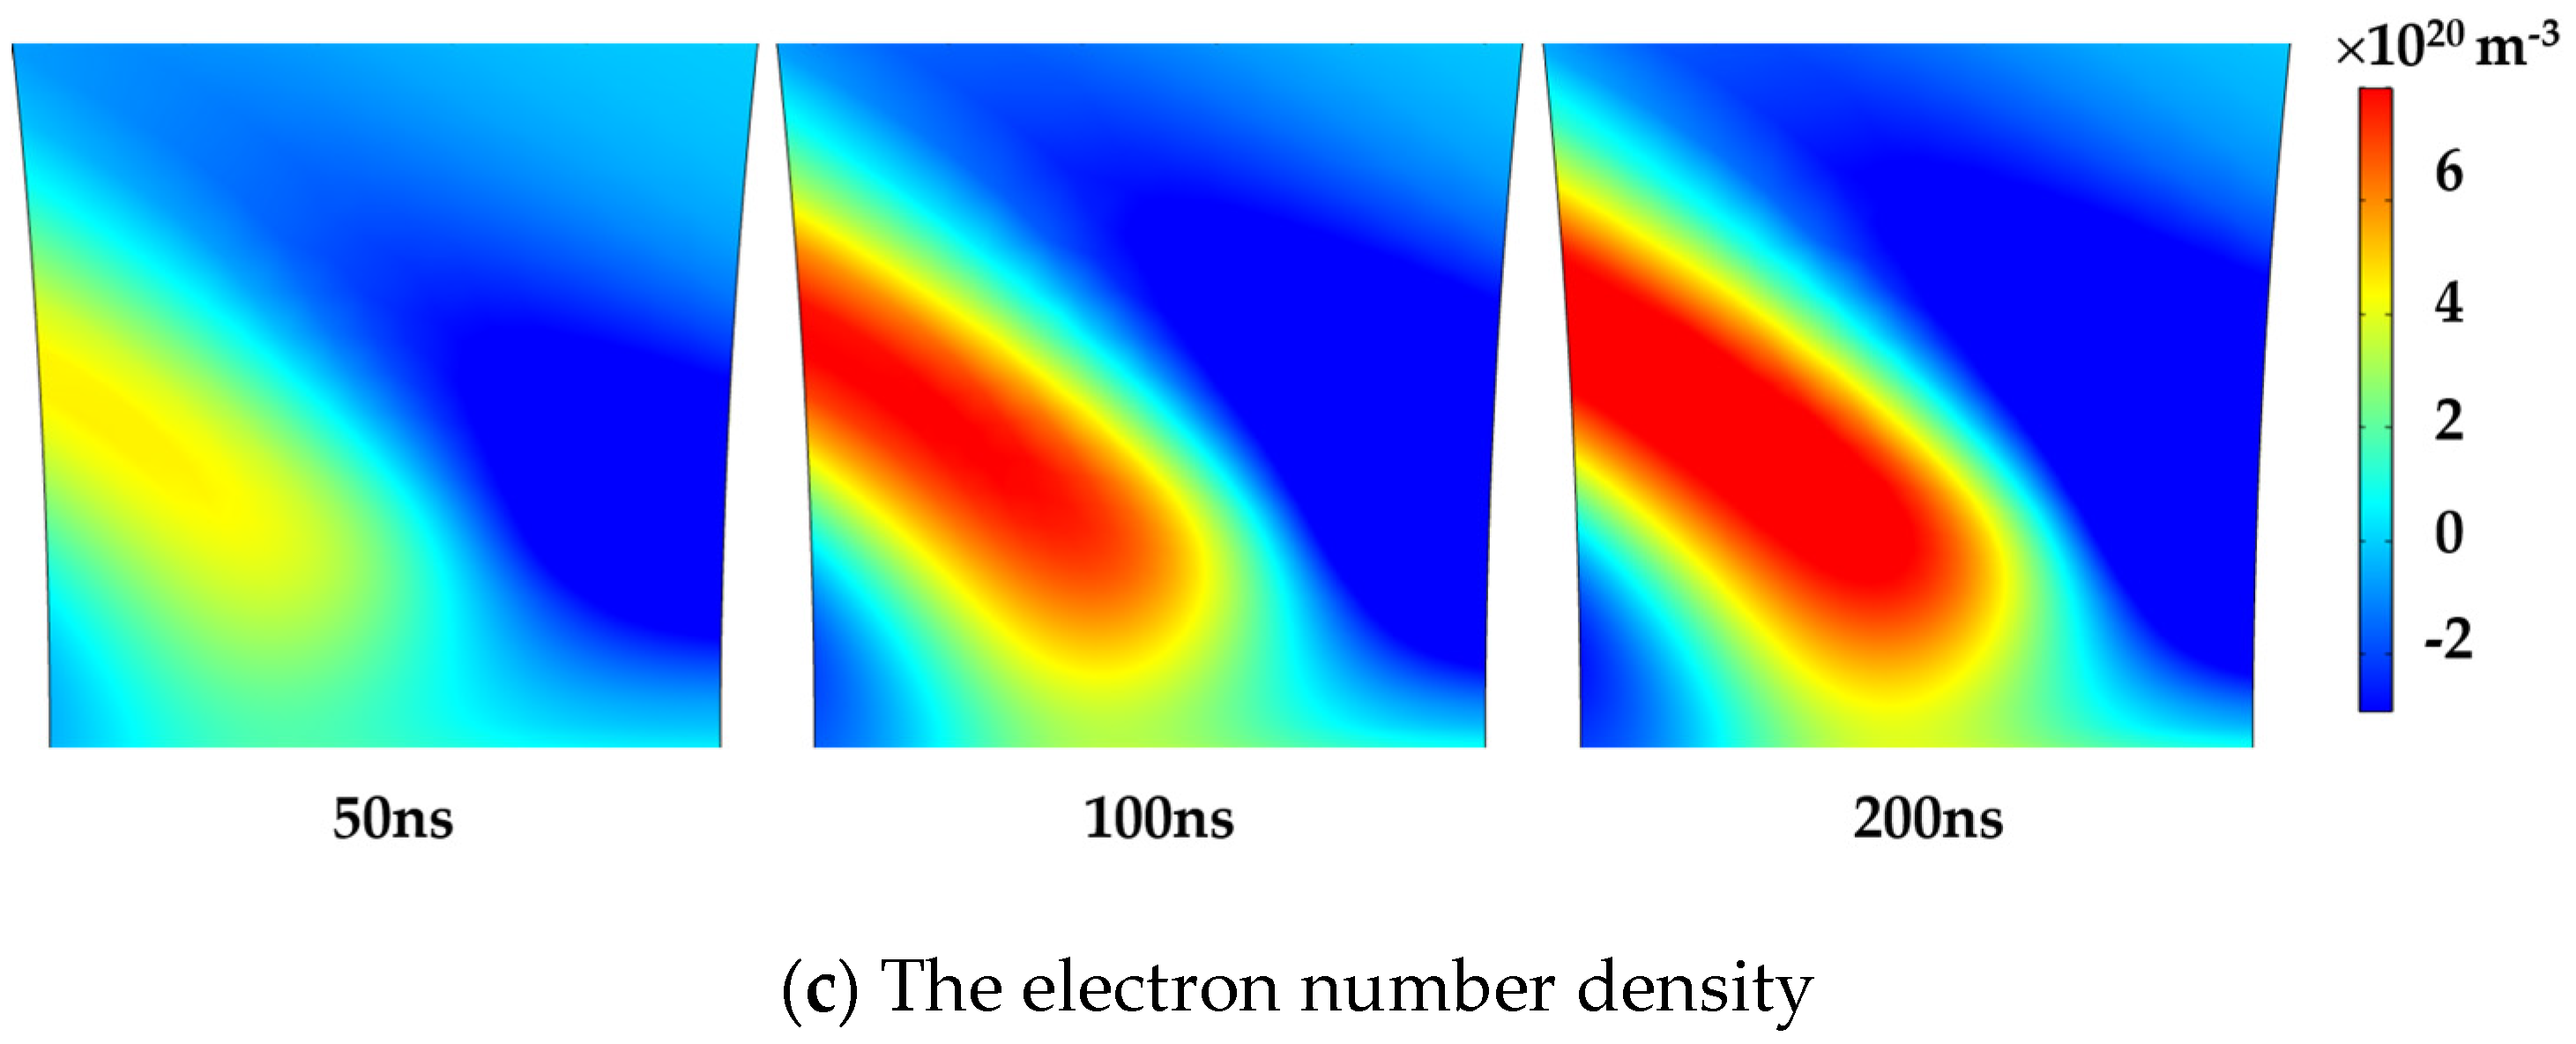
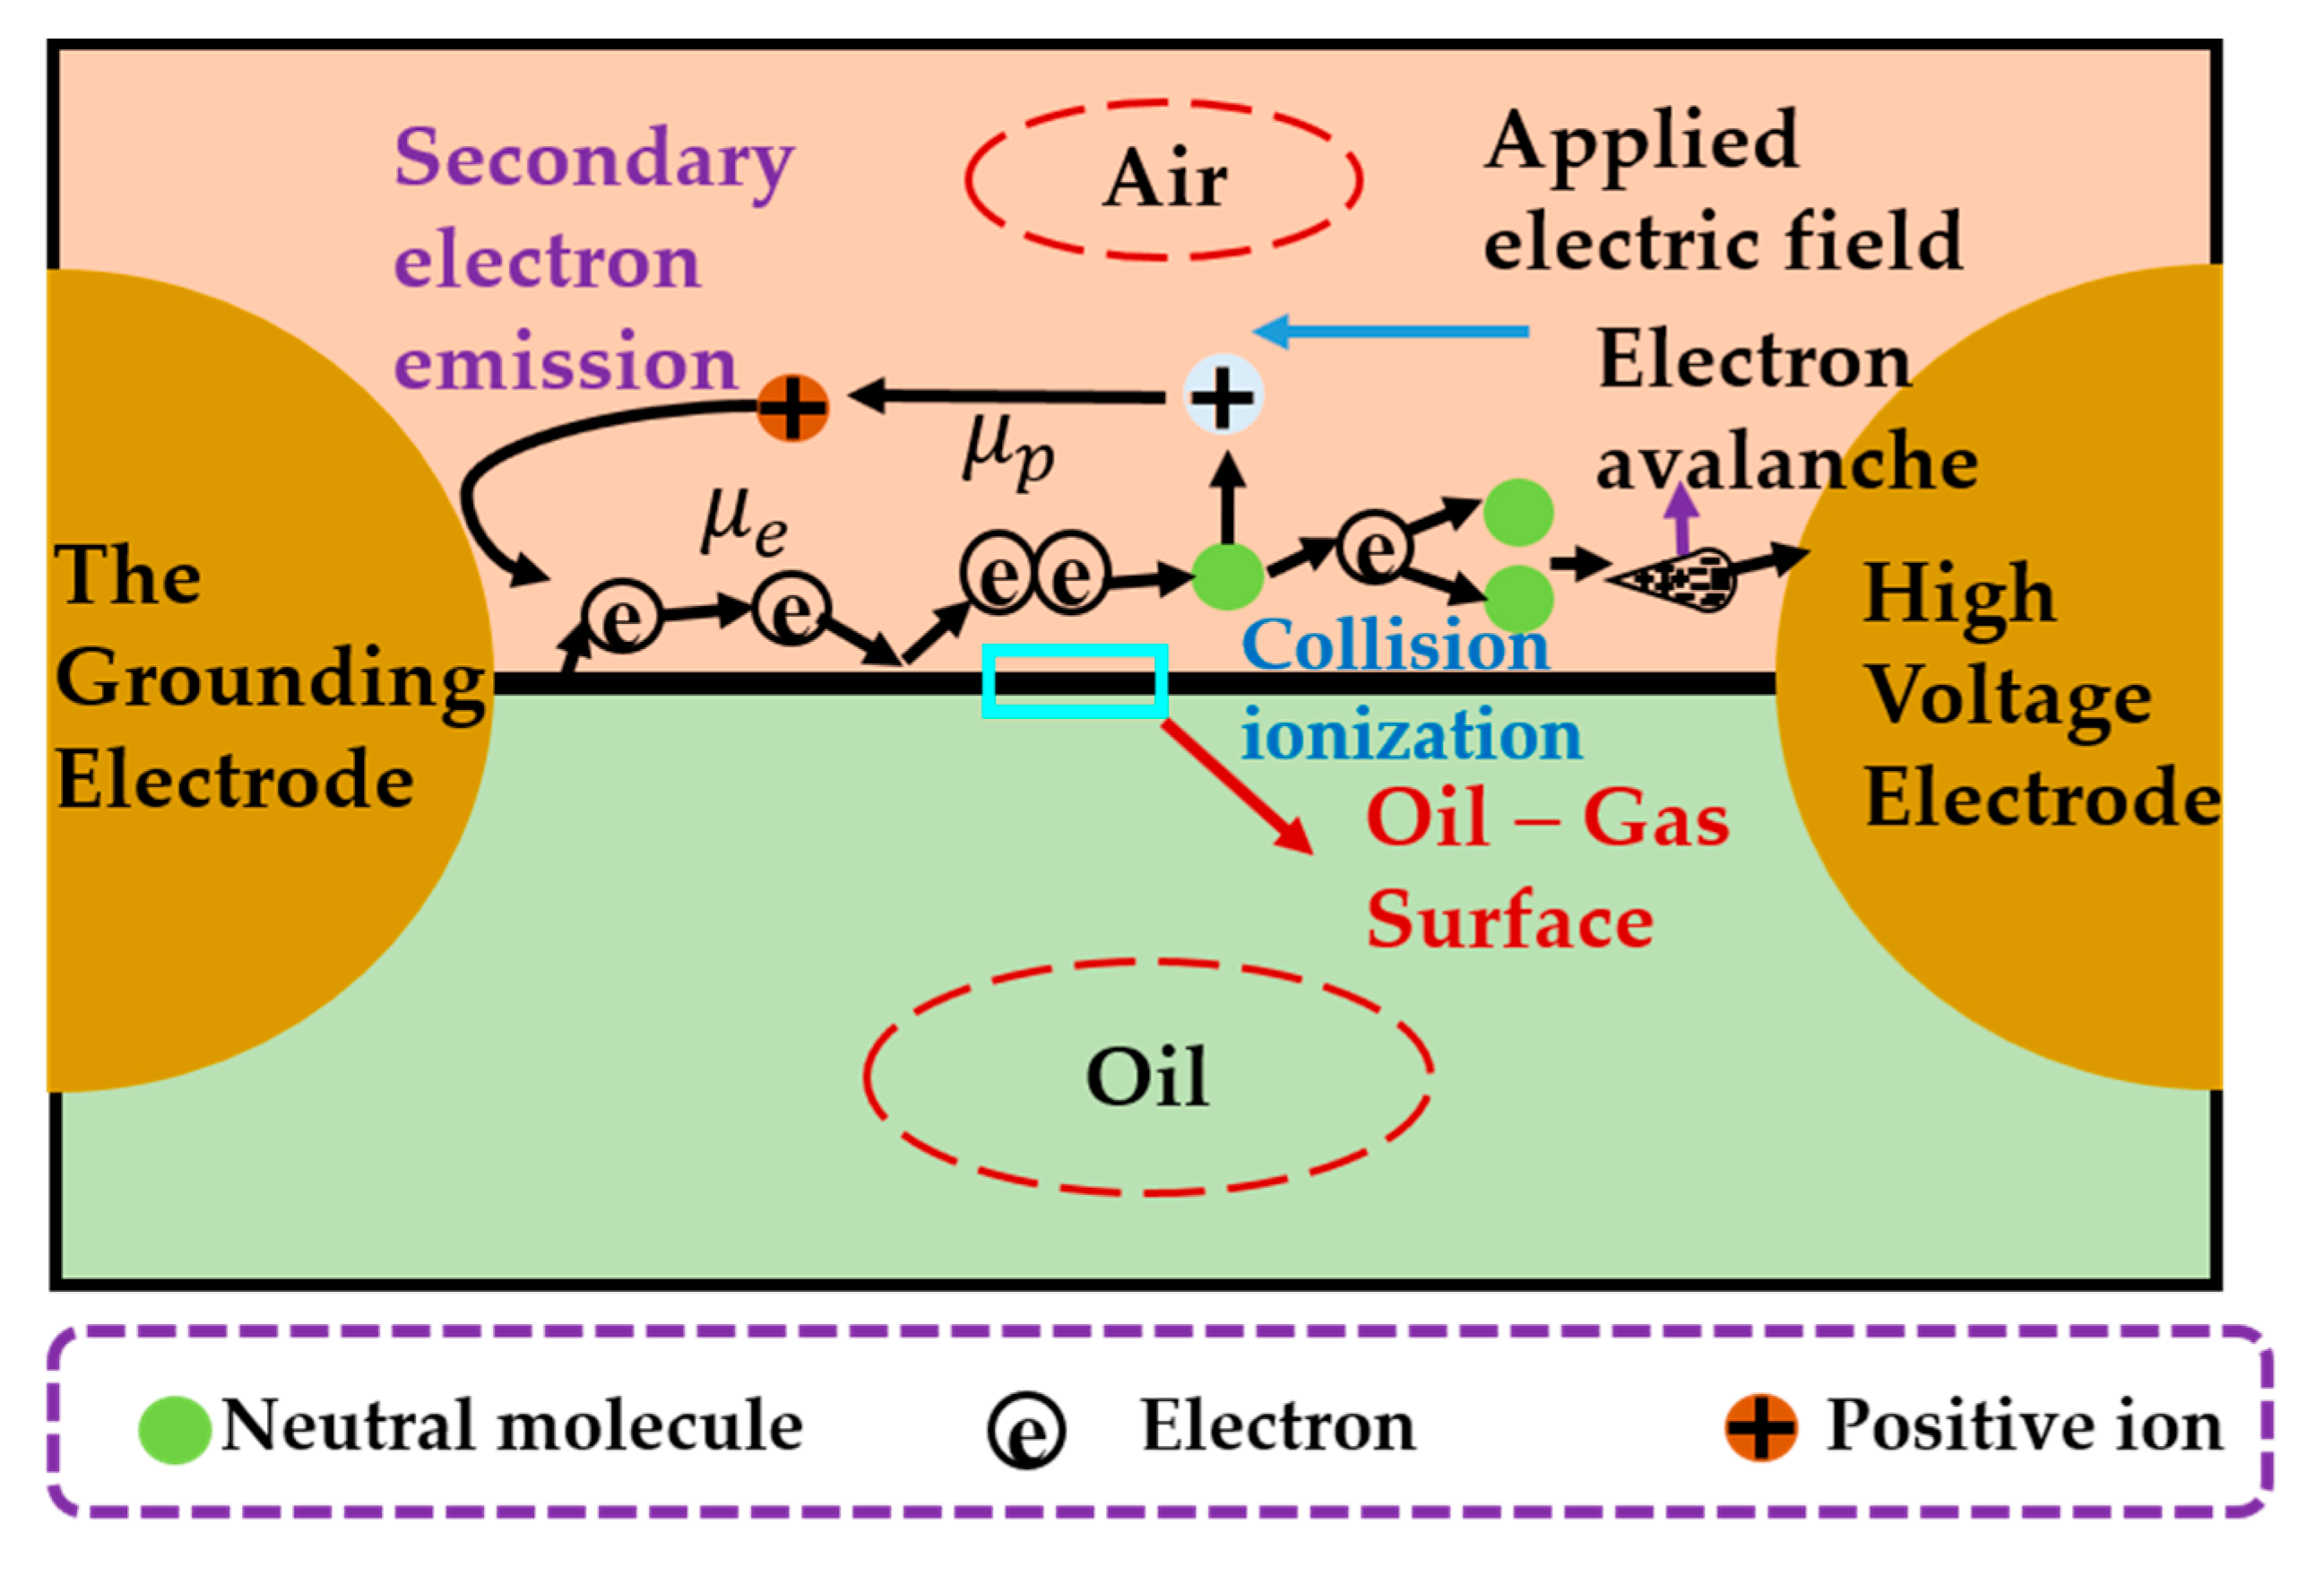
As space charge can affect the distribution of the electric field, space charge development is first concerned during the oil–gas surface discharge. Since the oil–gas surface discharge occurs on the air side and is mainly the contribution of electrons, it focuses on electron density changing on the air side. Meanwhile, the change in oil volume fraction is also analyzed due to the rising liquid surface between the electrodes, shown in Figure 8. Streamer discharge is a general term for various discharge initiation and development processes before the dielectric breakdown, characterized by high ionization and rapid development. Figure 9 depicts the motion process of charged particles during the streamer discharge [40,41].
The simulation results indicate that the oil–gas surface discharge follows a typical streamer development process. With a constant voltage of 50 kV and a 2.5 mm gap distance, the streamer penetrates the whole gap for 200 ns. The space charge density increases from 0.283 C/m3 to 116 C/m3, and the electron number density on the air side reaches 9.6 × 10²⁰ m−3. With the external electric field applied, an initial electron moves from the cathode to the anode, and collisional ionization occurs and develops into an electron avalanche. During the movement toward the anode, the electrons accumulate in the crash head, and the positive ions remain in the tail. The negative space charge formed by the electrons at the avalanche head strengthens the anode electric field and distorts the electric field distribution, and the avalanche is converted into a streamer and continues to move towards the anode. The distribution of space charge in the streamer determines the distribution of the electric field, which is also the fundamental reason for the development of the streamer discharge process.
During the process of oil–gas surface discharge, the variation in oil volume fraction reflects the changes in liquid surface height. The oil volume fraction is 0.5, representing the liquid surface at the initial surface. The oil volume fraction increases to 0.94 at t = 200 ms, and the liquid surface rises by 16.1 mm relative to the initial surface. The liquid surface rise is mainly due to the electric field force applied to the fluid unit. When the electric field force balances exactly with gravity and surface tension, the oil volume fraction stabilizes, and the liquid surface reaches the equilibrium height. The oil is a weakly polar dielectric. The dielectric produces a polarized charge polarization with the external electric field, expressing itself as an electric dipole moment in the electric field direction. Although the dielectric is still electro-neutral, the polarization charge, also called bound charge, will appear at the two dielectric surfaces, thus causing the oil–gas surface to be affected by the electric field force.

4.2. The Influence of Gap Distance on Streamer Development

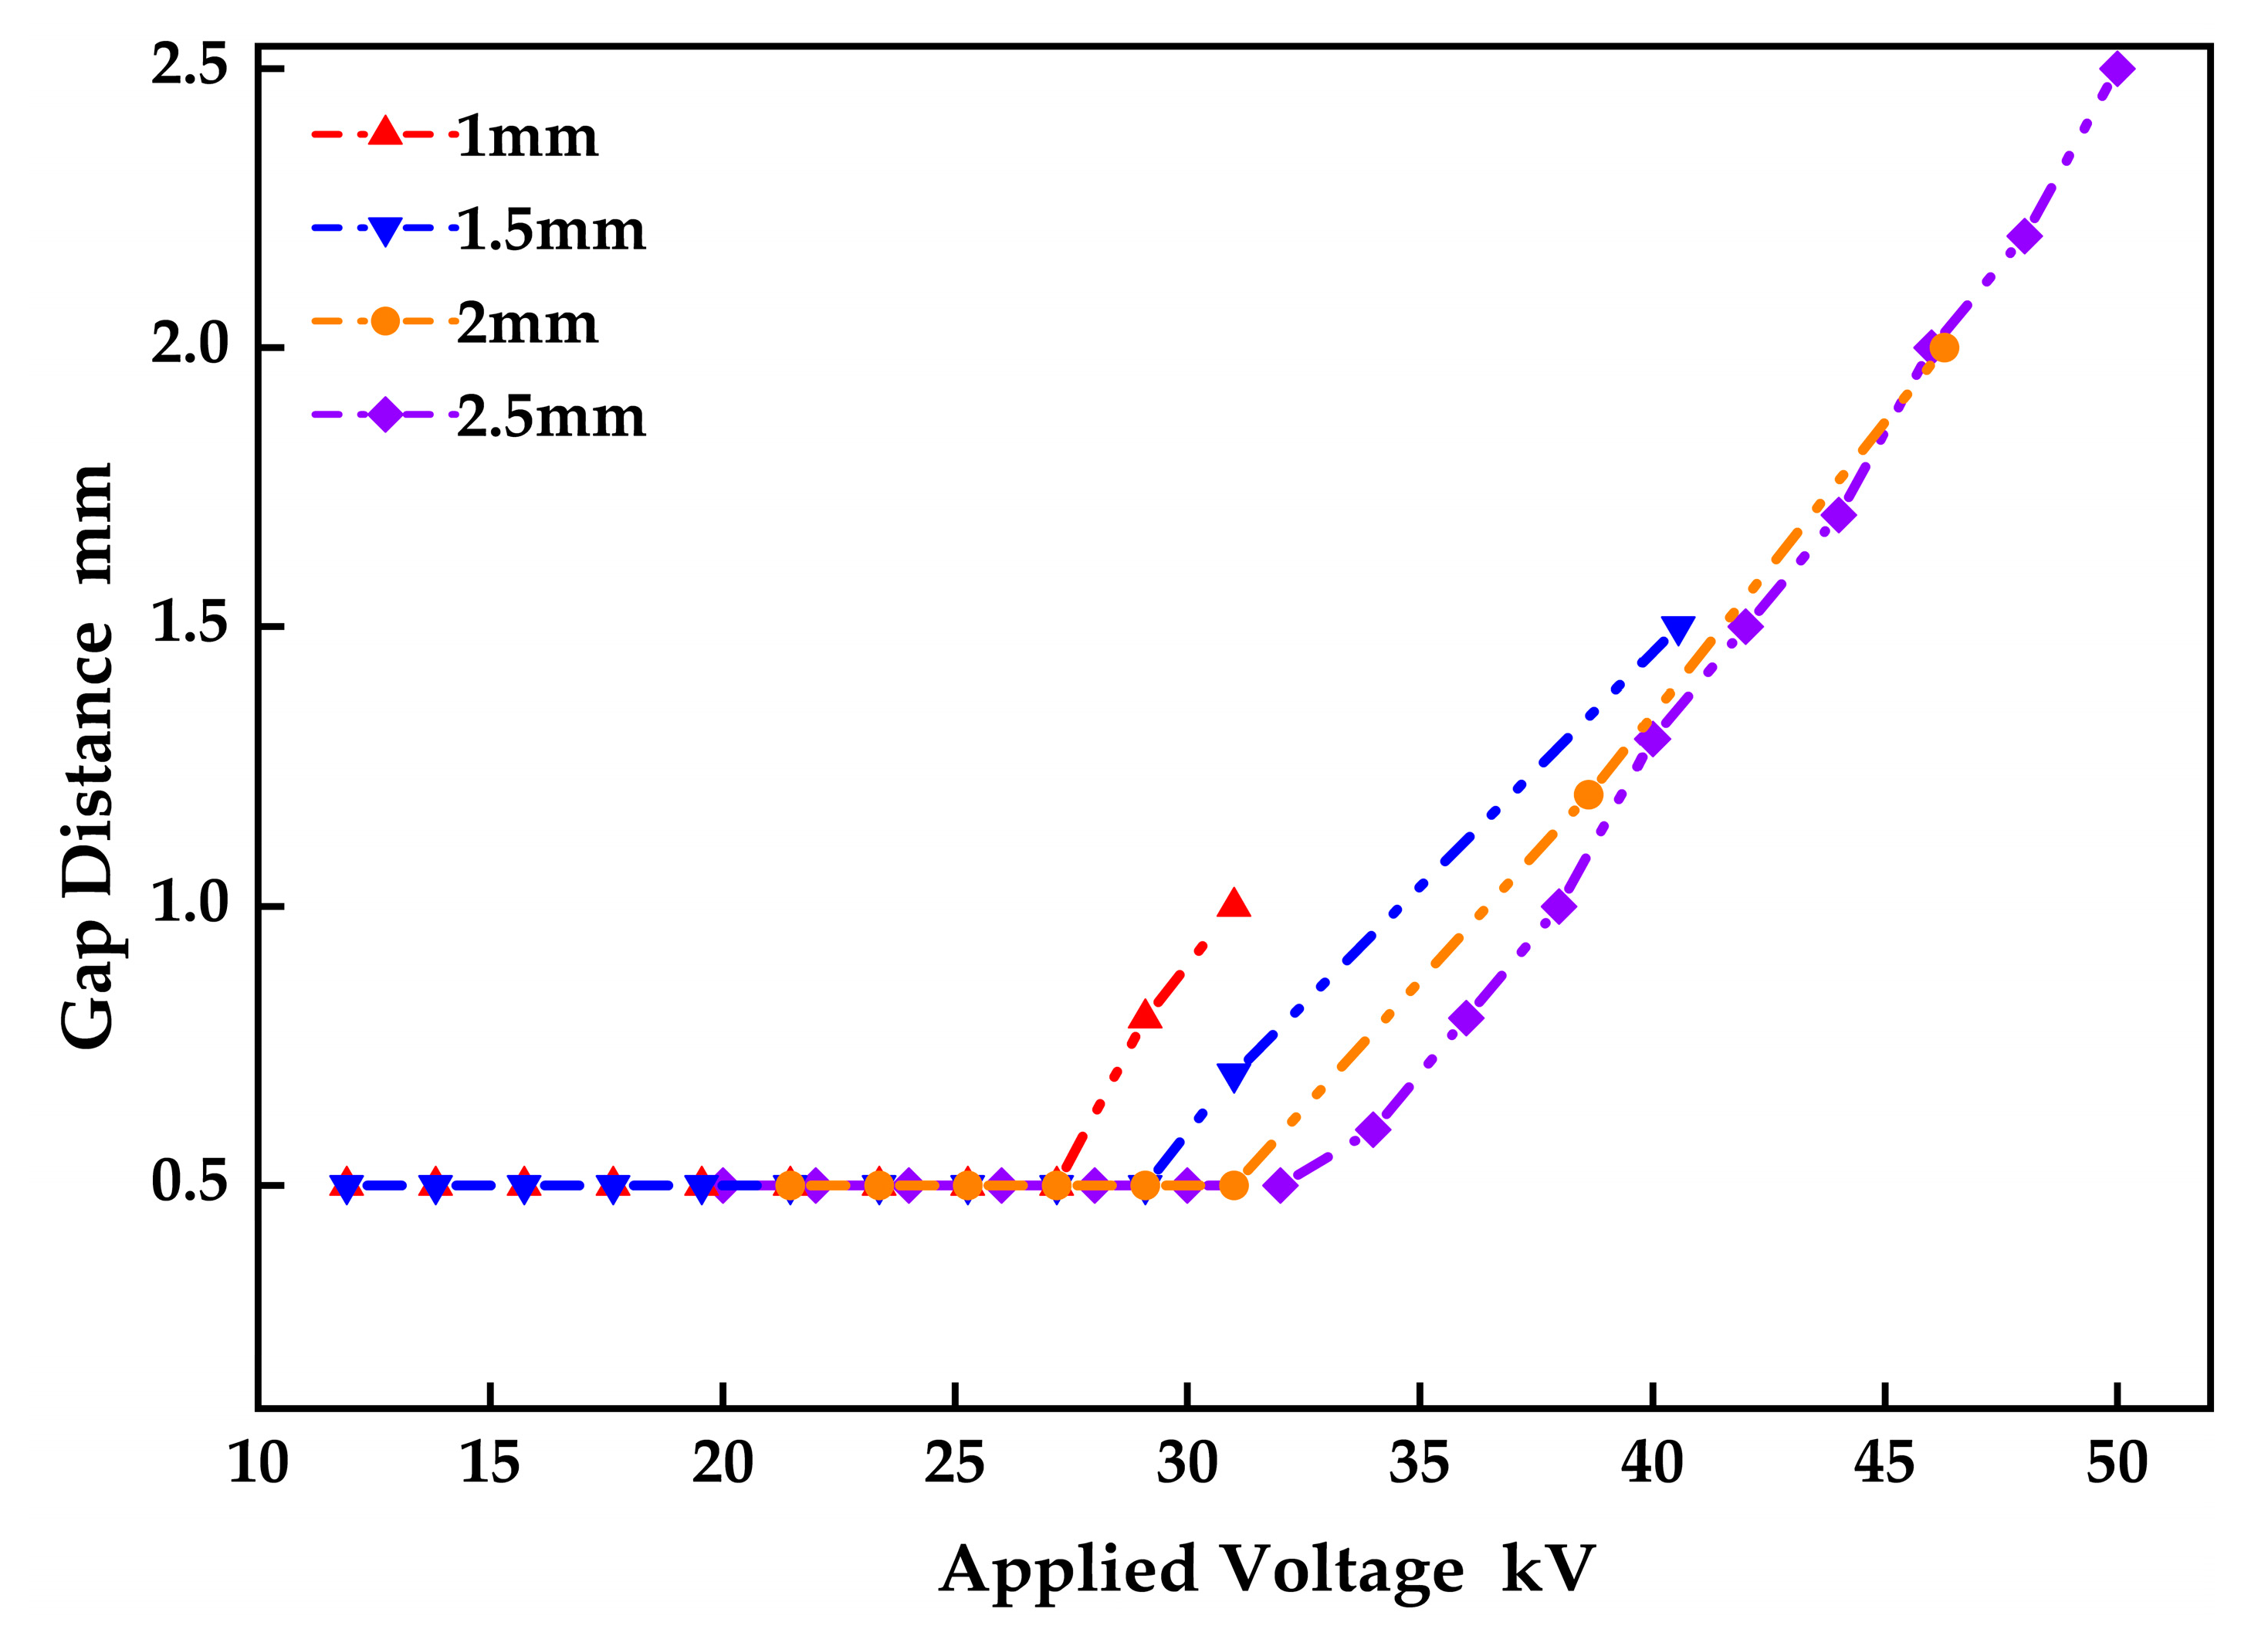
The influence of the gap distance on the surface discharge voltage is analyzed by the variation in the streamer length with the applied voltage. The oil–gas surface discharge at four gap distances of 1, 1.5, 2, and 2.5 mm was numerically simulated. Figure 10 presents the variation in oil–gas surface discharge streamer length at different gap distances.
The length of the streamer is affected by both the initial voltage and the discharge voltage at the oil–gas surface. As can be seen from Figure 10, the oil–gas surface discharge voltage is about 30 kV, 40 kV, 46 kV, and 50 kV at the gap distance of 1 mm, 1.5 mm, 2 mm, and 2.5 mm, respectively. The gap distance affects not only the oil–gas surface discharge voltage but also the streamer initiation voltage. When the gap distance is 2.5 mm, the streamer initiation voltage is about 20 kV, which is twice the streamer initiation voltage at the gap distance of 1 mm. In both cases of test and simulation, the variation in the oil–gas surface discharge voltage with the gap distance is the same, but the simulation data are slightly larger than the test data. As the gap distance is 2.5 mm, the simulation data is 3.84% higher than the test data. The reasons for the error include the following: (1) The DC voltage applied in the test is a long-term voltage boost process, and there is a large amount of space charge accumulation before discharge, which is conducive to discharge, while the simulation represents the moment of the DC voltage discharge process; (2) the error caused by the assumption of finite element theory and the simplification of the model.

4.3. Effect of Gap Distance on Charge Distribution

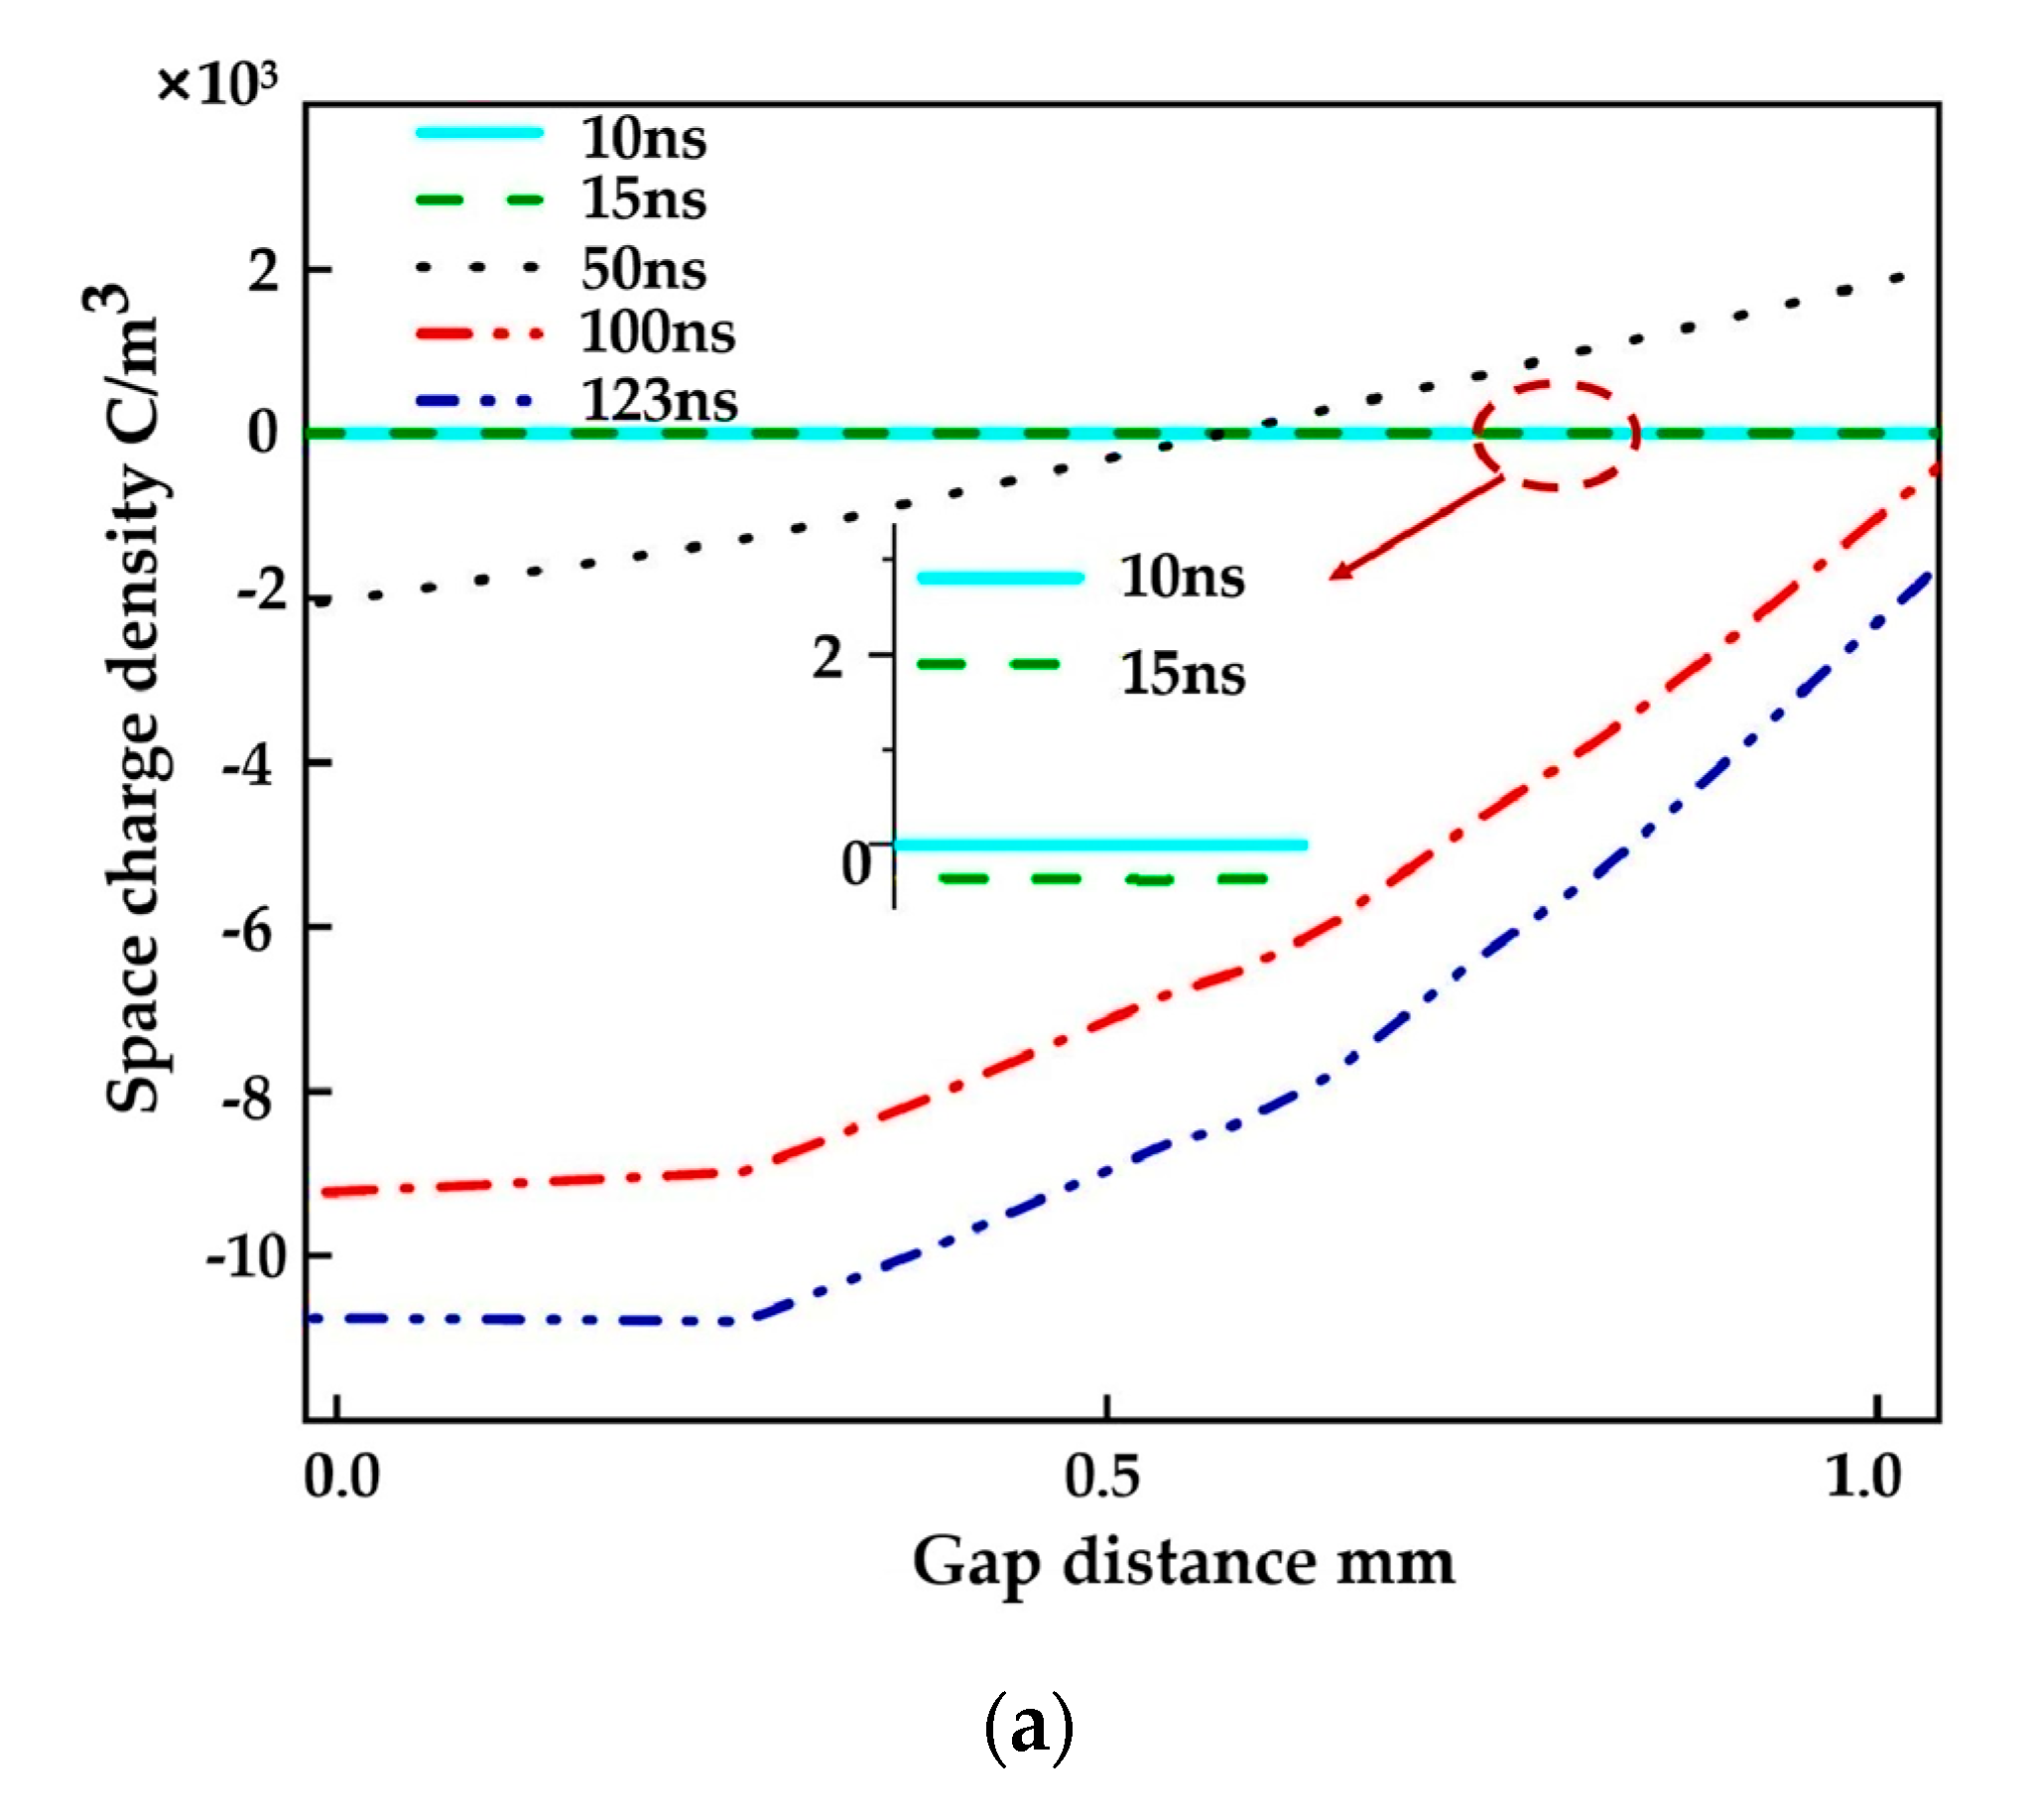
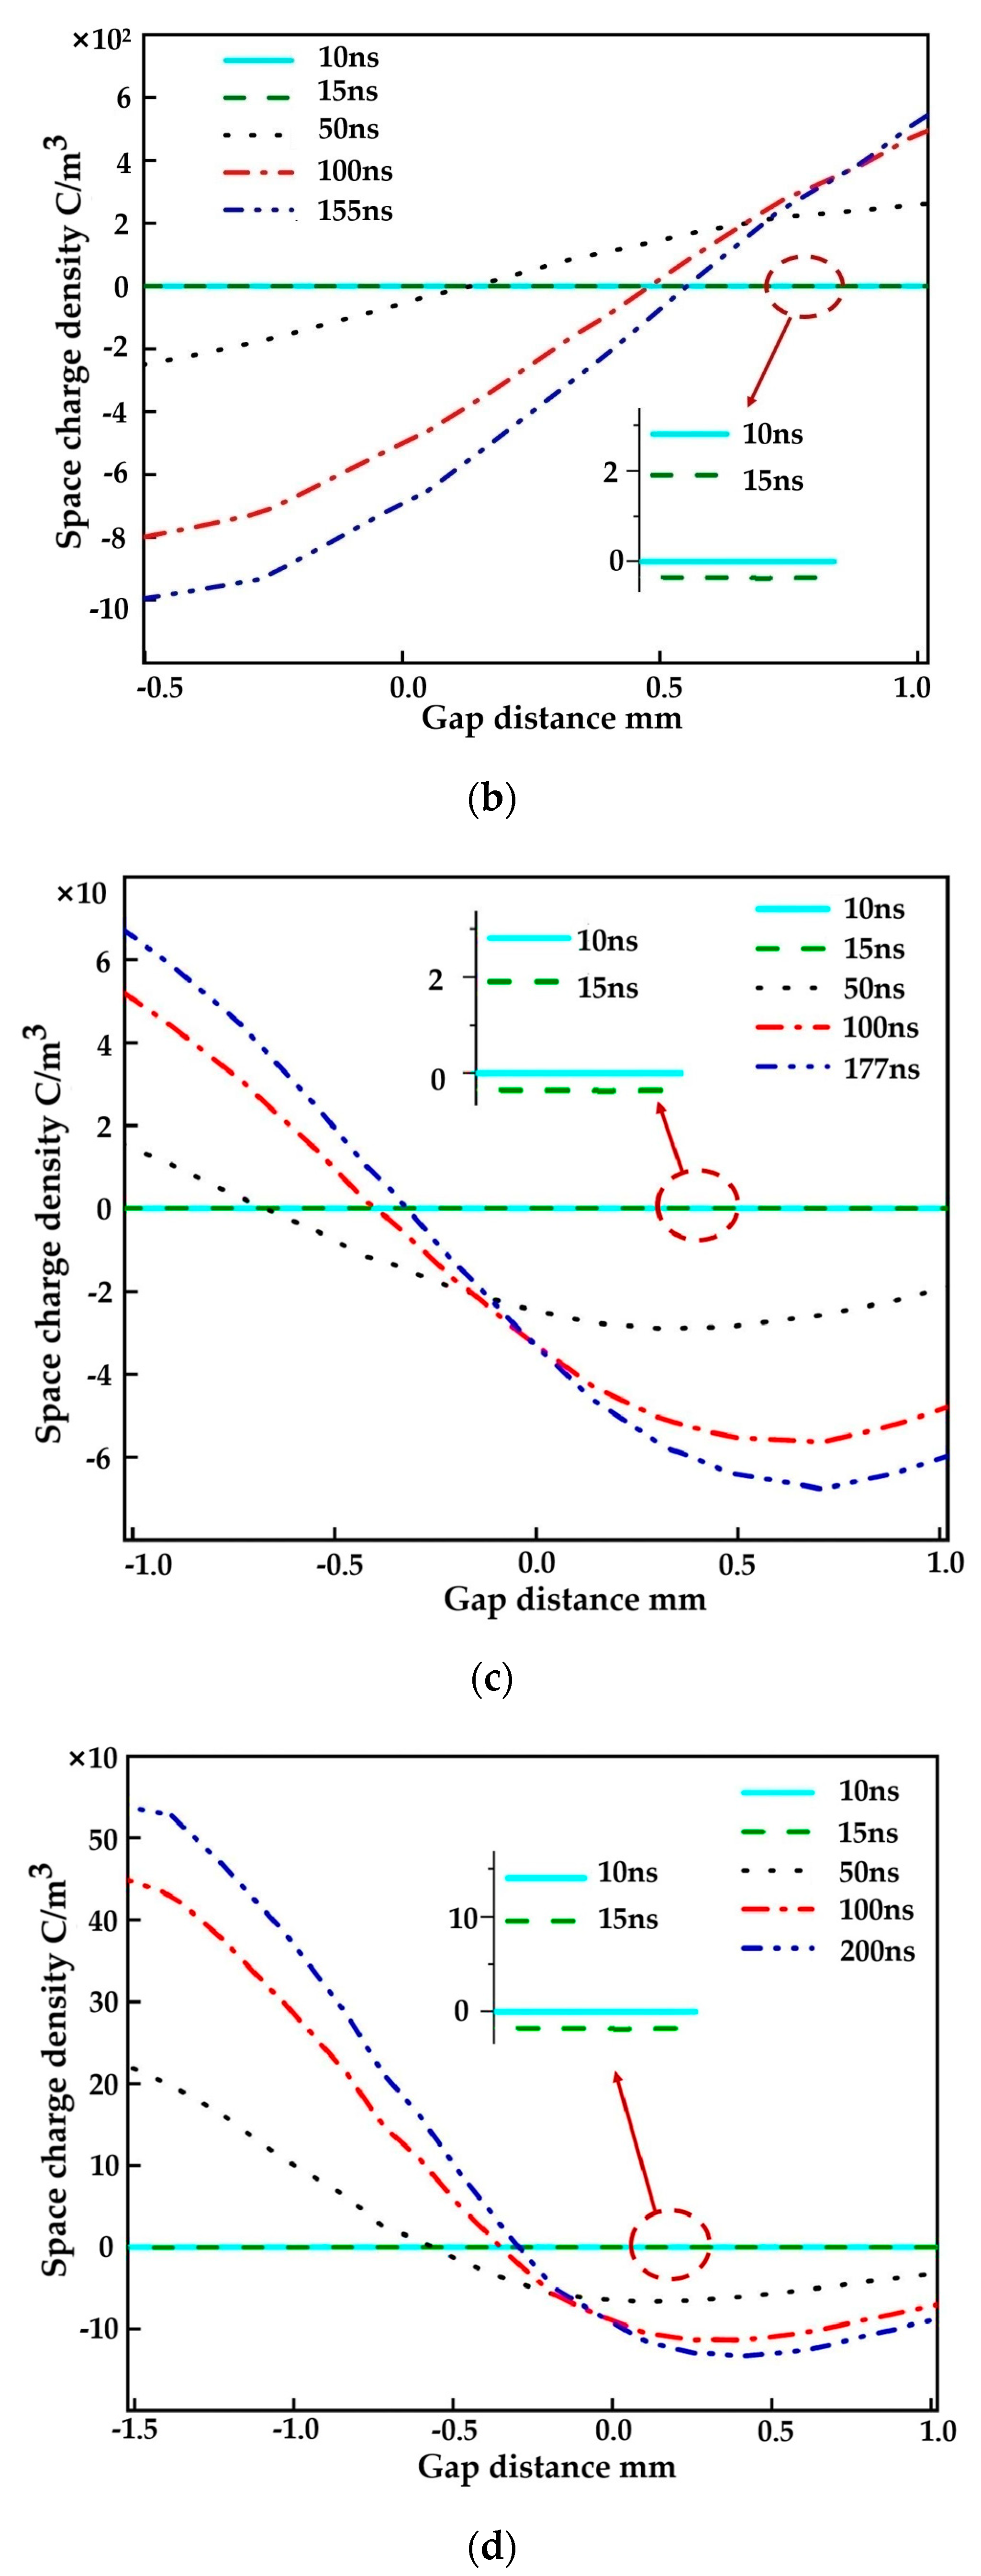
The electrode gap distances were varied to 1 mm, 1.5 mm, 2 mm, and 2.5 mm in this section, respectively, and 50 kV voltage was applied to investigate the variation of space charge density. The space charge densities at the 100 ns were 1.81 × 10⁴ C/m3, 2.88 × 10³ C/m3, 88.7 C/m3, and 98.4 C/m3 under the four gap distances. The space charge density is significantly higher at the 1 mm gap distance than that at the other three gap distances. The short gap distance is more conducive to initiating and developing the oil–gas surface discharge. Moreover, the electric field strength varies with the gap distance and space charges. Changing the gap distance from 2.5 mm to 1 mm increases the maximum field strength from 2.03 × 10⁷ V/m to 5.03 × 10⁷ V/m, 2.5 times the maximum field strength at 2.5 mm. It shows the synergistic promotion of space charge density and electric field strength. The electric field strength decreases with increasing gap distance, which is consistent with the variation law of electric field strength in slightly inhomogeneous electric fields.
Figure 11 depicts the trend of space charge variation at the surface along the radial direction. The smaller the gap distance, the higher the charge density at the surface. The maximum charge density at the surface is 72.7 C/m3 as the discharge develops to 100 ns. The charge density is 9.06 × 10³ C/m3 at the 1 mm gap distance. Moreover, at the gap distances of 1 mm and 1.5 mm, the space charge near the anode is positive, while the space charge near the cathode is negative. Because the mobility of positive ions is much smaller than that of electrons (less than 5 orders of magnitude), the displacement is small in the time scale of the streamer development. The space charge near the cathode is positive at 2 mm and 2.5 mm gap distances. Since the avalanche has not yet developed into the anode, it has formed a streamer from the cathode to the anode. The difference in mobility between electrons and positive ions causes the electrons to sit in the crash head and the positive ions to stay in the crash tail. In addition, the electric field strength in the gap can affect the discharge form at the oil–gas surface. When the gap distance is 1 mm and 1.5 mm, the streamer discharge starts from the anode and develops to the cathode, called an anode streamer. When the gap distance is 2 mm and 2.5 mm, the discharge develops from the cathode to the anode, which is called the cathode streamer.

4.4. Influence of Gap Distance on Velocity

The velocity changes in the process of oil–gas surface discharge are mainly reflected in the streamer development speed and the rising speed of the liquid surface. Figure 12a shows the changes in streamer velocity and liquid surface rising velocity at different gap distances. With the increase in gap distance, the average streamer velocity speeds up. The average streamer velocity increases by 53.8% from 8.13 km/s to 12.5 km/s as the gap distance rises from 1 mm to 2.5 mm. With the gap distance increasing, more gas molecules will be ionized, speeding up the rate of space charge generation. The long gap distance also makes streamer discharge have a longer acceleration distance. The smaller the gap distance is, the faster the liquid surface rises. The gap distance decreases from 2.5 mm to 1 mm, t = 10 ms, and the peak liquid level rising speed increases from 0.55 m/s to 1.18 m/s, increasing by 114.5%. The short gap distance results in a stronger electric field, causing a larger electrostatic force on the surface, resulting in a faster liquid surface rise.
As can be seen from Figure 12b, the liquid surface rise velocity variation follows a parabolic trend. Since the electric field at the closest point of the two electrodes is the maximum, the surface tension on the oil–gas surface is also the largest, which makes the liquid surface rise mainly occur between the two electrodes. At t = 10 ms, the liquid surface rises the fastest. From 10 ms to 100 ms, the peak rising velocity of the liquid surface decreased from 0.55 m/s to 0.073 m/s. t = 200 ms, the height of the liquid surface reached a stable state, and its rising speed was 0.03 m/s.

5. Conclusions

A DC discharge platform with a video capture system for the discharge process was constructed. A simulation model was established to simulate space charge behaviors during the oil–gas surface discharge process under DC voltage. The pictures of discharge at the oil–gas surface are demonstrated. The initiation and development of the oil–gas surface discharge under DC voltage and the effect of the gap distance on the discharge characteristics have been investigated through experiments and simulations. The following conclusions are drawn:
(1)
The oil–gas surface discharge starts at the surface and develops towards the air side. The discharge voltage is higher than the air gap discharge voltage.
(2)
Oil–gas surface discharge is a typical streamer process. The streamer form is a cathode streamer. It is triggered by the electron emission at the junction of oil, electrode, and gas. Finally, a penetrating conductive channel forms above the initial surface.
(3)
As the gap distance increases from 1 mm to 2.5 mm, the average velocity of streamer development increases from 8.13 km/s to 12.5 km/s, an increase of 53.8%. Because the gap distance increases, more gas molecules will be ionized, accelerating the space charge generation.
(4)
The electric field strength in the gap can affect the discharge form of the oil–gas surface. If the gap distance increases from 1 mm to 2.5 mm, the discharge voltage will increase by 60%, and the form of the surface discharge streamer will change from the anode streamer to the cathode streamer.
(5)
Regarding the content and conclusions of this study, it is found that there are still many aspects that need to be improved. Therefore, future research should delve into the factors affecting oil–gas surface discharge, such as voltage form, gas components, and long gap distance on oil–gas surface discharge.
(6)
The study of oil–gas surface discharge in oil-immersed power equipment has significant practical and theoretical significance. It can provide a theoretical basis and technical support for the diagnosis and prediction of faults in power equipment.

Author Contributions

Conceptualization, formal analysis, investigation, data curation, writing—review and editing, X.Y. and Y.L.; methodology, resources, writing—original draft preparation, software, project administration, funding acquisition, Y.Z.; validation, visualization, supervision, J.C. and G.J. All authors have read and agreed to the published version of the manuscript.

Funding

This research was funded by the Science and Technology Program of State Grid Cooperation (no. SGTYHT/20-JS-221).

Data Availability Statement

Not applicable.

Acknowledgments

We thank all the reviewers for their valuable comments to improve our manuscript.

Conflicts of Interest

The authors declare no conflict of interest.

References

  1. Rafiq, M.; Shafique, M.; Azam, A.; Ateeq, M. The impacts of nanotechnology on the improvement of liquid insulation of transformers: Emerging trends and challenges. J. Mol. Liq. 2020, 302, 112482. [Google Scholar] [CrossRef]
  2. Li, W.; Wang, J.; Luo, W.H. Analysis and suggestions on the sudden fault of transformer caused by 750 kV bushing defect. High Volt. Appl. 2016, 52, 216–220. [Google Scholar]
  3. Cigre, J.T.F. 12/14 10-01: Service Performance of HVDC Converter Transformers and Oil-cooled Smoothing Reactors. Electra 1994, 155, 7–32. [Google Scholar]
  4. Jin, F.B.; Zhou, Y.X.; Huang, M. Influence of DC Voltage Component on Surface Discharge Process of Oil Paper Insulation in AC/DC Composite Electric Field. High Volt. Eng. 2015, 41, 3082–3090. [Google Scholar]
  5. Zhang, L.; Chen, J.N.; Zhou, Y.X. Progress in the theoretical model and numerical simulation of space charge dynamics in polymer insulation. Chin. J. Electr. Eng. 2022, 42, 3037–3055. [Google Scholar]
  6. Zhou, Y.X.; Zhao, Y.Z.; Chen, J.N. Flashover characteristics and numerical simulation of oil-paper insulation under dc voltage. Insul. Mater. 2021, 54, 64–72. [Google Scholar]
  7. Ou, Y.X.; Zhou, Q.; Li, X.F. Analysis of microstructure and electrical performance of oil-immersed insulating paper under different AC and DC composite voltage. Chin. J. Electr. Eng. 2019, 39, 7394–7404. [Google Scholar]
  8. Jin, F.B.; Zhou, Y.X.; Huang, J.W. Effect of temperature on surface discharge characteristics of oil-paper insulation under AC/DC composite electric field. High Volt. Eng. 2017, 43, 931–939. [Google Scholar]
  9. Huang, X.; Zhou, Y.X.; Gesang, Q.Z. Construction of Nanocellulose Sandwich-structured Insulating Paper and Its Enhancement for Mechanical and Electrical Properties. IEEE Trans. Dielectr. Electr. Insul. 2021, 28, 1127–1135. [Google Scholar] [CrossRef]
  10. Zhang, P.N.; Li, L.; Cheng, Z.G. Simulation and Test Comparison of Core Vibration of Shunt Reactor and Transformer Models. J. Electr. Technol. 2018, 33, 5273–5281. [Google Scholar]
  11. Cv, L.; Chen, W.G.; Du, J.C. Characteristics of Air Gap Discharge in Vegetable Oil-paper Insulation. J. Electr. Technol. 2018, 33, 618–626. [Google Scholar]
  12. Zaghdoudi, M.; Lallemand, M. Study of the behavior of a bubble in an electric field: Steady shape and local fluid motion. Int. J. Therm. Sci. 2000, 39, 39–52. [Google Scholar] [CrossRef]
  13. Zhang, Y.Z.; Tang, J.; Pan, C.; Luo, X.Y. Simulation of bubble dynamics and electric field distribution in flowing transformer oil. High Volt. Eng. 2020, 46, 2004–2012. [Google Scholar]
  14. Chen, F.; Peng, Y.; Song, Y.Z. Experimental visualization of a single bubble in an electric field. J. Sci. Technol. 2007, 47, 722–725. [Google Scholar]
  15. Morrow, R.; Lowke, J.J. Streamer propagation in the air. J. Appl. Phys. 1997, 30, 61–627. [Google Scholar] [CrossRef]
  16. Jadidian, J.; Zahn, M.; Lavesson, N. Effects of impulse voltage polarity, peak amplitude, and rise time on streamers initiated from a needle electrode in transformer oil. IEEE Trans. Plasma Sci. 2012, 40, 909–918. [Google Scholar] [CrossRef]
  17. Lewis, T.J. Basic electrical processes in dielectric liquids. IEEE Trans. Dielectr. Electr. Insul. 1994, 1, 630–643. [Google Scholar] [CrossRef]
  18. Tobazeon, R. Pre-breakdown phenomena in dielectric liquids. IEEE Trans. Dielectr. Electr. Insul. 1994, 1, 1132–1147. [Google Scholar] [CrossRef]
  19. Chen, P.; Chen, G. Numerical Modeling of Partial Discharges in a Solid Dielectric-bounded Cavity: A Review. IEEE Trans. Dielectr. Electr. Insul. 2019, 26, 981–1000. [Google Scholar]
  20. Meek, J.M.; Craggs, J.D. (Eds.) Electrical Breakdown of Gases; John Wiley & Sons: Chichester, UK, 1978. [Google Scholar]
  21. Zhang, Y.H.; Ma, Q.S. Transmission technique of repetition pulse and intense current electron-beam. Acta Phys. Sin. 2005, 54, 3111–3115. [Google Scholar] [CrossRef]
  22. Masala, G. Positive streamer propagation in large oil gaps: Electrical properties of streamers. IEEE Trans. Dielectr. Electr. Insul. 1998, 5, 371–381. [Google Scholar] [CrossRef]
  23. Lundgaard, L.; Linhjell, D.; Berg, G. Propagation of positive and negative streamers in oil with and without pressboard surfaces. IEEE Trans. Dielectr. Electr. Insul. 1998, 5, 388–395. [Google Scholar] [CrossRef]
  24. Kulikovsky, A.A. Positive streamer between parallel plate electrodes in atmospheric pressure air. J. Appl. Phys. 1997, 30, 441–450. [Google Scholar] [CrossRef]
  25. Harada, M.; Ohga, Y.; Watanabe, I. Ionization energies for solvated polycyclic aromatic hydrocarbons. Chem. Phys. Lett. 1999, 303, 489–492. [Google Scholar] [CrossRef]
  26. Shao, X.J.; Ma, Y.; Li, Y.X.; Zhang, G.J. One-dimensional simulation of low-pressure xenon dielectric barrier discharge. Acta Phys. Sin. 2010, 59, 8747–8754. [Google Scholar] [CrossRef]
  27. Smalø, H.S.; Hestad, Ø.; Ingebrigtsen, S.; Åstrand, P.O. Field dependence on the molecular ionization potential and excitation energies compared to conductivity models for insulation materials at high electric fields. J. Appl. Phys. 2011, 109, 073306. [Google Scholar] [CrossRef]
  28. Korobeynikov, S.M.; Ridel, A.V.; Medvedev, D.A. Registration and simulation of partial discharges in free bubbles at AC voltage. IEEE Trans. Dielectr. Electr. Insul. 2019, 26, 1035–1042. [Google Scholar] [CrossRef]
  29. Sun, A.; Huo, C.; Zhuang, J. Formation mechanism of streamer discharges in liquids: A review. High Volt. 2016, 1, 74–80. [Google Scholar] [CrossRef]
  30. Ha, J.; Liu, L.F.; He, S.J. The Mechanism of Electrode Spacing Effect on Cavity Cathode Self Pulsing Discharge Film. High Volt. Eng. 2021, 47, 796–804. [Google Scholar]
  31. Devins, J.C.; Rzad, S.J.; Schwabe, R.J. Breakdown and pre-breakdown phenomena in liquids. J. Appl. Phys. 1981, 52, 4531–4545. [Google Scholar] [CrossRef]
  32. Zener, C. A theory of the electrical breakdown of solid dielectrics. Proc. R. Soc. A 1934, 145, 523–529. [Google Scholar]
  33. Jadidian, J.; Zahn, M. Charge transport analysis in two-phase composite dielectric systems. IEEE Trans. Plasma Sci. 2013, 41, 2464–2474. [Google Scholar] [CrossRef]
  34. Tobazeon, R.; Filippini, J.C.; Marteau, C. on the measurement of the conductivity of highly insulating liquids. IEEE Trans. Dielectr. Electr. Insul. 1994, 1, 1000–1004. [Google Scholar] [CrossRef]
  35. Wang, Q.; Wang, M.; Wang, Y.; Yan, P. Simulation of two-phase flow discharge in transformer oil under nanosecond pulse. Intense Laser Part. Beam 2020, 32, 63–67. [Google Scholar]
  36. Mahjour, S.K. Evaluation of unsupervised machine learning frameworks to select representative geological realizations for uncertainty quantification. J. Petrol. Sci. Eng. 2022, 209, 109822. [Google Scholar] [CrossRef]
  37. Ahmadi, S. Proposing a modified mechanism for determination of hydrocarbons dynamic viscosity, using artificial neural network. Petrol. Sci. Technol. 2020, 38, 699–705. [Google Scholar] [CrossRef]
  38. Soltanmohammadi, R. Insights into Multi-Phase Flow Pattern Characteristics and Petrophysical Properties in Heterogeneous Porous Media. EarthDoc 2021, 2021, 1–5. [Google Scholar]
  39. Shao, T.; Sun, G.S.; Yan, P. Calculation of escape process of high energy fast electrons under nanosecond pulse. J. Phys. 2006, 11, 5964–5968. [Google Scholar]
  40. Fujita, H.; Kanazawa, S.; Ohtani, K. Initiation process and propagation mechanism of positive streamer discharge in water. J. Appl. Phys. 2014, 116, 213–301. [Google Scholar] [CrossRef]
  41. Xiang, C.M.; Zhou, Q.; Li, J. Gas production characteristics of vegetable insulating oils under thermal decomposition based on molecular dynamic simulation. High Volt. Eng. 2018, 44, 3595–3603. [Google Scholar]
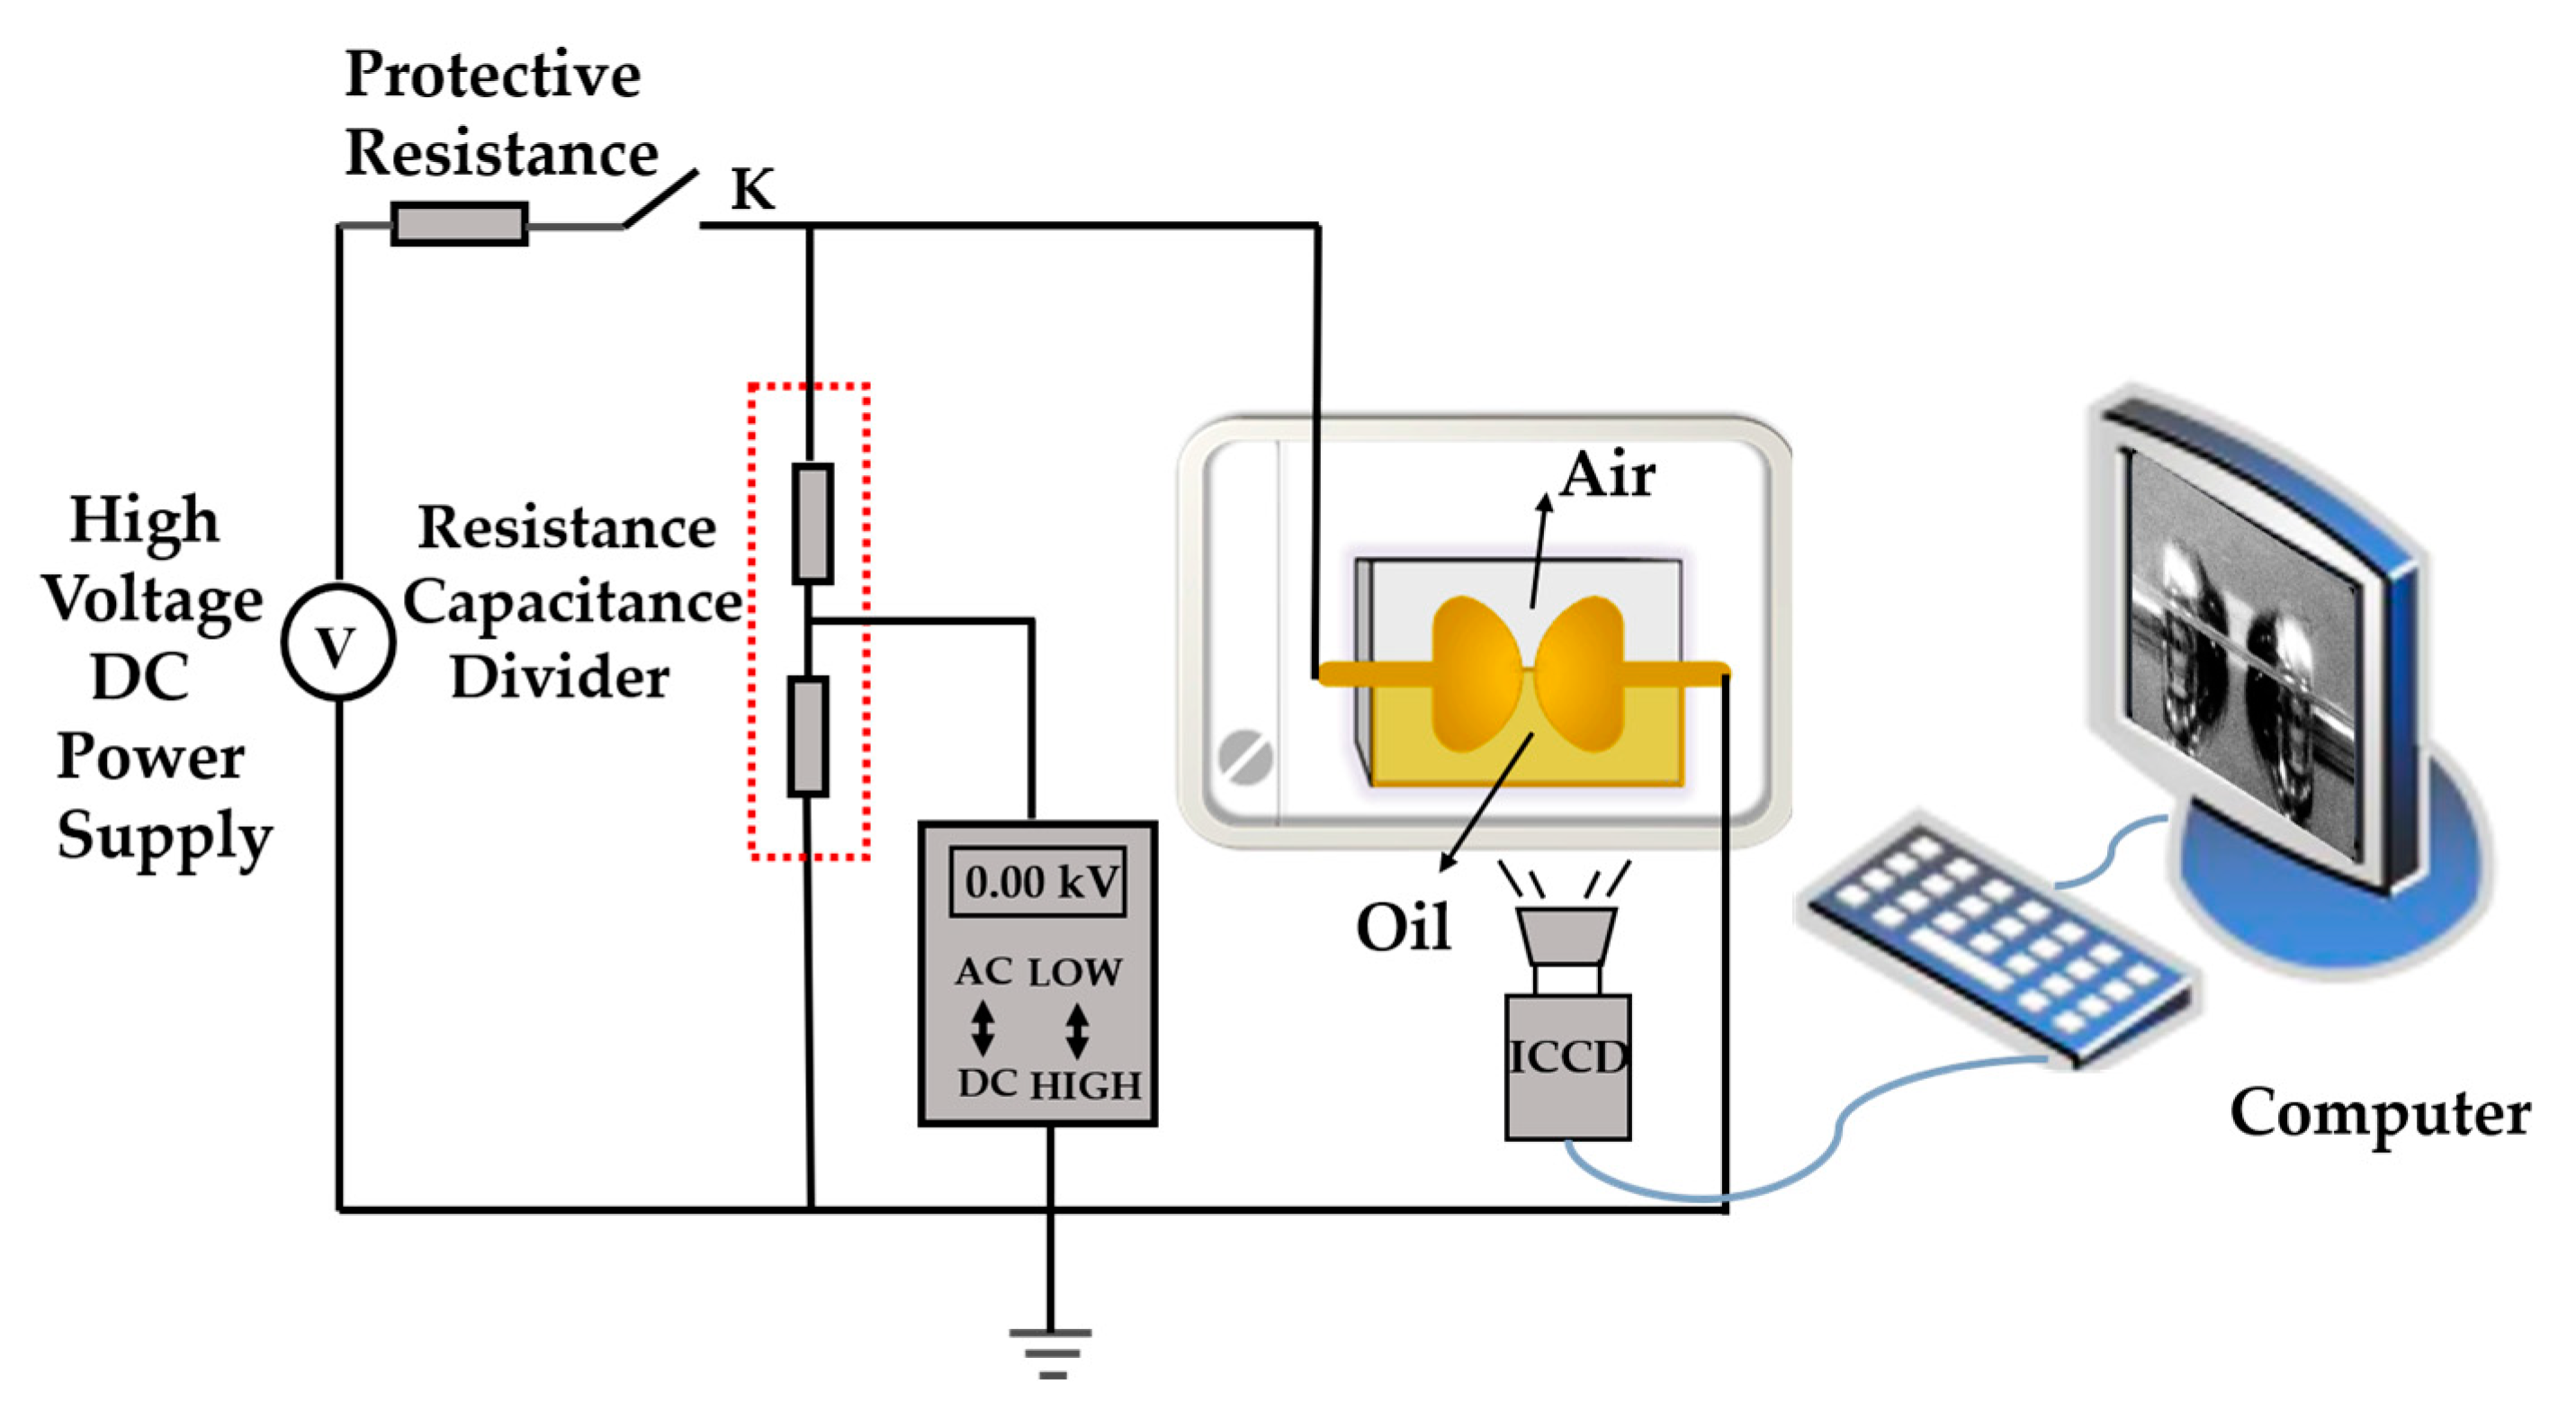
Figure 1. DC discharge test platform.
Energies 16 03558 g001
Figure 2. Test electrode.
Energies 16 03558 g002
Figure 3. The initiation and development of discharge at the oil–gas surface at 2.5 mm gap distance: (a) t = −1 s; (b) t = 0 s; (c) t = 1 s.
Energies 16 03558 g003
Figure 4. Variation in the liquid surface rise at a 2.5 mm gap distance.
Energies 16 03558 g004
Figure 5. DC discharge voltage Weibull distribution at 2.5 mm gap distance.
Energies 16 03558 g005
Figure 6. Weibull distribution of surface discharge voltage under different gap distances.
Energies 16 03558 g006
Figure 7. (a) Discharge voltage at different gap distances and situations. (b) Fitting relationship between discharge voltage and gap distance.
Energies 16 03558 g007
Figure 8. The development process of the streamer at the oil–gas surface at a 2.5 mm gap distance: (a) volume fraction variation of oil; (b) space charge distribution during discharge at the oil–gas surface; (c) electron number density distribution on the air side.
Energies 16 03558 g008aEnergies 16 03558 g008b
Figure 9. Movement process of charged particles at the oil–gas surface.
Energies 16 03558 g009
Figure 10. Variation in streamer length with applied voltage.
Energies 16 03558 g010
Figure 11. Variation in space charge at different gap distances: (a) 1 m; (b) 1.5 mm; (c) 2 mm; (d) 2.5 mm.
Energies 16 03558 g011aEnergies 16 03558 g011b
Figure 12. (a) Effect of gap distance on the velocity during the oil–gas surface discharge. (b) Variation in liquid surface rising speed at 2.5 mm gap distance.
Energies 16 03558 g012
Table 1. Simulation parameters of flow in oil.
NameSymbolNumerical Value
Intermolecular distance/ma3.0 × 10−10
Ionization energy/eV7.5
Number of ionizable molecules/m−3n01 × 10−25
Recombination of positive and negative ions/m3/sRpn1.64 × 10−17
Positive ion and electron recombination/m3/sRpe1.64 × 10−17
Mobility of positive ions/m2/(V·s)μm,cp1 × 10−9
Negative ion mobility/m2/(V·s)μm,cn1 × 10−9
Electronic mobility/m2/(V·s)μm,ce1 × 10−4
Electron adsorption time constant/nsTa200
Table 2. Simulation parameter settings of gas collision ionization.
NameSymbolNumerical Value
Collision ionization coefficient/m−1α025
Mobility of positive ions/m2/(V·s)μm,cp1 × 10−7
Negative ion mobility/m2/(V·s)μm,cn1 × 10−7
Electronic mobility/m2/(V·s)μm,ce1 × 10−2
Disclaimer/Publisher’s Note: The statements, opinions and data contained in all publications are solely those of the individual author(s) and contributor(s) and not of MDPI and/or the editor(s). MDPI and/or the editor(s) disclaim responsibility for any injury to people or property resulting from any ideas, methods, instructions or products referred to in the content.