Article

Decarbonization Measures: A Real Effect or Just a Declaration? An Assessment of Oil and Gas Companies’ Progress towards Carbon Neutrality

by
Alina Cherepovitsyna
*,
Nadezhda Sheveleva
,
Arina Riadinskaia
and
Konstantin Danilin
Luzin Institute for Economic Studies—Subdivision of the Federal Research Centre, Kola Science Centre of the Russian Academy of Sciences, 24a, Fersmana ul., 184209 Apatity, Russia
*
Author to whom correspondence should be addressed.
Energies 2023, 16(8), 3575; https://doi.org/10.3390/en16083575
Submission received: 30 March 2023 / Revised: 17 April 2023 / Accepted: 18 April 2023 / Published: 20 April 2023
(This article belongs to the Collection Energy Transition towards Carbon Neutrality)

Abstract

:
Efforts to control climate change with the aim of achieving carbon neutrality by 2050 have had the most significant impact on businesses operating in the energy sector, which produce large amounts of greenhouse gas (GHG) emissions. In light of such policies, oil and gas companies have set goals aimed at reducing GHG emissions and achieving carbon neutrality, but the issue remains open as to how such activities and progress towards these goals can be evaluated. This study attempts to assess the activities and progress of oil and gas companies towards carbon neutrality, with a focus on quantitative evaluation of goal achievement. First, an algorithm was developed for selecting global oil and gas companies for the analysis that reported their activities in 2022. Using this algorithm, a list of companies was compiled and their goals with regard to carbon neutrality were analyzed. Second, an assessment of how information is presented in corporate reports and which activities aimed at achieving carbon neutrality are reflected there was performed using the proposed checklist. Third, a method for evaluating the progress of oil and gas companies towards intermediate goals in the area of carbon neutrality was developed and tested. The method is based on assessing and comparing trends for oil and gas companies aiming to achieve intermediate goals in reducing carbon intensity. As a result, companies were classified into three categories: (1) those showing carbon neutrality achievement rates exceeding the expected average annual rates, (2) those with fixed carbon neutrality achievement rates below the expected average annual rates, and (3) those demonstrating no movement towards intermediate goals or a negative trend. The main methods used in this study included content analysis, checklist development, decomposition, critical and comparative analysis, and simple statistical methods.

1. Introduction

Global climate change is no longer solely a theoretical and scientific issue for the distant future; it has become an immediate challenge for industries, a focal point for the domestic and foreign policies of states, and a concern for businesses, international financial institutions, and transnational corporations [1,2].
The International Panel on Climate Change has reported that the Earth’s average surface temperature has already risen by 1 °C above pre-industrial levels as of 2017, and it is predicted to continue to rise, reaching 1.5 °C between 2030 and 2052, if nothing changes in the intensity and format of industrial and economic activities because the concentration of CO2 in the atmosphere will continue to increase [3]. In 2021, global CO2 emissions reached 33,884.1 million tons [4].
In 2015, a number of countries signed the Paris Agreement, the primary objective of which is “holding the increase in the global average temperature to well below 2 °C above pre-industrial levels and pursue efforts to limit the temperature increase to 1.5 °C” [5]. At the time of writing, 194 parties (193 states and the European Union) have joined the Paris Agreement [6].
Despite the extensive scientific literature on low-carbon development and decarbonization dating back to at least 1995 [7], some authors have noted a lack of clear terminology in work related to this area of research [8]. This situation may have been caused by both the abundance of works on this topic, the number of which has been steadily growing (particularly since the adoption of the Paris Agreement [8]), and by the absence of fundamental reviews and analyses, especially related to specific industries.
This study defines the achievement of carbon neutrality or zero net emissions as the result of implementing a range of measures to reduce greenhouse gas emissions across various methods and approaches to decarbonization.
The climate regulation of the energy sector has primarily affected those companies with activities generating large amounts of greenhouse gas emissions. With the oil and gas industry accounting for about 42% of global greenhouse gas emissions [9], the strategic development of oil and gas companies is inextricably linked to decarbonization. In view of the above, the future of the energy sector will inevitably involve the development of renewable energy sources and the implementation of green technologies throughout the production process [10,11]. Vaclav Smil has provided a detailed analysis of the process of shifting the focus from fossil fuels to more sustainable alternatives in his work [12,13]. Moreover, many large investors now require specific progress towards carbon neutrality as a condition for investment in companies [14]. Given these circumstances, global oil and gas players are obligated to demonstrate their commitment to the goals set out in the Paris Agreement and to show progress towards carbon neutrality in their operations and disclosure standards.
In light of the above, it is worth noting that the number of scientific publications on low-carbon development and decarbonization in the oil and gas sector is increasing. There are also review articles that document the current state of affairs and the development level in this field, which are then used to raise specific research questions [15,16,17].
Some researchers focus on the policies implemented by oil and gas companies to achieve carbon neutrality across different stages of the production process [18,19,20]. Others limit their focus to a specific industry segment, such as oil refining [21], and explore ways to achieve carbon neutrality in that area. However, it should be noted that such publications are less common compared to those that analyze low-carbon development and decarbonization strategies for the oil and gas industry in individual countries and regions. Studies can be found that analyze the experiences of Italy [22], Canada [23], Russia [24], Tanzania [25], Egypt [26], Great Britain [27], the European Union [28], and others. A number of articles reflect the problems and ways of solving environmental problems in the Arctic [29]. Some of these studies compare the low-carbon development strategies of different countries. For example, the authors of [30] compare national deep decarbonization pathways (DDPs) up to 2050 that are consistent with the goals of the Paris Agreement and development priorities in Argentina, Colombia, Costa Rica, Ecuador, Mexico, and Peru.
In addition, there are publications that focus on low-carbon development and decarbonization at the corporate level or compare the strategies of individual oil and gas companies. These include studies on how and at what stages of the production process vertically integrated oil and gas companies can reduce their carbon intensity [9] and what policies can be applied to achieve the result [31]. There are some studies that compare oil and gas companies with each other in terms of low-carbon development, but they are relatively few in number. As examples, we can cite studies that compare Russian oil and gas companies in terms of sustainability reporting (including GHG emissions reports) [32], compare the low-carbon development goals of a number of oil and gas companies [33], analyze the decarbonization strategies of large oil and gas companies [34], and analyze investments in the low-carbon projects of several large oil and gas companies [35].
Currently, there is a lack of studies focused on the assessment, analysis, and comparison of the progress made by large oil and gas companies towards achieving carbon neutrality. Despite the fact that goals in this field have been set by all major players in the industry, scientific articles do not evaluate their achievement.
Major oil and gas companies are making efforts to comply with disclosure practices in the area of low-carbon development, with many presenting quantitative indicators that signal carbon intensity reduction. This highlights the need for research to establish a mechanism for assessing the activities of oil and gas companies related to achieving carbon neutrality and ranking them according to their progress towards this goal.
To initiate the formation of such a mechanism and company ranking approach, this study aimed to develop a system for evaluating the performance of oil and gas companies in their pursuit of carbon neutrality. This system primarily focuses on quantifying the extent to which these companies have achieved their goals. Furthermore, this system enables the evaluation of individual companies and allows for comparisons to be made between them.
The article is structured as follows. Section 3.1 presents the algorithm developed for selecting the global oil and gas companies to be studied and analyzes their goals in relation to achieving carbon neutrality. Section 3.2 analyzes the reports published on the companies’ official websites and presents a content analysis of a selection of reports based on parameters important for assessing goals, reports, and activities related to achieving carbon neutrality and progress towards it. In Section 3.3, the authors propose their methodology for quantifying companies’ progress in the aforementioned area, which enables the assessment of progress for a single company and facilitates comparison with other companies. Comparing companies with each other is a separate research problem.

2. Materials and Methods

The authors used the oil and gas report published by the Carbon Disclosure Project (CDP) in November 2018 to compile a list of companies to be analyzed [36]. The CDP is a not-for-profit charity that positions itself as the gold standard of environmental reporting, with the richest and most comprehensive dataset on corporate and city action [37]. It ranks 24 of the largest and highest-impact publicly listed oil and gas companies in terms of business readiness for a low-carbon transition. Section 3.1 substantiates the choice of this report. To create the final list of companies for the analysis, the authors applied additional selection criteria to the companies represented in the CDP report, such as having a vertically integrated business model, conducting business activities in 2022, and stating goals of reducing GHG emissions in all three scopes (scopes one, two, and three). Section 3.1 provides a detailed explanation of the algorithm for choosing companies for analysis. The selected companies were studied based on their emission reduction goals, including the types and numbers of intermediate goals and measurement approaches. The results of this analysis are presented in Table 1.
The main methods used in this study to assess information disclosure and business activities in relation to carbon neutrality (Section 3.2) were content analysis and a checklist method. The deduction method was employed to develop an analysis pipeline. The analysis proceeded from general management issues, such as the availability of reports and the formulation of strategies, to more specific issues regarding processes, projects, and blocks of information, such as carbon accounting, an indication of specific low-carbon projects, and decarbonization methods. Section 3.2 outlines and justifies the stages of the analysis used to evaluate information disclosure and business activities in relation to carbon neutrality. Additionally, it presents a checklist that was developed by the authors and serves as a methodological foundation for assessments.
In Section 3.3, the authors propose a methodology for quantifying companies’ activities aimed at carbon neutrality using carbon intensity. The analysis takes into account parameters such as the period required to achieve intermediate goals and the quantitative indicator of carbon intensity reduction in relative terms. Based on these parameters, the expected average annual rate of achievement of intermediate carbon neutrality goals was identified, and a comparison with the actual rate of achievement as of 2021 was conducted. The authors used statistical analysis and comparative analysis to obtain the results.
At almost all stages of the study, similar methods were utilized, including content analysis, decomposition, grouping, analysis and synthesis, and critical and comparative analysis, as well as compiling of analytical tables to systematize the source data and present the results of the analysis. Additionally, the graphical method was employed.
The study used the same materials at almost all stages of the research, which included CDP and GHG protocol data and the official websites and reports of the ten oil and gas companies selected for analysis; namely, Equinor, Total, Eni, Repsol, BP, OMV, Chevron, Petrobras, ExxonMobile, and Occidental. The content analysis focused on major reports, such as annual and sustainability reports, which are published by almost all the companies mentioned, as well as specialized reports, such as energy transition and climate risk resilience reports.
The study was conducted using publicly available data and aimed to address a complex question; namely, how to assess the activities and progress of oil and gas companies in relation to achieving carbon neutrality.

3. Results

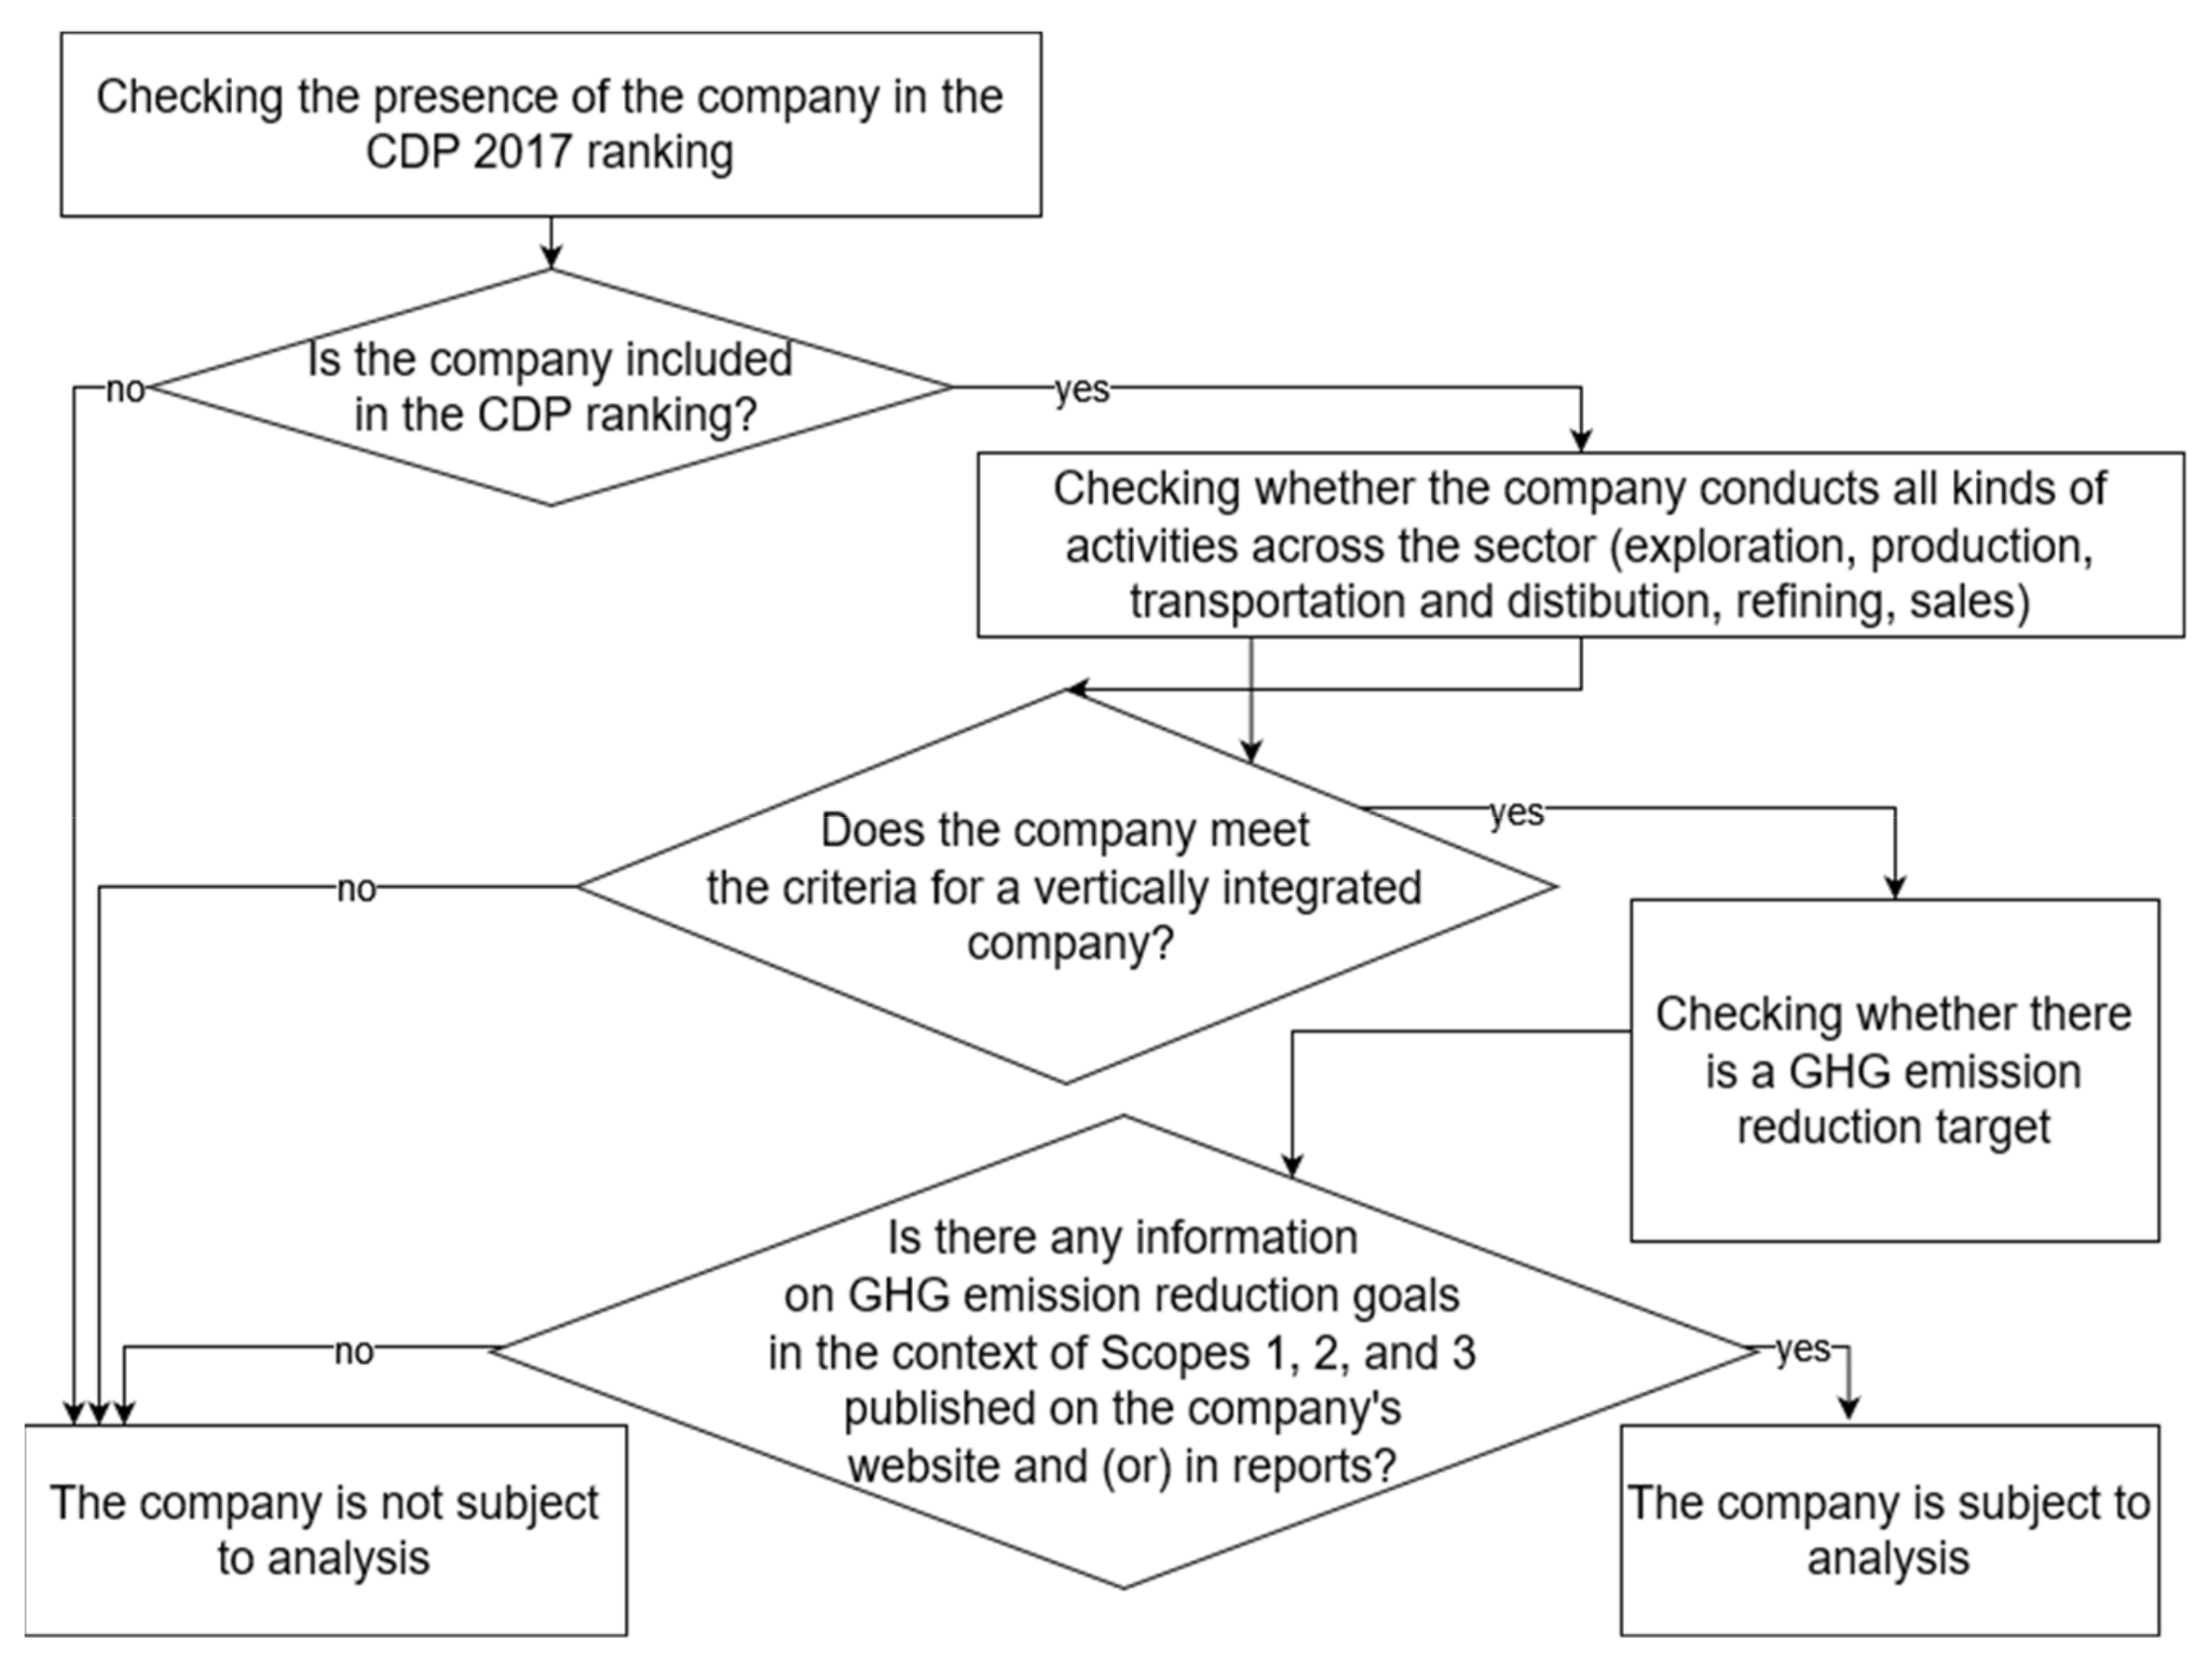
3.1. Compiling a List of Companies and Analyzing Their Goals in Relation to Carbon Neutrality

The initial list of companies selected for this study included the 24 largest and highest-impact oil and gas companies according to the CDP report, which is “designed to serve as a proxy for business readiness in an industry towards the implementation of the Paris Agreement” [36]. The higher a company’s ranking, the more prepared it is for a low-carbon transition. According to the CDP report, these companies were responsible for approximately 31% of global oil and gas production and around 11% of proven reserves as of 2017 [36].
The focus on the 2017 oil and gas company ranking was due to several reasons:
  • Many oil and gas companies set 2015 (Petrobras [38]) or 2016 (Repsol [39], Chevron [40]) as their baseline years when establishing their emission reduction targets. It can be assumed that, by 2017, a pool of companies with emission reduction goals had already formed;
  • The 2017 ranking allowed for the selection of companies that could potentially achieve intermediate results in the field of carbon neutrality for the period 2017–2021 and document this in their reporting;
  • Rankings from more recent years would not provide a comprehensive assessment of the progress of oil and gas companies towards carbon neutrality due to the limited time available for implementing initiatives and reporting.
To ensure completeness and uniformity in the analysis of oil and gas companies’ emissions reductions, additional selection criteria were established. Firstly, the companies had to be active in 2022 for us to obtain the most up-to-date information for the research. Secondly, they had to belong to the group of vertically integrated oil and gas companies that conduct production activities in all sectors—namely, upstream, midstream, and downstream—to ensure equal conditions for the scale and business models of the companies.
After eliminating ConocoPhillips, Hess, Anadarko, INPEX, Noble Energy, Apache, Marathon Oil, and CNOOC due to the two criteria presented above, Equinor, Total, Shell, Eni, Repsol, Woodside, BP, Gazprom, OMV, Chevron, Petrobras, ExxonMobil, Occidental, Petrochina, Sinopec, and Rosneft were included in the final list.
Operating an oil and gas company involves not only direct emissions from operations (scope one) but also indirect greenhouse gas emissions (scope two and scope three) [41,42,43]. It is now widely recognized and a common practice for oil and gas companies to detail their goals for scope one and two emissions. However, companies less frequently set targets for scope three emissions and often only focus on certain emission categories rather than on the entire list.
In view of the above, a third selection criterion was established. This criterion required that companies set emission reduction goals for at least one category of scope three emissions in addition to scopes one and two. This was interpreted as recognition of the companies’ extended responsibility for greenhouse gas emissions. Consequently, four companies—namely, Petrochina, Sinopec, Gazprom, and Rosneft—were eliminated from the list.
The selection algorithm described above is illustrated in Figure 1.
The final list consisted of ten oil and gas companies: Equinor, Total, Eni, Repsol, BP, OMV, Chevron, Petrobras, ExxonMobil, and Occidental. An analysis was conducted to determine their main (up to 2050) and intermediate (up to 2025–2030) carbon neutrality goals. Additionally, an analysis of the number of intermediate goals and their level of detail was undertaken (Table 1).
Table 1. Oil and gas companies under study and their main and intermediate goals in relation to carbon neutrality (as of 2021).
CompanyGoals set in the Field of GHG Emission ReductionInformation Location and the Content of Intermediate Goals
Main GoalsExamples of Intermediate GoalsInformation LocationNumber of Intermediate Goals. TotalIntermediate Goals: DetailsMeasurements
PeriodBusiness ActivityLocationScopeProduction StageAbsolute ValuesRelative Values
Equinor (Norway)Net-zero emissions and 100% net carbon intensity reduction by 2050 (scopes one, two, and three)Reduce emissions (compared to the 2019 baseline):
-
by 20% by 2030
-
by 40% by 2035
Corporate website; “Our climate ambitions” and “Detailed overview of our climate ambitions” sections20VVV VV
Reduce absolute emissions in Norway to near zero (scopes one and two)Reduce emissions (compared to the 2005 baseline):
-
by 40% by 2030
-
by 70% by 2040
Reduce maritime emissions by 50% globally compared to the 2008 baseline (scopes one and three)Reduce maritime emissions (compared to the 2005 baseline):
-
by 50% in Norway by 2030
Total (France)Achieve carbon neutrality (zero net emissions) for TotalEnergies’ operational activities (scopes one and two) by 2050Reduce:
-
GHG emissions (scopes one and two) from its operated facilities from 46 Mt CO2e in 2015 to less than 40 Mt CO2e by 2025
-
net emissions of GHGs (scopes one and two) from its operated activities by at least 40% by 2030 compared to 2015, thus bringing net emissions to between 25 Mt and 30 Mt CO2e
Corporate website; “Climate change-related challenges” section10V VV VV
Achieve carbon neutrality (net-zero emissions) for indirect GHG emissions related to its customers’ use of energy products (scope three) together with society by 2050Reduce scope three GHG emissions (compared to the 2015 baseline):
-
related to its customers’ use of energy products by 400 Mt CO2e by 2030
-
from the petroleum products sold worldwide by more than 30%
Eni (Italy)Carbon neutrality by 2050Reduce absolute net emissions (compared to the 2018 baseline):
-
by 35% for scope one, two, and three by 2030
-
by 80% for scope one, two, and three by 2040
Eni for 2021. Carbon Neutrality by 2050 (corporate reporting)12VV VV
Net-zero emissions from Eni’s operations (scopes one and two) by 2035Reduce emissions (compared to the 2018 baseline):
-
by 40% by 2025
Repsol (Spain)Net-zero emissions by 2050Reduce the carbon intensity indicator (compared to the 2016 baseline):
-
by 15% by 2025
-
by 28% by 2030
-
by 55% by 2040
“Strategy” section; The Management Report 6VV VV
BP (UK)Net-zero operations by 2050 (encompasses scope one and two emissions from the company’s operations)Reduce emissions (compared to the 2019 baseline):
-
by 20% by 2025 (already achieved)
-
by 50% by 2030
Sustainability Report 2021; “Getting to Net Zero” section11VV VVV
Net-zero production by 2050 (encompasses scope three emissions)Reduce emissions (compared to the 2019 baseline):
-
by 20% by 2025
-
by 35–40% by 2030
Net-zero sales by 2050 (reducing the carbon intensity of the energy products the company sells to net zero by 2050 or sooner)Reduce emissions (compared to the 2019 baseline):
-
by 5% by 2025
-
by 15–20% by 2030
OMV (Austria)Net-zero company by no later than 2050Reduce emissions (compared to the 2019 baseline):
-
by 30% in operations (scopes one and two) by 2030
-
by 20% in the product portfolio (scope three) by 2030
Corporate website; “Sustainability” section13VV VVV
Chevron (USA)Net-zero direct emissions by 2050Achieve (compared to the 2016 baseline):
-
more than 35% GHG reduction for upstream carbon intensity (scopes one and two) by 2028
-
upstream carbon intensity (scopes one and two) of 24 kgCO2e/boe by 2028
-
refinement of carbon intensity (scopes one and two): 36 kgCO2e/boe by 2028
Sustainability Report 2021; “Climate Change” section5VV VV
Petrobras (Brazil)Net-zero emissions by 2050Achieve (compared to the 2015 baseline):
-
reduction in total operational (scopes one and two) absolute emissions by 25% by 2030
-
zero routine flare burning by 2030
-
reinjection of ~40MM tons CO2 in CCUS projects until 2025
-
32% reduction in carbon intensity of exploration and production by 2025
Report titled “Petrobras Approves Strategic Plan”6VV VV
ExxonMobil (USA)Achieve net-zero emissions from operated assets by 2050 (applies to scopes one and two) and reach net-zero emissions in Permian Basin unconventional operations by 2030Achieve reductions (compared to the 2016 baseline) of:
-
20–30% in corporation-wide greenhouse gas intensity by 2030
-
40–50% in upstream greenhouse gas intensity by 2030
-
70–80% in corporation-wide methane intensity by 2030
Advancing Climate Solutions 2022 Progress Report; “Net Zero Ambitions” section7VV V
Occidental (USA)
-
Net-zero emissions for scopes one and two before 2040, with the ambition to achieve this goal before 2035
-
Net-zero emissions for scopes one, two, and three, with the ambition to achieve this goal before 2050
-
Reduce total carbon impact through carbon removal and storage technology and development past 2050
Reduce by 2025 (compared to the 2019 baseline):
-
total operational GHG emissions intensity to 0.02 MtCO2/BOe
-
methane emissions intensity to less than 0.25% of marketed gas
Climate Report; “Net Zero Goals” section11VV V VV
Source: compiled by the authors based on corporate websites and reports [38,39,40,44,45,46,47,48,49,50].
Table 1 shows that oil and gas companies set quite ambitious goals to achieve carbon neutrality by 2050 and detailed them for the medium term in absolute or relative values. In their main goals, some companies indicated the achievement of carbon neutrality across all three scopes (for example, BP and Occidental).
The oil and gas companies under study differed in their approaches to formulating their main and intermediate goals in different ways. While some companies have a single overarching goal, such as Chevron, Petrobras, and Repsol, others, such as Total and BP, have set GHG reduction targets for specific scopes. The year 2050 is the target year for most companies to achieve carbon neutrality, but some companies plan to achieve it earlier. For example, Occidental has the following goals: net-zero emissions for scopes one and two before 2040 (with an ambition to achieve this before 2035); and net-zero emissions for scopes one, two, and three, with an ambition to achieve this before 2050.
The formulation of intermediate goals is a way for oil and gas companies to break down their main goals. Businesses follow different approaches in decomposing their main goals and detailing their intermediate goals. Equinor has the highest number of intermediate goals (20), while Chevron has the lowest (5). This being said, it is important to note that the number of intermediate goals cannot serve as a benchmark for evaluating a company’s performance in achieving carbon neutrality.
When analyzing corporate goals, it was found that carbon intensity is used as a key indicator reflecting the level of achievement of carbon neutrality. Carbon intensity relates to a company’s physical carbon performance and describes the extent to which its business activities are based on carbon usage for a defined scope and fiscal year [51]. The quantitative value is the ratio of the amount of greenhouse gas (GHG) emissions of a particular company to one of its key business metrics [52]. In the case of oil and gas companies, the key business metric used is typically the amount of oil or gas produced, which is measured in energy units.
In the next stage of the study, we analyzed information disclosure and performed content analysis for the selected corporate reports. We also developed an approach to assess the quality of information disclosure and the activities undertaken by oil and gas companies to achieve carbon neutrality.

3.2. Information Disclosure and Business Activities Aimed at Achieving Carbon Neutrality: A Content Analysis

For the assessment of the quality of information disclosure and carbon neutrality activities in the oil and gas sector, this study analyzed the contents of corporate reports based on the main principles of information disclosure presented in several standards [53,54,55]. These principles include completeness, accuracy, transparency, and comparability.
To ensure clarity and consistency in the comparison of the information on achieving carbon neutrality presented in the reports, a checklist consisting of 11 criteria was developed. It is presented in Table 2, and a detailed explanation is given below.
To evaluate the level of transparency of oil and gas companies in the domain of carbon neutrality, we examined the types of reports available on their official websites. Information on greenhouse gas emissions and measures to reduce them can be found in various reports (annual reports, sustainability reports, energy transition reports, climate risk resilience reports, climate reports, and others). As a rule, special reports provide more detailed information about the activities of oil and gas companies related to decarbonization compared to annual or sustainability reports. Therefore, the first point on the checklist was whether the company issues such special reports (Table 2). For example, Equinor has released an Energy Transition Plan [55]. According to the company, “this plan demonstrates that Equinor has the right strategy, ambition level, capabilities and track record to be a leading company in the energy transition while ensuring long-term shareholder value creation and competitiveness”. ExxonMobil has published a document titled “Advancing Climate Solutions” [49], outlining ExxonMobil’s commitment to driving emission reductions in support of a net-zero future.
The CDP Climate Change Questionnaire, which is a commonly used tool for analyzing GHG emitters [56,57], was also significant for the assessment of the activities of companies in this study. This was one of the criteria on the checklist. Companies such as Equinor, Total, Eni, Repsol, BP, and Occidental have published their CDP Climate Change Questionnaires on their official websites. Some companies complete the questionnaire but do not post the results on their official websites, such as Chevron [58] and ExxonMobil [59] (although there is information about the Climate Change Report 2017).
If a company’s strategic goals include addressing climate change and striving for decarbonization, they can be considered focus areas for the company [60]. For example, Equinor states that “Equinor’s strategy continues to be guided by the three strategic pillars: Always safe, High value, Low carbon” [61]. Total’s strategy is as follows: “To get to net zero by 2050, together with society, TotalEnergies is transforming into a multi-energy company and deploying specific action plans to reduce its emissions and achieve its short- and medium-term objectives” [45]. This criterion was also included as an item in the checklist.
We assume that, in order to effectively manage any parameter, a quantitative assessment of its current state and relevant information on its variation are necessary [62]. Therefore, it was proposed to include an evaluation of companies’ annual reporting on greenhouse gas emissions in the checklist.
The level of detail with which companies describe their goals related to achieving carbon neutrality, such as the classification of emissions by scope (scopes one, two, and 3), can provide insights into the boundaries on climate responsibility that they set themselves. Emissions classification shows that companies are assuming broader responsibility for greenhouse gas emissions, including not only their own operations but also interactions with third parties, and that they make assessments of the climate consequences from the utilization of their products by end users [47,63,64,65]. Therefore, the checklist included a criterion concerning whether the company analyzes its greenhouse gas emissions by scope.
The analysis of the reports aimed to identify whether they contained any information about specific decarbonization measures [66]. For instance, Equinor has reported measures including several electrification initiatives, reducing all flaring and eliminating routine flaring, curbing methane emissions, investing in renewables and low-carbon solutions, and others [61]. Furthermore, the company’s Energy Transition Plan 2022 includes key indicators for segments such as Oil and Gas, Renewables, and Low Carbon Solutions for 2021, defining specific short-term actions and medium-term ambitions [55]. Similarly, ExxonMobil has indicated its decarbonization areas, which include expanding and accelerating methane mitigation and industry-leading detection technology, eliminating routine flaring, upgrading equipment, and employing emission offsets.
Reports that detail specific measures and directions for decarbonization, along with actual and target indicators for these efforts, can enable timely analysis of progress towards achieving carbon neutrality. This information can help in identifying any discrepancies, evaluating the pace of progress, and analyzing trends in achieving the goals. Therefore, the checklist included questions on the availability of such details in company reports, including specific decarbonization measures or directions and actual or target indicators for their measurement.
An essential factor in evaluating a company’s progress towards carbon neutrality is the information disclosure on ongoing decarbonization projects, including their start and end dates and targets and the greenhouse gas emission reductions resulting from these projects. This information provides a more accurate assessment of a company’s progress in reducing emissions. Equinor provides an overview of its low-carbon-solution projects, including specific project titles, types (such as CO2 infrastructure, power + CCS, blue/green hydrogen, etc.), locations, and decarbonization segments (heat, industry, power, and transport). Total also lists specific decarbonization projects in its report, such as solar power and offshore wind projects, with information on project titles, locations, and capacities, as well as CCS projects in Europe and other individual decarbonization projects in various contexts [67].
A dedicated assessment section in the checklist addressed whether there was any information available on GHG emissions over time from the company’s base year (or earlier) to the current reporting year. The findings of this analysis can help in calculating the pace of progress in achieving carbon neutrality goals.
Comparing the indicators of the reporting year and the previous year is also a crucial factor in evaluating the progress towards achieving carbon neutrality goals. In this study, we considered the availability of data for both 2020 and 2021.
As companies use different indicators and set different carbon neutrality goals, it is necessary to standardize the indicators used in their reports and conduct a detailed analysis of the methods used to obtain such data in order to make valid comparisons.
Carbon neutrality reporting and targets often use absolute numbers, but specific indicators can provide a more accurate reflection of a company’s progress towards carbon neutrality as they are not dependent on the production scale. For example, the closure or sale of a large production unit may reduce the absolute emission rate, but it is the specific indicator that can demonstrate progress in the qualitative reduction in emissions. Carbon intensity (GHG intensity) is commonly used as a basis for assessing companies’ efforts towards reducing greenhouse gas emissions and their progress in achieving carbon neutrality goals, as confirmed by several scientific papers [68,69,70]. Through the use of the proposed checklist and content analysis, it was found that the companies meeting the established selection criteria published information on the specific carbon intensity indicator in some form.
Based on the foregoing, a list of criteria was compiled to evaluate the potential performances of oil and gas companies in achieving carbon neutrality. This list served as the foundation for the analysis, and the outcomes are presented in Table 2.
In the next stage of the study, a quantitative analysis was conducted to evaluate the progress of the companies towards carbon neutrality over time. This involved analyzing the carbon intensity indicator for each individual company and comparing them with each other.
Table 2. A checklist for assessing information disclosure and the activities of oil and gas companies in the carbon neutrality domain.
QuestionEquinorTotalEniRepsolBPChevronOMVPetrobrasExxonMobilOccidental
YESNOYESNOYESNOYESNOYESNOYESNOYESNOYESNOYESNOYESNO
  • Does the company publish any special low-carbon activity reports/materials on its website? (not including the CDP Climate Change Questionnaire)
V VV V V V V V V V
2.
Does the company publish the CDP Climate Change Questionnaire on its website?
V V V V V V V V VV
3.
Does the company’s strategy explicitly mention its plans to reduce emissions or carbon intensity?
V V V V V V V V VV
4.
Does the company keep records of its greenhouse gas emissions?
V V V V V V V V V V
5.
Does the company keep records of its greenhouse gas emissions by scope?
V V V V V V V V V V
6.
Are specific decarbonization measures/directions indicated?
V V V V V V V V V V
7.
Are specific actual and target indicators indicated for individual decarbonization measures/areas?
V V V V V V V V V V
8.
Does the company report on specific decarbonization projects with the name and type of the project, its location, and other parameters?
V V VV V V V V V V
9.
Is a summary of the company’s GHG emission trends provided?
V V V V V V V V V V
10.
Does the company report progress in 2021/2020?
V V V V V V V V VV
11.
Does the company report on its carbon intensity? (in any format)
V V V V V V V V V V
Source: compiled by the authors based on corporate reports [39,40,44,45,47,49,55,64,71,72,73,74].

3.3. Assessing the Progress of Oil and Gas Companies towards Carbon Neutrality: A Quantitative Analysis

To assess the progress of oil and gas companies towards carbon neutrality, we conducted a quantitative analysis based on a comparison of the GHG emission indicators given in corporate annual reports [41,75]. This comparison revealed the companies’ progress in achieving their goals from the base year to the target year (see Table 3). As discussed earlier, specific indicators are more indicative of progress than absolute indicators, as they reflect qualitative changes in a company’s internal processes related to reducing GHG emissions [76].
To quantify the progress towards carbon neutrality, the specific index of carbon intensity (GHG intensity) was used across scopes one and two, as well as, in some cases, scope three, taking into account all divisions of a particular company. It was used because intermediate goals are connected with it. As demonstrated by the previous analysis, all of the ten companies under consideration included this parameter in their reports, but they used different units of measurement (gCO2e/MJ, kgCO2e/BOE, T CO2e/BOE, T CO2e/100 T), which prevents direct comparison of the results without recalculation and in-depth analysis of calculation methods. However, all the dimensions of the indicator reflect essentially the same relationship between greenhouse gas emissions and the volume of oil and gas products produced by companies.
One of the study’s research objectives was to compare companies’ progress in achieving intermediate goals on the road to carbon neutrality. In this study, we used the units of measurement adopted by the companies, and if the company declared its goal as a range of values instead of a specific percentage of the base year value, the lower limit of the declared range was used in the calculations. For instance, ExxonMobil Corporation has set a goal of reducing GHG emissions intensity (scope one + scope two) by 20 to 30% to the value from 2016 by 2030 [49]. In the calculations, the target value of 20% of the base year was used since reaching the minimum value indicated the achievement of the stated goal on the path to carbon neutrality. To solve the scientific problem mentioned above, we developed a methodology for the analysis, which is presented in the following paragraphs.
The algorithm for assessing a company’s progress towards carbon neutrality involves calculating the difference (Equation (1)) between the actual (Equation (2)) and expected (Equation (3)) progress using the indicator of the average annual expected reduction in carbon intensity (Equation (4)). The results of this analysis are presented in Table 3.
P N Z = E R f i E R e x i
where:
  • P N Z is the difference between the actual and expected progress in achieving the intermediate goal of carbon neutrality as of the reporting (analyzed) year i (%);
  • E R f i is the factual progress in achieving the intermediate goal of carbon neutrality (reduction in greenhouse gas emissions) as of the analyzed year i (%);
  • E R e x i is the expected progress in achieving the intermediate goal of carbon neutrality as of the reporting (analyzed) year i (%).
E R f i = 1 C I R Y C I B Y ·   100 ,
where:
  • E R f i is the factual progress in achieving the intermediate goal of carbon neutrality (reduction in greenhouse gas emissions) as of the analyzed year i (%);
  • C I R Y is the carbon intensity in the reporting (analyzed) year i (gCO2e/MJ, kgCO2e/BOE, T CO2e/BOE, or T CO2e/100 T);
  • C I R Y is the carbon intensity in the base year (gCO2e/MJ, kgCO2e/BOE, T CO2e/BOE, or T CO2e/100 T);
  • RY is the reporting (analyzed) year i for the intermediate goal of carbon neutrality;
  • BY is the base year for the intermediate goal of carbon neutrality.
E R e x i = R Y B Y ·   E R A V G ,
where:
  • E R e x i is the expected progress in achieving the intermediate goal of carbon neutrality as of the reporting (analyzed) year i (%);
  • E R A V G is the expected average annual rate of progress towards the intermediate goal of carbon neutrality (%).
E R A V G = 1 C I T Y C I B Y · 100 T Y B Y ,
where:
  • E R A V G is the expected average annual rate of progress towards the intermediate goal of carbon neutrality (Table 3, column eight) (%);
  • C I T Y is the carbon intensity in the target year in relation to the intermediate goal of carbon neutrality (Table 3, column nine) (gCO2e/MJ, kgCO2e/BOE, T CO2e/BOE, or T CO2e/100 T);
  • C I B Y is the carbon intensity in the base year (Table 3, column six) (gCO2e/MJ, kgCO2e/BOE, T CO2e/BOE, or T CO2e/100 T);
  • TY is the target year for achieving the intermediate goal of carbon neutrality (Table 3, column four);
  • BY is the base year for the intermediate goal of carbon neutrality (Table 3, column three).
Table 3. A comparative analysis of carbon intensity indicators and an assessment of trends related to achieving the intermediate goals of oil and gas companies on the way to carbon neutrality.
No.CompanyBase YearThe Year for Achieving the Intermediate Goal Period (Target Year Minus Base Year)Carbon Intensity in the Base YearCarbon Intensity Reduction Goal, %Average Annual Carbon Intensity Reduction Goal, Expectation, %Carbon Intensity in the Target YearCarbon Intensity in the Reporting Year (Fact)Carbon Intensity Reduction in the Reporting Year, Forecast, %Carbon Intensity Reduction in the Reporting Year, Fact, %
123456789101112
1Equinor201920301168.0 gCO2e/MJ201.81854 gCO2e/MJ67.0
gCO₂e/MJ
3.61.5
2Total201520301571.0 gCO2e/MJ201.33356.8 gCO2e/MJ63.9 gCO2e/MJ8.01.9
3Eni201820301268.0 gCO2e/MJ 151.25057.8 gCO2e/MJ67 gCO2e/MJ3.81.5
4Repsol201620301477.7 gCO2e/MJ251.78658.3
gCO2e/MJ
74.0 gCO2e/MJ8.94.8
5BP201920301179.0 gCO2e/MJ151.36467.2 gCO2e/MJ 79.0 gCO2e/MJ2.70.0
6OMV201920301168.5 gCO2e/MJ201.81854.8 gCO2e/MJ66.4 gCO2e/MJ3.63.1
7Chevron201620281274.9 gCO2e/MJ50.43471.0
gCO2e/MJ
71.3 gCO2e/MJ2.14.8
8Petrobras201520301522.0 kgCO2e/BOE312.12115.0 kgCO2e/BOE15.7 kgCO2e/BOE12.428.6
9ExxonMobil201620301426.5 CO2e/100 T201.42821.2 CO2e/100 T24.0 CO2e/100 T7.19.4
10Occidental2019202560.0335
T CO2e/BOE
406.70.020 T CO2e/BOE0.0342 T CO2e/BOE13.4-2.0
Source: compiled by the authors based on corporate reports [38,39,40,44,45,46,47,48,49,50,71,72,77].
The analysis of the oil and gas companies’ progress in achieving carbon neutrality in the reporting year 2021 revealed that only Petrobras, Chevron, and ExxonMobil exceeded the expected annual average in terms of achieving their intermediate carbon neutrality goals.
Eni, Equinor, Total, OMV, and Repsol recorded carbon neutrality rates that were below the expected annual average in 2021.
It is worth highlighting that Occidental and BP did not show any progress towards their intermediate goals or, worse, demonstrated a negative trend.
Taking into account the actual results for the companies for the base year (2021) presented in Table 3, we compared the companies based on their goals for reducing carbon intensity. The results are shown in Figure 2.
The study presents a straightforward and indicative approach that can be used to evaluate and compare the progress of oil and gas companies in achieving their intermediate goals in the carbon neutrality domain. The methodology used in the study provided a quantitative analysis of the goals set by ten companies and their intermediate results. It enables the assessment of a company’s progress over a period and a comparison of progress between different companies.
The study demonstrates how corporate goals can be compared even when the companies differ in their use of indicators, units of measurement, and base and target years (Figure 2). As noted earlier, the methodology makes it possible to track the progress that companies have made in achieving their respective carbon neutrality goals.
The proposed methodology has the potential to substantially enhance the quality of evaluations of corporate progress in achieving carbon neutrality. Additionally, owing to its simplicity, versatility, and comprehensiveness, it can be used to rank oil and gas companies from an environmental point of view.

4. Discussion

The process of achieving carbon neutrality in the oil and gas industry is complex and requires long-term effort. Low-carbon development is addressed by various levels of management, from strategic to operational, and covers a range of activities related to emission management strategies, decarbonization measures, management systems, and assessment and control mechanisms. The strategic nature of setting goals for carbon neutrality requires that companies employ a comprehensive approach to reducing greenhouse gas emissions and achieving their targets. It is important to assess the progress of companies along this path, including their approach to setting goals, their degree of transparency, and the extent to which actual results align with their targets.
The multitude of strategic behavior options, planning approaches, and organizational methods employed by companies in the pursuit of carbon neutrality, as well as variations in the level of information disclosure, pose a significant challenge when analyzing their activities and assessing their progress in this field. As such, it can be difficult to draw definitive conclusions about the actual progress made by companies.
The analysis of the oil and gas companies performed in this study utilized both qualitative and quantitative approaches in order to identify the main content of their reports and disclosure approaches and their actual progress in reducing greenhouse gas emissions. This allowed for a comprehensive evaluation of the degree to which their goals have been achieved.
Although the checklist included a comprehensive set of qualitative criteria that were met by most of the companies analyzed, they were found to be insufficient for assessing actual progress, as the publication of reports and disclosure of information alone do not necessarily reflect the actions taken by a company. However, the criteria presented in the checklist can be considered as minimum information-disclosure requirements in the area of carbon neutrality and can serve as a guideline for oil and gas companies, including those in Russia. The criteria provide a means of confirming information disclosure and specific actions towards achieving carbon neutrality but cannot be used as a benchmark for assessing progress.
Focusing on carbon intensity allowed for a simplified yet effective assessment of the progress made by oil and gas companies in achieving carbon neutrality. This approach was used to assess the progress of the companies analyzed in this study.
It is important to acknowledge that relying solely on a single indicator has limitations and may not provide a comprehensive assessment of a company’s progress towards carbon neutrality. While carbon intensity allows for comparison within the same industry, it is limited by the need for a standardized calculation method and unit of measurement. Therefore, it is recommended to use the proposed methodology to evaluate a company’s progress towards its carbon neutrality goals. This approach allows for a more comprehensive evaluation of a company’s efforts towards its intermediate goals and provides insight into the effectiveness of the management system in place.
Proximity indicators that can signal significant progress include the scope of the stated targets and the speed at which they are achieved, such as a claimed reduction in emissions of more than 20% or a short period between the base and target years. However, it should be noted that the calculated average annual rate of change in carbon intensity implies certain assumptions, as reductions in GHG emissions may fluctuate. Nevertheless, for a general assessment of progress, this parameter is sufficient as presented in the study.
When comparing the declared carbon intensity based on the average annual value with the actual carbon intensity achieved as of the analyzed year (2021), we found no clear relationship between the length of the period between the base and target years and the declared emission reduction value.
Thus, comparing the predicted carbon intensity with the actual level provides the most accurate basis for assessing progress in reducing greenhouse gas emissions, both within a company and when comparing multiple companies.
For instance, in Table 3, it can be observed that BP did not demonstrate any progress in reducing carbon intensity from the base year 2019, despite having an intermediate goal of reducing carbon intensity by 15% by 2030. In contrast, Chevron, Petrobras, and ExxonMobil have made progress towards achieving carbon neutrality earlier than anticipated. The decarbonization strategies, directions, and measures chosen by these companies can be used as a benchmark by companies that have shown more moderate performance and by other oil and gas companies, including those in Russia.
Furthermore, the ranking in Figure 2 provides a clear picture of the extent of the carbon intensity reductions achieved by the leading companies in the oil and gas industry. Taking into account the selection algorithm used in this study, we can say that the list consists of the companies that are most actively involved in the movement towards carbon neutrality. Russian oil and gas companies have also established targets for achieving carbon neutrality, developed strategies to accomplish these targets, and started planning and implementing decarbonization projects. Their targets differ in terms of the indicators measured, the boundaries set (scopes one and two, gas flaring, upstream activities, etc.), and the level of information disclosure. Currently, it is not possible to conduct a similar analysis for most Russian companies due to the lack of relevant information on their official websites. Nevertheless, the results of this study indicate that the mere presence of such information on corporate websites does not necessarily reflect progress in achieving carbon neutrality.

5. Conclusions

The presented analysis and research findings indicate that, while the largest global oil and gas companies declare highly ambitious goals in relation to carbon neutrality, their actual progress does not always match their bold statements. Using the proposed algorithm for selecting oil and gas companies (Figure 2), this study analyzed the largest oil and gas companies that are not only global leaders in their main activities but also declare best practices in reducing carbon intensity. Content analysis of the companies under study (Table 2) showed that they all demonstrated best practices in information disclosure and activities related to carbon neutrality.
However, the results of the quantitative analysis of the progress towards the companies’ goals for 2021, which was conducted using a specially developed methodology (Table 3), showed that only three out of ten companies demonstrate progress in achieving their carbon neutrality goals that exceeds the set targets. Five out of ten are moving towards their goals more slowly than planned, and two out of ten show no progress or even demonstrate negative results. In addition, the quantitative comparison of the goals of the companies studied (Figure 2) showed a significant difference in both the goals and the timelines for achieving them. These findings lead to the conclusion that, even taking into account all the limitations of the methodology used, as indicated in the previous sections, new scientific approaches are needed to assess the achievement of carbon neutrality by oil and gas companies.
The next step of this study is to enhance the approach for evaluating the progress of oil and gas companies in achieving carbon neutrality. As per the plan, this will be carried out by developing an innovative methodology to rank these companies based on their advancements in reducing carbon intensity. Another focus area will be analyzing the efforts of Russian companies in relation to carbon neutrality and customizing the methods for evaluating their endeavors.

Author Contributions

Conceptualization, A.C., N.S. and A.R.; methodology, A.C.; investigation, A.C., N.S. and A.R.; data curation, A.C., N.S., A.R. and K.D.; writing—original draft preparation, K.D.; writing—review, A.C., N.S., A.R. and K.D.; writing—editing, A.C. and K.D.; visualization, N.S. and A.R.; supervision, A.C.; project administration, A.C. and K.D.; funding acquisition, A.C. All authors have read and agreed to the published version of the manuscript.

Funding

This research was funded by the Russian Science Foundation, grant number 22-78-10181 “Decarbonization of the Russian oil and gas complex: conceptual framework, new interfaces, challenges, technological and managerial transformations”, https://rscf.ru/project/22-78-10181/.

Data Availability Statement

Data are available upon specific request to the authors.

Conflicts of Interest

The authors declare no conflict of interest.

References

  1. Safonov, G. Decarbonization of the World Economy and Russia. 2020. Available online: https://publications.hse.ru/pubs/share/direct/422557993.pdf (accessed on 25 January 2023).
  2. Romasheva, N.; Dmitrieva, D. Energy Resources Exploitation in the Russian Arctic: Challenges and Prospects for the Sustainable Development of the Ecosystem. Energies 2021, 14, 8300. [Google Scholar] [CrossRef]
  3. IPCC. Global Warming of 1.5 °C: An IPCC Special Report on the Impacts of Global Warming of 1.5 °C above Pre-Industrial Levels and Related Global Greenhouse Gas Emission Pathways, in the Context of Strengthening the Global Response to the Threat of Climate Change, Sustainable Development, and Efforts to Eradicate Poverty; IPCC: Geneva, Switzerland, 2018; Available online: https://www.ipcc.ch/site/assets/uploads/sites/2/2019/06/SR15_Full_Report_Low_Res.pdf (accessed on 25 January 2023).
  4. BP p.l.c. bp Statistical Review of World Energy 2022, 71st ed.; BP p.l.c.: London, UK, 2022; Available online: https://www.bp.com/content/dam/bp/business-sites/en/global/corporate/pdfs/energy-economics/statistical-review/bp-stats-review-2022-full-report.pdf (accessed on 5 December 2022).
  5. United Nations. The Paris Agreement. Available online: https://unfccc.int/files/essential_background/convention/application/pdf/english_paris_agreement.pdf (accessed on 25 September 2022).
  6. United Nations. The Paris Agreement. How Does it Work? Available online: https://www.un.org/en/climatechange/paris-agreement (accessed on 5 December 2022).
  7. Ausubel, J.H. Technical progress and climatic change. Energy Policy 1995, 23, 411–416. [Google Scholar] [CrossRef]
  8. Wimbadi, R.W.; Djalante, R. From decarbonization to low carbon development and transition: A systematic literature review of the conceptualization of moving toward net-zero carbon dioxide emission (1995–2019). J. Clean. Prod. 2020, 256, 120307. [Google Scholar] [CrossRef]
  9. Beck, C.; Rashidbeigi, S.; Roelofsen, O.; Speelman, E. The Future Is Now: How Oil and Gas Companies Can Decarbonize. McKinsey & Company. 7 January 2020. Available online: https://www.mckinsey.com/industries/oil-and-gas/our-insights/the-future-is-now-how-oil-and-gas-companies-can-decarbonize (accessed on 25 September 2022).
  10. Nechitailo, A.; Marinina, O. Analysis of technological directions of electrification of hydrocarbon production facilities in poorly developed territories. North Mark. Form. Econ. Order 2022, 25, 45–57. [Google Scholar] [CrossRef]
  11. Maksimova, E.V.; Morozov, V.V. Modern challenges for the oil and gas sector and adaptation to them. Probl. Econ. Manag. Oil Gas Complex 2021, 6, 5–9. [Google Scholar] [CrossRef]
  12. Smil, V. Research of energy transitions: A dozen of insights based on performance. Energy Res. Soc. Sci. 2016, 22, 194–196. [Google Scholar] [CrossRef]
  13. Smil, V. Energy Transitions: History, Requirements, Prospects; ABC-CLIO: Santa Barbara, CA, USA, 2010. [Google Scholar]
  14. Ceres. Ceres Investor Network on Climate Risk and Sustainability. Available online: https://www.ceres.org/networks/ceres-investor-network (accessed on 25 September 2022).
  15. Hastings, A.; Smith, P. Achieving Net Zero Emissions Requires the Knowledge and Skills of the Oil and Gas Industry. Front. Clim. 2020, 2, 601778. [Google Scholar] [CrossRef]
  16. Wang, Z.; Li, S.; Jin, Z.; Li, Z.; Liu, Q.; Zhang, K. Oil and gas pathway to net-zero: Review and outlook. Energy Strategy Rev. 2023, 45, 101048. [Google Scholar] [CrossRef]
  17. Papadis, E.; Tsatsaronis, G. Challenges in the decarbonization of the energy sector. Energy 2020, 205, 118025. [Google Scholar] [CrossRef]
  18. Khorasani, M.; Sarker, S.; Kabir, G.; Ali, S.M. Evaluating strategies to decarbonize oil and gas supply chain: Implications for energy policies in emerging economies. Energy 2022, 258, 124805. [Google Scholar] [CrossRef]
  19. Farrell, B. Net zero hero—five strategies for oil and gas producers. APPEA J. 2022, 62, 17–20. [Google Scholar] [CrossRef]
  20. Graham, C. The future is not what it used to be: Oil and gas strategies for a carbon-conscious world. APPEA J. 2017, 57, 459–461. [Google Scholar] [CrossRef]
  21. Griffiths, S.; Sovacool, B.K.; Kim, J.; Bazilian, M.; Uratani, J.M. Decarbonizing the oil refining industry: A systematic review of sociotechnical systems, technological innovations, and policy options. Energy Res. Soc. Sci. 2022, 89, 102542. [Google Scholar] [CrossRef]
  22. Alimonti, C.; Soldo, E.; Scrocca, D. Looking forward to a decarbonized era: Geothermal potential assessment for oil & gas fields in Italy. Geothermics 2021, 93, 102070. [Google Scholar] [CrossRef]
  23. Bergero, C.; Binsted, M.; Younis, O.; Davies, E.G.; Siddiqui, M.S.; Xing, R.; Arbuckle, E.J.; Chiappori, D.V.; Fuhrman, J.; McJeon, H.; et al. Technology, technology, technology: An integrated assessment of deep decarbonization pathways for the Canadian oil sands. Energy Strategy Rev. 2022, 41, 100804. [Google Scholar] [CrossRef]
  24. Nurgaliev, D.K.; Selivanovskaya, S.Y.; Kozhevnikova, M.V.; Galitskaya, P.Y. Some challenges and opportunities for Russia and regions in terms of the global decarbonization trend. Georesursy 2021, 23, 8–16. [Google Scholar] [CrossRef]
  25. Rweyendela, A.G.; Pauline, N.M.; Lema, G.A. Strategic environmental assessment for low-carbon development: A case study of oil and gas planning in Tanzania. Environ. Dev. 2023, 45, 100829. [Google Scholar] [CrossRef]
  26. Farnoosh, A.; Lantz, F. Decarbonisation of Electricity Generation in an Oil & Gas Producing Country: “A Sensitivity Analysis over the Power Sector in Egypt”; IFP Energies Nouvelles: Rueil-Malmaison, France, 2015; pp. 228–232. [Google Scholar]
  27. Nerini, F.F.; Keppo, I.; Strachan, N. Myopic decision making in energy system decarbonisation pathways. A UK case study. Energy Strategy Rev. 2017, 17, 19–26. [Google Scholar] [CrossRef]
  28. Vieira, L.C.; Longo, M.; Mura, M. From carbon dependence to renewables: The European oil majors’ strategies to face climate change. Bus. Strategy Environ. 2022, 1–12. [Google Scholar] [CrossRef]
  29. Romasheva, N.V.; Babenko, M.A.; Nikolaichuk, L.A. Sustainable development of the Russian Arctic region: Environmental problems and ways to solve them. MIAB Mining Inf. Anal. Bull. 2022, 10, 78–87. [Google Scholar] [CrossRef]
  30. Bataille, C.; Waisman, H.; Briand, Y.; Svensson, J.; Vogt-Schilb, A.; Jaramillo, M.; Imperio, M. Net-zero deep decarbonization pathways in Latin America: Challenges and opportunities. Energy Strategy Rev. 2020, 30, 100510. [Google Scholar] [CrossRef]
  31. Blondeel, M.; Bradshaw, M. International oil companies, decarbonisation and transition risks. In Handbook on Oil and International Relations; Dannreuther, R., Ostrowski, W., Eds.; Edward Elgar: Cheltenham, UK, 2022; pp. 372–392. [Google Scholar] [CrossRef]
  32. Orazalin, N.; Mahmood, M. Economic, environmental, and social performance indicators of sustainability reporting: Evidence from the Russian oil and gas industry. Energy Policy 2018, 121, 70–79. [Google Scholar] [CrossRef]
  33. Dietz, S.; Gardiner, D.; Jahn, V.; Noels, J. How ambitious are oil and gas companies’ climate goals? Science 2021, 374, 405–408. [Google Scholar] [CrossRef] [PubMed]
  34. Masalkova, A.; Romanova, E. Peculiarities of Decarbonization Strategies of the Largest Players in the Oil and Gas Industry: Similarities and Differences; Atlantiss Press: Amsterdam, The Netherlands, 2021. [Google Scholar] [CrossRef]
  35. Li, M.; Trencher, G.; Asuka, J. The clean energy claims of BP, Chevron, ExxonMobil and Shell: A mismatch between discourse, actions and investments. PLoS ONE 2022, 17, e0263596. [Google Scholar] [CrossRef] [PubMed]
  36. Fletcher, L.; Crocker, T.; Smyth, J.; Marcell, K. Beyond the Cycle: Which Oil and Gas Companies Are Ready for the Low-Carbon Transition? CDP Report. 2018. Available online: https://cdn.cdp.net/cdp-production/cms/reports/documents/000/003/858/original/CDP_Oil_and_Gas_Executive_Summary_2018.pdf?1541783367 (accessed on 25 September 2022).
  37. CDP. Available online: https://www.cdp.net/en/info/about-us (accessed on 25 February 2023).
  38. Petrobras Approves Strategic Plan 2022–2026. Available online: https://docs.publicnow.com/viewDoc?hash_primary=E606D184C77F67468BCCF563FEC6C83633FC2096 (accessed on 25 February 2023).
  39. REPSOL Group. Integrated Management Report 2021. Available online: https://www.repsol.com/content/dam/repsol-corporate/en_gb/accionistas-e-inversores/informes-anuales/2021/integrated-management-report-2021.pdf (accessed on 25 February 2023).
  40. Chevron. Sustainability Report 2021. Available online: https://www.chevron.com/-/media/shared-media/documents/chevron-sustainability-report-2021.pdf (accessed on 25 February 2023).
  41. The Greenhouse Gas Protocol. Available online: https://ghgprotocol.org/sites/default/files/standards/ghg-protocol-revised.pdf (accessed on 25 February 2023).
  42. Hertwich, E.G.; Wood, R. The growing importance of scope 3 greenhouse gas emissions from industry. Environ. Res. Lett. 2018, 13, 104013. [Google Scholar] [CrossRef]
  43. Kenner, D.; Heede, R. White knights, or horsemen of the apocalypse? Prospects for Big Oil to align emissions with a 1.5 °C pathway. Energy Res. Soc. Sci. 2021, 79, 102049. [Google Scholar] [CrossRef]
  44. Equinor. Overview of Climate Ambitions 2022. Available online: https://cdn.sanity.io/files/h61q9gi9/global/283da357bec808022a914e65c45b1daf61f9c421.pdf?climate-ambition-overview-cmu-2022-equinor.pdf (accessed on 25 February 2023).
  45. TotalEnergies. Climate Change-Related Challenges. Available online: https://totalenergies.com/sustainability/climate-and-sustainability-energy/climate-change-related-challenges#2050 (accessed on 25 February 2023).
  46. Eni for 2021. Carbon Neutrality by 2050. Available online: https://www.eni.com/assets/documents/eng/just-transition/2021/eni-for-2021-carbon-neutrality-2050-eng.pdf (accessed on 25 February 2023).
  47. BP Sustainability Report 2021. Available online: https://www.bp.com/content/dam/bp/business-sites/en/global/corporate/pdfs/sustainability/group-reports/bp-sustainability-report-2021.pdf (accessed on 25 February 2023).
  48. OMV Group. Targets & Commitments. Available online: https://www.omv.com/en/sustainability/our-approach/targets-commitments (accessed on 25 February 2023).
  49. ExxonMobil. Advancing Climate Solutions. Progress Report 2023. Available online: https://corporate.exxonmobil.com/-/media/global/files/advancing-climate-solutions-progress-report/2023/2023-acs-progress-report.pdf (accessed on 25 February 2023).
  50. Occidental Climate Report 2021. Pathway To Net Zero. Available online: https://www.oxy.com/globalassets/documents/publications/oxy-climate-report-2021.pdf (accessed on 25 February 2023).
  51. Hoffmann, V.H.; Busch, T. Corporate carbon performance indicators: Carbon intensity, dependency, exposure, and risk. J. Ind. Ecol. 2008, 12, 505–520. [Google Scholar] [CrossRef]
  52. ISO 14067:2018; Greenhouse Gases—Carbon Footprint of Products—Requirements and Guidelines for Quantification. ISO: Geneva, Switzerland, 2018. Available online: https://www.iso.org/standard/71206.html (accessed on 25 February 2023).
  53. GRI 305: Emissions; GRI Standards: Amsterdam, The Netherlands, 2016; Available online: https://www.globalreporting.org/standards/media/1012/gri-305-emissions-2016.pdf (accessed on 25 February 2023).
  54. ISO 14064-1:2018; Greenhouse gases—Part 1: Specification with Guidance at the Organization Level for Quantification and Reporting of Greenhouse Gas Emissions and Removals. ISO: Geneva, Switzerland, 2018. Available online: https://www.iso.org/ru/standard/66453.html (accessed on 25 February 2023).
  55. Equinor Energy Transition Plan 2022. Available online: https://www.equinor.com/magazine/our-plan-the-energy-transition (accessed on 25 February 2023).
  56. Kouloukoui, D.; de Oliveira Marinho, M.M.; da Silva Gomes, S.M.; Kiperstok, A.; Torres, E.A. Corporate climate risk management and the implementation of climate projects by the world’s largest emitters. J. Clean. Prod. 2019, 238, 117935. [Google Scholar] [CrossRef]
  57. Bolay, A.F.; Bjørn, A.; Weber, O.; Margni, M. Prospective sectoral GHG benchmarks based on corporate climate mitigation targets. J. Clean. Prod. 2022, 376, 134220. [Google Scholar] [CrossRef]
  58. CDP Chevron Corporation. Available online: https://www.cdp.net/en/responses/3191?back_to=https%3A%2F%2Fwww.cdp.net%2Fen%2Fresponses%3Futf8%3D%25E2%259C%2593%26queries%255Bname%255D%3Dchevron&queries%5Bname%5D=chevron (accessed on 25 February 2023).
  59. CDP ExxonMobil. Available online: https://www.cdp.net/en/responses?per_page=20&queries%5Bname%5D=exxon+mobil&sort_by=project_year&sort_dir=desc (accessed on 25 February 2023).
  60. Cherepovitsyn, A.; Rutenko, E. Strategic Planning of Oil and Gas Companies: The Decarbonization Transition. Energies 2022, 15, 6163. [Google Scholar] [CrossRef]
  61. Equinor Annual Report 2021. Available online: https://www.equinor.com/investors/annual-reports (accessed on 25 February 2023).
  62. Nagar, P.K.; Sharma, M.; Gupta, S.; Singh, D. A framework for developing and projecting GHG emission inventory and preparing mitigation plan: A case study of Delhi City, India. Urban Clim. 2019, 28, 100462. [Google Scholar] [CrossRef]
  63. Technical Guidance for Calculating Scope 3 Emissions, Version 1.0; Greenhouse Gas Protocol: Washington, DC, USA. Available online: https://ghgprotocol.org/sites/default/files/standards/Scope3_Calculation_Guidance_0.pdf (accessed on 25 February 2023).
  64. Chevron Climate Change Resilience 2021. Available online: https://www.chevron.com/-/media/chevron/sustainability/documents/climate-change-resilience-report.pdf (accessed on 25 February 2023).
  65. ExxonMobil Scope 3 Emissions. Available online: https://corporate.exxonmobil.com/-/media/global/files/advancing-climate-solutions-progress-report/2022-july-update/scope-3-emissions.pdf (accessed on 25 February 2023).
  66. Lewandowski, S.; Ullrich, A. Measures to reduce corporate GHG emissions: A review-based taxonomy and survey-based cluster analysis of their application and perceived effectiveness. J. Environ. Manag. 2023, 325, 116437. [Google Scholar] [CrossRef] [PubMed]
  67. TotalEnergies Sustainability and Climare Report 2021. Available online: https://totalenergies.com/sites/g/files/nytnzq121/files/documents/2022-05/Sustainability_Climate_2022_Progress_Report_accessible_version_EN.pdf (accessed on 25 February 2023).
  68. Luan, B.; Huang, J.; Zou, H. Domestic R&D, technology acquisition, technology assimilation and China’s industrial carbon intensity: Evidence from a dynamic panel threshold model. Sci. Total Environ. 2019, 693, 133436. [Google Scholar] [CrossRef]
  69. Grand, M.C. Carbon emission targets and decoupling indicators. Ecol. Indic. 2016, 67, 649–656. [Google Scholar] [CrossRef]
  70. Waheed, R. The significance of energy factors, green economic indicators, blue economic aspects towards carbon intensity: A study of Saudi vision 2030. Sustainability 2022, 14, 6893. [Google Scholar] [CrossRef]
  71. Eni Sustainability Performance 2021. Available online: https://www.eni.com/assets/documents/eng/just-transition/2021/eni-for-2021-sustainability-performance-eng.pdf (accessed on 25 February 2023).
  72. OMV Sustainability Report 2021. Available online: https://reports.omv.com/en/sustainability-report/2021/ (accessed on 25 February 2023).
  73. Petrobras Sustainability Report 2021. Available online: https://sustentabilidade.petrobras.com.br/documents/42532/0/2021%20SUSTAINABILITY%20REPORT/343f2b9c-8bbb-ef73-0cb9-b797fad3f896 (accessed on 25 February 2023).
  74. Occidental Sustainability Report 2021. Available online: https://www.oxy.com/globalassets/documents/publications/2021-sustainability-report-web.pdf (accessed on 25 February 2023).
  75. Greenhouse Gas Protocol. Available online: https://ghgprotocol.org/about-us (accessed on 25 February 2023).
  76. TCFD. Implementing the Recommendations of the Task Force on Climate-related Financial Disclosures. 2017. Available online: https://assets.bbhub.io/company/sites/60/2020/10/FINAL-TCFD-Annex-Amended-121517.pdf (accessed on 25 February 2023).
  77. OXY 2019—2021 Annual ESG Performance Indicators. Available online: https://www.oxy.com/globalassets/documents/sustainability/oxy-esg-performance-indicators.pdf (accessed on 25 February 2023).
Figure 1. An algorithm for selecting oil and gas companies for the analysis. Source: compiled by the authors.
Energies 16 03575 g001
Figure 2. Companies ranked according to the average annual rate of carbon intensity reduction (% per year) (according to their declared intermediate goals). Source: compiled by the authors based on corporate reports [38,39,40,44,45,46,47,48,49,50,71,72,77].
Energies 16 03575 g002
Disclaimer/Publisher’s Note: The statements, opinions and data contained in all publications are solely those of the individual author(s) and contributor(s) and not of MDPI and/or the editor(s). MDPI and/or the editor(s) disclaim responsibility for any injury to people or property resulting from any ideas, methods, instructions or products referred to in the content.

