Abstract
Guangxi is a typical developing region on the southern coast of China. The current issues encountered in the region’s development are that fossil energy accounts for about 80% of the energy structure, fossil fuels are heavily dependent on imports, and the self-sufficiency rate of resources is only 32%. These challenges have created a disparity between the current regional development state and the country’s dual carbon target. Under the premise of comprehensively considering the multi-sectors of electricity, industry, transportation, and heating, this paper presents a study on the energy system transition towards low-carbon development for Guangxi in four steps. Firstly, to demonstrate EnergyPLAN’s capability in energy modeling, a reference scenario for Guangxi is created using official yearbook data from 2020. Then, a short-term scenario is formulated to analyze the development of Guangxi’s energy system during the 14th Five-Year Plan. Furthermore, two mid-term scenarios are established, revealing that Guangxi is anticipated to reach its carbon emission peak between 2025 and 2030. Finally, three long-term scenarios are proposed for Guangxi’s energy system for 2050. These scenarios encompass the expansion of photovoltaics, nuclear, and wind power in the electricity system and emission reduction policies in the industrial, transportation, and heating sectors. As a result, compared with the 2020REF scenario, Guangxi can achieve a carbon emission reduction exceeding 57% and the share of non-fossil energy consumption can reach about 70% in the 2050 scenarios, despite a substantial increase in energy consumption, which makes it possible to achieve carbon neutrality in 2060 and to establish an energy system with less than 20% of fossil energy consumption.
1. Introduction
In the modern world, because of climate change caused by human activities, more frequent extreme weather brings a series of problems, making the public increasingly concerned about the impact of global warming. As a result, it has become a common objective for governments to promote the transition of energy systems toward low-carbon sustainability continuously. According to the requirements mentioned in the latest United Nations Climate Change Conference, member states are explicitly asked, for the first time, to control greenhouse gas emissions by gradually phasing down coal use and limiting temperature growth to 1.5 ℃ before the industrial revolution [1]. China, as the world’s largest energy consumer and emitter of carbon dioxide, has historically put forward its long-term emission reduction targets. It aims to reach a peak in carbon dioxide emissions by 2030 and achieve carbon neutrality by 2060 [2,3,4]. As energy transition involves integration and coordination at national, regional, and provincial levels [2,5,6], Guangxi has proposed an ambitious energy transition plan, striving to reach more than 30% of non-fossil energy consumption by 2025; more than 35% of non-fossil energy consumption by 2030; preliminary building a low-carbon, safe, and efficient modern energy system by 2035; and 80% of non-fossil energy consumption by 2060, successfully achieving the goal of carbon neutrality [7,8].
The energy transition entails upgrading the existing energy consumption structure, requiring a tool to evaluate the environmental and economic influence of future energy demand and supply to assist policymakers in planning reliable energy transition policies, which can be solved by energy system modeling. Top-down and bottom-up models are the two main categories used in energy system modeling [9]. The former primarily focuses on the connection between the macro-economy and the energy system. For example, Zhang et al. [10] used the multi-sectoral recursive dynamic CGE model to develop a hybrid emission reduction policy that combined the carbon tax and carbon emission trading system (ETS), and discovered that the hybrid emission reduction policy can help China reach the carbon peak before 2030 at a lower economic cost than a pure carbon ETS. Input−output analysis was used to examine the structural emission reduction of China’s power and heating sectors from 2007 to 2015 [11]. The latter mainly focuses on technical analysis, analyzing connections between different energy sectors, and one of the widely used tools is EnergyPLAN. After decades of continuous development and improvement, EnergyPLAN is generally used to design and simulate energy systems with a high proportion of renewable energy [12]. It provides a technical and economic analysis of different options and enables policymakers to use a wide range of options to make long-term decisions [13].
Over 300 peer-reviewed papers have used EnergyPLAN [13], mainly for designing energy systems and energy transition solutions at national levels in Germany [14], Denmark [15], Ireland [16], Macedonia [17], Cyprus [18], Qatar [19], Nigeria [20], Mauritius [21], India [22], the European Union [23], Hungary [24], Jordan [25], and Poland [26]. It is also applied in islands such as Galapagos [27], Azores [28], Gran Canaria [29], Crete [30], Madeira [31], and Hinnøya [32], as well as cities such as Beijing−Tianjin−Hebei [33,34], Cuenca [35], NiederÖsterreich [36], and Aalborg [37]. In addition, EnergyPLAN is often used to evaluate the impact of an energy source or a technology on the entire energy system, including battery storage [38], cross-border interconnection [39], biogas and biogas-derived fuels [40], heat pumps [41], power-to-gas and power-to-heat [42], hydropower and pumped hydro energy storage [43], district heating [44], electric vehicles [45], seawater desalination [25], combined heat and power [46,47], etc. It is also applied to analyze the transition of specific sectors, such as transportation and electricity [48,49,50,51].
Few studies have examined the energy system transition in Guangxi. This paper aims to establish a transition plan to increase the non-fossil energy share in Guangxi’s energy system by 2050, while ensuring stable power system operation and considering technical, environmental, and economic criteria. The study also analyzes the potential to achieve over 70% non-fossil energy consumption.
The structure of this paper is as follows: the second part introduces and explains the principles of EnergyPLAN and the process of designing energy systems from 2020 to 2050, the third part compares and analyzes the results of energy system modeling, and the fourth part draws conclusions and makes recommendations for future research.
2. Methodology
This chapter will provide a detailed explanation of the operating principles of the EnergyPLAN software (Version 16.0), the basic situation in Guangxi, the sources of data used, and the modeling process employed for energy system modeling.
2.1. EnergyPLAN
EnergyPLAN is a cutting-edge simulation software developed by Aalborg University in Denmark to design future sustainable energy systems, especially those with a high share of renewable energy [52]. Because analytical programming is used instead of iteration, software operations can be completed quickly [53]. It is a deterministic input/output tool that simulates the hourly energy balance of a national or regional energy system over a one year, accounting for the complex interactions of various energy sectors such as electricity, heating, cooling, industry, and transportation [54,55].
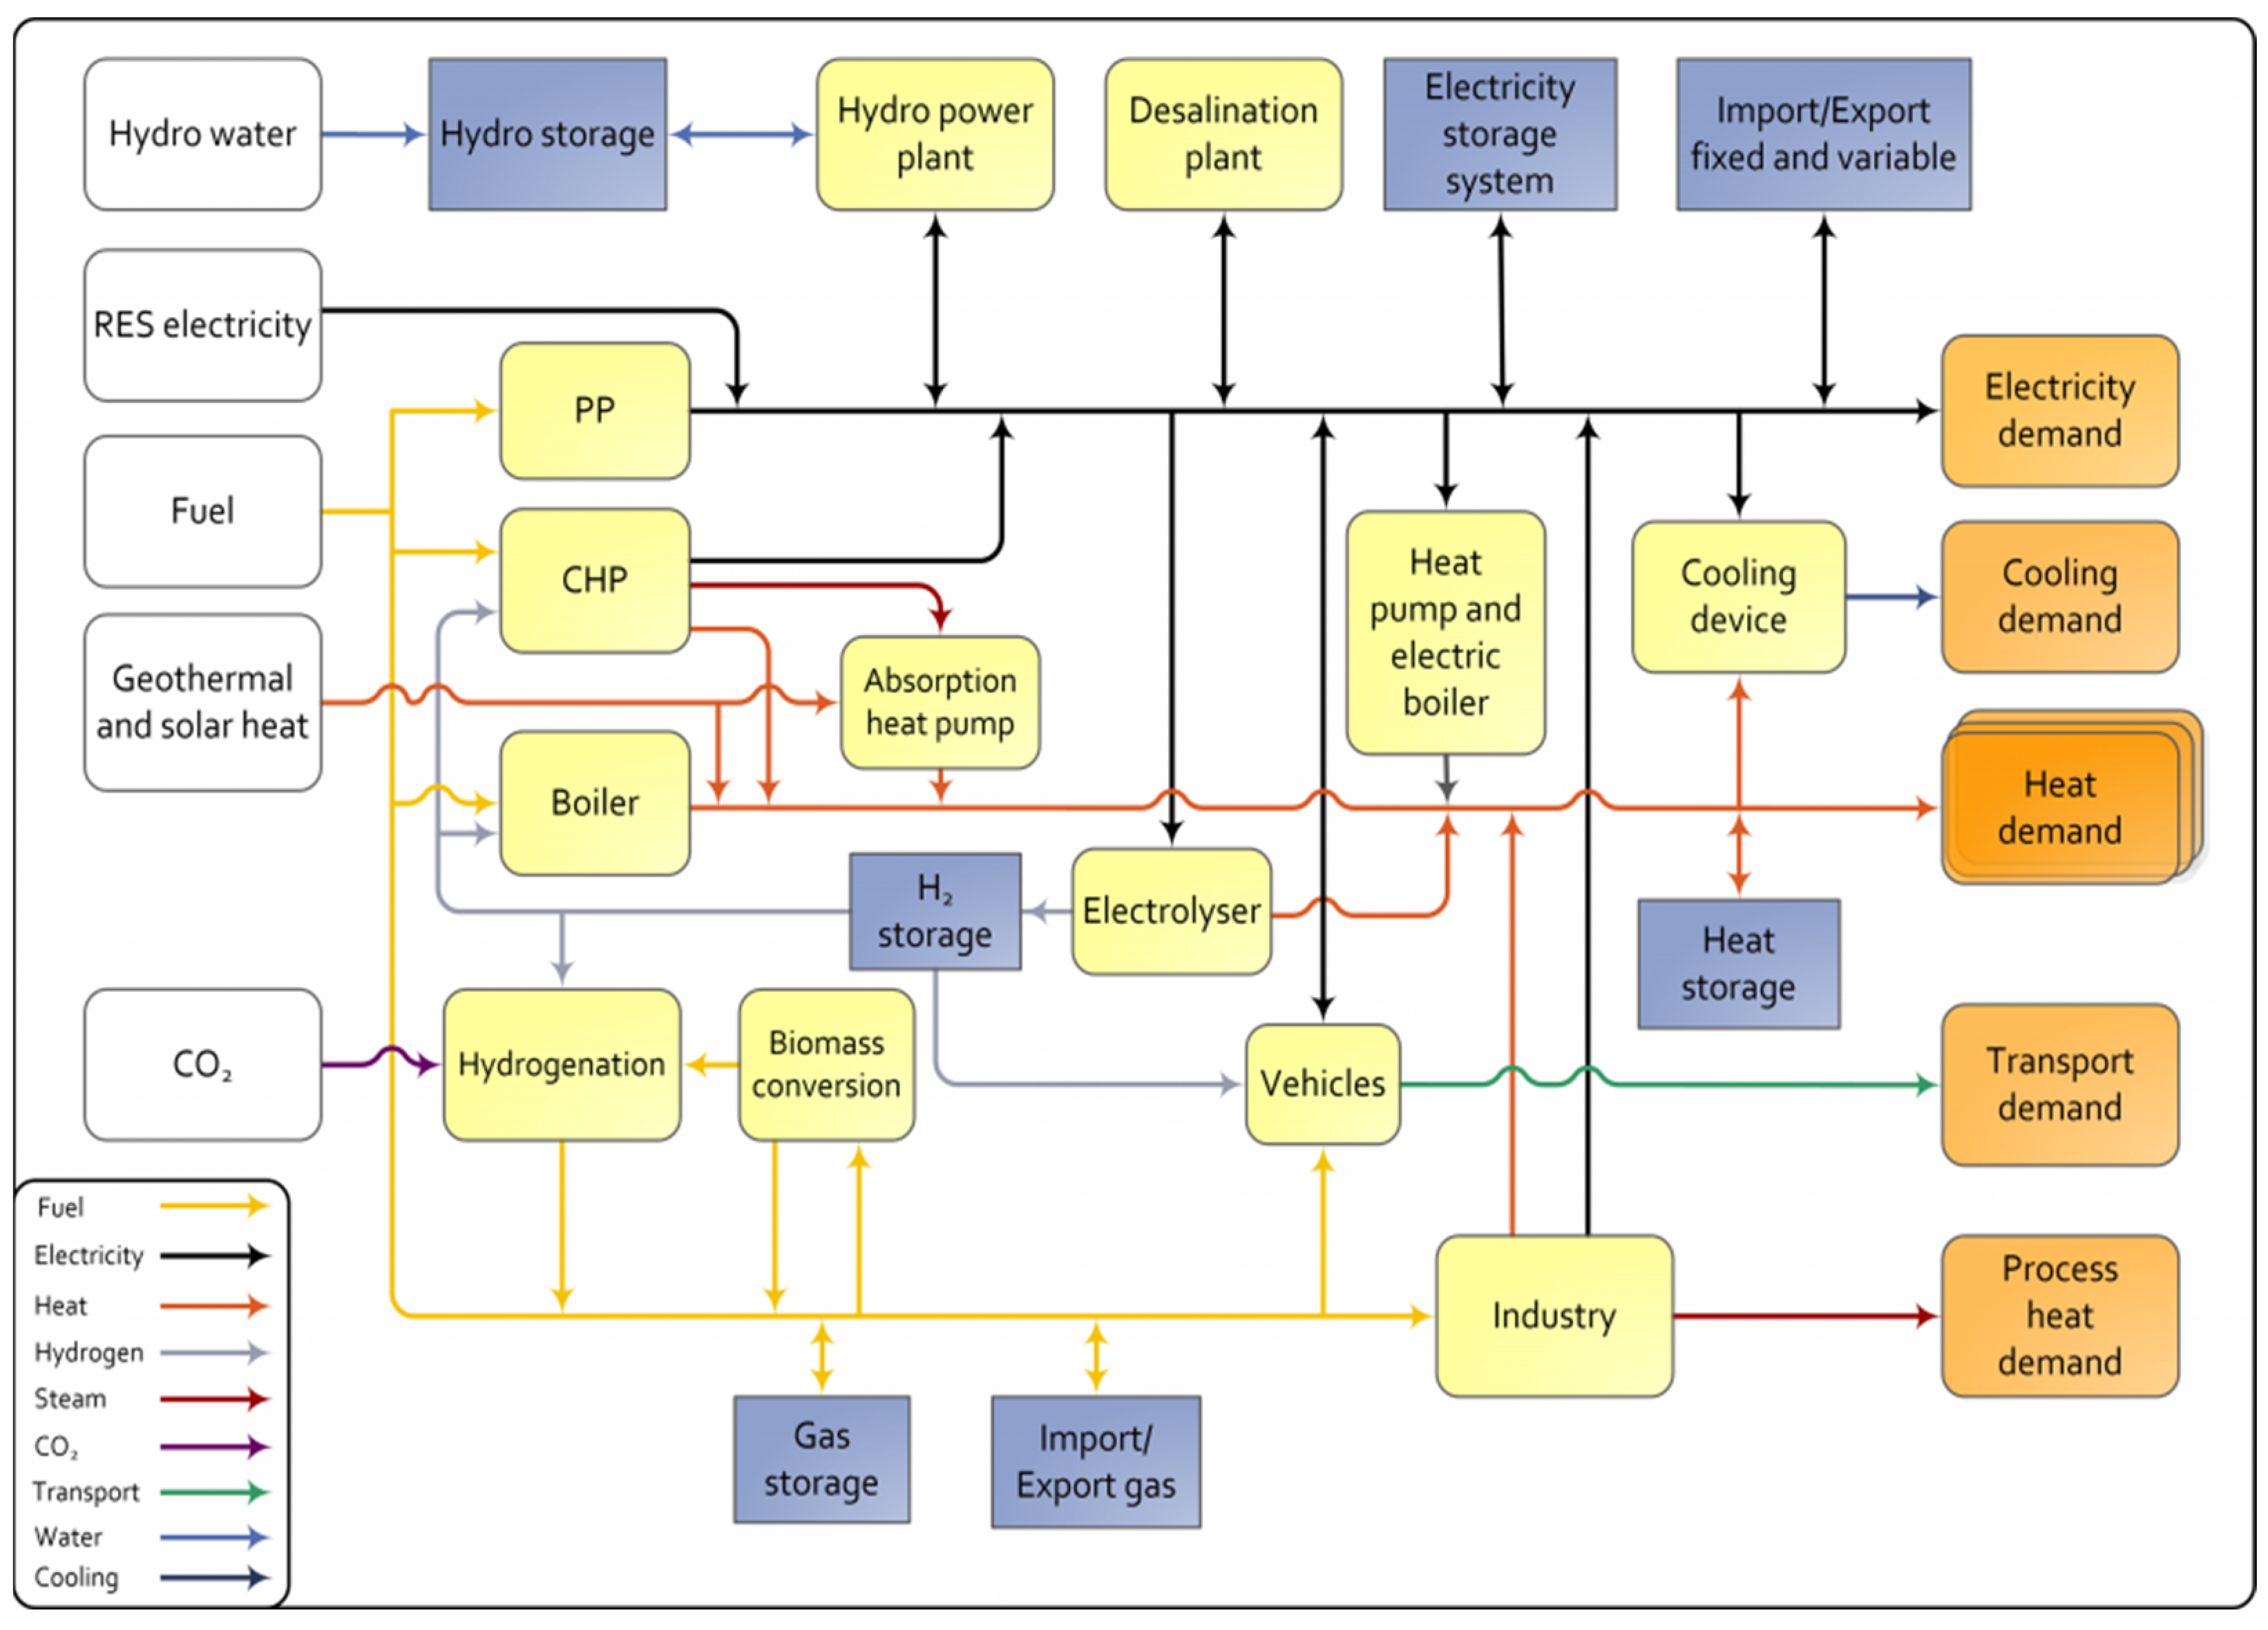
The input–output framework of the software is depicted in Figure 1. An energy system is constructed by inputting a series of parameters related to the components of the system, including the energy demand, supply, and cost for each sector [41]. The system’s total cost, primary energy consumption, and carbon dioxide emissions are obtained, which can be applied to understand and analyze the impact of various energy planning schemes on the economy and environment [37].
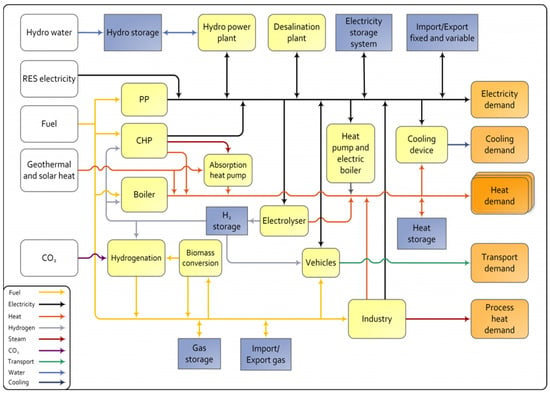
Figure 1.
The input–output energy flow of frame diagram for EnergyPLAN software [56].
Furthermore, EnergyPLAN can also be applied for technical and market economic simulation. The former minimizes fossil fuel consumption and is performed without cost input, while the latter ignores the system’s operating costs as much as possible.
2.2. Modeling Process
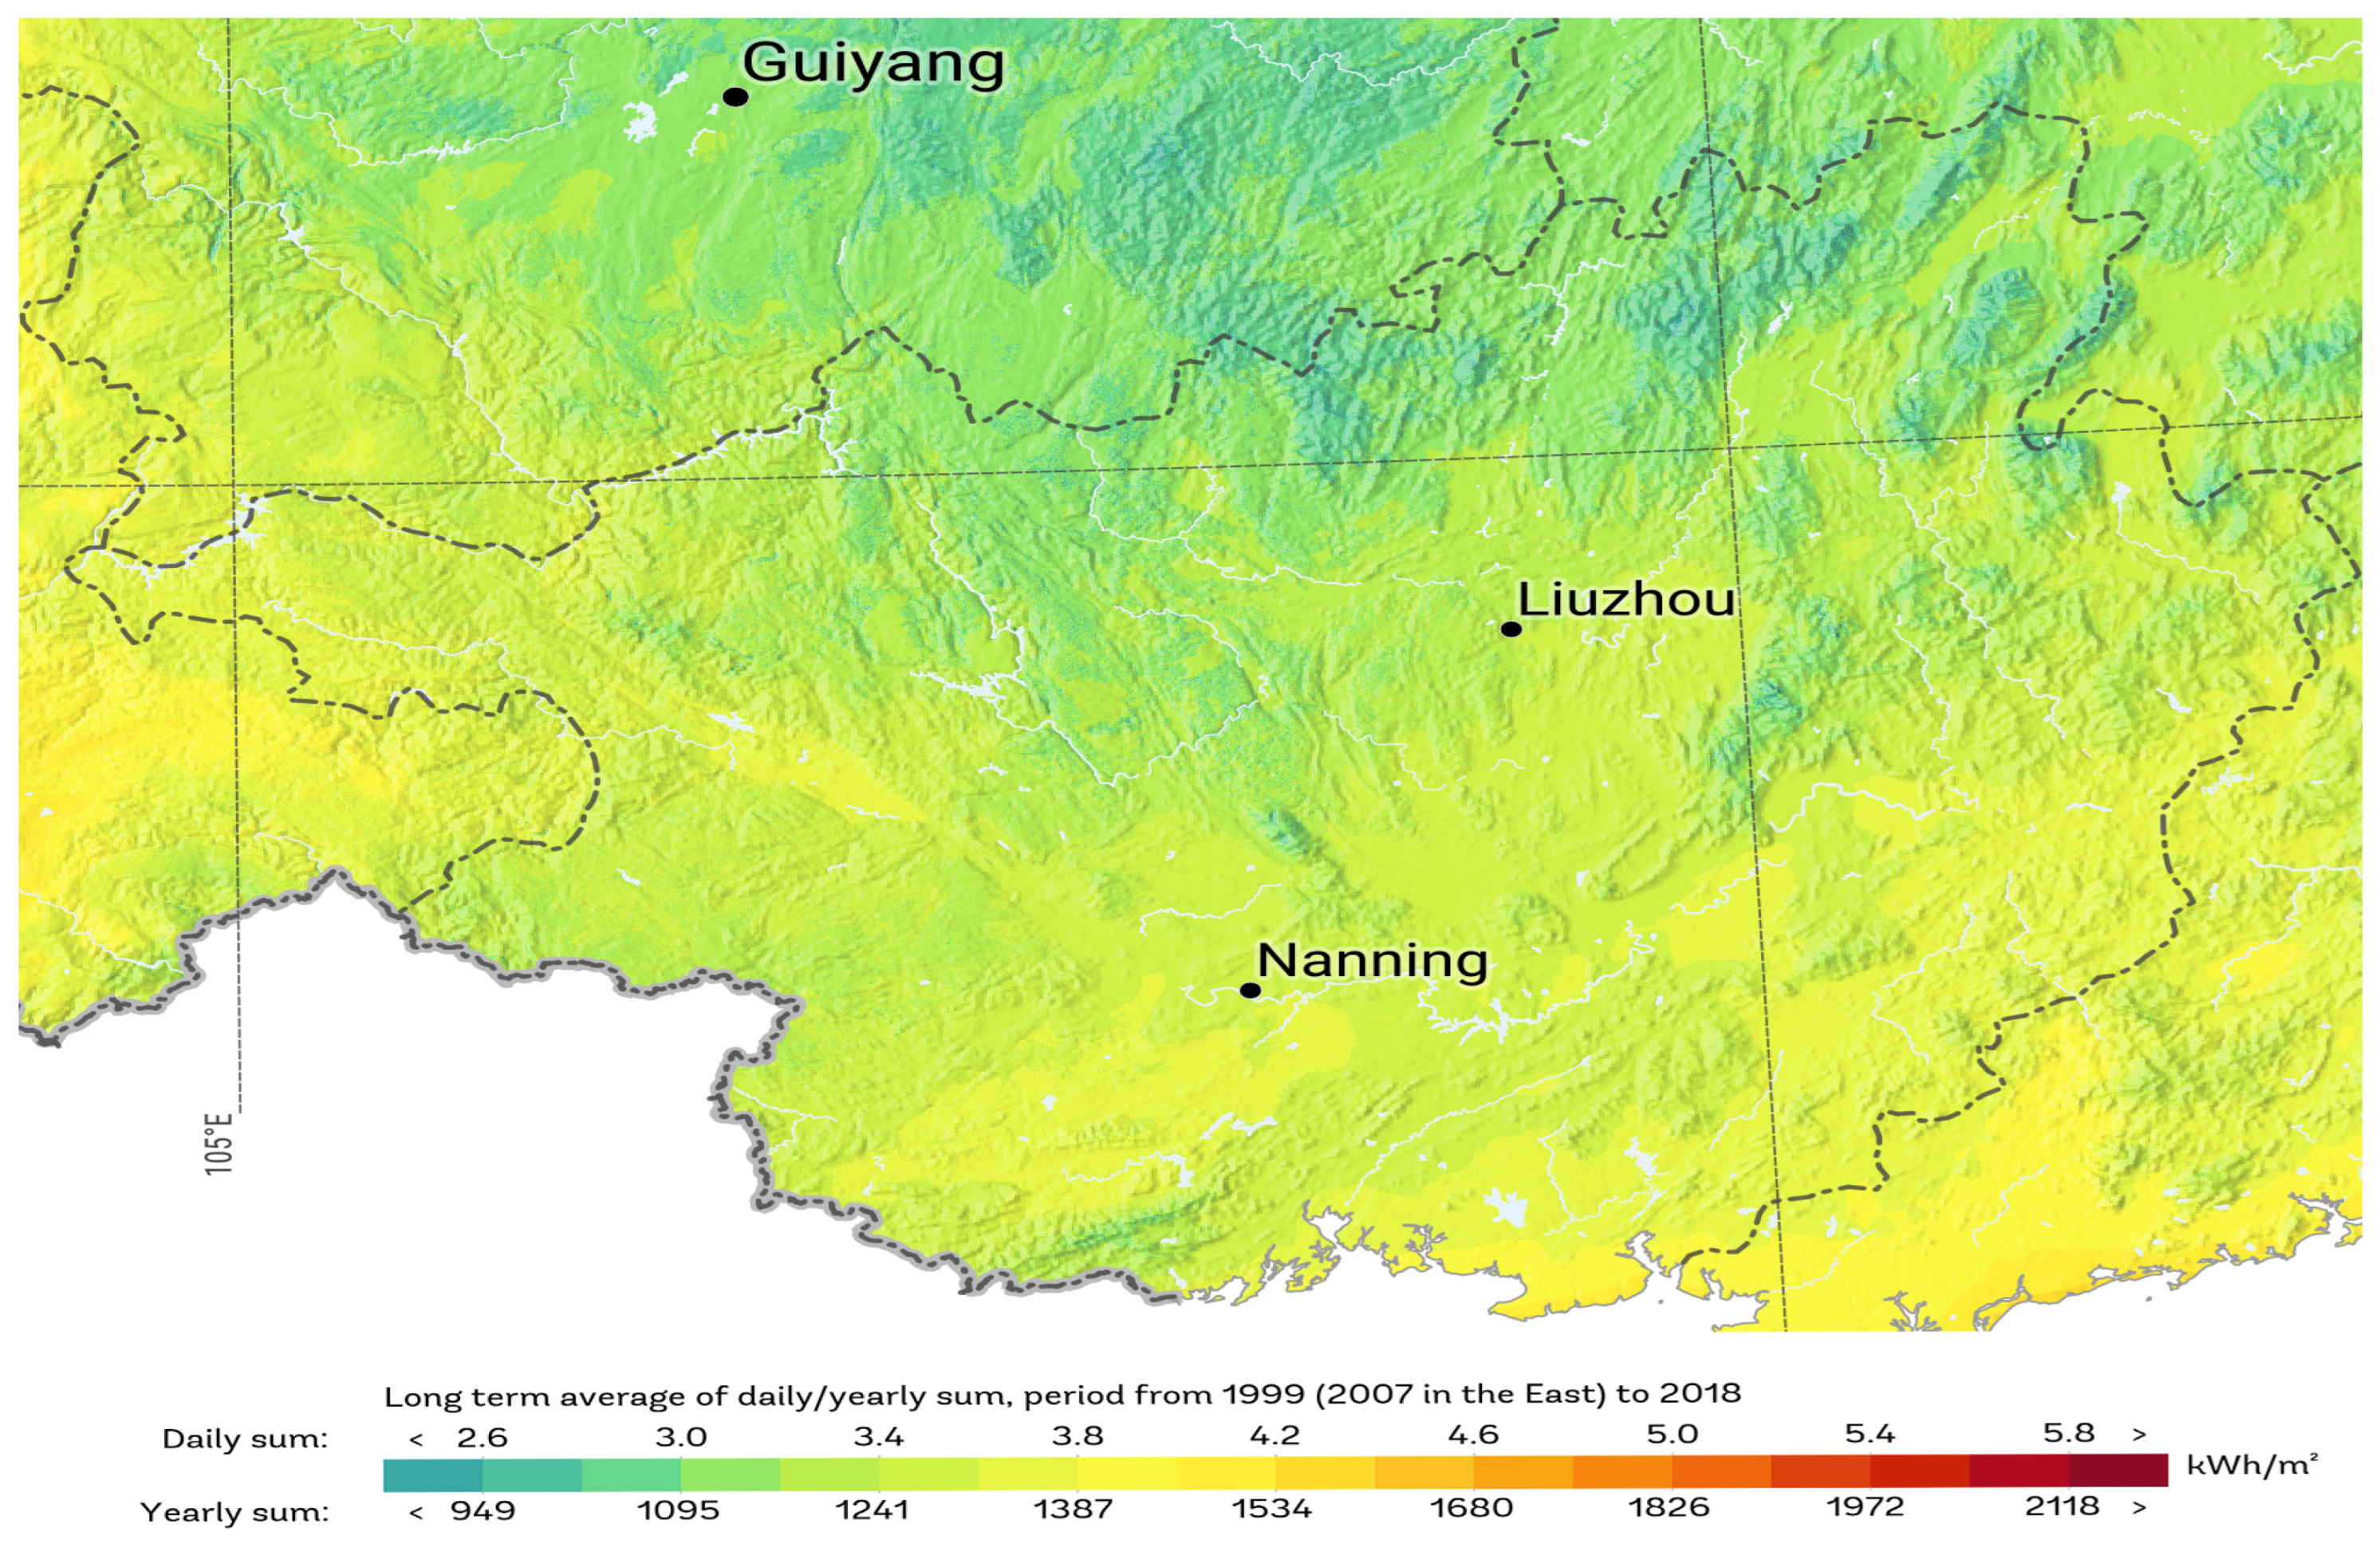
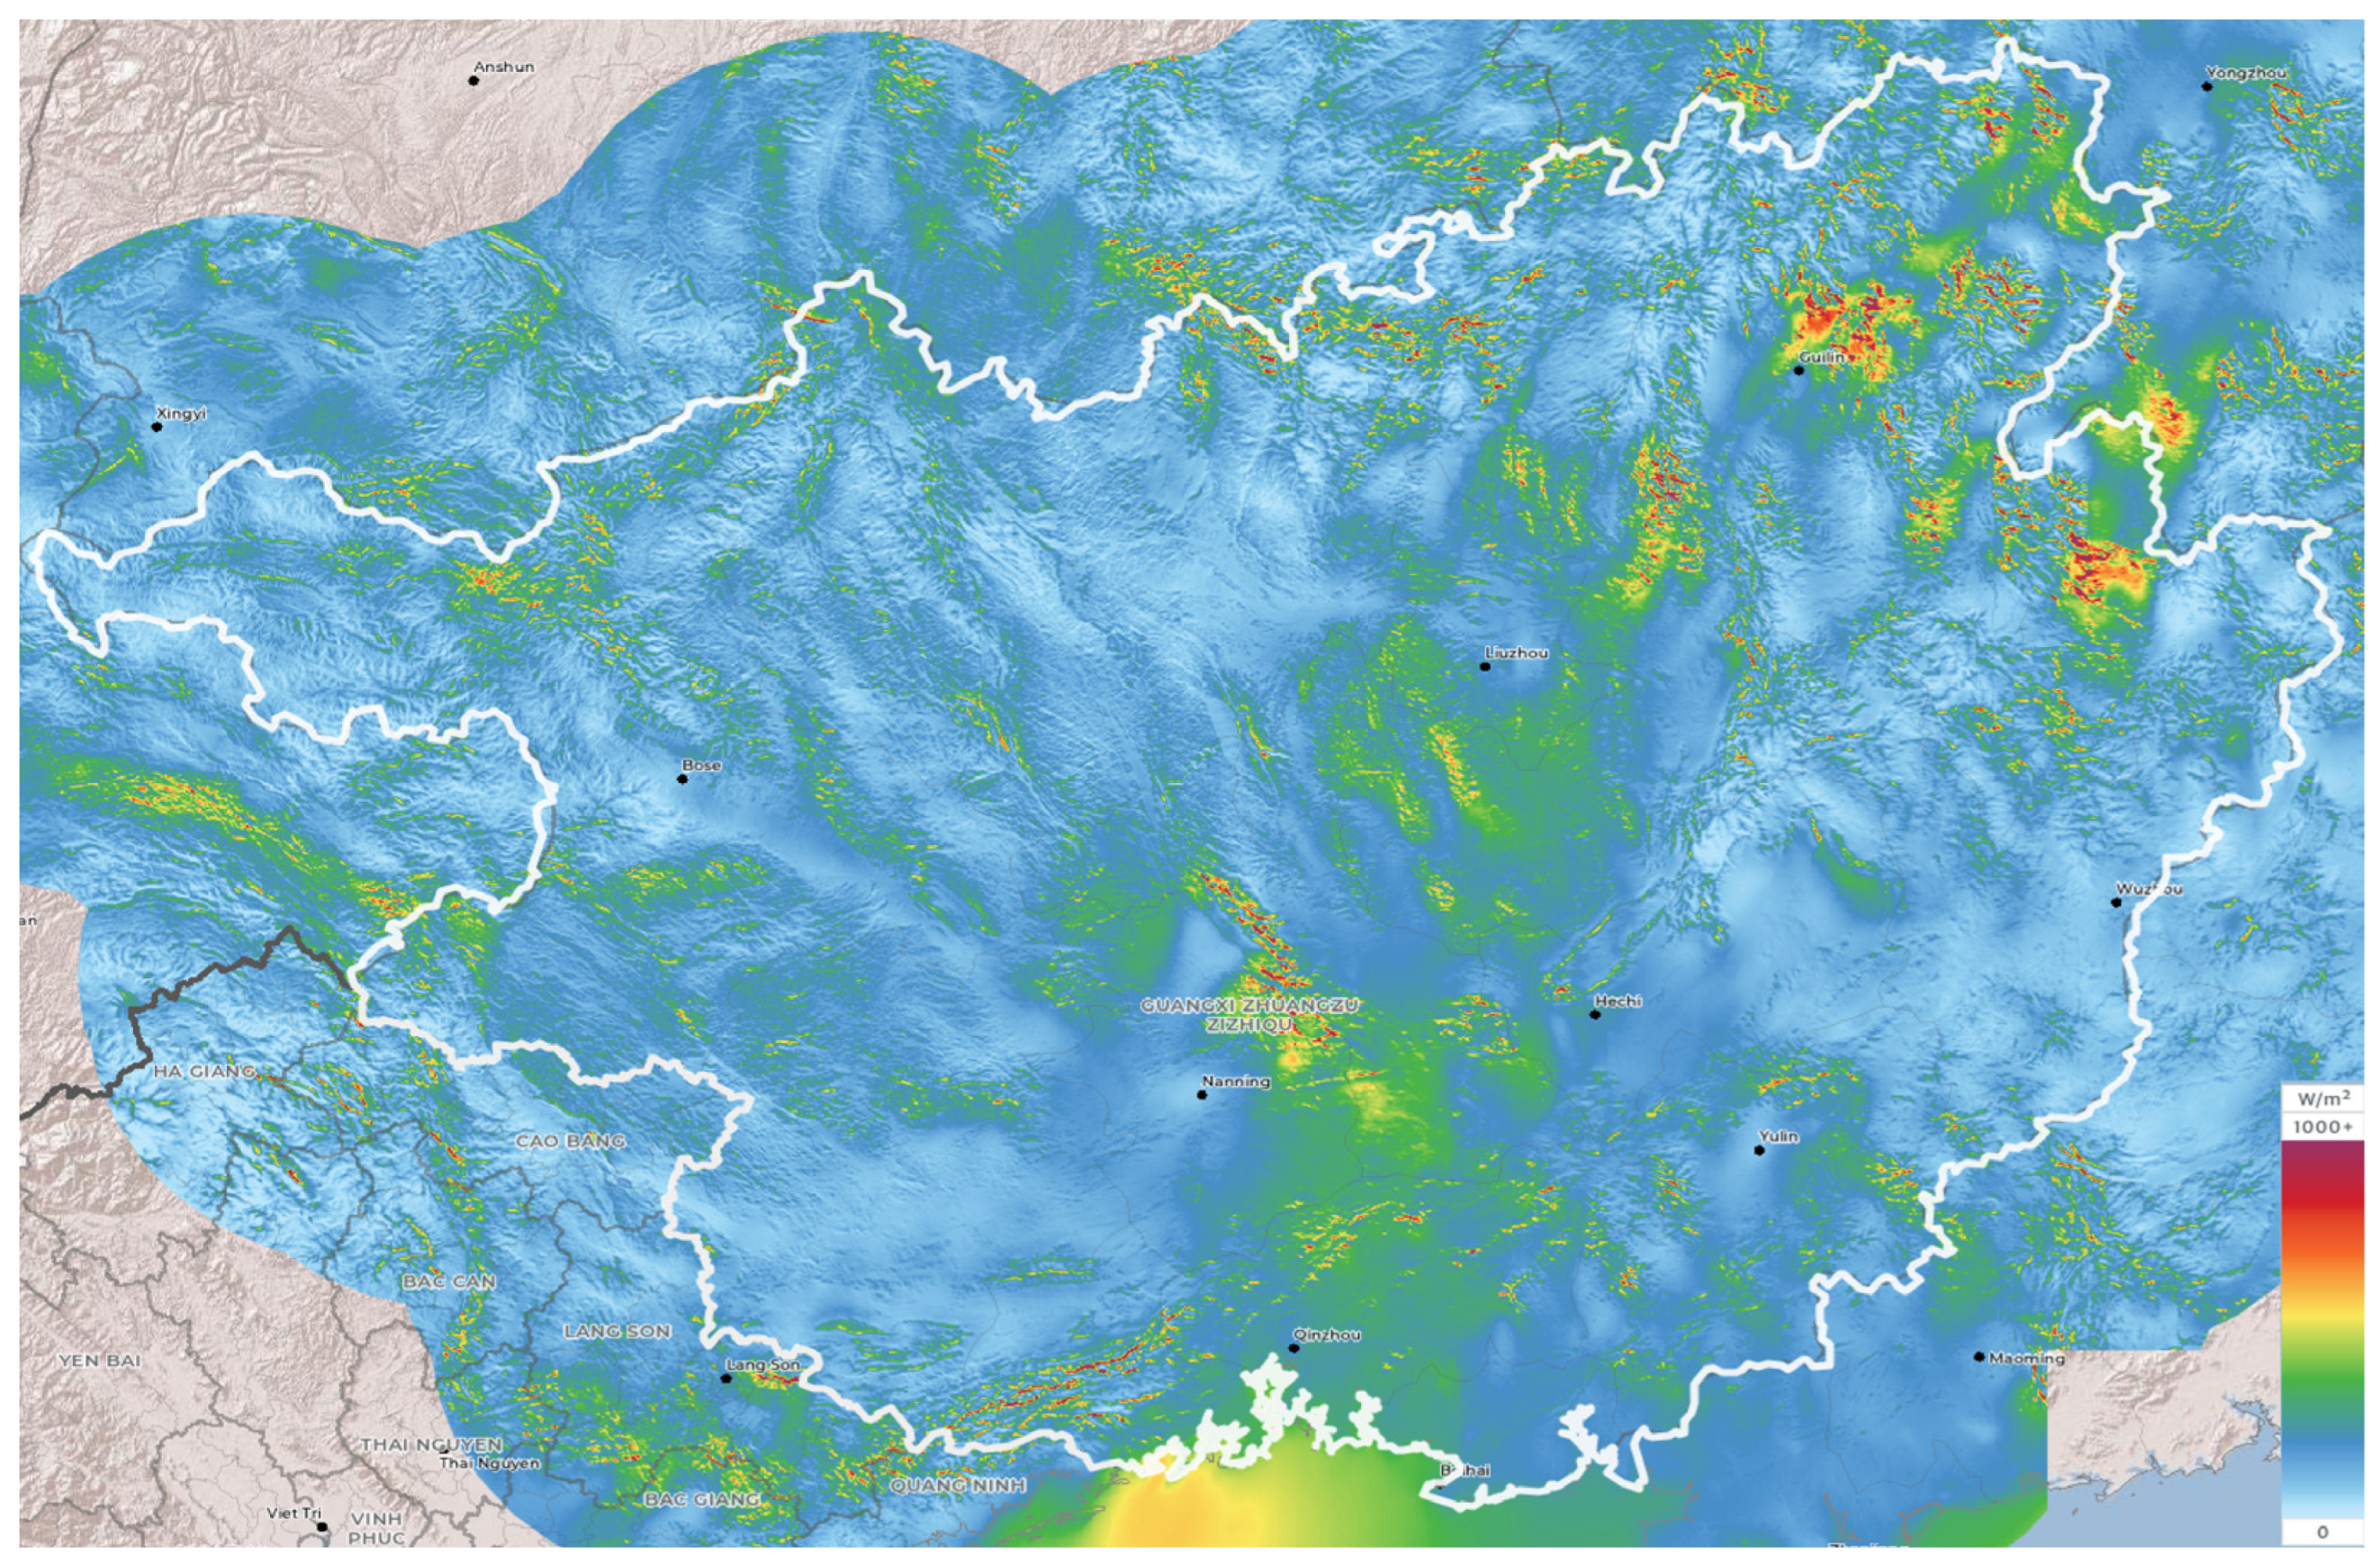
The Guangxi Zhuang Autonomous Region is a province situated on the southern coast of China, covering an area of 23.76 km2 with a mainland coastline spanning 1595 km [57]. Figure 2 and Figure 3 demonstrate that renewable energy, including onshore wind, offshore wind, and photovoltaic power generation, has tremendous potential for large-scale regional development. Additionally, Guangxi is a significant area for developing nuclear power in the country, boasting abundant uranium resources and a superior geographical location. Guangxi’s planned nuclear power site resources are expected to reach 31,200 MW.
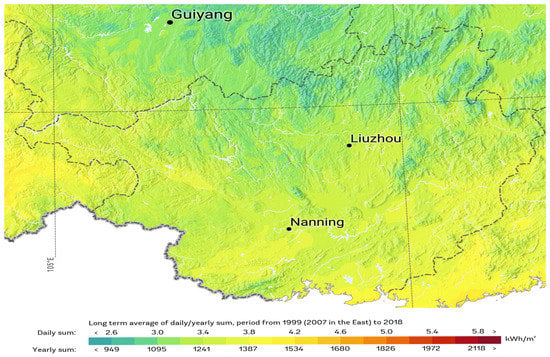
Figure 2.
Guangxi annual average horizontal irradiation map from 2007 to 2018 [58].
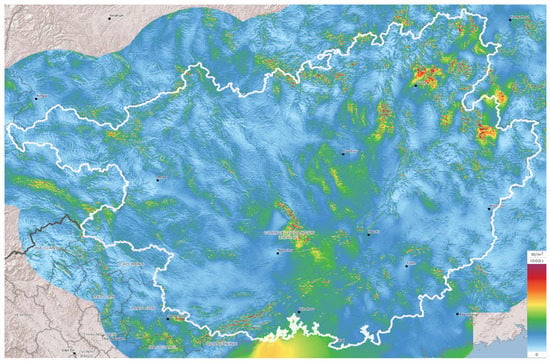
Figure 3.
Guangxi distribution of the mean wind power density at 100 m [59].
In the future, Guangxi is expected to enter a new stage of high-quality development, marked by the accelerated replacement of fossil energy, offering significant prospects for the realization of industrial transition and energy structure optimization [60].
2.2.1. Current (2020REF) Scenario
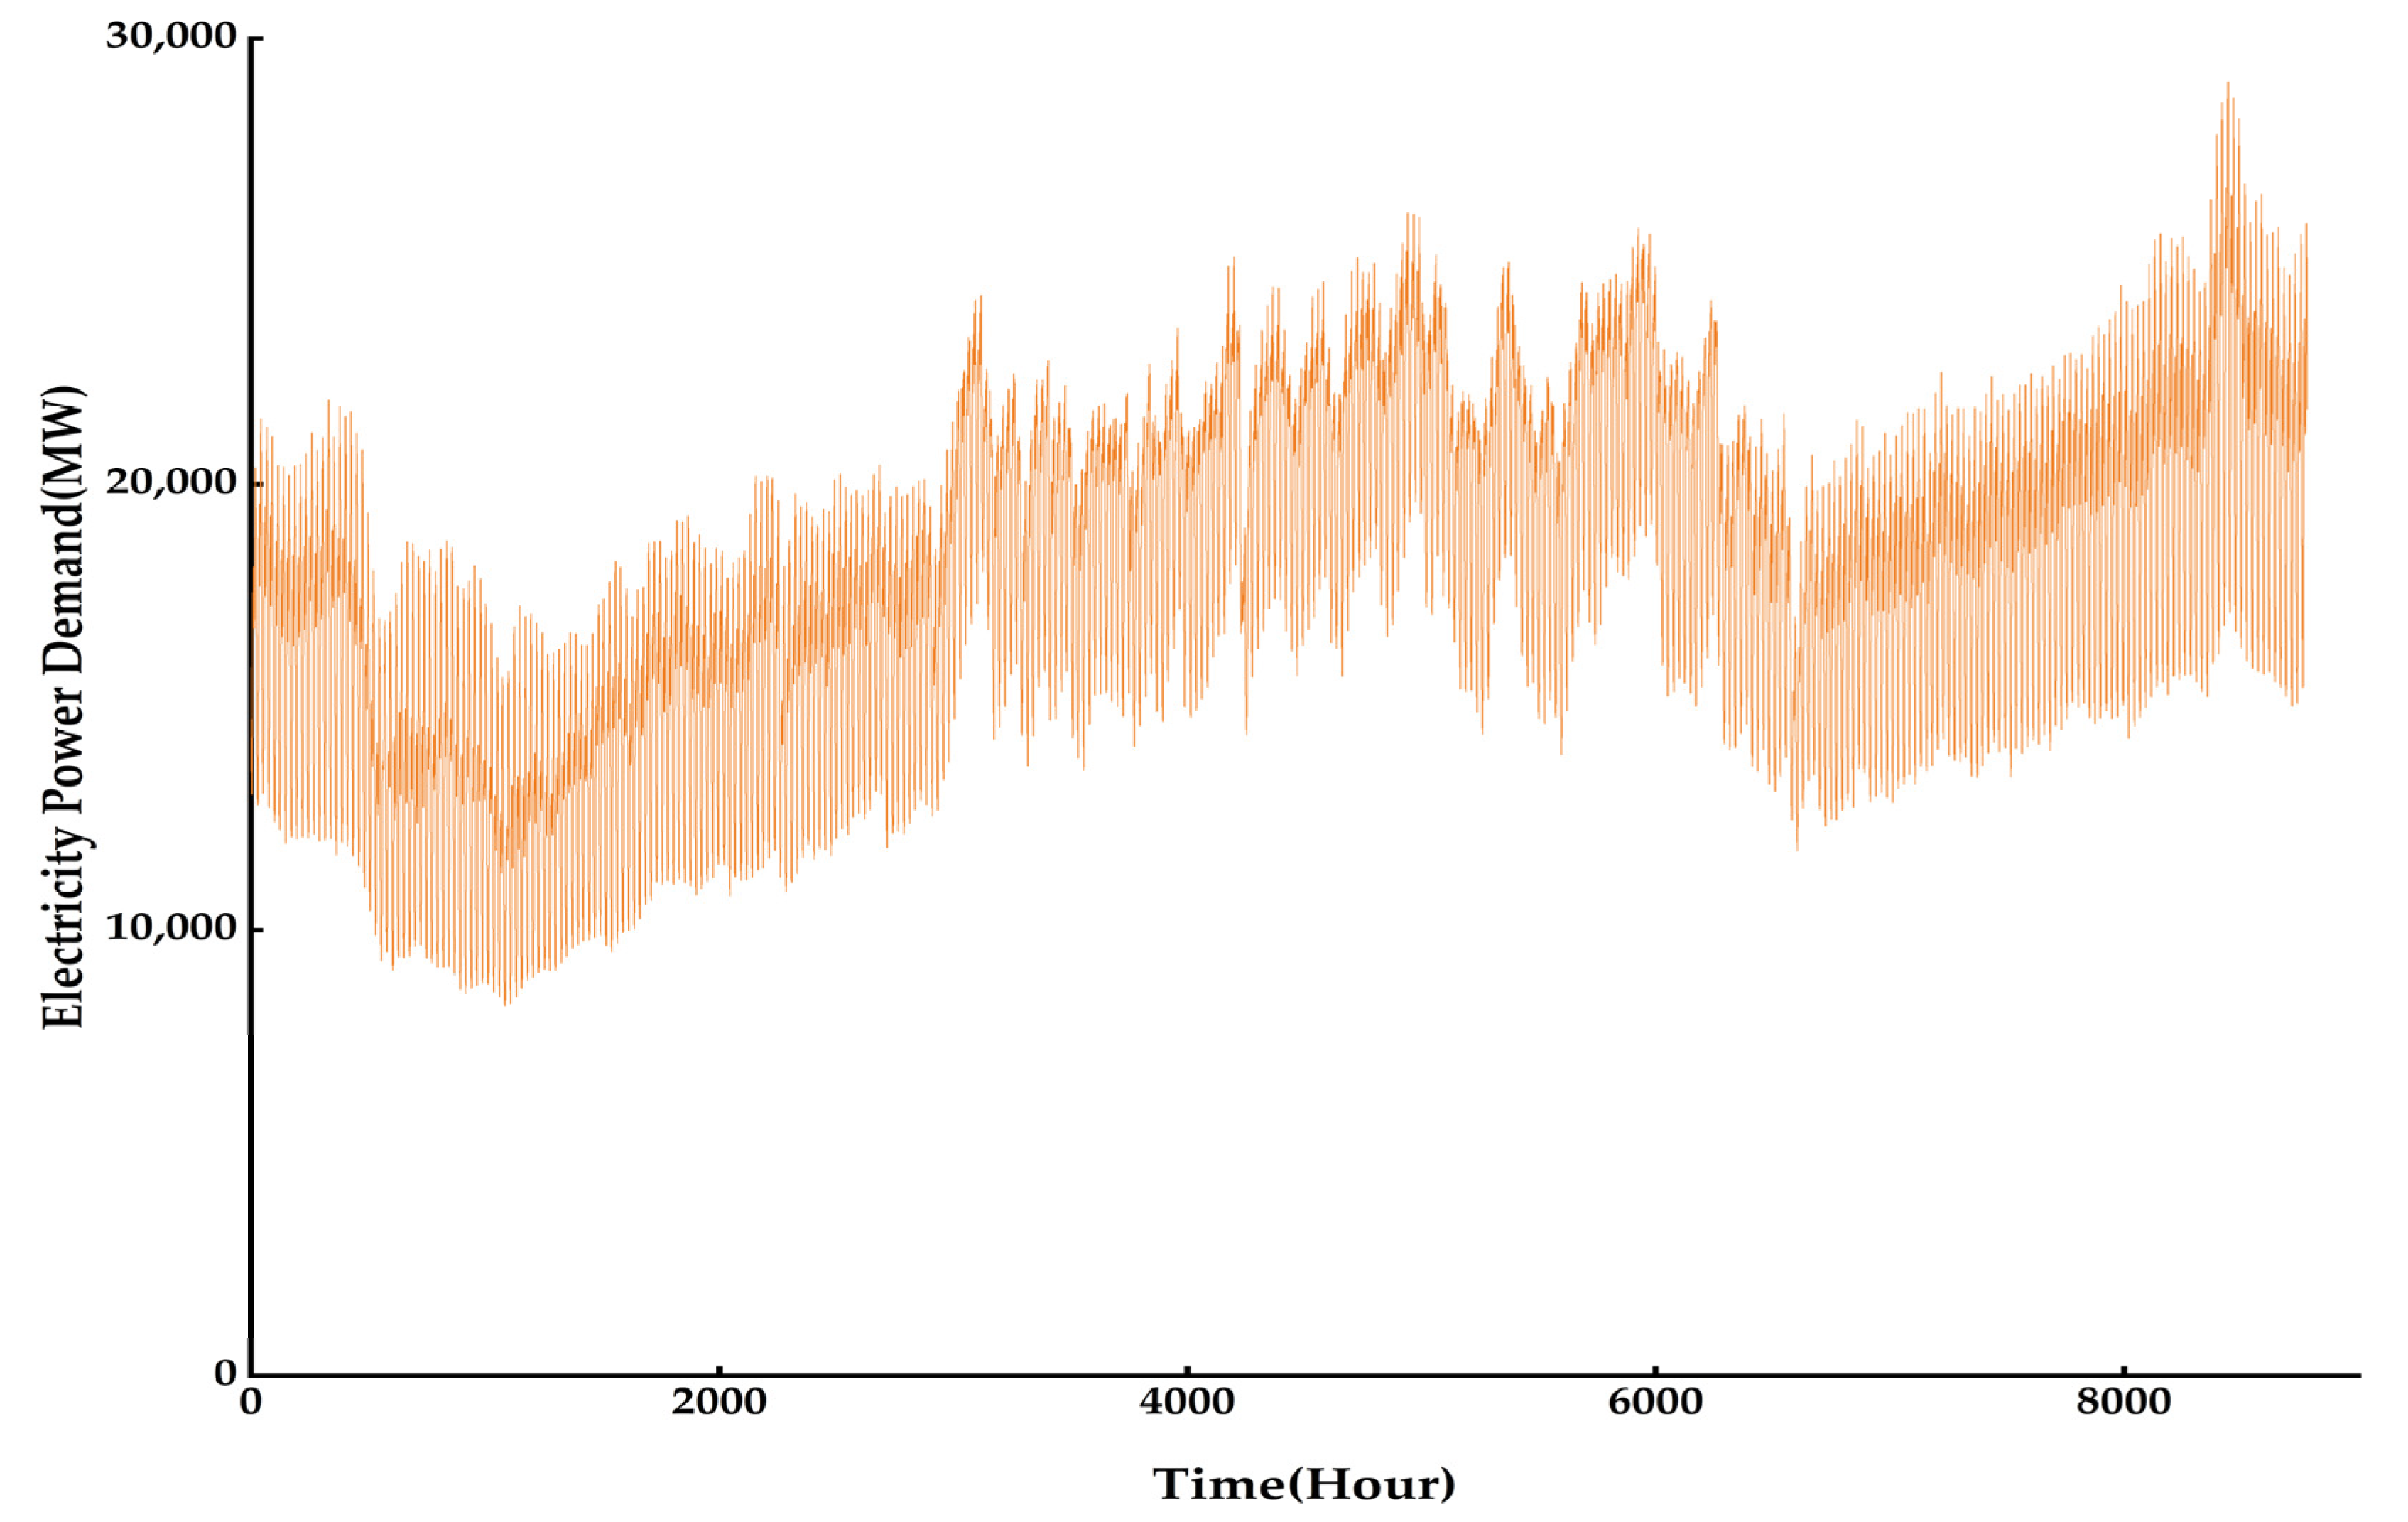
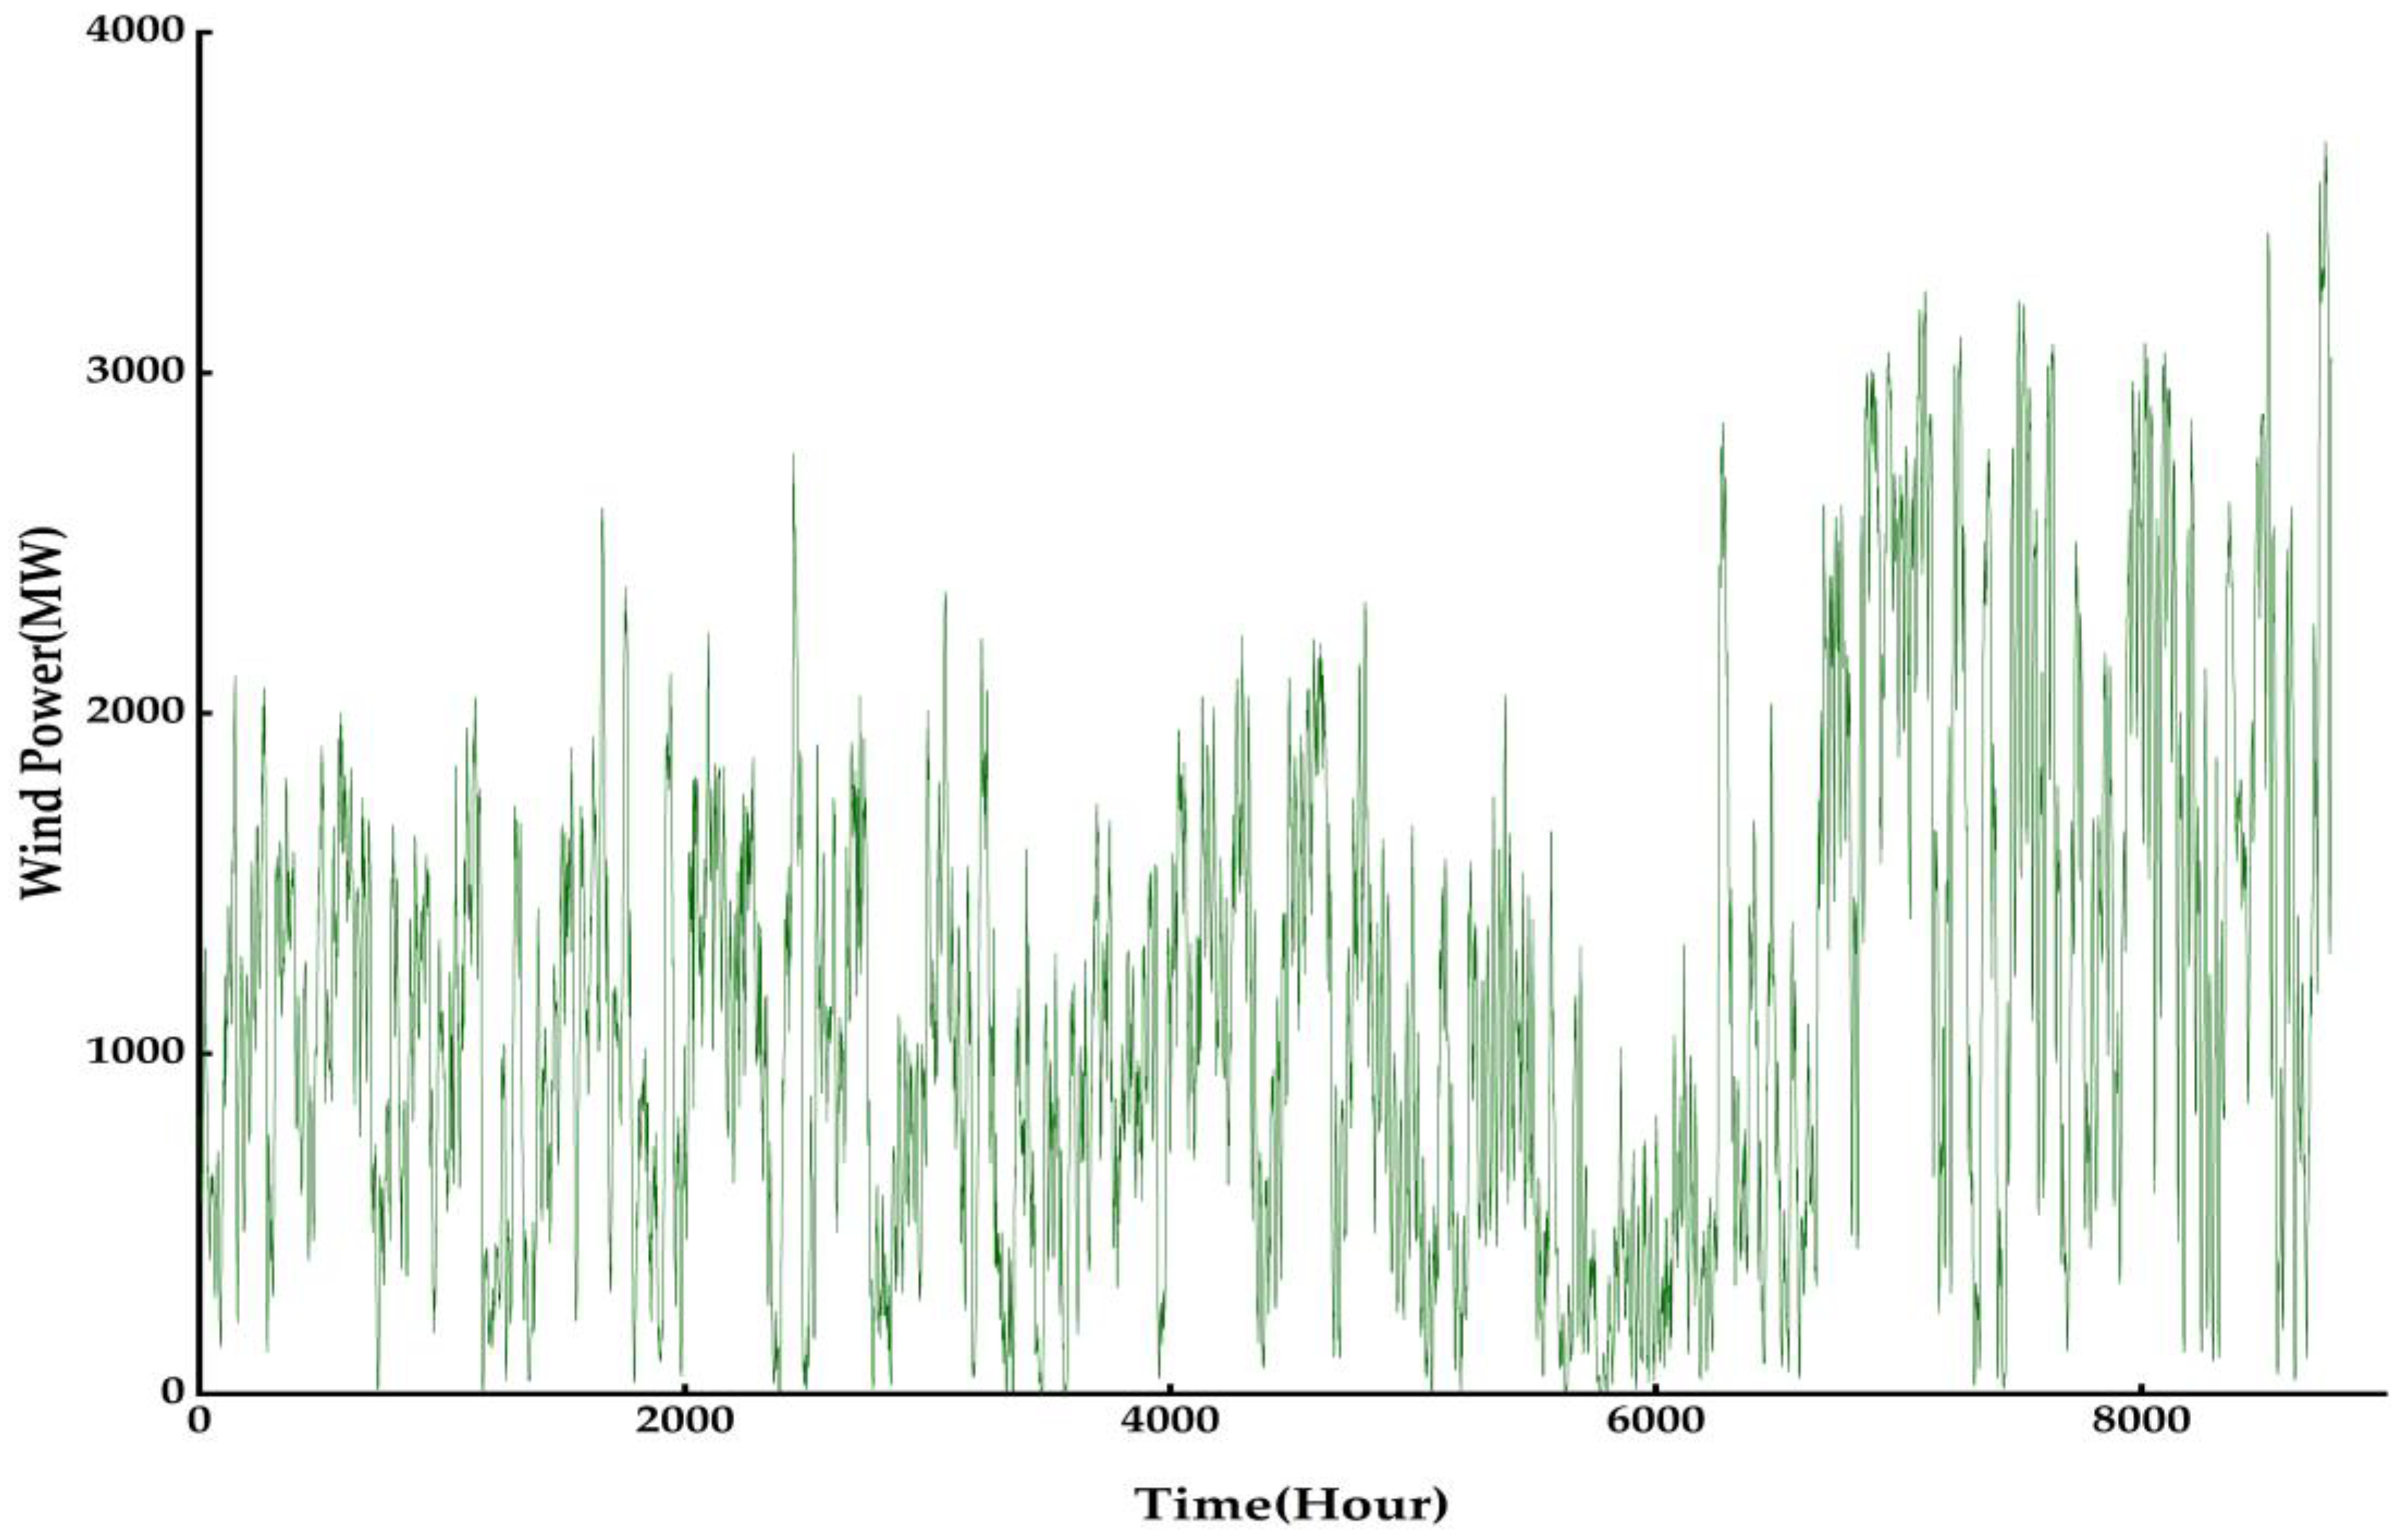
A reference model must be designed as a comparison to create and analyze future scenarios. This paper chose 2020 as the reference year because the energy data of 2020 are relatively new and available to obtain from the Internet. The data include information such as energy demand, installed capacity, and power generation from various power generation technologies, as well as their costs, mainly from [61,62,63,64,65,66]. Figure 4 and Figure 5 depict the hourly distributions plot of power demand and onshore wind power provided by the Guangxi power grid.
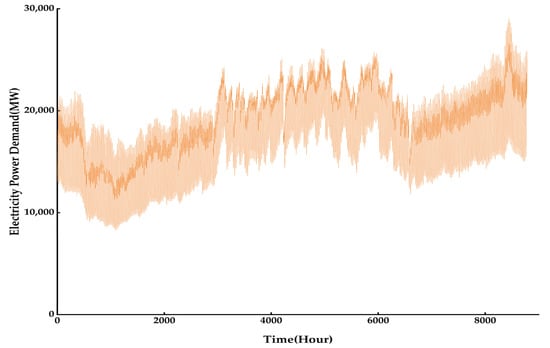
Figure 4.
Hourly distribution data of electricity demand in Guangxi in 2020.
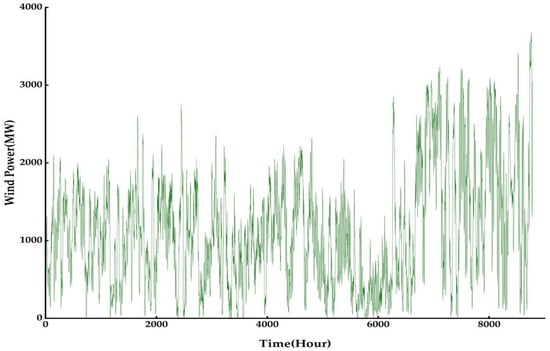
Figure 5.
Hourly distribution data of onshore wind power in Guangxi in 2020.
The total energy consumption in Guangxi is 960.62 TWh, with coal accounting for approximately 48% of total energy consumption, followed by electricity (21%) and oil (13%). According to the information found, it can be stated that the power sector’s electricity demand in 2020 amounted to 202.4 TWh, while the generation reached 193.8 TWh, leaving a shortfall of 8.6 TWh, which had to be imported. Guangxi has yet to establish centralized residential heating systems such as those in northern China, and the heat energy is mainly used for industrial production. The heat supply in 2020 was 47.52 TWh, including 47.1 TWh for district heating boilers and 0.42 TWh for combined heat and power boilers. As a result, district heating is assumed to be the only heat source in Guangxi today and in the future. In 2020, the total energy consumption of the transportation and industrial sectors in Guangxi was estimated to be 76.34 TWh and 225.61 TWh, respectively. The installed capacity of each generation technology and energy consumption in the transportation and industrial sectors is shown in Table 1 and Table 2.

Table 1.
The installed capacity of power generation technologies for Guangxi in 2020.

Table 2.
Different sources of energy consumption in transportation and industry sectors in 2020.
Two main validation methods are commonly used: one focuses on CO2 emissions in the output data, while the other involves assessing the fuel balance of primary energy sources in the input data. As official CO2 emission values were unavailable, Table 3 and Table 4 present results from the second validation method. Despite the differences in statistical caliber and standards, the EnergyPLAN simulation results were consistent with the official statistics, demonstrating that EnergyPLAN could accurately simulate the operation of the Guangxi energy system. Therefore, the hourly distribution data used in the 2020REF scenario were used in the subsequent studies.

Table 3.
Comparison of fossil energy consumption between the official values and the simulation results.

Table 4.
Comparison of Guangxi’s electricity system between the official values and the simulation results.
2.2.2. Short-Term (2025Policy) and Mid-Term (2030Policy and 2030RES) Scenarios
Guangxi’s energy system has formulated intricate planning to promote the development and utilization of renewable energy resources vigorously. According to policy documents issued by the government of Guangxi Autonomous Region [7,60], the average annual growth rate of the total society’s electricity demand will be at least 7.1%, and the total society’s electricity consumption will reach more than 286 TWh, by 2025. The total installed power generation capacity will be more than 90,000 MW. The grid-connected renewable energy capacity will reach 61,000 MW, and the power generation of renewable energy will increase to 126 TWh. The total consumption of renewable energy is anticipated to reach 36 million tons of standard coal, accounting for 25% of the total energy consumption.
To further support the national strategy of achieving a carbon peak by 2030, Guangxi is planning to significantly develop offshore wind power in Tonkin Gulf on a large scale, build coastal nuclear power stations in a safe and orderly manner, exploit onshore wind power in depth, develop photovoltaic power generation on a large scale, and develop biomass energy under local conditions. By 2030, the proportion of non-fossil energy consumption will reach about 35%, and the total installed power capacity aims to reach 160,000 MW. The installed clean energy capacity is around 120,000 MW, of which the total installed capacity of wind power and photovoltaic power generation will exceed 70,000 MW [67]. The 2025Policy, 2030Policy, and 2030RES scenarios were developed based on the above government documents. Table 5 displays the detailed inputs and technologies in the 2025 and 2030 scenarios.

Table 5.
The planning installed capacity of power generation technologies for Guangxi under policy scenarios in 2025 and 2030.
According to the “Study on Some Issues of Energy Consumption Revolution”, due to the promotion of biofuels and new energy electric vehicles, the average annual growth rate of total energy consumption of the transportation sector is predicted to be 3.3% from 2020 to 2050. By 2030, natural gas, petrol, diesel, jet fuel, electricity, biomass, and hydrogen energy will account for 6%, 33%, 36%, 6%, 7%, 11%, and 1%, respectively, and by 2050, the above percentages will be 3%, 33%, 32%, 8%, 7%, 12%, and 4%, respectively.
Contrary to the projections for the transportation sector, energy demand in the industrial sector will peak in 2025–2030 as the industrial sector becomes more electrified and then trends slowly, with the highest consumption of fossil energy represented by coal, oil, and natural gas by 2030 and a 21% decline in fossil energy consumption by 2050, while the total share of biomass, hydrogen, and electricity will reach 65% of consumption. For energy demand in the heat sector, the average annual growth rate between 2020 and 2050 will be 2%, a quarter of the annual growth rate of heat use in 2010-2020. The energy consumption in the future scenarios for the transportation and industry sectors is shown in Table 6.

Table 6.
Different sources of energy consumption in transportation and industry sectors in the future scenarios.
2.2.3. Long-Term (2050LRES, 2050MRES, and 2050HRES) Scenarios
From 2030 to 2050, with the deepening of the transformation trend towards clean energy, the development of traditional thermal power and hydropower will reach the limit. At the same time, the government will vigorously exploit other clean energy. The exploitable power generation potential of onshore wind and photovoltaic in Guangxi is 78,000 MW and 96,000 MW, respectively. The total planned development of offshore wind power is 22,500 MW, and Guangxi’s planned nuclear power plant resources are 31,200 MW, including 20,800 MW for coastal sites and 10,400 MW for inland sites, with a maximum development rate of 0.7 in 2050 [68]. Due to the Fukushima nuclear disaster, the Chinese government has been extremely cautious about constructing inland nuclear power plants, but inland nuclear power plants are technically feasible [69]. Therefore, three scenarios have been created:
- Non-consideration of inland nuclear power plants (2050LRES)
- Partial consideration of inland nuclear power plants (2050MRES)
- Full consideration of inland nuclear power plants (2050HRES).
Industry, transportation, and heating sector demand in 2050 are mentioned in Section 2.2.2. Table 7 displays the detailed inputs and technologies in the 2050 scenarios.

Table 7.
The future installed capacity of power generation technologies for Guangxi in the 2050 scenarios.
3. Results and Discussion
This section presents the energy modeling results of the energy system in terms of the total annual costs, carbon emissions, energy consumptions, and the various power generation technologies’ installed capacity.
3.1. Costs
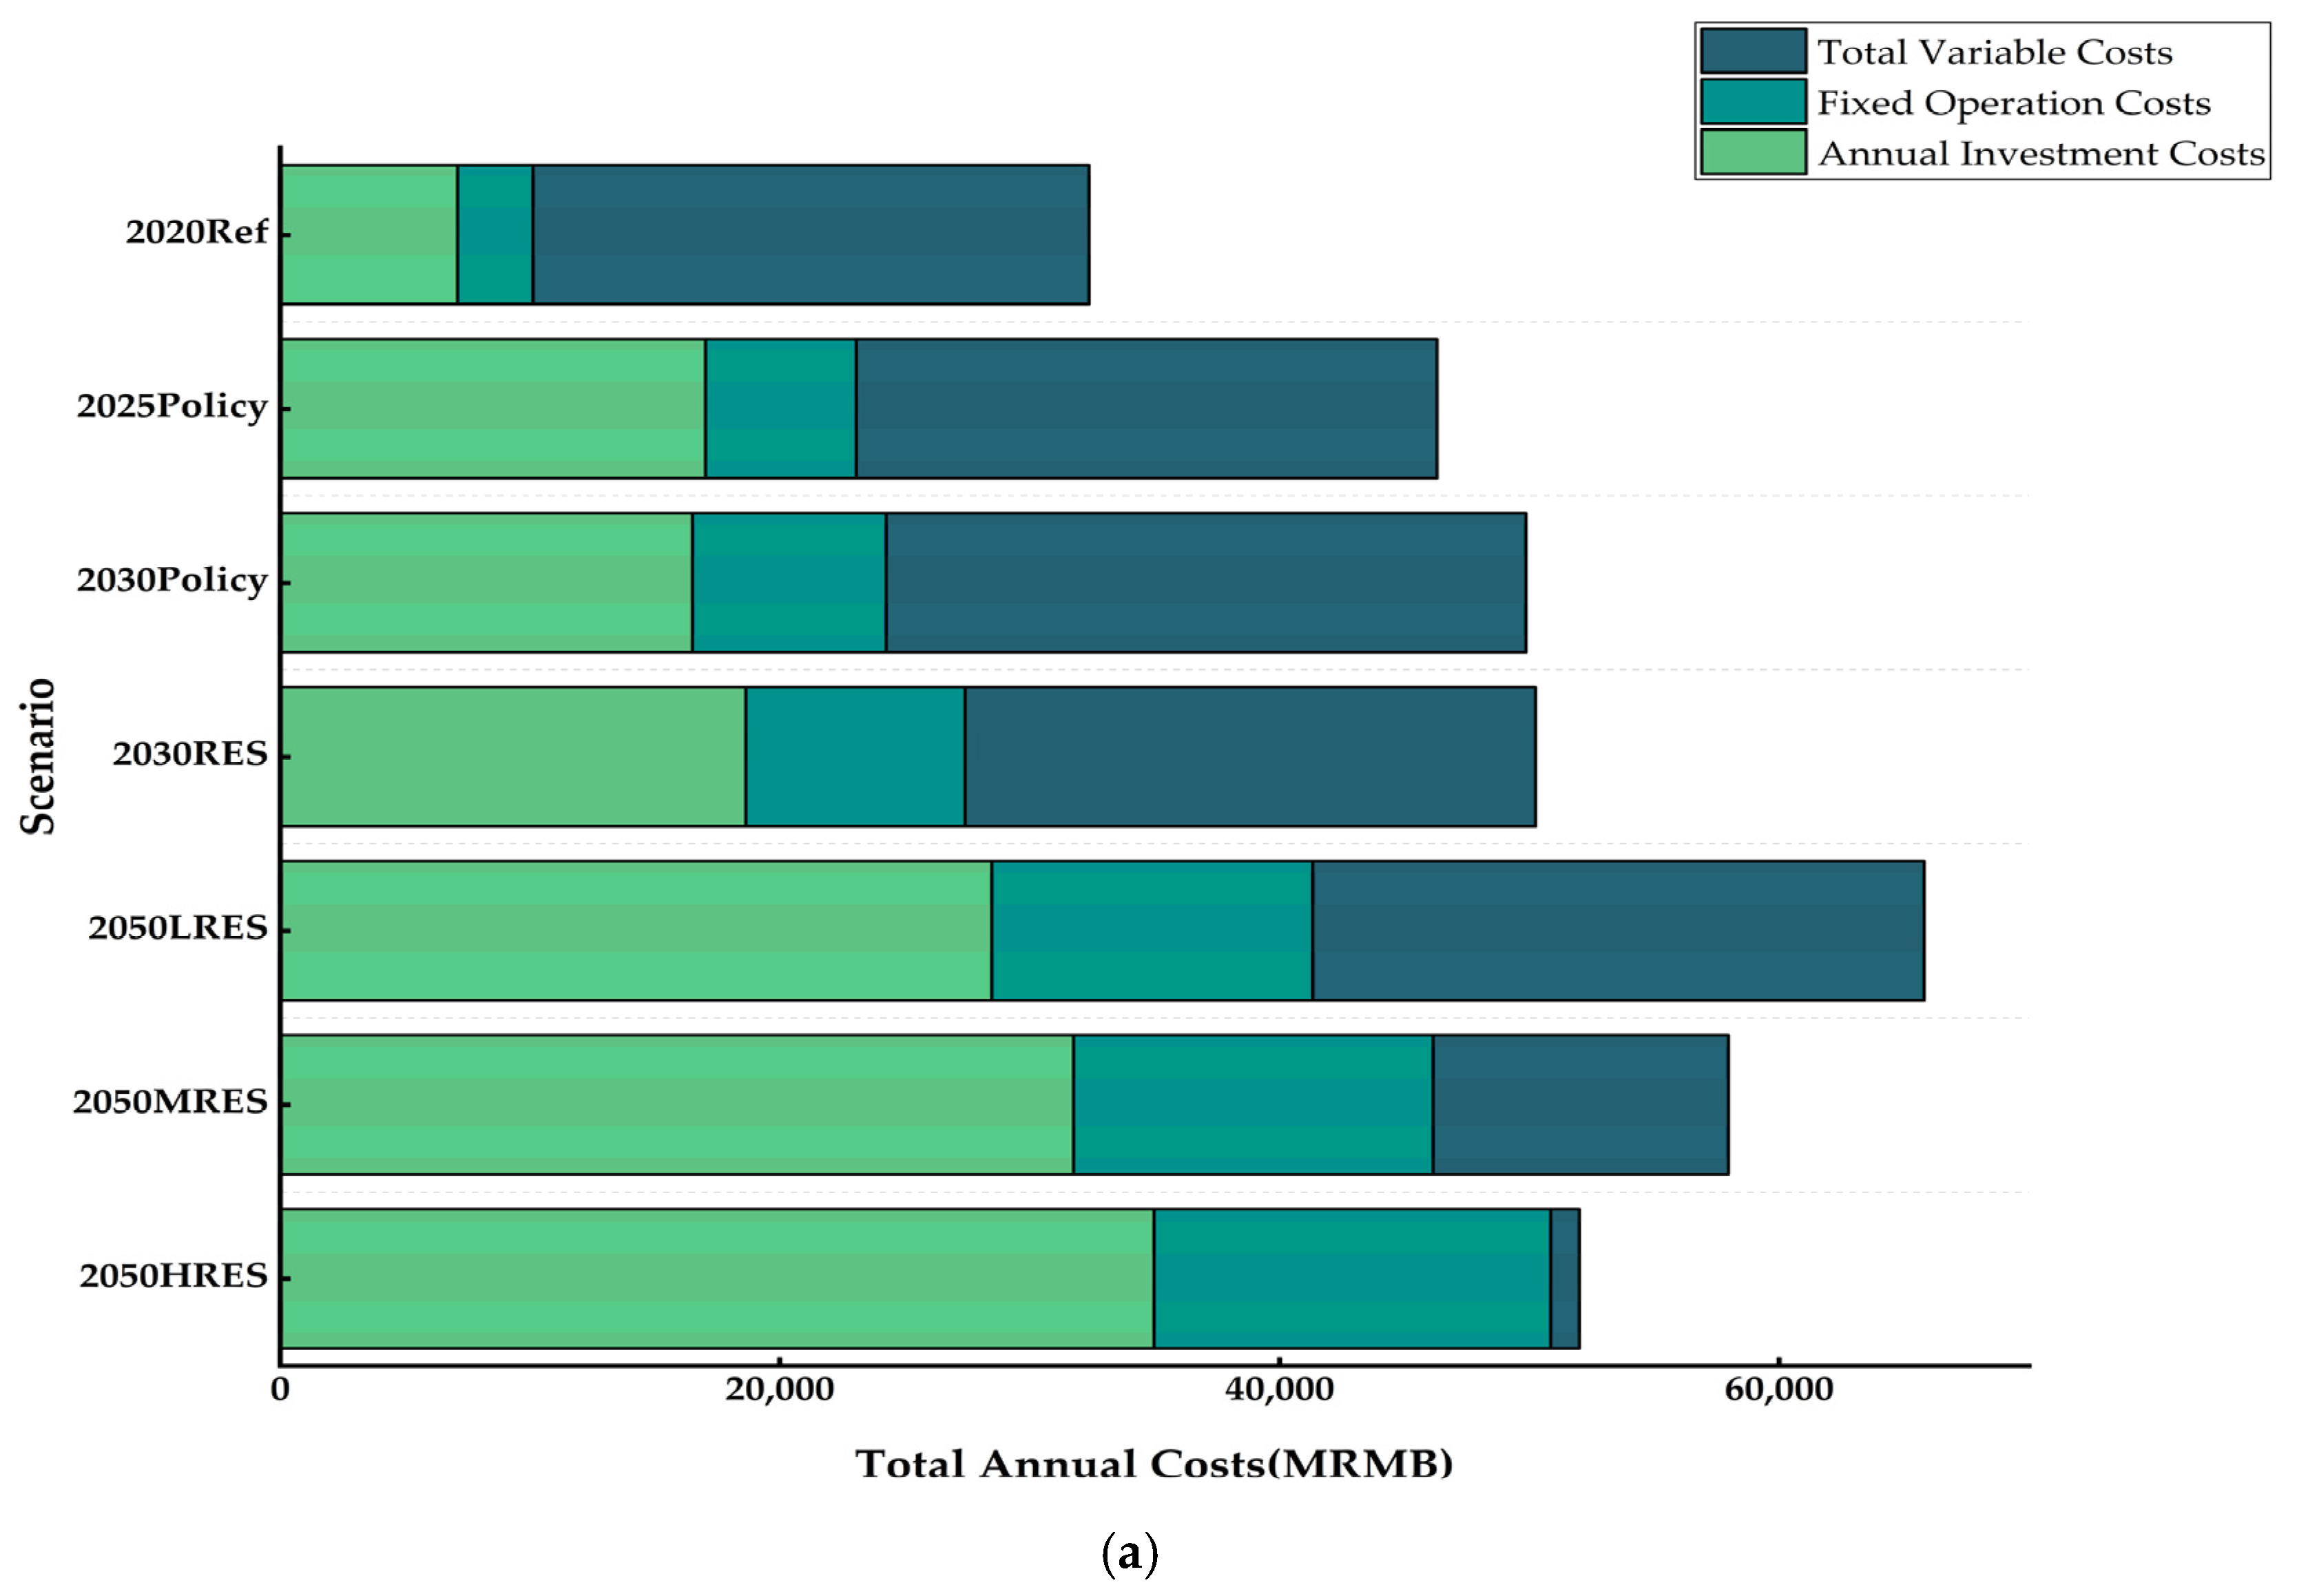
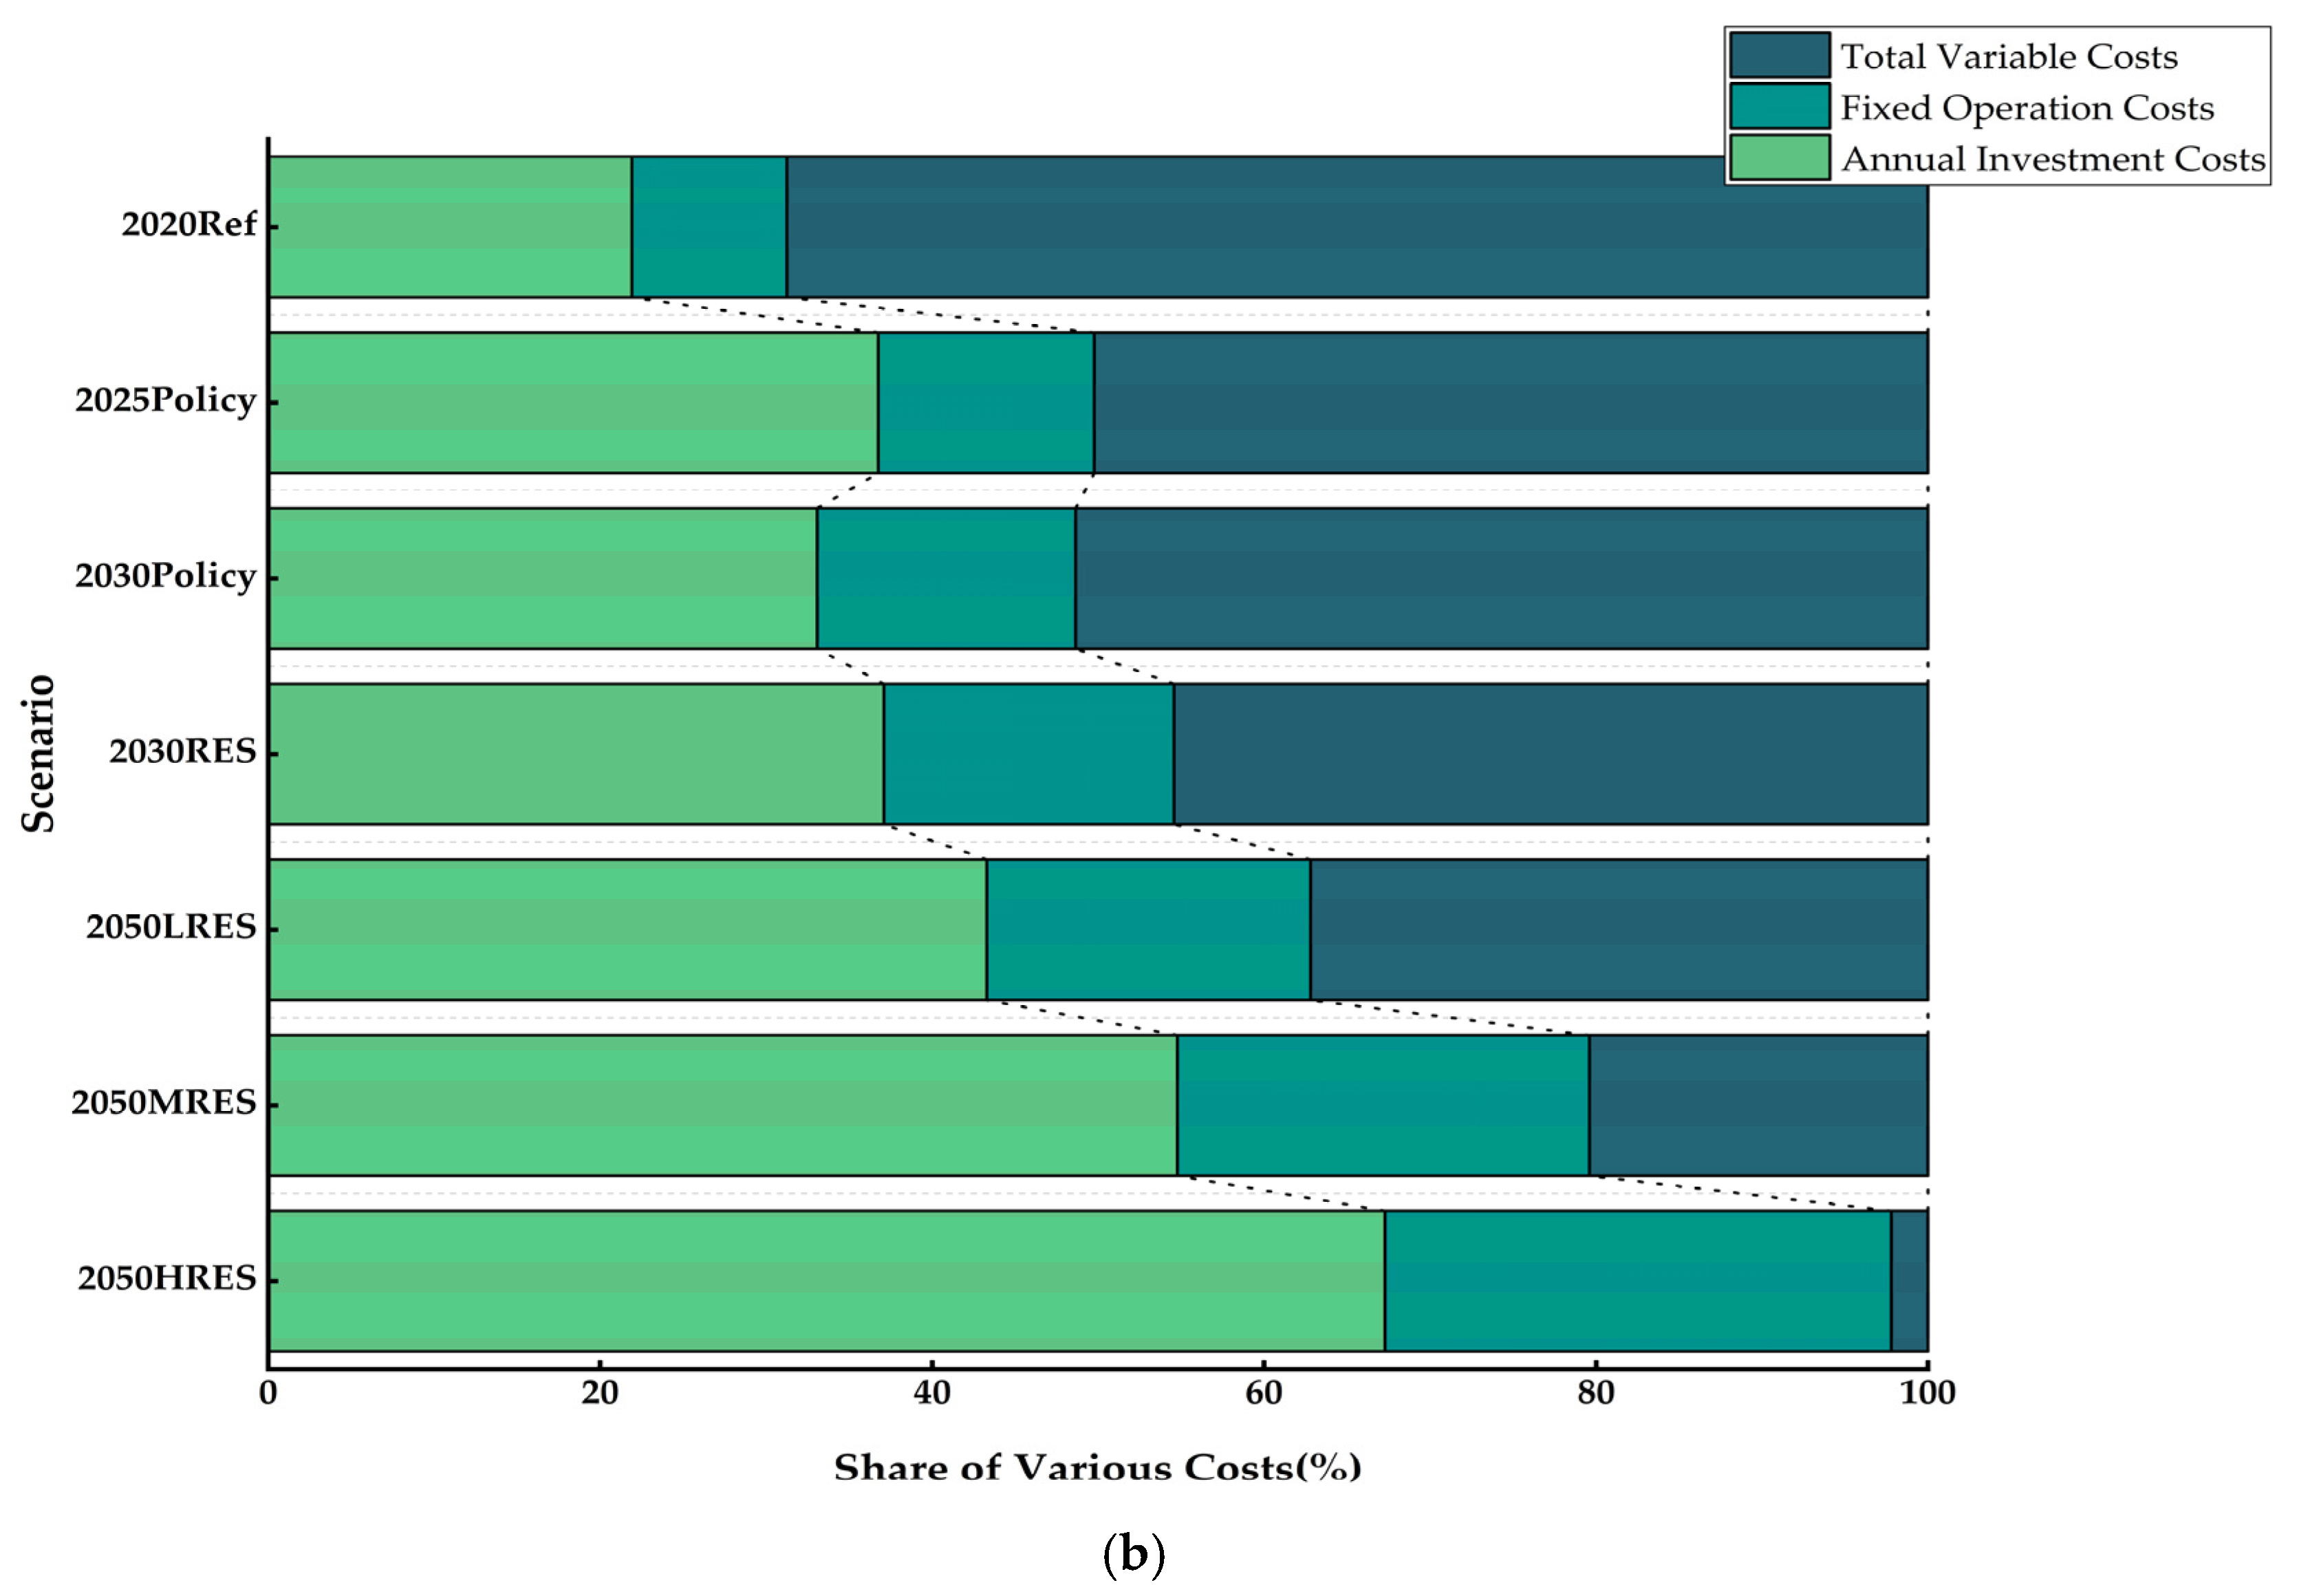
Figure 6 depicts the total annual costs under different scenarios. The total annual costs are divided into three categories: total variable costs (Total variable costs = Total fuel and Ngas exchange + Total Ngas exchange costs + Marginal operation costs + Total electricity exchange + Total CO2 emission costs), fixed operation costs, and annual investment costs.
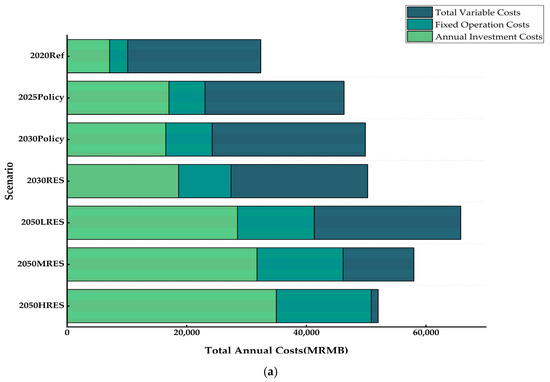
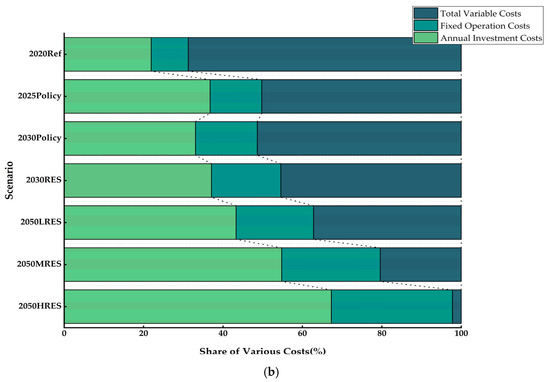
Figure 6.
(a) The detailed simulation results of the energy system’s total annual costs in the seven scenarios. (b) Changes in the share of each category in the seven scenarios.
It should be highlighted that the reference and future scenarios exhibit considerable variations in their respective cost structures. Primarily due to higher fuel consumption and CO2 emission costs, the total variable costs, accounting for 69%, are the primary factors in the reference scenario. Conversely, the substantial development of clean energy in future scenarios leads to a lower share of fossil fuel consumption and a modest increase in total variable costs, resulting in an overall decreasing trend from 2020 to 2050 and even being profitable in the 2050HRES scenario, as electricity exports generate significant revenue for the energy system.
The annual investment costs will be the dominant factor in future scenarios because quantities of clean energy power plants, such as nuclear, wind, PV, and hydro, will be built to meet the “dual-carbon” target. Furthermore, the majority of the costs of these technologies will be incurred during the construction stage. As a result, the investment costs will be relatively high, while the variable costs of these technologies are insignificant due to the fuel nearly being free.
For the same reason, the wages of staff used to maintain the operation of these power plants and the depreciation and maintenance costs of power generation equipment will also increase, leading to an increase in fixed operation costs. Table 8 displays cost data from the EnergyPLAN used in this study. Advancements in technology will lead to a continued decline in the unit investment cost of clean energy in the future. Solar photovoltaic energy is emerging as one of the primary sources of energy in the future due to its affordability as a new source of electricity. Onshore wind power technology is also a well-established, commercialized low-cost alternative that can be easily scaled up. Its investment cost is comparable to that of solar photovoltaic. While offshore wind power technology has seen significant progress and maturity in recent years, its investment cost is relatively high, akin to dammed hydro and pumped storage power stations. Nevertheless, the unit investment cost of photovoltaic and wind power will be lower than that of existing coal or gas-fired power plants, and the advantages of renewable energy will become increasingly significant over time.
Currently, energy investment sources in developing regions are predominantly supported by public funds, but there is a growing need to attract more private capital. The transition to clean energy requires significant levels of both equity and debt financing, with a shift towards a debt-biased investment structure [70,71].
With the reduction of traditional thermal power input and the enhancement of clean substitution of fossil energy, the total annual costs decrease in the 2050HRES scenario compared with the other two 2050 scenarios.

Table 8.
Costs of energy investment and fixed O&M for renewable technologies and nuclear plants in 2030 and 2050 [72].
Table 8.
Costs of energy investment and fixed O&M for renewable technologies and nuclear plants in 2030 and 2050 [72].
| Type | Unit | 2030 | 2050 | ||||
|---|---|---|---|---|---|---|---|
| Investment [MCNY/unit] | Period [Years] | O&M [% of Inv.] | Investment [MCNY/unit] | Period [Years] | O&M [% of Inv.] | ||
| Wind | MWe | 1.00 | 25 | 2.59 | 0.90 | 30 | 2.88 |
| Wind offshore | MWe | 2.43 | 25 | 2.94 | 2.12 | 40 | 3.22 |
| Photovoltaic | MWe | 0.82 | 40 | 1.00 | 0.69 | 30 | 1 |
| Tidal Power | MW | 5.33 | 20 | 3.66 | 5.33 | 20 | 3.66 |
| Dammed Hydro power | MWe | 3.3 | 50 | 2.00 | 3.3 | 50 | 2 |
| PHES | 7.5 | 50 | 1.5 | 7.5 | 50 | 1.5 | |
| Nuclear | MWe | 3.595 | 30 | 2.49 | 3.02 | 30 | 1.96 |
| Interconnection | MW | 1.2 | 40 | 1 | 1.2 | 40 | 1 |
| Waste CHP | TWh/year | 215.6 | 20 | 7.40 | 215.6 | 20 | 7.4 |
| Large CHP units | MWe | 0.81 | 25 | 3.66 | 0.79 | 25 | 3.8 |
| BioPetrol Plant | MW | 0.58 | 20 | 7.7 | 0.44 | 20 | 7.7 |
| Electrolyser | MWe | 0.35 | 15 | 3 | 0.28 | 15 | 3 |
3.2. Energy Consumption and Carbon Emission
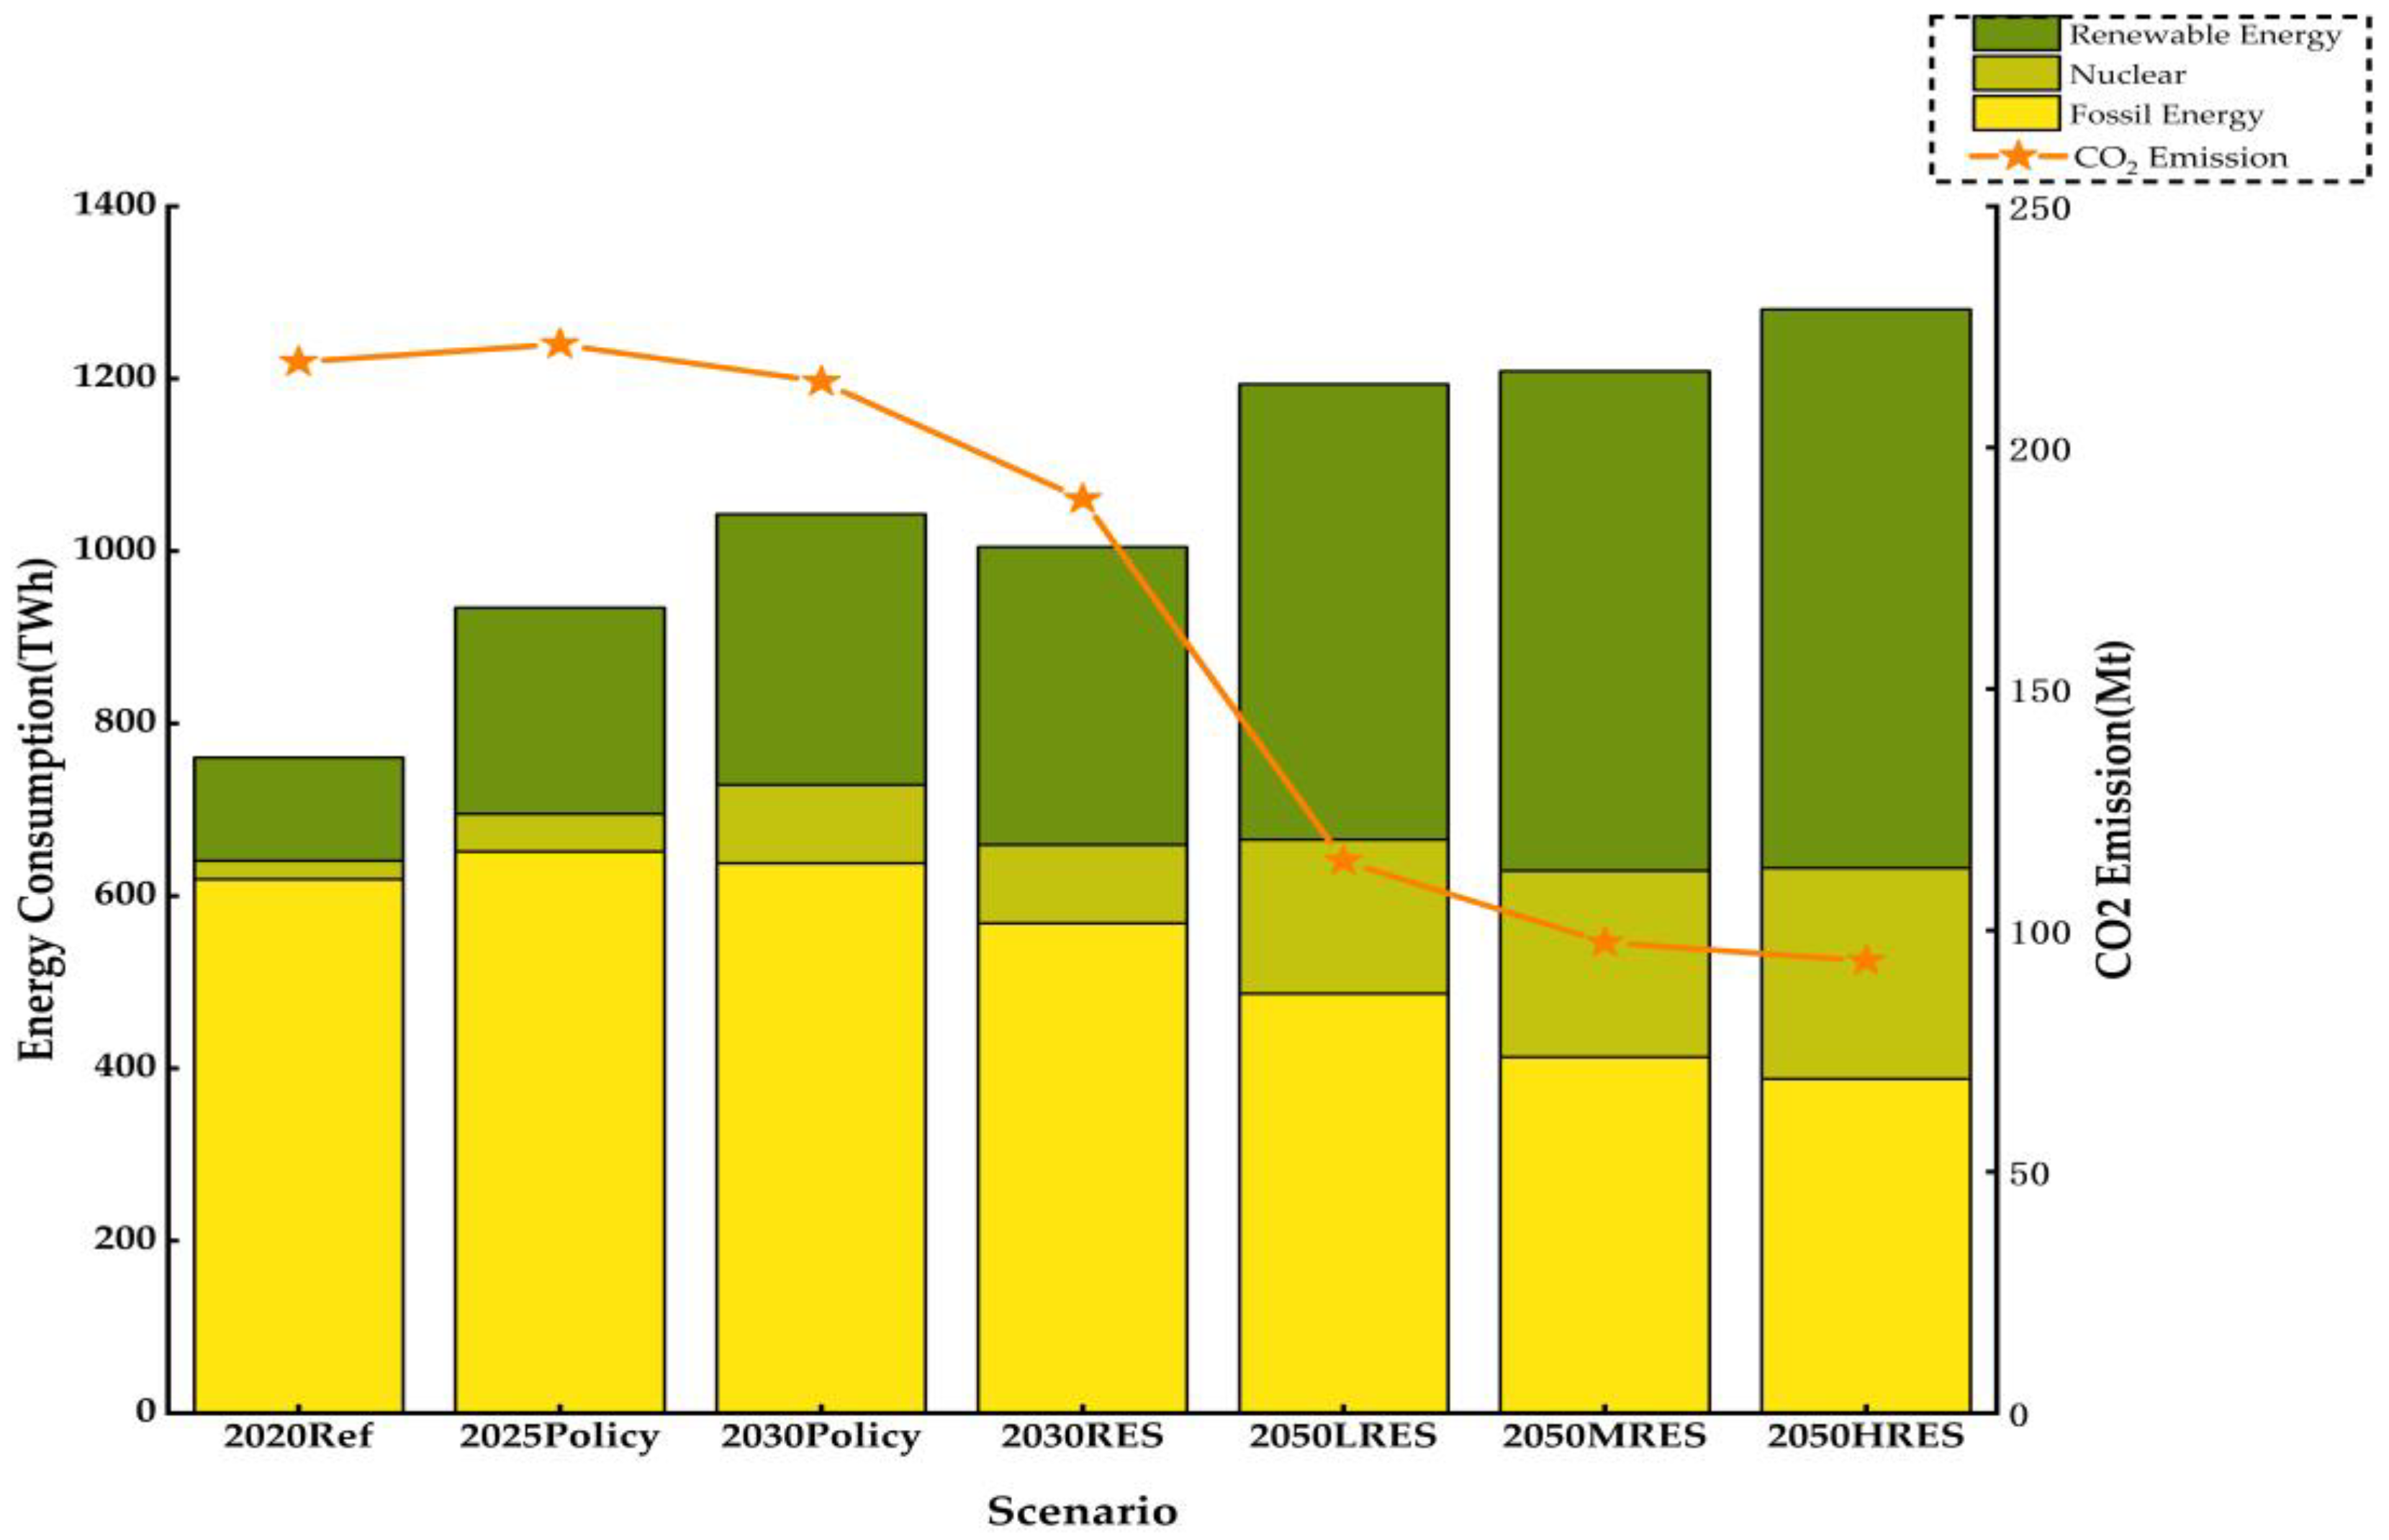
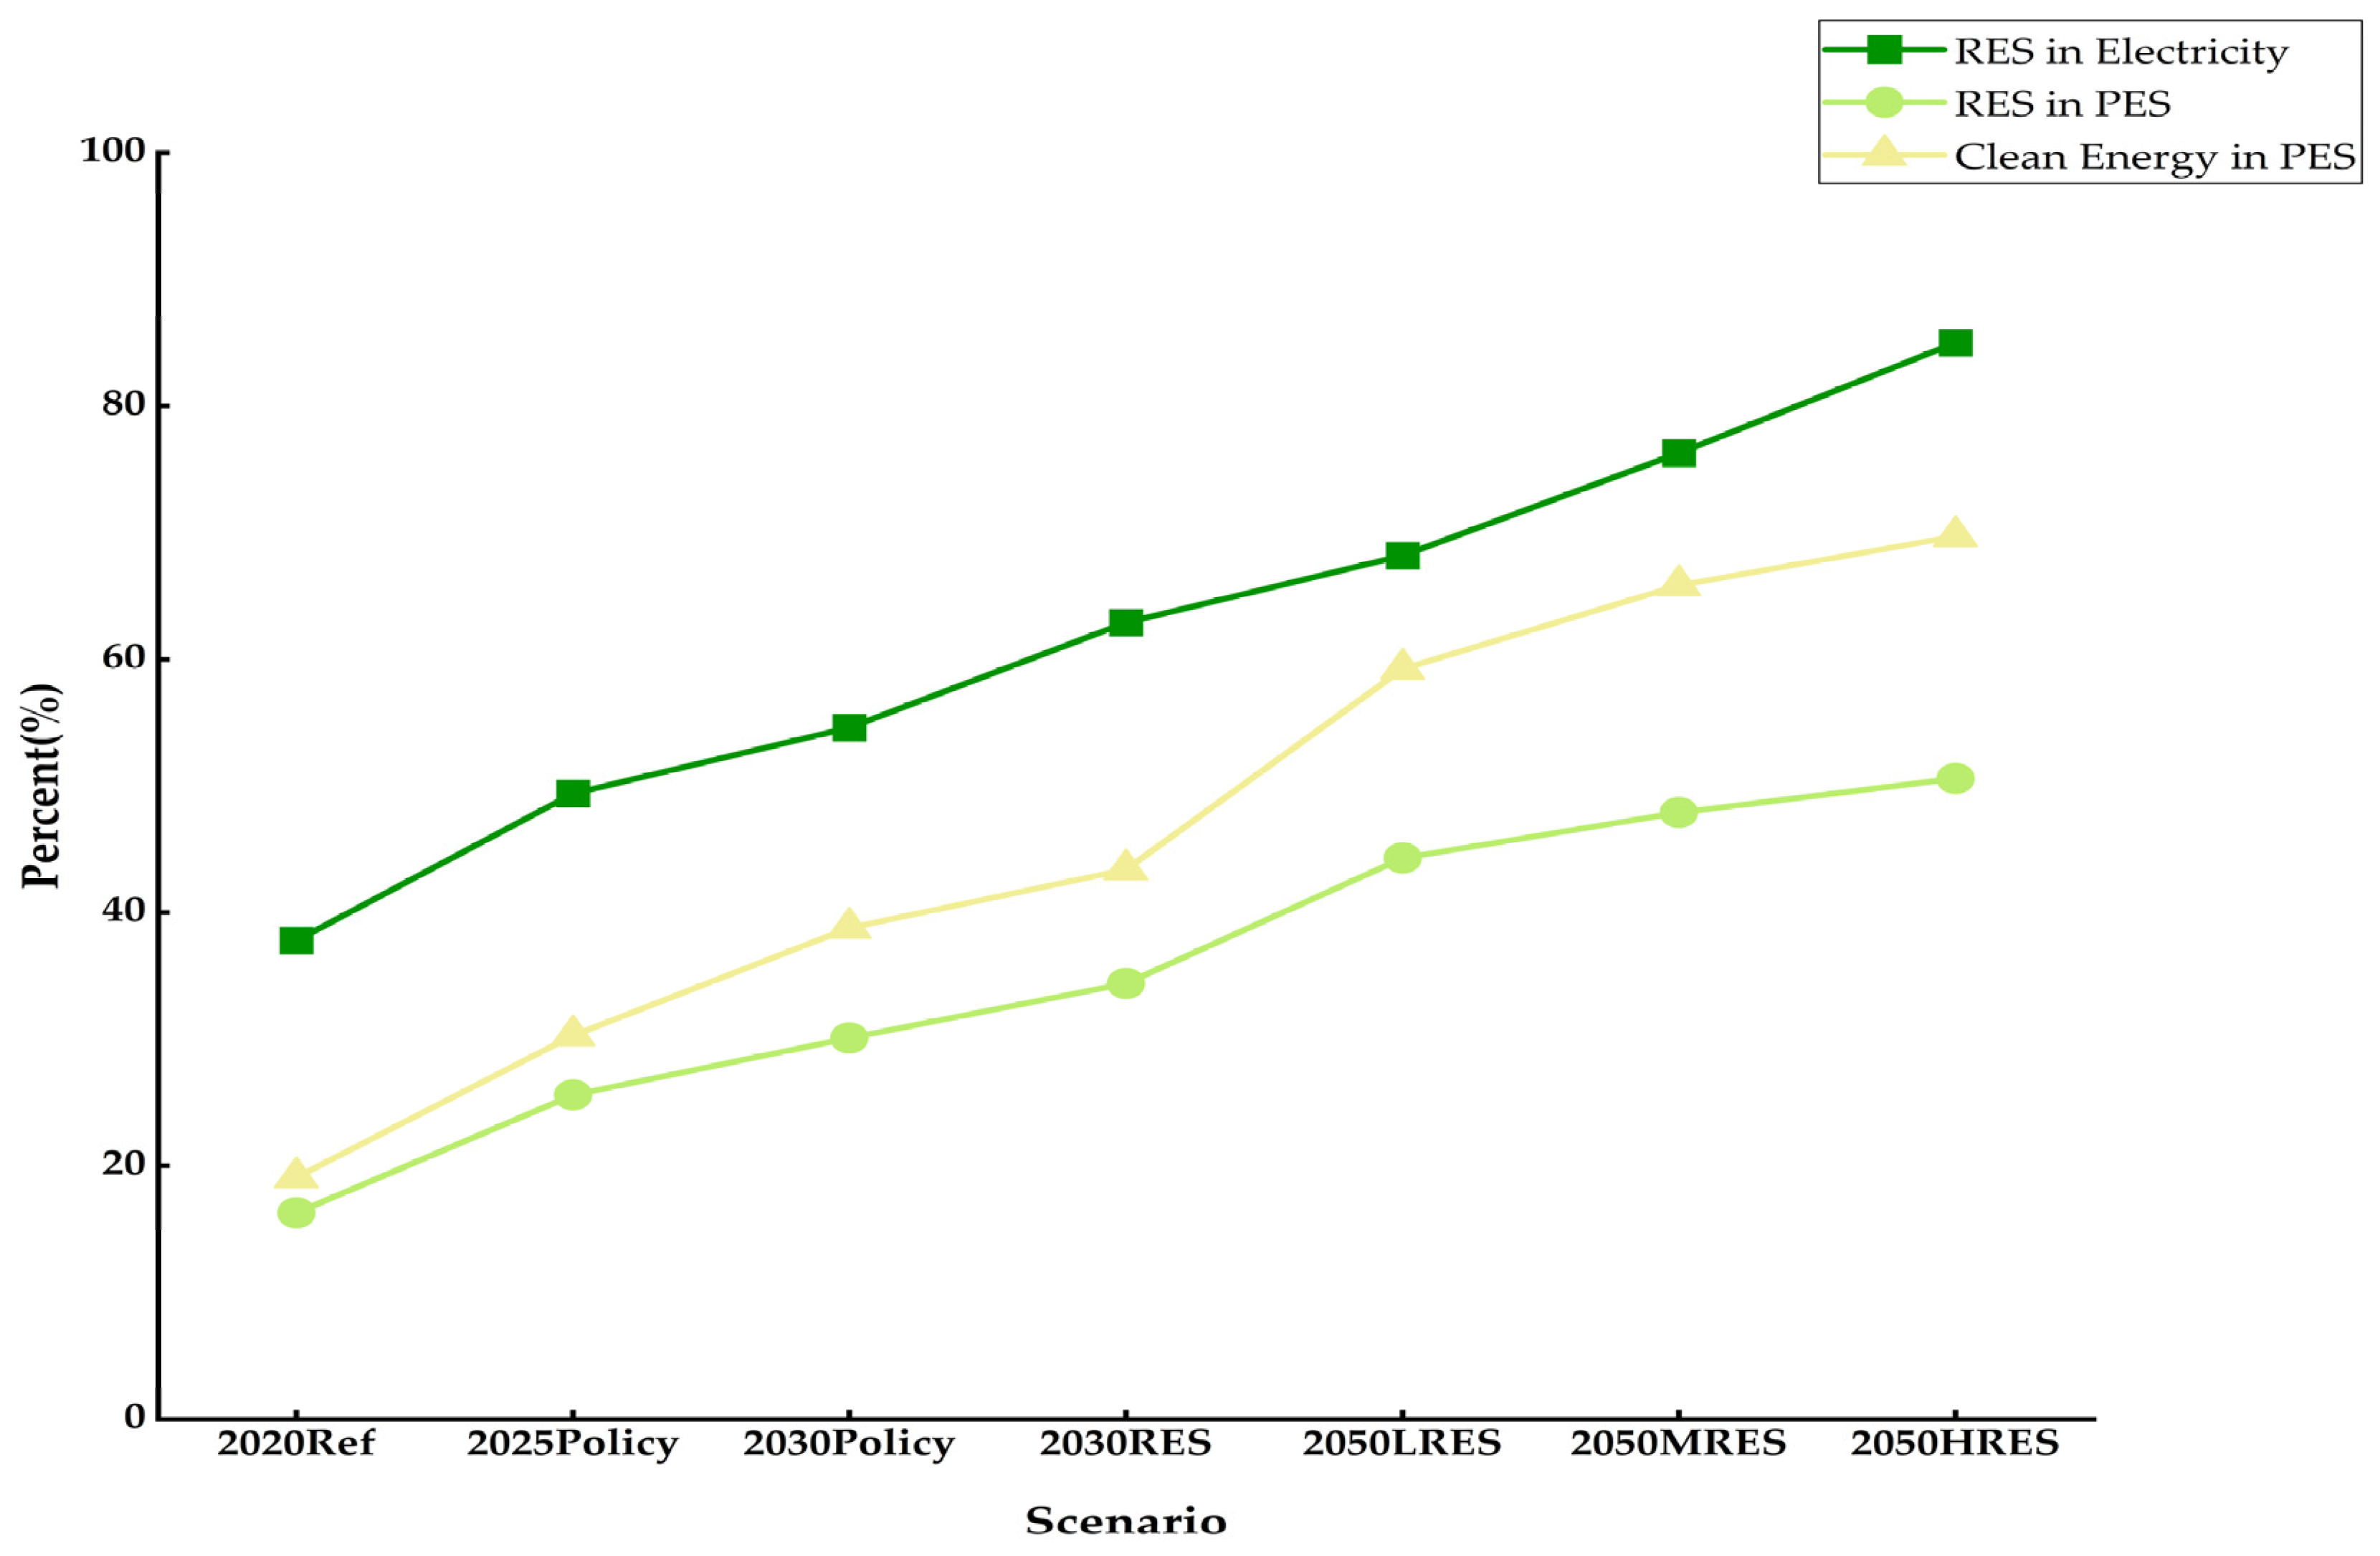
Figure 7 shows the evolution of primary energy consumption and CO2 emissions under seven scenarios. From 2020 to 2050, the government will vigorously promote the development and utilization of nuclear and renewable energy represented by wind–photovoltaic in power systems, as well as energy conservation and emission reduction policies in heat, transportation, and industry sectors. Therefore, the proportion of non-fossil energy consumption is expected to reach 30% in 2025 and about 40% in 2030, as shown in Figure 8. The results align with or even exceed the development levels planned by the government. After reaching its peak between 2025 and 2030, carbon emissions will begin to fall substantially. Despite a 62% increase in primary energy consumption, the 2050HRES Scenario can achieve a maximum reduction in carbon emissions of 57% compared with the 2020Ref Scenario. While the relevant policies and the adjustment of the fuel structure adopted by the government have facilitated the development of the energy structure towards a low-carbon direction, the limitations of technological upgrading and energy structure improvement will still result in a large amount of carbon dioxide production from fossil energy consumption in the industrial and transportation sectors. Nonetheless, the proportion of renewable and clean energy consumption is projected to increase from 16% and 20% in 2020 to a maximum of about 50% and 70% by 2050. As China has not yet established a comprehensive statistical accounting system for carbon emissions [73], this paper uses the carbon emission factors from the Chinese and Danish models in the EnergyPLAN website [74,75], as detailed in Table 9.
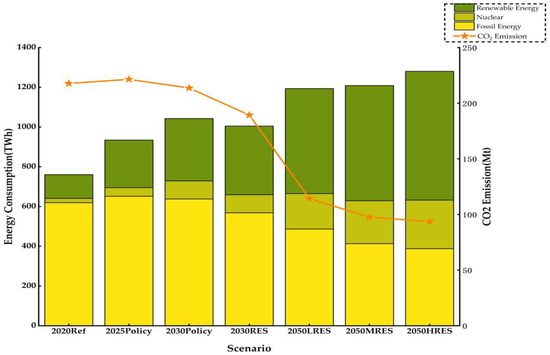
Figure 7.
Total primary energy consumption and their carbon emissions.
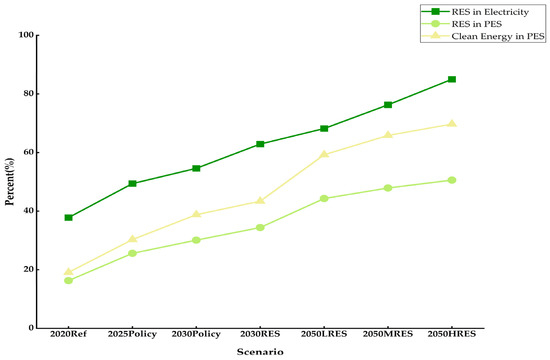
Figure 8.
RES and clean energy share in the seven scenarios.

Table 9.
CO2 emission factors for different fuels.
3.3. Installed Capacity
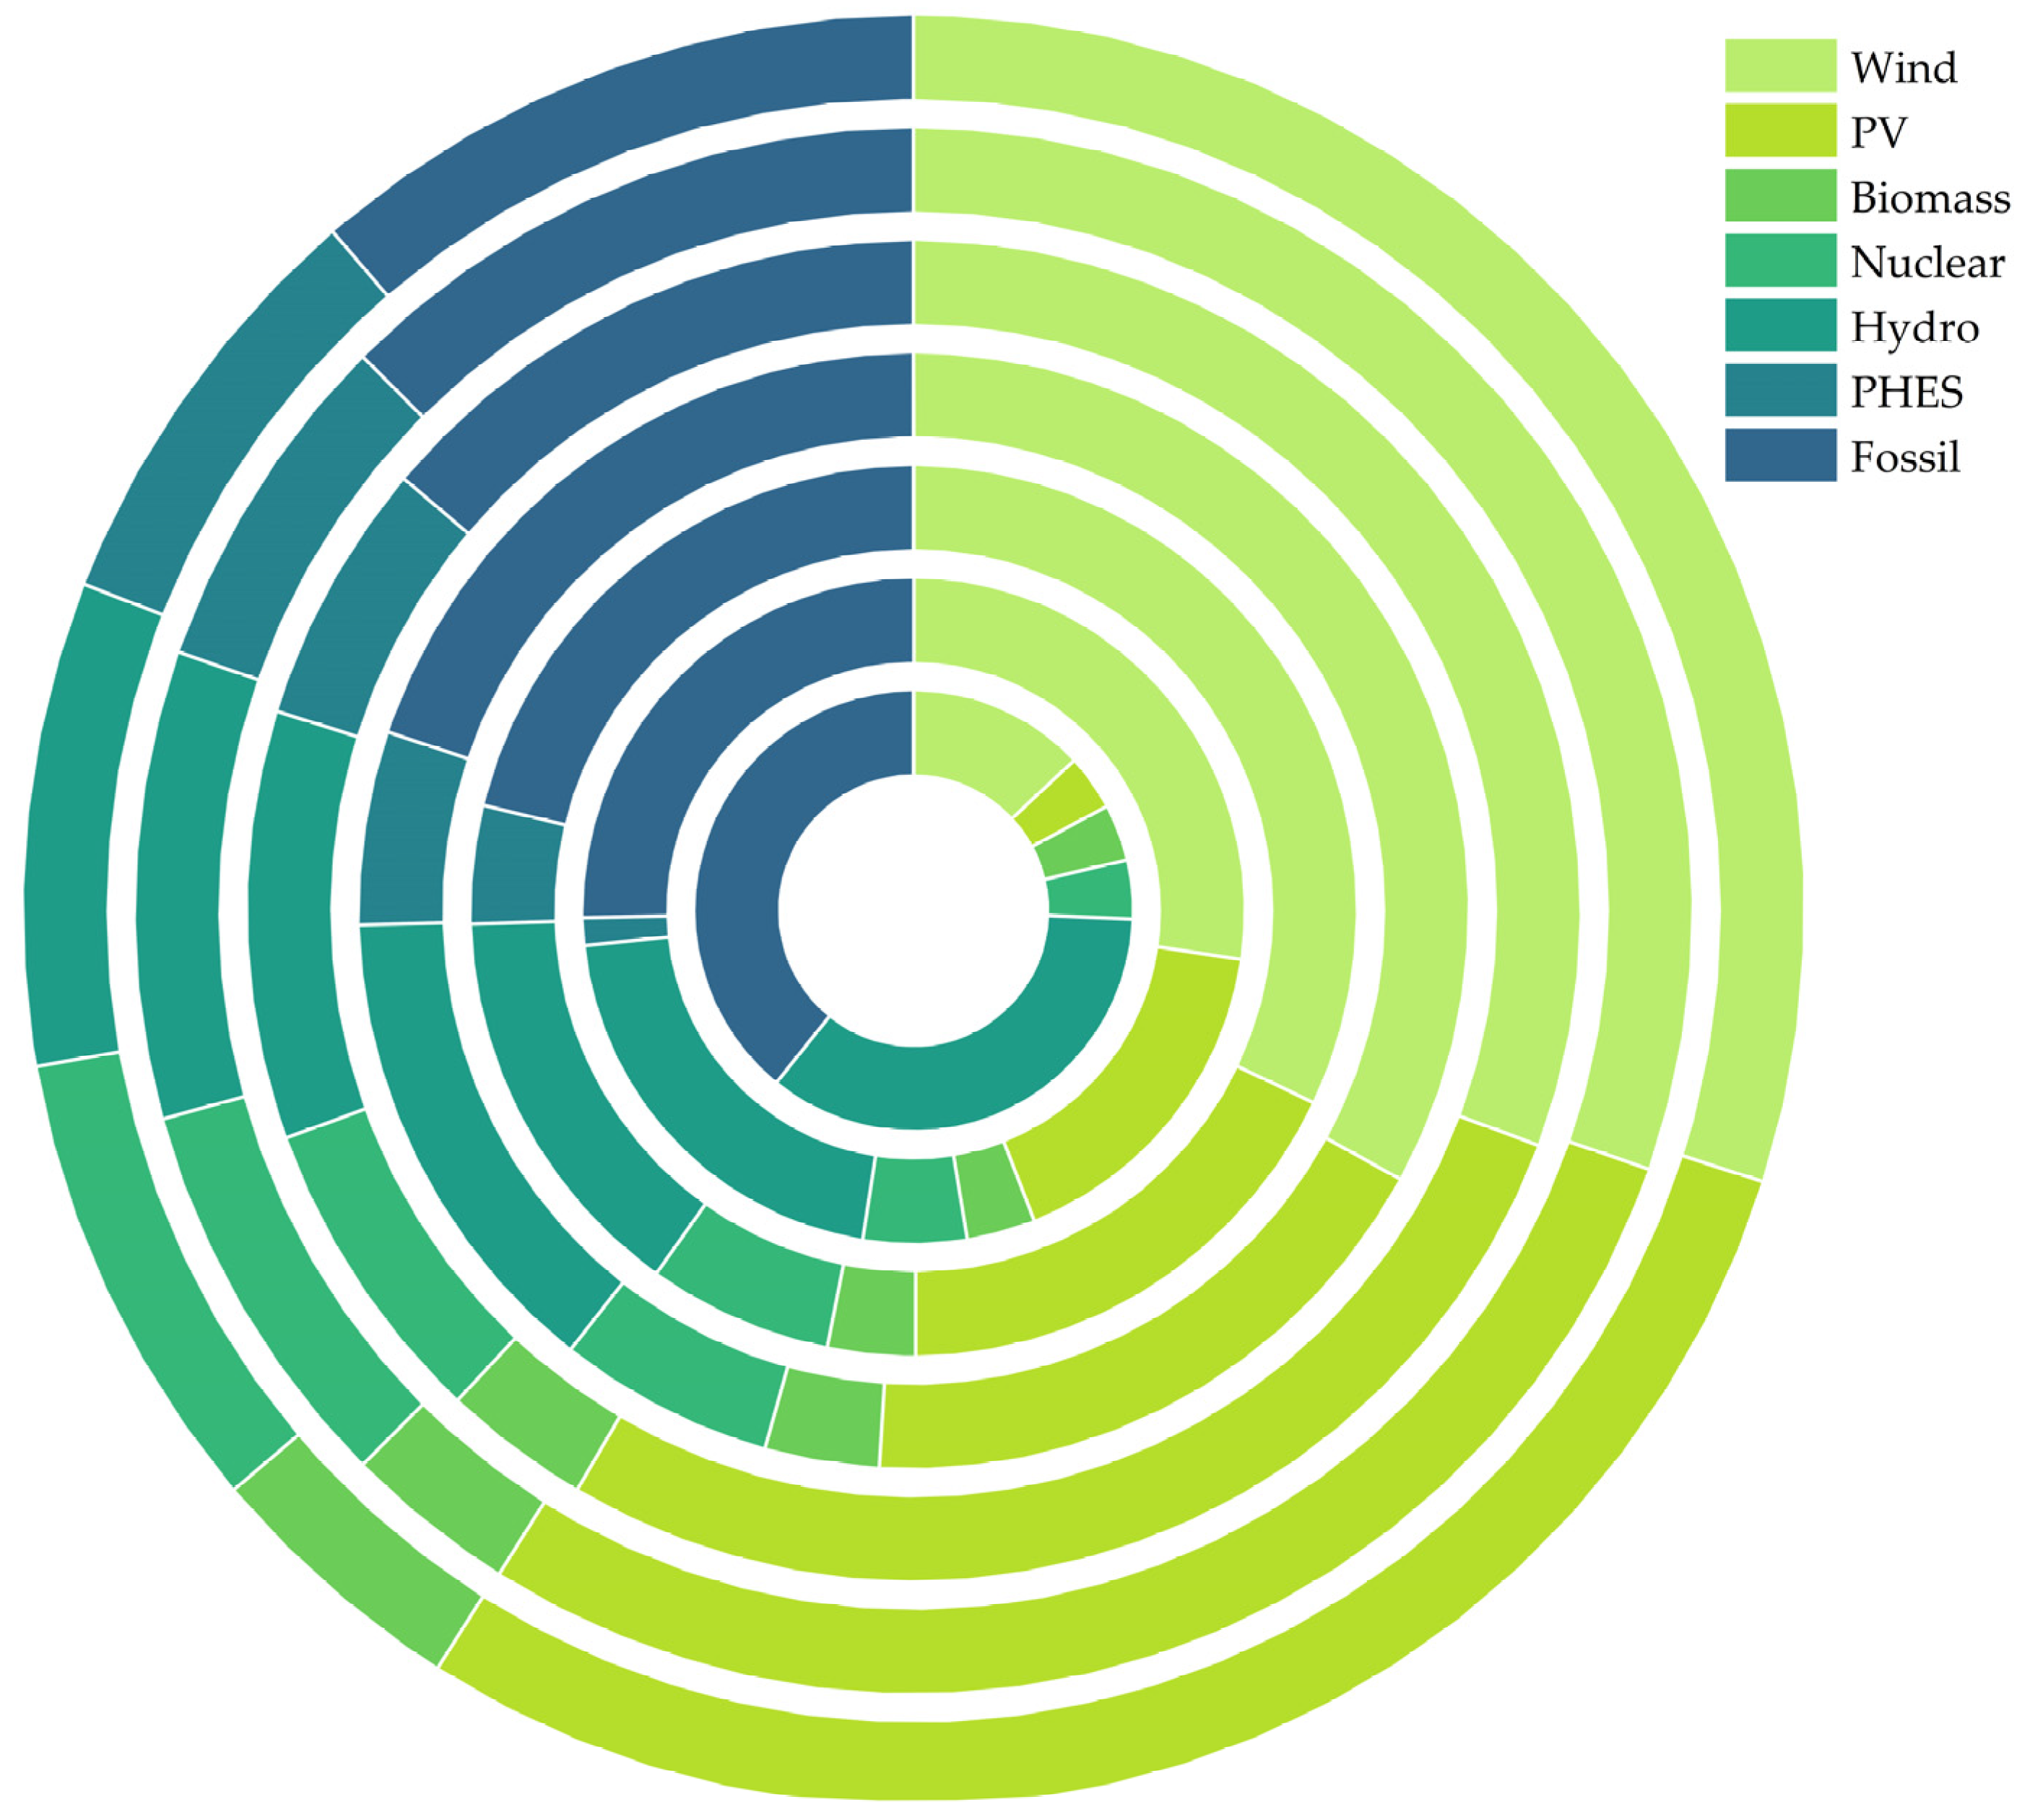
The share of fossil fuel power plants is expected to decrease significantly in Guangxi due to their harmful effects on the environment and the government’s policy to reduce the average power supply coal consumption of thermal power units year by year. As can be seen from Figure 9, along with the shutdown of small coal power plants and the transformation of the energy structure of large thermal power plants, traditional thermal power plants will be replaced by clean energy power plants, and the share of installed fossil energy capacity will decline from 2020 to 2050, with the overall proportion decreasing by a maximum of 28%.
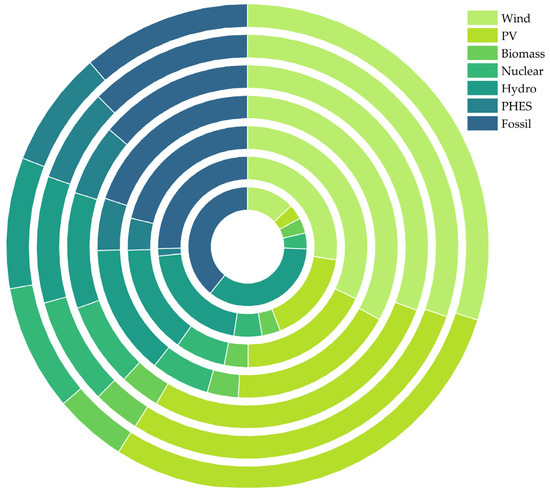
Figure 9.
The proportion of various power generation installed capacity (The rings from inner to outer are 2020Ref, 2025Policy, 2030Policy, 2030RES, 2050LRES, 2050MRES, and 2050HRES.)
To offset the environmental drawbacks of thermal power plants, clean energy generation techniques such as photovoltaic and wind power will be extensively utilized. By 2050, these two sources are expected to account for 30% and 33% of all installed capacity, respectively, marking a significant increase in the share of solar and wind power generation. Run-of-river hydropower plants will be constructed in Guangxi until 2030 when they reach their limit. After that, hydropower development will focus on pumped storage power plants that provide energy storage, frequency regulation, and peak regulation functions. Despite this shift, thermal power plants will still be needed for peaking and grid stability regulation.
Moreover, biomass power generation has emerged as a promising clean energy source that can provide more space for other renewable energy sources to be consumed, while generating electricity in an eco-friendly way. In EnergyPLAN, biomass as a clean energy source produces much less CO2 than fossil energy, so developing biomass represented by agricultural and forestry biomass and domestic waste power generation as environmentally preferable alternatives to traditional coal-fired and gas-fired power plants is feasible.
4. Conclusions
This paper utilizes the EnergyPLAN software to examine the prospective energy system of Guangxi. Firstly, to showcase the energy modeling capabilities of EnergyPLAN, a reference scenario for Guangxi is created using official yearbook data from 2020. Subsequently, a short-term scenario (2025Policy) is formulated to examine the growth of Guangxi’s energy system during the 14th Five-Year Plan. Additionally, two mid-term scenarios (2030Policy and 2030RES) are created, indicating that Guangxi is projected to achieve its carbon emission peak between 2025 and 2030. Finally, three long-term scenarios are suggested for Guangxi’s energy system for 2050. With the help of the EnergyPLAN software, the seven above scenarios are analyzed and compared in terms of the total annual costs, carbon emissions, energy consumption, and the installed capacity of the power system.
The results reveal that (1) the reference model results are almost consistent with the official statistical values for 2020 with the help of EnergyPLAN. Coal is the principal power generation source, and electricity must be imported from neighboring provinces during peak consumption periods. Fossil energy dominates the industrial and transportation sectors, and renewable energy consumption only accounts for 16% of primary energy consumption. (2) Guangxi’s carbon emissions will peak between 2025 and 2030, along with energy demand in the industrial sectors. The proportion of thermal power is expected to decrease gradually, and power production will be able to meet social electricity demand and begin to export power. The proportion of non-fossil energy consumption will reach 30% in 2025 and about 40% in 2030, meeting or exceeding the requirements of government documents. The first batch of new technologies, such as pumped-storage hydroelectricity and centralized energy storage, will be constructed and utilized. (3) Despite primary energy consumption increasing by 62% compared with the 2020 simulation results, carbon emissions are reduced by a maximum of 57% in three development scenarios for 2050, represented by wind, nuclear, and PV, with renewable and clean energy consumption accounting for up to 50% and 70% of primary energy consumption, respectively. The existence of coal-fired thermal power plants in the power system for peak regulation and ensuring its stability, as well as the consumption of coal and oil in the industrial and transportation sectors, account for the continued existence of a certain level of carbon emissions in 2050.
In the future, Guangxi’s energy system will heavily depend on clean energy sources. The goal of achieving an energy system with more than 70% clean energy by 2050 is not only achievable, but also can be further reinforced through practical and detailed policy support, making it feasible to attain the objective of carbon neutrality and an energy system with over 80% clean energy by 2060. Future research should concentrate on renewable energy consumption; clean energy decommissioning material recycling; and the decarbonization of the heat, transportation, and industrial sectors, especially the electrification of these sectors.
Author Contributions
Conceptualization, L.Y.; methodology, Y.L.; software, Y.L. and T.L.; validation, Y.L.; formal analysis, Y.L.; writing—original draft, Y.L. and T.L.; writing—review and editing, Y.L. and T.L. All authors have read and agreed to the published version of the manuscript.
Funding
This research received no external funding.
Data Availability Statement
The data that support the findings of this study are available from the corresponding author.
Conflicts of Interest
The authors declare no conflict of interest.
References
- Schleussner, C.-F.; Rogelj, J.; Schaeffer, M.; Lissner, T.; Licker, R.; Fischer, E.M.; Knutti, R.; Levermann, A.; Frieler, K.; Hare, W. Science and policy characteristics of the Paris Agreement temperature goal. Nat. Clim. Chang. 2016, 6, 827–835. [Google Scholar] [CrossRef]
- Hong, J.; Gu, J.; He, R.; Wang, X.; Shen, Q. Unfolding the spatial spillover effects of urbanization on interregional energy connectivity: Evidence from province-level data. Energy 2020, 196, 116990. [Google Scholar] [CrossRef]
- Yu, X.; Wang, B.; Wang, W.; Guo, X.; Han, J.; Chen, X. Analysis of renewable resources in Central China under the “double carbon” strategy. Energy Rep. 2022, 8, 361–373. [Google Scholar] [CrossRef]
- Chen, X.; Liu, Y.; Wang, Q.; Lv, J.; Wen, J.; Chen, X.; Kang, C.; Cheng, S.; McElroy, M.B. Pathway toward carbon-neutral electrical systems in China by mid-century with negative CO2 abatement costs informed by high-resolution modeling. Joule 2021, 5, 2715–2741. [Google Scholar] [CrossRef]
- Vaccaro, R.; Rocco, M.V. Quantifying the impact of low carbon transition scenarios at regional level through soft-linked energy and economy models: The case of South-Tyrol Province in Italy. Energy 2021, 220, 119742. [Google Scholar] [CrossRef]
- Li, K.; Tan, X.; Yan, Y.; Jiang, D.; Qi, S. Directing energy transition toward decarbonization: The China story. Energy 2022, 261, 124934. [Google Scholar] [CrossRef]
- Development and Reform Commission of Guangxi Zhuang Autonomous Region. Guangxi’s 14th Five-Year Plan for Renewable Energy Development. Available online: https://doifgw.gxzf.gov.cn/zfxxgkzl/wjzx/tzgg/t11995952.shtml (accessed on 15 November 2022).
- Guangxi Zhuang Autonomous Region People’s Government. Implementation Opinions on the Complete and Accurate Implementation of the New Development Concept to Do a Good Job in Carbon Dumping and Carbon Neutral Work. Available online: https://doiwww.tanpaifang.com/zhengcefagui/2022/051686153.html (accessed on 20 February 2023).
- Herbst, A.; Toro, F.; Reitze, F.; Jochem, E. Introduction to Energy Systems Modelling. Swiss J. Econ. Stat. 2012, 148, 111–135. [Google Scholar] [CrossRef]
- Zhang, Y.; Qi, L.; Lin, X.; Pan, H.; Sharp, B. Synergistic effect of carbon ETS and carbon tax under China’s peak emission target: A dynamic CGE analysis. Sci. Total Environ. 2022, 825, 154076. [Google Scholar] [CrossRef]
- Jiang, T.; Yu, Y.; Jahanger, A.; Balsalobre-Lorente, D. Structural emissions reduction of China’s power and heating industry under the goal of “double carbon”: A perspective from input-output analysis. Sustain. Prod. Consump. 2022, 31, 346–356. [Google Scholar] [CrossRef]
- Lund, H.; Münster, E.; Tambjerg, L.H. EnergyPLAN: Computer Model for Energy System Analysis; Version 6; Technology, Environment and Society, Department of Development and Planning, Aalborg University: Aalborg, Denmark, 2015. [Google Scholar]
- Østergaard, P.A.; Lund, H.; Thellufsen, J.Z.; Sorknæs, P.; Mathiesen, B.V. Review and validation of EnergyPLAN. Renew. Sustain. Energy Rev. 2022, 168, 112724. [Google Scholar] [CrossRef]
- Hansen, K.; Mathiesen, B.V.; Skov, I.R. Full energy system transition towards 100% renewable energy in Germany in 2050. Renew. Sustain. Energy Rev. 2019, 102, 1–13. [Google Scholar] [CrossRef]
- Lund, H.; Mathiesen, B.V. Energy system analysis of 100% renewable energy systems—The case of Denmark in years 2030 and 2050. Energy 2009, 34, 524–531. [Google Scholar] [CrossRef]
- Connolly, D.; Lund, H.; Mathiesen, B.V.; Leahy, M. The first step towards a 100% renewable energy-system for Ireland. Appl. Energy 2011, 88, 502–507. [Google Scholar] [CrossRef]
- Ćosić, B.; Krajačić, G.; Duić, N. A 100% renewable energy system in the year 2050: The case of Macedonia. Energy 2012, 48, 80–87. [Google Scholar] [CrossRef]
- Adun, H.; Ishaku, H.P.; Jazayeri, M.; Dagbasi, M.; Olusola, B.; Okoye, T.; Dike, G.C. Decarbonization of EU energy sector: Techno-feasibility analysis of 100% renewables by 2050 in Cyprus. Clean Technol. Environ. Policy 2022, 24, 2801–2824. [Google Scholar] [CrossRef]
- Okonkwo, E.C.; Wole-Osho, I.; Bamisile, O.; Abid, M.; Al-Ansari, T. Grid integration of renewable energy in Qatar: Potentials and limitations. Energy 2021, 235, 121310. [Google Scholar] [CrossRef]
- Bamisile, O.; Huang, Q.; Xu, X.; Hu, W.; Liu, W.; Liu, Z.; Chen, Z. An approach for sustainable energy planning towards 100% electrification of Nigeria by 2030. Energy 2020, 197, 117172. [Google Scholar] [CrossRef]
- Edoo, M.N.; Ah King, R.T.F. New insights into the technical challenges of the Mauritius long term energy strategy. Energy 2020, 195, 116975. [Google Scholar] [CrossRef]
- Laha, P.; Chakraborty, B. Low carbon electricity system for India in 2030 based on multi-objective multi-criteria assessment. Renew. Sustain. Energy Rev. 2021, 135, 110356. [Google Scholar] [CrossRef]
- Connolly, D.; Lund, H.; Mathiesen, B.V. Smart Energy Europe: The technical and economic impact of one potential 100% renewable energy scenario for the European Union. Renew. Sustain. Energy Rev. 2016, 60, 1634–1653. [Google Scholar] [CrossRef]
- Sáfián, F. Modelling the Hungarian energy system—The first step towards sustainable energy planning. Energy 2014, 69, 58–66. [Google Scholar] [CrossRef]
- Novosel, T.; Ćosić, B.; Krajačić, G.; Duić, N.; Pukšec, T.; Mohsen, M.S.; Ashhab, M.S.; Ababneh, A.K. The influence of reverse osmosis desalination in a combination with pump storage on the penetration of wind and PV energy: A case study for Jordan. Energy 2014, 76, 73–81. [Google Scholar] [CrossRef]
- Hasterok, D.; Castro, R.; Landrat, M.; Pikoń, K.; Doepfert, M.; Morais, H. Polish Energy Transition 2040: Energy Mix Optimization Using Grey Wolf Optimizer. Energies 2021, 14, 501. [Google Scholar] [CrossRef]
- Arévalo, P.; Cano, A.; Jurado, F. Mitigation of carbon footprint with 100% renewable energy system by 2050: The case of Galapagos islands. Energy 2022, 245, 123247. [Google Scholar] [CrossRef]
- Alves, M.; Segurado, R.; Costa, M. On the road to 100% renewable energy systems in isolated islands. Energy 2020, 198, 117321. [Google Scholar] [CrossRef]
- Cabrera, P.; Lund, H.; Carta, J.A. Smart renewable energy penetration strategies on islands: The case of Gran Canaria. Energy 2018, 162, 421–443. [Google Scholar] [CrossRef]
- Stančin, H.; Pfeifer, A.; Perakis, C.; Stefanatos, N.; Damasiotis, M.; Magaudda, S.; Di Pietrantonio, F.; Mikulčić, H. Blue Energy Spearheading the Energy Transition: The Case of Crete. Front. Energy Res. 2022, 10, 868334. [Google Scholar] [CrossRef]
- Marczinkowski, H.M.; Barros, L. Technical Approaches and Institutional Alignment to 100% Renewable Energy System Transition of Madeira Island—Electrification, Smart Energy and the Required Flexible Market Conditions. Energies 2020, 13, 4434. [Google Scholar] [CrossRef]
- Zhou, W.; Hagos, D.A.; Stikbakke, S.; Huang, L.; Cheng, X.; Onstein, E. Assessment of the impacts of different policy instruments on achieving the deep decarbonization targets of island energy systems in Norway—The case of Hinnøya. Energy 2022, 246, 123249. [Google Scholar] [CrossRef]
- Yuan, M.; Thellufsen, J.Z.; Lund, H.; Liang, Y. The first feasible step towards clean heating transition in urban agglomeration: A case study of Beijing-Tianjin-Hebei region. Energy Conv. Manag. 2020, 223, 113282. [Google Scholar] [CrossRef]
- Zhao, G.; Guerrero, J.M.; Jiang, K.; Chen, S. Energy modelling towards low carbon development of Beijing in 2030. Energy 2017, 121, 107–113. [Google Scholar] [CrossRef]
- Icaza, D.; Borge-Diez, D.; Galindo, S.P. Proposal of 100% renewable energy production for the City of Cuenca—Ecuador by 2050. Ren. Energy 2021, 170, 1324–1341. [Google Scholar] [CrossRef]
- Prina, M.G.; Moser, D.; Vaccaro, R.; Sparber, W. EPLANopt optimization model based on EnergyPLAN applied at regional level: The future competition on excess electricity production from renewables. Int. J. Sustain. Energy Plan. Manag. 2020, 27, 35–50. [Google Scholar] [CrossRef]
- Thellufsen, J.Z.; Lund, H.; Sorknæs, P.; Østergaard, P.A.; Chang, M.; Drysdale, D.; Nielsen, S.; Djørup, S.R.; Sperling, K. Smart energy cities in a 100% renewable energy context. Renew. Sustain. Energy Rev. 2020, 129, 109922. [Google Scholar] [CrossRef]
- Yuan, M.; Sorknæs, P.; Lund, H.; Liang, Y. The bidding strategies of large-scale battery storage in 100% renewable smart energy systems. Appl. Energy 2022, 326, 119960. [Google Scholar] [CrossRef]
- Pupo-Roncallo, O.; Campillo, J.; Ingham, D.; Ma, L.; Pourkashanian, M. The role of energy storage and cross-border interconnections for increasing the flexibility of future power systems: The case of Colombia. Smart Energy 2021, 2, 100016. [Google Scholar] [CrossRef]
- Korberg, A.D.; Skov, I.R.; Mathiesen, B.V. The role of biogas and biogas-derived fuels in a 100% renewable energy system in Denmark. Energy 2020, 199, 117426. [Google Scholar] [CrossRef]
- Yuan, M.; Thellufsen, J.Z.; Sorknæs, P.; Lund, H.; Liang, Y. District heating in 100% renewable energy systems: Combining industrial excess heat and heat pumps. Energy Conv. Manag. 2021, 244, 114527. [Google Scholar] [CrossRef]
- Pastore, L.M.; Lo Basso, G.; Ricciardi, G.; de Santoli, L. Synergies between Power-to-Heat and Power-to-Gas in renewable energy communities. Ren. Energy 2022, 198, 1383–1397. [Google Scholar] [CrossRef]
- Alnaqbi, S.A.; Alasad, S.; Aljaghoub, H.; Alami, A.H.; Abdelkareem, M.A.; Olabi, A.G. Applicability of Hydropower Generation and Pumped Hydro Energy Storage in the Middle East and North Africa. Energies 2022, 15, 2412. [Google Scholar] [CrossRef]
- Liu, W.; Best, F.; Crijns-Graus, W. Exploring the pathways towards a sustainable heating system—A case study of Utrecht in the Netherlands. J. Clean. Prod. 2021, 280, 125036. [Google Scholar] [CrossRef]
- Bartolini, A.; Comodi, G.; Salvi, D.; Østergaard, P.A. Renewables self-consumption potential in districts with high penetration of electric vehicles. Energy 2020, 213, 118653. [Google Scholar] [CrossRef]
- Østergaard, P.A. Regulation strategies of cogeneration of heat and power (CHP) plants and electricity transit in Denmark. Energy 2010, 35, 2194–2202. [Google Scholar] [CrossRef]
- Chen, M.; Lund, H.; Rosendahl, L.A.; Condra, T.J. Energy efficiency analysis and impact evaluation of the application of thermoelectric power cycle to today’s CHP systems. Appl. Energy 2010, 87, 1231–1238. [Google Scholar] [CrossRef]
- Kany, M.S.; Mathiesen, B.V.; Skov, I.R.; Korberg, A.D.; Thellufsen, J.Z.; Lund, H.; Sorknæs, P.; Chang, M. Energy efficient decarbonisation strategy for the Danish transport sector by 2045. Smart Energy 2022, 5, 100063. [Google Scholar] [CrossRef]
- Luo, S.; Hu, W.; Liu, W.; Zhang, Z.; Bai, C.; Huang, Q.; Chen, Z. Study on the decarbonization in China’s power sector under the background of carbon neutrality by 2060. Renew. Sustain. Energy Rev. 2022, 166, 112618. [Google Scholar] [CrossRef]
- Yuan, M.; Thellufsen, J.Z.; Lund, H.; Liang, Y. The electrification of transportation in energy transition. Energy 2021, 236, 121564. [Google Scholar] [CrossRef]
- Zeng, X.; Chen, G.; Luo, S.; Teng, Y.; Zhang, Z.; Zhu, T. Renewable transition in the power and transport sectors under the goal of carbon-neutral in Sichuan, China. Energy Rep. 2022, 8, 738–748. [Google Scholar] [CrossRef]
- Aalborg University. EnergyPLAN|Advanced Energy Systems Analysis Computer Model. Available online: https://www.energyplan.eu/ (accessed on 15 November 2022).
- Lund, H.; Duić, N.; Krajačić, G.; Graça Carvalho, M.d. Two energy system analysis models: A comparison of methodologies and results. Energy 2007, 32, 948–954. [Google Scholar] [CrossRef]
- Connolly, D.; Lund, H.; Mathiesen, B.V.; Leahy, M. A review of computer tools for analysing the integration of renewable energy into various energy systems. Appl. Energy 2010, 87, 1059–1082. [Google Scholar] [CrossRef]
- Østergaard, P.A. Reviewing EnergyPLAN simulations and performance indicator applications in EnergyPLAN simulations. Appl. Energy 2015, 154, 921–933. [Google Scholar] [CrossRef]
- Lund, H.; Thellufsen, J.Z. EnergyPLAN—Advanced Energy Systems Analysis Computer Model; Version 15.1; Zenodo: Genève, Switzerland, 2020. [Google Scholar] [CrossRef]
- The State Council Information Office of the People’s Republic of China. Introduction to Guangxi Zhuang Autonomous Region. Available online: https://doiwww.gov.cn/guoqing/2019-01/28/content_5361677.htm (accessed on 15 November 2022).
- The World Bank, Solar Resource Data: Solargis. China Global Horizontal Irradiation. Available online: https://solargis.com/cn (accessed on 20 November 2022).
- Technical University of Denmark. Global Wind Atlas Online Application Website (v.3.1). Available online: https://globalwindatlas.info (accessed on 20 November 2022).
- Guangxi Zhuang Autonomous Region People’s Government. The 14th Five-Year Plan for Energy Development in Guangxi. Available online: https://doiwww.gxzf.gov.cn/zfwj/zzqrmzfbgtwj_34828/2022ngzbwj/t13026864.shtml (accessed on 15 November 2022).
- National Bureau of Statistics. China Energy Statistical Yearbook 2021; China Statistics Press: Beijing, China, 2022.
- Statistics Bureau of Guangxi Zhuang Autonomous Region; Guangxi Survey Team of National Bureau of Statistics. Guangxi Statistical Yearbook 2021; China Statistics Press: Beijing, China, 2021.
- Department of Urban Socioeconomic Survey; National Bureau of Statistics. China City Statistical Yearbook 2020; China Statistics Press: Beijing, China, 2021.
- Guangxi Development and Reform Commission. Electricity Supply and Demand in Guangxi in 2020. Available online: https://doifgw.gxzf.gov.cn/fgsj/dlgx/t10624062.shtml (accessed on 15 November 2022).
- Ministry of Housing and Urban-Rural Development of the People’s Republic of China. China Urban-Rural Construction Statistical Yearbook 2020; China Statistics Press: Beijing, China, 2021.
- China Electricity Council. China Electric Power Statistical Yearbook 2020; China Statistics Press: Beijing, China, 2021. [Google Scholar]
- Guangxi Zhuang Autonomous Region People’s Government. Carbon Peak Implementation Plan in Guangxi Zhuang Autonomous Region. Available online: https://doiwww.gxzf.gov.cn/zfwj/zzqrmzfwj_34845/t15690666.shtml (accessed on 20 February 2023).
- China Nuclear Power Development Center; State Grid Energy Research Institute Co. China’s Nuclear Power Development Planning Study; China Atomic Energy Press: Beijing, China, 2019. [Google Scholar]
- National Energy Administration. Wen Jiabao Briefed on Response to Nuclear Leak at Fukushima Nuclear Power Plant in Japan. Available online: https://doiwww.nea.gov.cn/2011-03/17/c_131089135.htm (accessed on 20 November 2022).
- International Energy Agency. Financing Clean Energy Transitions in Emerging and Developing Economies. Available online: https://iea.blob.core.windows.net/assets/20d99c97-1776-4cfa-984d-d3c9fe43f22a/WEI2021_Financingcleanenergytransitions_ExecutiveSummary_Chinese.pdf (accessed on 4 April 2023).
- International Renewable Energy Agency. World Energy Transitions Outlook 2023: 1.5 °C Pathway; Preview. Available online: https://www.irena.org/Publications/2023/Mar/World-Energy-Transitions-Outlook-2023 (accessed on 4 April 2023).
- Connolly, D. EnergyPLAN Cost Database. Available online: https://www.energyplan.eu/useful_resources/costdatabase/ (accessed on 22 November 2022).
- National Development and Reform Commission; National Bureau of Statistics; Ministry of Ecology and Environment. Implementation Plan on Accelerating the Establishment of a Unified and Standardized Carbon Emission Statistics and Accounting System. Available online: https://www.ndrc.gov.cn/xxgk/zcfb/tz/202208/t20220819_1333231.html (accessed on 4 April 2023).
- Xiong, W. China 2010, 2020 and 2030 Model. Available online: https://www.energyplan.eu/useful_resources/existingcountrymodels/ (accessed on 4 April 2023).
- Vad Mathiesen, B. IDA 2035 and 2050 Models (2018 Update—Version 13.2). Available online: https://www.energyplan.eu/useful_resources/existingcountrymodels/ (accessed on 4 April 2023).
Disclaimer/Publisher’s Note: The statements, opinions and data contained in all publications are solely those of the individual author(s) and contributor(s) and not of MDPI and/or the editor(s). MDPI and/or the editor(s) disclaim responsibility for any injury to people or property resulting from any ideas, methods, instructions or products referred to in the content. |
© 2023 by the authors. Licensee MDPI, Basel, Switzerland. This article is an open access article distributed under the terms and conditions of the Creative Commons Attribution (CC BY) license (https://creativecommons.org/licenses/by/4.0/).

