1. Introduction
Greenhouse gas emission reduction is one of the main challenges countries have to face without further delays in order to control present climate changes. After many efforts, and driven by a growing environmental sensitivity, this topic has recently become fundamental matter of international goals, such as the Sustainable Development Goals of the Agenda 2030, and agreements, such as the Paris one of 2015. The deal ratifies the actual commitment of participating countries to reduce in the next decades, gradually and effectively, their greenhouse gas emission rates in all the pollutant sectors (buildings, transports, industry, waste, etc.). Nowadays, such an agreement is the only mandatory for the subscriber countries that nevertheless linger in the fulfillment of their commitments. In the following, COPs (Conference of Parts) efforts have been made to extend emission reduction commitments, particularly concerning the achievement of carbon neutrality by 2050 and to give up coal. Moreover, due to their difficult economic situation, developing countries are still reluctant to adhere to their implementation within a short timeframe.
In order to reach the goal of the new green deal the reduction measures must involve local authorities. As a matter of fact, since the 12th Conference of the Parties (
COP12), held in Nairobi in 2006, the necessity of sharing the goals of Kyoto Protocol from a national scale to a regional one has been marked as an effective mean to work up successful reduction measures. Nevertheless, so far, no exhaustive acts have clearly stated both the role of local administrations in the achievement of national targets and the burden sharing criteria. In 2008, the European Commission established the
Covenant of Mayors, which asserted the commitment of European cities, regardless their dimensions, to attain the goals of the energy policy of the European Union through the planning of adequate energy efficiency measures and spreading of renewable energy sources. Specifically, the Covenant binds municipal administrations to plan in their territories measures addressing both public and private sectors, particularly the former, and within it, above all, the municipal asset is compelled to assume a leading and model role in the implementation of the planned energy policies. In order to do so, the compilation of a greenhouse gas balance for local territories, assessing emissions and removals taking place in the different pollutant sectors present in their areas, allows for the singling out of both the territory critical issues and its strengths [
1,
2,
3]. Particularly, it provides a useful inventory of emission sources located in the territory, allowing to identify the most pollutant sectors to be subjected to mitigation measures [
4,
5,
6,
7,
8,
9].
An administration exhibiting positive balances points out emissions higher than the absorption capacity of the natural territorial resources, denoting the adoption of conventional growth models, with high environmental impacts [
10,
11,
12]. In contrast, draw or negative balances points out emissions equal to or lower than land absorption capacity, denoting virtuous realities and adoption of sustainable growth models [
13,
14].
For local administrations exhibiting negative balances, a particular opportunity is to trade their environmental credit through
carbon credits, negotiable securities to be launched onto the market, purchasable by CO
2 producers to obtain compliance with the compulsory reduction obligations. If periodically upgraded, the balance allows to monitor emission fluctuations following the adoption of policies for climate and environment protection, changes in land use or in human habits [
15,
16,
17,
18]. Some local administrations have recently voluntarily assessed a GHG balance; most balances were positive.
In this context, as a contribute to a burden sharing policy in Italy, the paper presents the greenhouse gas emission balance elaborated for the municipality of Reggio Calabria, a Southern Italy medium-size town, on the date of 1 January 2020. Currently, it has acceded to the European Union Mayors’ Covenant initiative. The balance has been assessed according to the well-known international methodology proposed by the
Intergovernmental Panel on Climate Change (IPCC), the scientific forum that studies the global warming and the effects of climate changes on the earth,
IPCC Guidelines for National Greenhouse Gas Inventories [
19], which presently represents the most accredited international methodology for greenhouse gas inventories. The elaborated balance allowed us to identify the most pollutant activities and sectors requiring mitigation measures, particularly, pollutant resulted activities making large uses of energy [
20], i.e., the building and the transport sectors, for which specific interventions have been proposed, together with a specific compensation measure. Through this paper, the effectiveness of each adopted measure has been simulated in order to quantify its real effectiveness and their global effect on the balance assessed on the 1 January 2030 scenario.
2. The IPCC Method
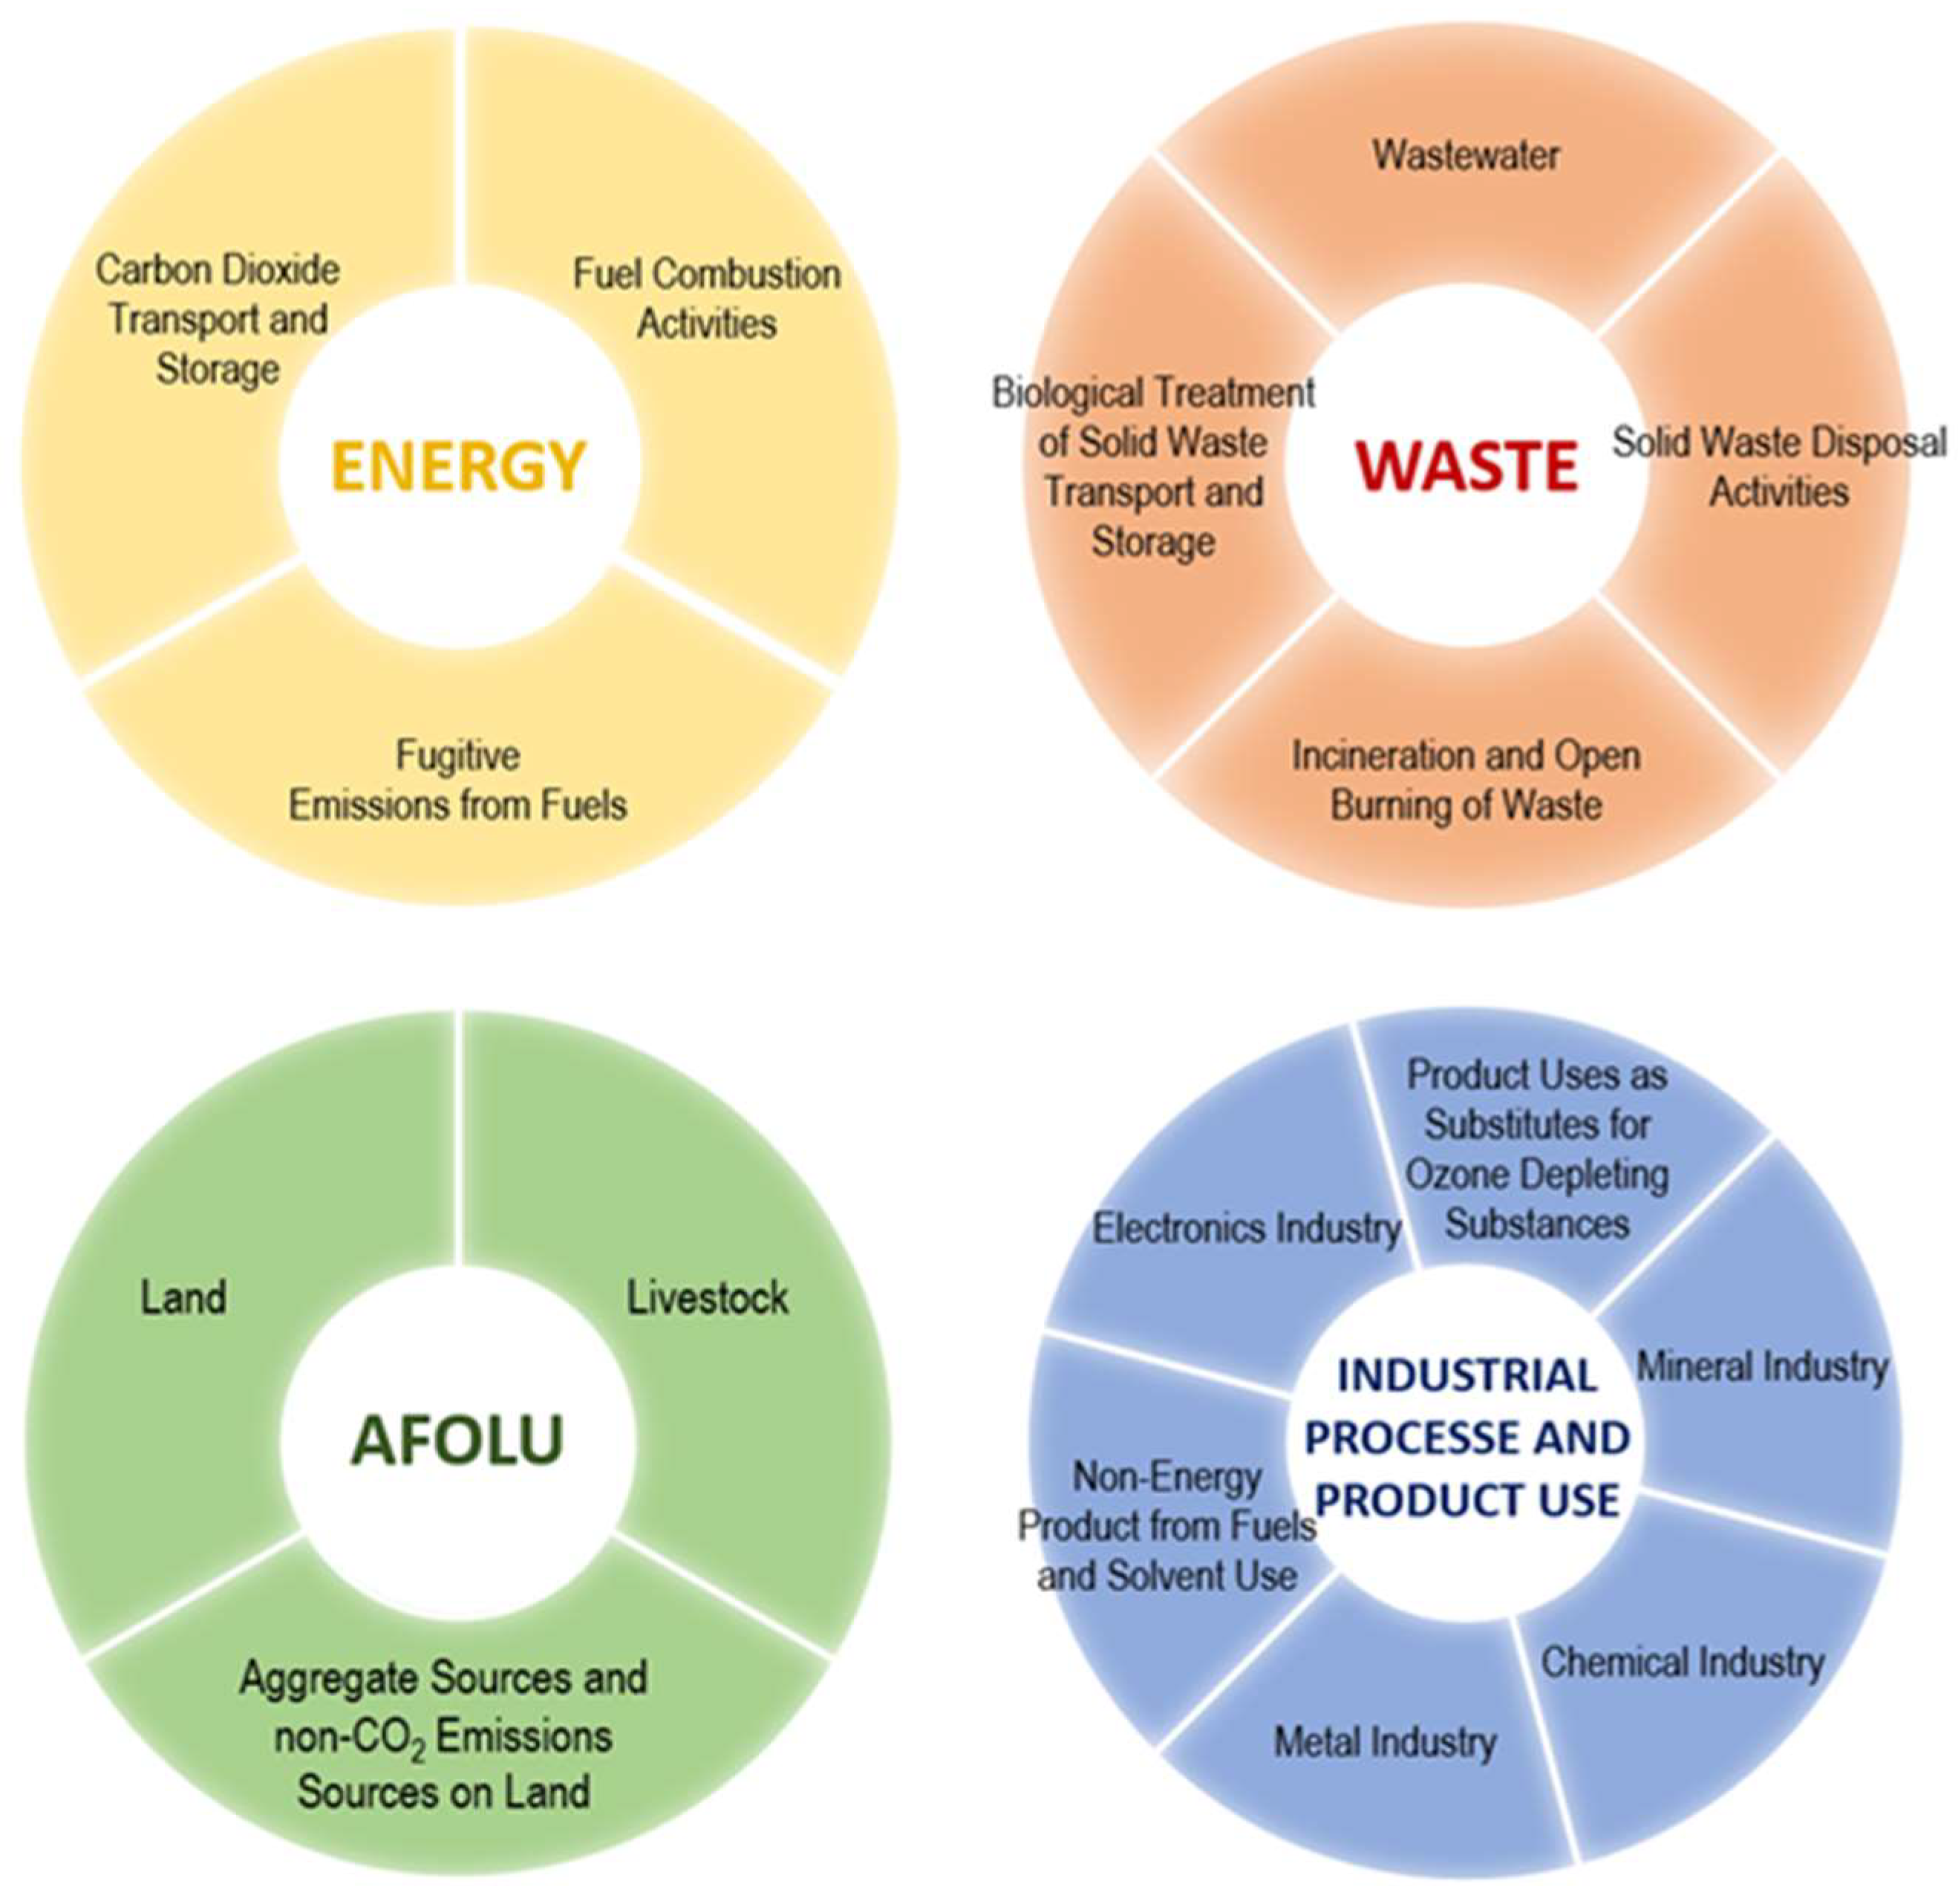
The IPCC method ascribes the GHG emission sources of a territory to four sectors:
The
Energy sector mainly contains activities ascribable to transport and electric energy production and consumption; the
Industrial sector contains different types of industrial production; the
Waste sector refers to solid waste and wastewater treatments; whereas the
AFOLU includes two sectors,
Agriculture concerning soil, cultivation, and livestock management; and
Lulucf, referring to land use, land use change and forestry. The four sectors are further subdivided into emission categories (
Figure 1). Among them, only AFOLU contributes to CO
2 removal through the growing of the forest crops biomass (
Figure 2).
2.1. Greenhouse Gases
The greenhouse gases regulated are:
Concerning carbon dioxide, its global concentration has increased by about 30% to date compared to the pre-industrial period. Since it remains in the atmosphere on average for a period ranging from 50 to 200 years, even by immediately adopting measures to limit its emissions, the first reduction effects can only be observed after decades. Additionally, methane and nitrous oxide concentrations are noteworthy, the former being currently estimated to be more than double its pre-industrial level and the second to be about 8%. Although emissions of gases other than CO2 are quantitatively much lower, their contribution to the greenhouse effect is significant due to the high effect of their heating power.
2.2. Methodology for Emission Assessment
As it is impractical to measure emissions from all the sources that constitute an emissions inventory, consequently, the most common estimation approach is to combine information on activity data (AD) using multiplicative coefficients that quantify emissions or removals per unit activity, called emission factors (EF).
The basic equation to calculate emissions of the x-th gas
Ex is therefore:
In the energy sector, for example, fuel consumption would be the activity data and the mass of sulfur dioxide emitted per unit of consumed fuel would be an emission factor.
The basic equation can, in some circumstances, be modified to include estimation parameters other than emission factors to, for example, accommodate the effects of additional, secondary abatement.
In order to uniform the contributions of the different gases, emissions are expressed in CO
2 equivalent tons, used as the weight factor for the
x-th gas the
Global Warming Potential (
GWPx) on different time scales (20, 100, 500 years), as indicated in the Fifth Assessment Report [
21] (
Table 1):
GWPs are determined on the basis of the gas residence time in the atmosphere and its ability to absorb infrared radiation emitted by the earth.
The IPCC criteria for attributing emissions is a geographic one that considers only those having origins from activities located within the territory boundaries. Furthermore, a responsibility criterion can also be adopted, considering emissions originating in the territory but not released inside.
2.3. Levels of Complexity of Methodology (Tiers)
For emission calculation and emission factors selection,
IPCC guidelines specify different detail levels (
Tier) on the basis of the availability of local data. A tier represents a level of methodological complexity [
22]. Usually, three tiers are provided: Tier 1 is the simple (most basic) method, Tier 2 the intermediate, and Tier 3 the most demanding in terms of complexity and data requirements. Tiers 2 and 3 are generally considered to be more accurate. In the first approximation level (Tier 1), the emissions of each category are estimated starting from data collected on a large scale (national or regional), disaggregated to smaller scales (provincial or municipal) using statistical indicators (population, roads, land-use, etc.); this approach also provides for temporal disaggregation, allowing the switch from annual to hourly resolution. On the contrary, the second and third detail level (Tiers 2 and 3) assess emissions from every category directly on the basis of data collected on the territory.
3. Application of the Methodology to the City of Reggio Calabria
The territory of the Municipality of Reggio Calabria extends over a 236 km2 surface, with a 185,854 inhabitant population. For the variety and plurality of the required information and of its providers, in the inventory compilation the data collecting phase was particularly complex. Frequently information, when available at detailed levels, referred to different years or to territorial areas wider than that of interest. Being in Italy, most census and annuals elaborated at a minimum provincial level, thus requiring disaggregation at lower scales. For this reason, the Tier 1 level was mainly used in the balance assessment, whereas Tier 3 was used in the definition and estimate of emission reduction measures.
The data disaggregation was carried out using the so-said
proxy variables. Using such a method, if
Vp indicates the entity known on a large scale,
Sp and
Sk are the values of the parameter characterizing the territory, on a large and smaller scale, respectively, the value of
V at a smaller territorial level, and
Vk, is given by:
where:
Sk is the value of the surrogate variable in the k municipality;
Sp is the total value of the surrogate variable at provincial (or regional) level;
Vp is the total value of the variable in the p province (or region).
On the contrary, no similar disaggregation was affected on a temporal scale.
The emission evaluation has been carried out in different ways depending on the source typologies. For punctual sources (such as big industrial plants, etc.), the emission data provided by company declarations or by measurements carried out was directly reported. In contrast, for linear and areal sources (i.e., motorways, residential sector, etc.), emissions were estimated on a territorial basis.
The emission balance has been calculated on 1 January 2020 with respect to three of the four IPCC categories: the industrial sector. In fact, as from the census of active industries on the territory, it has been discovered that they only marginally contribute to GHG emissions from the manufacturing process, which has not been considered in the compilation. Consequently, the related emissions (HFC, PFC, and SF6) have been neglected, computing only CO2, CH4, and N2O emissions.
Starting from the knowledge of the emission values of each greenhouse gas,
Ex, and of its global warming potential,
GWPx (
Table 2), on 100 years (GWP100), the total emissions in terms of equivalent CO
2 have been evaluated using the Equations (1) and (2).
As a database of the emission factors in the study the
EEA (
European Environment Agency) [
22] and
ISPRA (
Istituto Superiore per la Protezione e la Ricerca Ambientale) [
23] reports have been used. They refer to that of
IPCC and to
EMEP/CORINAIR (
Coordination of Environmental Information–Air) Emission Inventory Guidebook [
24]. When local emission factors have not been available, regional, national, or default IPCC values have been used. Moreover, their use might lead to marked over- or under-estimations.
For the analysis of some sectors (Waste and AFOLU), generally, the geographic principle of emission ascribing has been adopted and only for the energy sector, the responsibility principle has been used too, resulting in a mixed approach. According to the “Guidelines to local inventories for atmospheric emissions” issued by the
Italian National Environment Agency [
25], the mixed criterion is generally preferable for limited areas, such as municipals, where extensions and emissions/removals limits cannot be easily determined.
The reference standard used for the balance validation has been ISO 14064/1 [
26], which specifies principles and requirements for designing, developing, managing, and reporting GHG inventories, and is addressed to governments, organizations, companies, or voluntary initiatives.
3.1. The Energy Sector
The energy sector is the most significant from the point of view of greenhouse gas emissions, at a national level, covering over 83% of total emissions expressed in CO2eq. For the purposes of the study the emissions were divided, based on the source, into two source categories:
- -
Combustion of fossil fuels (transport and stationary combustion);
- -
Production and consumption of electricity.
Concerning the transport sector, data relating to road, air, rail, and maritime transport were used, adopting for all the geographical criteria.
The activities related to stationary combustion have been divided into sectors: residential and commercial/tertiary (in relation to which consumption for heating in particular has been calculated), and agricultural, for which the emissions deriving from stationary combustion in boilers, turbines, or internal combustion engines. For the combustion of fossil fuels IPCC emission factors have been adopted; the activity data (burnt fuel) was provided, through the Municipality of Reggio Calabria, by the Customs Agency.
In regard to the production and consumption of energy, an important role is performed by the thermoelectric sector, which represents the production sector with the highest CO2 release. Since no electricity production plants are present within the municipal limits of Reggio Calabria, assessments were made by quantifying the contribution of electricity emissions starting from the consumed kWh, obtained by disaggregating the provincial consumption data through Equation (3), using the surface of the territory as the proxy variable. The principle of responsibility was adopted in the analysis, including in the inventory of all emissions which, although not released within the territory, are attributable to the activities of the municipality itself. The emission factor was calculated starting from the Italian distribution of production sources, the activity data (consumed kWh) is provided by TERNA, the Italian Electric Energy Distribution Society.
For all the categories, included the energy sector, the emission assessment has been carried out using Equation (1).
3.2. The Waste Sector
The IPCC methodology for the waste sector provides for the analysis of emissions due to the processes of:
- -
Disposal of waste in landfills;
- -
Waste incineration;
- -
Biological waste treatment;
- -
Wastewater treatment.
The disposal of urban and industrial waste produces considerable quantities of methane, and biodegradable waste subjected to anaerobic degradation has the highest emission potential; such a process is also triggered in landfills, causing the release of quantities of methane estimated on a global scale from 5% to 20% of all anthropogenic emissions. Further emissions derive from the energy production from biogas from agricultural and agri-food processing waste and from the stabilization of the organic fraction (composting).
Within the territorial boundaries of the municipality of Reggio Calabria, there are no landfills or waste-to-energy plants, but only one composting plant, source of CO2 (of biogenic origin, not accounted for as an anthropic source of emissions), CH4, and N2O emissions that have been evaluated through Equation (1), considering the activity data of the mass of organic waste subject to biological treatment, provided by the municipality of Reggio Calabria, and using emission factors provided by IPCC.
In regard to wastewater treatment, globally methane emissions from the disposal of wastewater and sludge in sewage treatment plants amount to approximately 10% of total methane emissions.
Nitrous oxide emissions are also produced in the process associated with the degradation of the nitrogenous compounds (urea, nitrates, and proteins), generated both directly inside the treatment plant and in the receiving body of the purified water or indirectly in the effluent where the water is discharged (the direct ones are much lower). The carbon dioxide developed by the degradation of the dissolved organic matter is not considered because of its biogenic origin.
The equation for estimation of CH
4 emissions in purification treatments used is:
where:
- -
BODtotal is total biochemical oxygen demand;
- -
BODsludges is biochemical oxygen demand removed as sludges;
- -
EF is the emission factor.
The estimation of nitrous oxide emissions is affected through the equation:
where:
- -
Neffluent is the amount of nitrogen contained in the effluent;
- -
FEeffluent is the emission factor associated with the effluent;
- -
44/28 is the ratio of the molecular weights of nitrous oxide to nitrogen.
The activity data have been provided by the Municipality of Reggio Calabria and emission factors by IPCC.
3.3. The AFOLU Sector
With regard to the sector, all emissions and removals that occur in areas modified by anthropic activity, not in natural areas not used by man, are estimated. The sector includes the following emission categories:
- -
Carbon stock variation;
- -
Animal husbandry;
- -
agricultural activities.
The first accounts for uptake by forests and must be applied for each of the six land use categories identified by the IPCC methodology: areas covered by woods and forests, cultivated areas, meadows and pastures, wetlands, urban areas, and other types of land use.
For its assessment, the IPCC
Gain loss method has been used, which calculates the carbon balances by subtracting the biomass losses (wood withdrawals, losses due to anthropic and natural factors, such as fires, wind, etc.) from its increase:
where:
- -
ΔCB is the annual variation of the carbon stock in the biomass;
- -
ΔCG is the annual increase in carbon in the biomass;
- -
ΔCL is the annual loss of carbon in the biomass.
The annual carbon increase is determined with the following expression:
where:
- -
A is the land area in which a specific forest typology is present;
- -
I is the average annual increase in volume for the specific vegetation;
- -
BCEF is the conversion and expansion factor used to estimate the volume of root biomass;
- -
R is the ratio between root biomass and aerial biomass for a specific vegetation;
- -
CF is the fraction of carbon in dry matter.
The annual carbon loss in the biomass has been determined as:
in which:
- -
LWR is the carbon contained in the biomass removed for forestry uses;
- -
LD is the carbon contained in the biomass lost due to fires.
The needed data have been provided by Reggio Calabria municipality and Calabria Region or deducted by photointerpretation (land surfaces). CO
2 emissions have been obtained as:
where 44/12 is the ratio between molecular weights of carbon dioxide and carbon. The sign indicates the prevalence of emissions or absorptions.
Livestock activity is mainly a source of methane emissions from enteric fermentation of cattle, sheep, pigs, and horses, and from manure management are also responsible for small N
2O emissions. The former emissions can be assessed as:
where:
- -
NL is the number of livestock species/categories considered;
- -
EFL the methane emission factor.
The equation for estimating N
2O emissions from manure management is:
where:
- -
N2OMM are N2O emissions deriving from the management of zootechnical manure;
- -
H is the type of manure management (fixed or free);
- -
L are the livestock species/categories;
- -
NL is the number of livestock species/categories considered;
- -
Nav is the annual average of nitrogen excretion per head of species/category;
- -
ML is the fraction of total annual excretion of nitrogen for each category L considered;
- -
EFN2O(L,H) is the emission factor for N2O emissions;
- -
44/28 is the ratio between the molecular weights of nitrous oxide and nitrogen.
The activity data have been provided by the Breeders Association of Calabria, and the emission factors have been taken from the National Manual of Emission Factors.
As concerns agricultural activity, the emissions caused by synthetic fertilizers, organic soil conditioners, and crop residues, which mainly give rise to nitrous oxide, have been estimated. They derive directly from fertilized soil or indirectly by fertilizers volatilization and subsequent redeposition or through leaching; indirect emissions are a minority. Among fertilizers, urea is also a source of CO2. Both N2O and CO2 from urea emissions have been calculated through Equation (1), in which the emission factors are taken from IPCC, and the activity data (fertilizer quantities) from national statistics is disaggregated through the proxy variable land surface.
5. Emission Reduction and Absorption Interventions
The balance of greenhouse gas emissions of the city provided the municipality government with a general cognitive frame of CO2eq emissions of the territory, allowing the arrangement of policies, programs, and actions for their reduction.
The situation that emerged is not positive as only 14% of the gross emissions are able to be removed from the natural system. It is possible to identify priority areas for action and initiatives to be undertaken in the short and long term, among which the main selected are the following:
- (a)
Increase in building energy efficiency with respect to the existing building park, exploiting government incentives aimed at enhancing energy performance;
- (b)
Use of renewable energy sources in buildings;
- (c)
Introduction of less pollutant vehicles into the car fleet;
- (d)
Growth of CO2 absorption capacity of the territory through inclusion of suitable vegetation and reforestation in urban areas.
5.1. Improvement of Energy Efficiency and Use of Renewable Energy Sources in Buildings
Among the energy sector, buildings have a significant role. The city of Reggio Calabria has mainly been built during the last century after a catastrophic earthquake, and thus is characterized by a dated building stock, a major part of which was built during the years 1960–1990. Such buildings present low performances envelopes and obsolete thermal plants, consequently leading to high primary energy requirements and huge amounts of pollutant emissions. According to the national database energy performance certificate [
27], more than 70% of the existing building stock in the city is referred to buildings belonging to the lower classes E-F-G, with a mean value of the non-renewable index
EPgl,nren of 98.1 kWh/m
2y. In
Figure 10, a summary of the numerosity of the emissive class of the building stock referred to its energy index is shown.
Globally, the stock leads to a total energy requirement of more than 1100 GWh of primary non-renewable energy and emissions of 350 kt of CO2. The emissions of the other gases are significantly lower and therefore have not been considered in the analysis; Additionally, due to the complexity of their evaluation: CO2 emissions are, in fact, independent of the combustion process technology, being determined almost exclusively by the carbon content of the fuel considered, while those of CH4 and N2O must be calculated using specific emission factors for each type of process considered.
To reduce such an impact, several measurements can be adopted in order to increase the overall energy efficiency of the envelope-plant system and reduce the primary energy needed.
Considering the main national economic incentives, different scenarios have been considered from data collected during the last year (ENEA, [
28]). The first one, called
Scenario 1, is referred to specific energy efficiency measures:
Replacement of a single thermal plant with a high-efficiency one;
Replacement of glazed surfaces with ones with better performances;
Application of a thermal coat;
Installation of solar systems for domestic hot water (DHW) production.
The second one, called
Scenario 2, instead considered the effect of actual national measures, which involve the totality of the building, with interventions first on the envelope and second on plants, including the installation of renewable energy sources. Particularly among these latter interventions, in
Scenario 2, the installation of both solar systems for domestic hot water (DHW) production [
29] and photovoltaic panels (PV) is allowed [
30,
31].
Considering how these two scenarios have already impacted on environment and society (indicated with
Scenario 1 and
2—actual), in
Figure 11, it is shown that the relationship between specific costs and emissions for the main intervention categories: opaque surface, glazed surface, thermal plants and renewable energy sources.
The diameter of the symbol is representative of the number of interventions already made in that category. Measures present higher values for Scenario 2, due to the economic incentives proposed by national government and to the requirements of intervening simultaneously on the global envelope-plant system.
It can be affirmed that interventions on the opaque surface are certainly the most expensive, having the highest specific cost (from this follows the little number of interventions carried out), but at the same time, they represent the most significant measures to reduce CO2 emissions, allowing important energy savings. Concerning renewable energy sources interventions, if Scenario 1 is represented by a few of these, Scenario 2 is characterized by nearly 25 installations of solar collectors and more than 130 kWp of PV already installed in less than one year.
Then,
Figure 12 shows what would be expecting on the date of 1 January 2030 in terms of energy reductions (
Scenario 1 and
2—prevision) for all the building stock compared to the state-of-the-art energy requirements. It is clear how only with strong measures (
Scenario 2—prevision) higher energy reductions can be achieved (approximately −12%), leading to 63,836 t CO
2 (and CO
2eq) savings (nearly −18%), within the date for the total building stock of the city.
5.2. Introduction of Less Pollutant Vehicles into the Car Fleet
The transport sector represents one of the most pollutant sectors with road transport responsible for more than 90% of its total emissions. The road transport comprehends different categories of vehicles, which can be divided in single means of transport (passengers’ cars and motorcycles, these latter indicated as
L-category), or collective ones (
Buses), in addition to the freight transport (
Light Commercial Vehicles, LCV). Considering the numerosity of these classes and their classification in function of the fuel used, the engine power, the emissive class, and the state-of-the-art of emissions for the city of Reggio Calabria is shown in
Figure 13.
Old vehicles certainly emit a higher quantity of pollutants, first, CO
2 and second, many other gases responsible of greenhouse effects (N
2O) or local ones (NMVOC, CO, and PM
2.5). Of course, emissions are strictly influenced by the number of vehicles belonging to the classes: passengers’ cars represent most of the vehicle fleet, with a correspondent emission of 66% of the total; their fleet is characterized by more than 70% of vehicles belonging to the classes Euro 0–Euro 4, and only the remaining 30% within the most performing ones, Euro 5 and Euro 6 (ACI database, [
32]).
Second, in terms of numerosity, is
L-category, where only 8% belongs to the less pollutant emissive class; in general, this category is responsible for 2% of total emissions. Conversely,
LCV, 86% of which belong to classes Euro 0–Euro 4, are less in terms of circulating vehicles, but represent 26% of the total CO
2 emissions. Lastly, there are few buses in the vehicle fleet, a major part of which (70%) in emissive classes antecedent Euro 5 and Euro 6, producing 8% of emissions. Among GHG gases, globally transports are yearly responsible for the emission of 360,906 t CO
2 and 10.66 t of N
2O in the city, for a total of 364,083 t
CO2eq. To reduce the impact and the emissions of old vehicles, a significant replacement should occur, removing the former and introducing new and less pollutant vehicles, such as electric or hybrid ones. The authors have already considered different scenarios to 2030 [
33] to determine the impact and the effects of changes within the vehicle fleet. However, the most effective and achievable scenario is the inertial one for passengers’ cars and a replacement of more than 50% of the old vehicle fleet for the other type of vehicles, as carried out by national governments.
The inertial scenario considered the trend of the last years of “natural replacing” of old and pollutant cars with new ones. Such trend has led to an increase in gasoline cars (+9.7%) and a correspondent decrease in petrol ones (−11.3%). Of course, an increase in electric/hybrid vehicles occurred, though not as significant as it was supposed to be (only +0.2%): there are still some aspects which do not allow the complete diffusion of these new vehicles, such as the durability of the battery or their expensive cost.
In any case, such changes within the vehicle fleet produce a reduction of local pollutants between 10% and 50%. About GHG gases, instead, N2O showed a reduction of −11%, while CO2 suffered a slight increase of +0.3% (+737 t CO2), due to the increase in the number of vehicles of the last years. Only by reducing the number of circulating vehicles, higher emissions decrease can occur, reaching reductions of some points percentages. Regarding the other vehicle categories, considering strong replacements (among 50% and 70%) within the most emissive classes, local pollutants show reductions from 30% to 60%, while GHG gases do not produce significant results: N2O showed only a final −0.3% compared to the state-of-the-art, while CO2 was only −2%, with avoided emissions approximately equal to 2000 t.
The results, in terms of both total and percentage reductions, are shown in
Figure 14 and
Figure 15. No marked reductions can be seen in the graphs. In regards to CO
2, for all the categories of vehicles, even with the best scenario a reduction of 1367 t CO
2 can be reached, corresponding only to a −0.4% at 2030. In regards to N
2O, the reduction is of 0.95 t, corresponding to 9%.
It can then be affirmed that the transport sector does not offer a relevant contribution in the emissions reductions yet (equal to 1650 tCO2eq considering the two ghg gases, CO2 and N2O), due to the continuous increase in the number of circulating vehicles and to the slow occurring transition toward less pollutant vehicles and collective form of transportation. Stronger measurements need to be implemented, transforming users’ habits and overcoming users’ doubts towards electric vehicles for passengers’ cars, and adopting more performing and eco-friendly vehicles for freight and collective means of transport, as recently suggested by national governments.
5.3. Compensation Measures through Plant Absorption
The compensation measure is linked with the growth of vegetation. Overall, large-scale plantations act as carbon absorption sinks, helping in a significant way in the long run to control carbon dioxide levels. In addition, vegetation brings further benefits, increasing the level of biodiversity, improving the landscape aspect, and reducing hydraulic risks. The adopted actions are related to both an environmental requalification of the over-anthropized agricultural landscape and an environmental rehabilitation of degraded and marginal rural areas. On the basis of territory opportunities and characteristics, the following actions have been selected:
- (a)
Creation of wooded buffer zones adjacent to water courses;
- (b)
Creation of hedges and rows in agricultural areas;
- (c)
Reforestation and environmental rehabilitation of degraded and marginal areas in rural districts and forestry.
5.3.1. Creation of Wooded Buffer Zones Adjacent to Water Courses
Wooded buffer zones are placed on the edges of cultivated fields, with variable width from 4 m to 30 m, close to waterways, and are grassed over by means of herbaceous essences in intercropping with woody species (
Figure 16).
Their main purpose is to reduce the runoff of rainwater and, consequently, the losses of sediments and nutrients, limiting the contamination of surface water by chemical pollutants.
In the analysis carried out, after identifying the main watercourses in the area and assessing the level of anthropization (building structures, agricultural crops types, etc.) at their edges by means of GIS and photo interpretation, the species to be used have selected (Eucalyptus) among those able to adapt to the environmental conditions, and areas to be assigned to the plant have been estimated (
Table 3); an average band width equal to 6 m per edge has been assumed.
5.3.2. Creation of Hedges and Rows in Agricultural Areas
In a similar way, areas designed for hedges and rows planting, located along the boundaries of agricultural lots (
Figure 17), have been estimated (
Table 4).
Particularly, a map identification of the CLC classes (
Corine Land Cover) corresponding to the agricultural land use categories (222, 223, 241, 242, and 243) has been affected. The percentage of surface occupied with respect to the total area of each category is reported in
Table 5.
The most suitable species to be used have been selected on the basis of plant future production. Rows used for fruit trees and berry plantations, and olives and timber production have been favored, the latter due to its very fast growth.
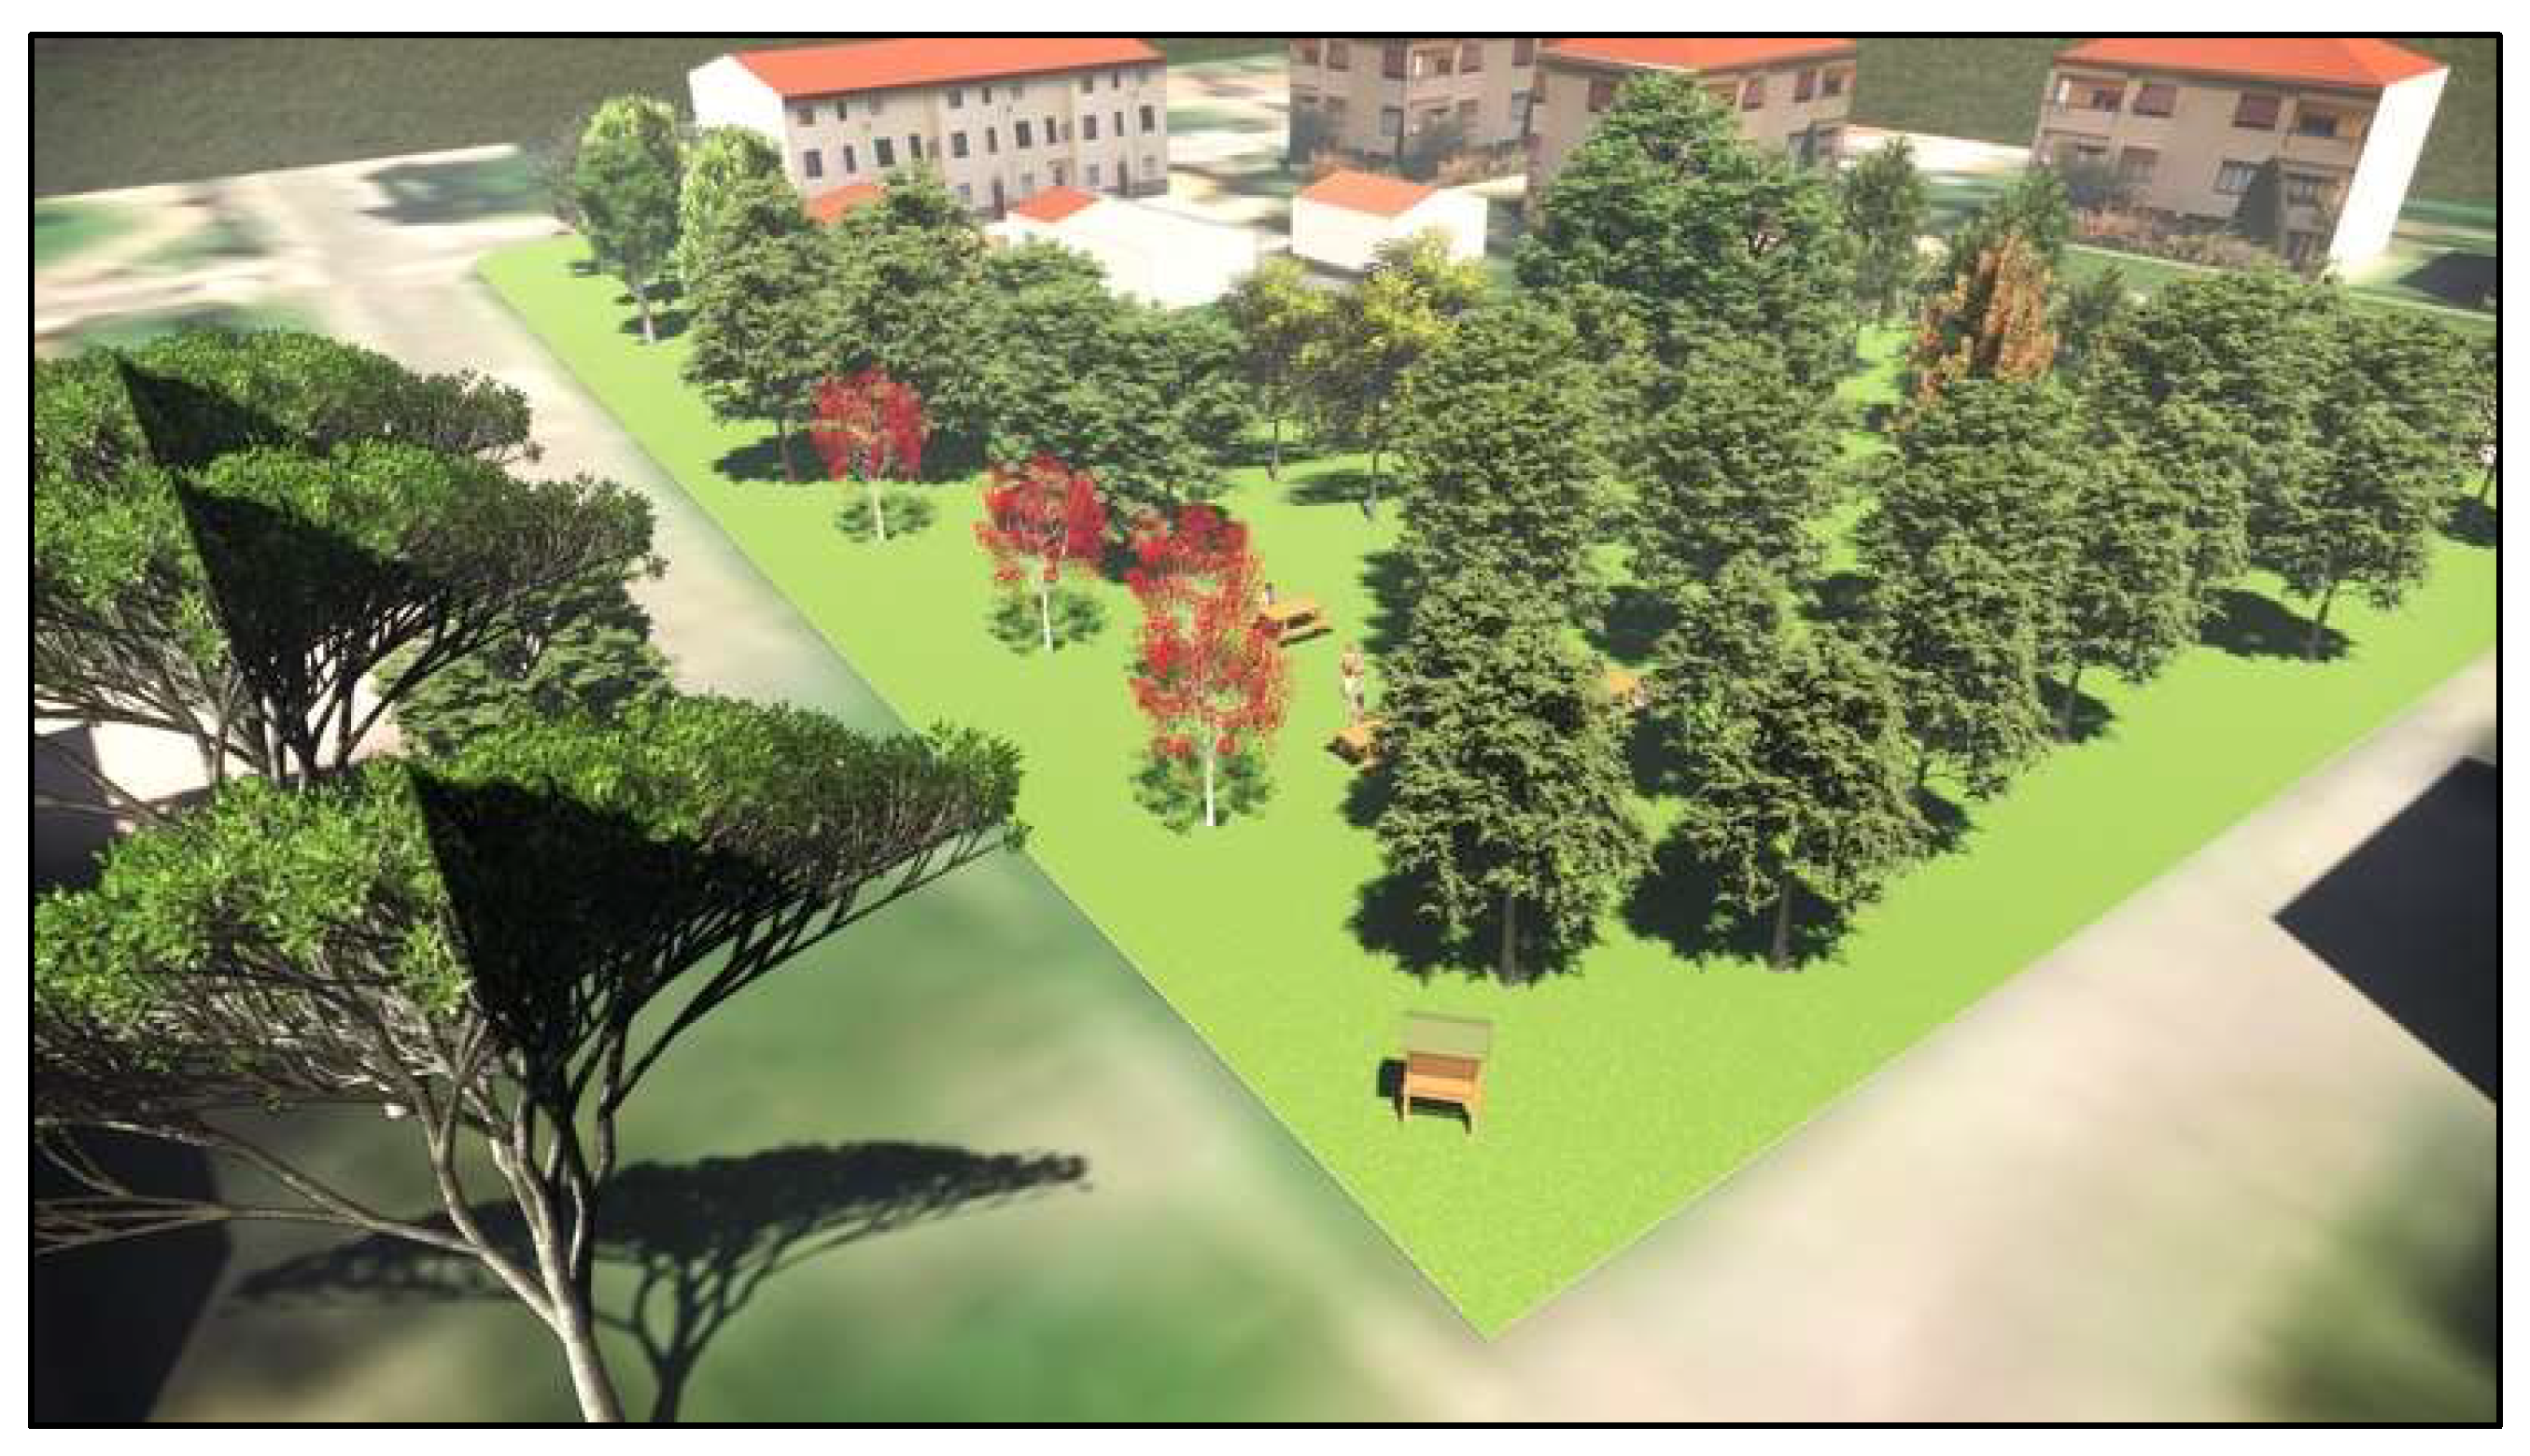
5.3.3. Reforestation and Environmental Rehabilitation of Degraded and Marginal Areas in Rural Districts and Forestry
Reforestation in urban and suburban areas allows a twofold objective: on one hand, the implementation of an action aiming at environmental reclamation and, on the other hand, the creation of green areas close to urban centers in a short time, available to population for leisure activities and sports (
Figure 18).
As concerns the former aspect, a lot of environmental benefits come out from the intervention:
Fight against erosion by weather agents and hydro-geological instability, resulting from drainage and containment of the root systems;
Microclimate balancing effects due to humidity increase, cooling of the lower atmosphere, containment of winds, and balance of the rainfall localization;
Establishment of ecological niches for wildlife species, etc.
The contribution to growing new forest areas is mainly given to the transformation into a forest of mixed shrubs, (natural or semi-natural areas) and uncultivated areas. Among them, areas suitable for reforestation have been identified among the degraded and lacking in topsoil ones by means of GIS technology and photointerpretation, together with land use categories (242, 243, 333, and 334), calculating average slopes (discarding lands with slopes greater than 10%) and exposures, preferring the south, southeast, and southwest exposures. The estimated areas are reported in
Table 6, together with the determination of their incidence on the total surface of each class.
The species to be used have been selected by considering the land potentiality and referring to the Mediterranean shrub. In this aim, the
Erico-Quercetum virgilianae and
Oleo-Quercetum virgilianae vegetation have been identified [
34].
Starting from the values of the usable surfaces, from the knowledge of the carbon fraction contained in the biomass and of the annual growth data of the specific vegetation, for each plantation, the annual increase in carbon was determined.
Figure 19 shows the trends of the removals resulting from the implementation of the three interventions in ten years, and
Table 7 shows the values of CO
2 absorption in 2030. It can be observed that reforestation is shown to be the most effective measure, and on the whole, removals allow the absorption of 17,685 ktCO
2/year after 10 years, providing a global emission abatement of 4%.
7. Conclusions
In order to hit the Paris’ Agreement objectives, countries must respect the subscribed commitments aimed to contain the increase in world temperature below 2 °C. The reduction targets concerning GHG emissions prefixed by the European Directives can be achieved only if local communities, in addition to central governments, are involved too. In this aim, a useful tool is represented by an emission balance, an inventory of the amount of greenhouse gases introduced and removed in the atmosphere by natural sources and/or human activities. Assessing GHG emissions, the balance allows identification of local emission sources together with addressing responsibilities of a territory, pushing for possible improvements.
In this frame, in this paper, the balance of emissions for the Southern Italian city of Reggio Calabria at the date of 1 January 2020, drawn up following the well-known IPCC guidelines methodology, is presented. The situation that emerged is not positive, and only 14% of the gross emissions was able to be removed from the natural system.
From the analysis, it emerges that the energy sector is accountable of the highest CO2eq emissions (almost 95% of the total). Particularly relevant, within the sector, is the transport contribution, showing to be one of the most emissive as on 1 January 2020, the automotive sector had been responsible for about 364,083 t CO2eq deriving from diesel, petrol, and LPG fueled vehicles. Consequently, the need for a careful planning, by the local government, of policies, programs, and actions aimed at emission reduction in the sector or absorption has emerged, particularly considering that the city government has subscribed EU Mayors’ Covenant.
In this aim, starting from the identification of the most critic sectors, it has been possible to identify priority areas for action and initiatives, to be undertaken in the short and long term (1 January 2030), mainly addressed to the building and the transport sectors.
As it concerns buildings, the main measures to be adopted address the existing building park and consist in both energy efficiency increases and use of renewable energy: both measures take advantage from government incentives aimed at energy performance enhancing. Referring to a ten year scenario, significant energy reductions can be achieved in the sector (nearly −12%), leading to savings of 63,836 tCO2eq (−18%).
As concerns the transport sector, the introduction of less pollutant vehicles into the fleet is in general an efficient and incentivized measure. Moreover, the constant increasing number of vehicles cancels the obtainable benefits almost completely. The analysis carried out showed that the road transport sector does not offer a relevant contribution to the emissions reductions (only 1650 tCO2eq obtainable in 10 years), due to the continuous increase in the number of circulating vehicles and to the slow occurring transition toward less pollutant vehicles and collective form of transportation. Stronger measurements need to be implemented, transforming users’ habits and overcoming users’ doubts towards electric vehicles for passengers’ cars, and adopting more performing and eco-friendly vehicles for freight and collective means of transport, as recently suggested by national governments.
Finally, growth of territory’s CO2 absorption capacity through inclusion of suitable vegetation and reforestation in urban areas has been considered, having the fundamental role to re-equilibrate the environment from both a quantitative and qualitative point of view. Referring to such intervention, three balancing actions, to be effective in the ten years following their implementation, have been proposed: the creation of wooded zones adjacent water courses, of hedges and rows in agricultural areas, and the reforestation and environmental rehabilitation of degraded and marginal areas. After their growth, removals corresponding to a total of 17,685 tCO2eq will be observed; in terms of abatement, the percentage assessed is 4%.
Considering the global effect obtainable from all the three proposed reduction/absorption measures, a reduction of 83,171 tCO2eq, corresponding to a percentage of 17%, can be observed. This indicates that, although strong and efficient measures have been adopted, reaching carbon neutrality in 2050 will not be simple as hitting such a target requires further, more incisive wide range interventions.


