Abstract
Recently, renewable energy resources (RESs) have been utilized to supply electricity to remote areas, instead of the conventional methods of electrical energy production. In this paper, the optimal design of a standalone hybrid RES comprising photovoltaic (PV), wind turbine (WT), and biomass sources as well as an energy storage system, such as a hydro-pumped storage system, is studied. The problem of the optimal sizing of the generating units in the proposed energy system is formulated as an optimization problem and the algorithms heap-based optimizer (HBO), grey wolf optimizer (GWO), and particle swarm optimization (PSO) are applied to achieve the optimal sizing of each component of the proposed grid-independent hybrid system. The optimization problem is formulated depending on the real-time meteorological data of the Ataka region on the Red Sea in Egypt. The main goal of the optimization process is to minimize the cost of energy (COE) and the loss of power supply probability (LPSP), while satisfying the constraints of system operation. The results clarify that the HBO algorithm succeeded in obtaining the best design for the selected RE system with the minimum COE of 0.2750 USD/kWh and a net present cost (NPC) of USD 8,055,051. So, the HBO algorithm has the most promising performance over the GWO algorithm in addressing this optimization problem.
1. Introduction
At present, fossil fuels are an essential component of energy sources around the world. However, these fossil fuels may be depleted, which will have a negative influence on human activities [1]. Therefore, the search for cost-effective, reliable, and clean alternatives to generate the required electrical energy is very important [2]. RESs, such as solar power plants, wind turbines, and hydro-power, are considered the most promising resources of eco-friendly energy production in remote areas [3,4]. Recently, the progress in developing technologies for renewable sources has advanced considerably. In spite of this great development, there is still a vast shortage of electricity in remote or isolated zones, such as rural and island areas [5,6]. The high cost of the produced units from renewable energy power plants is considered the actual problem in comparison with the generated units from traditional power plants, in addition to the shortage of proper weather conditions to implement a large RES in places that need high electrical energy [3,7]. Additionally, photovoltaic technologies and wind turbines have some inconsistencies during the individual work in the energy system, and these variations cause instability in the system [8,9]. These fluctuations result in an increased capacity of the generating units. Consequently, the size of the energy storage devices required to store excess energy from RESs will also increase [10,11]. Therefore, combinations of different types of RESs should be considered in the design phase as well as selecting a proper energy storage facility [12,13]. The combination of different generating technologies, including renewable sources, into one energy system is defined as a hybrid energy system. Basically, the outlying territories rely on diesel generators as the base resource of electricity. The integration of renewable energy sources, such as photovoltaic (PV), wind, biomass, and hydropower, in a hybrid energy system has become increasingly popular due to their complementary nature, which can lead to a more stable and reliable energy supply. Additionally, energy storage systems, such as pumped hydro-storage, can further enhance the stability of the system by storing excess energy and releasing it when needed [14,15].
Recently, the developed MAs have had an effective role in solving complicated engineering optimization problems, especially the optimal configuration of various combinations of hybrid RESs. The authors of [16] utilized two metaheuristic optimization techniques, i.e., genetic algorithm (GA) and particle swarm optimization (PSO), to solve the optimization problem of the optimal sizing of a PV/WT/biomass energy system, while reducing the COE, which was incorporated as the objective function (OF). At present, hydro-pumped storage (HPS) systems are listed as one of the most prevalent technologies for energy storage. The real-life efficiency of HPS systems is in the range of 70–80%, and the storage system capacity does not depend on seasonal water flow variations [17]. HPS plants are different from standard hydroelectric power plants and, in HPS systems, the water is pumped upward from the lower tank to the upper one when the energy produced from the RES is higher than the energy consumption. As it is known, the cost of the generated energy is high at peak loading hours, so previously collected water in the upper tank is discharged downward to produce the required electrical energy through the hydraulic turbine/generator [18]. In [19], a developed ant colony optimization technique was applied to estimate the best design of an off-grid PV/WT/battery/FC hybrid system. The main target was to minimize the COE and maximize the reliability of the proposed power supply. The optimal sizing of the subsystem components of an isolated WT/micro-hydro/fuel cell hybrid system was implemented by applying GA [20]. Biogeography-based optimization (BBO) algorithms are used to identify the optimum sizing of an isolated PV/DG/WT/battery storage system to supply remote villages with the required electrical energy [21].
In [22], the optimal configuration of a hybrid microgrid comprising renewable sources (PV and wind), a battery storage, and a supercapacitor was accomplished with the main goal of the study being to minimize the COE, enhance the system reliability, and decrease greenhouse gas emissions. Khalid et al. proposed a methodology for minimizing the net present cost of a microgrid integrated with renewable energy sources employing various BESSs to cover the power demand [23]. In their proposed methodology, real data from six generating power plants were employed and the reduction in the system cost was estimated. The modified firefly algorithm (MFA) was developed to determine the best capacities of each subsystem of a grid-connected PV/WT/battery storage hybrid system [24]. In [25], a comprehensive investigation of the economic indices of two isolated energy systems incorporating distinct kinds of energy storage systems was conducted; the simulation results confirmed that the HPS system has a lower life-cycle cost compared with traditional battery banks. Asif Khan et al. [26] used a stand-alone hybrid energy system, including photovoltaic panels, wind turbines, and fuel cells. They used a metaheuristic approach called jaya to determine the optimal size of the system components for minimizing the net present cost of the proposed hybrid system.
In [27], a grid-connected hybrid system, consisting of biomass, PV, and wind turbine, was considered for rural electrification. In the case of low demand, the surplus power generated by the system was returned to the grid. The Homer software was used to determine the optimal size of the grid-connected WT-PV-biomass system. A multi-objective PSO algorithm was proposed in [28] to design a microgrid consisting of biomass and fuel cells. Instead of using batteries, the excess amount of energy produced was utilized to produce hydrogen, which was further used by fuel cells to be converted into electrical energy. Due to its high convergence speed and accuracy, the whale optimization algorithm (WOA) was proposed in [29]. The system combination of the used hybrid sources was PV, bio-waste, and fuel cell. The overall objective function covers economic as well as reliability constraints, such as LPSP. Zhang et al. developed a novel, efficient, and multi-objective storage system with carbon-dioxide capturing [30]. They showed that the reliability and efficiency of the system were increased to a great extent when energy storage systems, such as liquefied natural gas and compressed air, were integrated. In [31], Akram et al. investigated the optimal sizing of renewable sources and battery energy storage system (BESS) of a hybrid energy system. The proposed strategy considered forced outage rates of renewable sources and the utilization coefficient of a battery bank to avoid over- and under-sizing. In [32], the authors proposed a methodology for an integrated power plant with a carbon capture facility and energy storage system. The power plant included solid oxide fuel cells, gas and steam turbines, carbon capture, and storage technologies. Environmental and thermo-economic analyses were performed to minimize the emissions of CO2 and utilizing it in enhanced oil recovery.
In [33], an optimal design of a hybrid renewable energy system that includes a grid, photovoltaic (PV) panels, a bio-generator, a diesel generator, and a battery was presented. The objective was to minimize the total annualized cost while satisfying the load demand and system constraints. The authors used a genetic algorithm to find the optimal sizing and dispatch of each component. Their results showed that the hybrid system can provide reliable and cost-effective energy to meet the load demand. In [34], an optimization model for determining the optimal sizing of a grid-connected hybrid photovoltaic/fuel cell power system with hydrogen storage was developed. The proposed model considered the uncertainties in weather and electricity demands, and aimed to minimize the total annual cost of the system while meeting the energy demand and environmental constraints. Their results showed that the optimal sizing of the system depends on various factors, such as the cost of electricity, the cost of hydrogen, and the system’s efficiency. The proposed model can be useful for designing and planning hybrid renewable energy systems for grid-connected applications.
The design of an optimal standalone hybrid renewable energy micro-grid model using different algorithms was proposed in [35]. The proposed model aimed to minimize the total annual cost of the system while meeting the energy demand and environmental constraints. The authors compared the performance of three algorithms: particle swarm optimization, cuckoo search (CS), and grey wolf optimizer. Their results showed that the GWO algorithm outperformed the other two algorithms in terms of convergence speed and solution quality. The proposed model can be useful for designing and planning standalone renewable energy micro-grids in remote areas with no access to the national grid. In [36], the optimal design approach for energy sources of a photovoltaic/fuel cell-extended-range agricultural mobile robot using the particle swarm optimization algorithm was presented. The proposed model considers the energy consumption of the robot, as well as the characteristics of the photovoltaic and fuel cell systems. The objective of the study is to minimize the system’s total cost while ensuring that the energy demand of the robot is met. Their results showed that the optimal design includes a photovoltaic array, a fuel cell, and a battery bank. The proposed PSO-based approach can be useful for designing and optimizing energy sources for agricultural mobile robots, which can improve the efficiency and sustainability of farming practices. In [37], an optimization and design approach for a hybrid power system using the HOMER Pro software and an integrated CRITIC-PROMETHEE II multi-criteria decision-making approach was presented. The proposed model considered uncertainties in the weather and electricity demand and aimed to minimize the total cost of the system while meeting the energy demand and environmental constraints. Their results showed that the optimal design includes a combination of solar, wind, and diesel generator as energy sources, and a battery bank for energy storage. The integrated CRITIC-PROMETHEE II approach was used to evaluate and rank the design alternatives based on multiple criteria, such as economic, environmental, and technical factors. The proposed approach can be useful for designing and planning hybrid renewable energy systems for off-grid or grid-connected applications.
Due to the absence of a thorough analysis of the best solutions and a thorough search, the heap-based optimizer (HBO) [38], a recently suggested optimization method, may experience local stagnation issues and exhibit slow convergence speed. In HBO, unlike many well-known optimization algorithms, a search agent updates neither the position with reference to only one better solution nor the position with reference to the world leader, which is the case in many optimization algorithms. In reality, since each search agent has its own boss, they are all free to explore the area around various viable solutions. Additionally, based on the position-updating equation chosen probabilistically, a search agent may follow a different solution for each of its various design variables. Seven frequently cited optimization methods, including the CEC-BC-2017 winner, were compared to the suggested algorithm using 97 different test functions, including 29 CEC-BC-2017 functions with exceptionally challenging landscapes. Experiments and the Friedman mean rank test demonstrated HBO’s superior performance and first place. The “No Free Lunch Theorem” [39] asserts that no one algorithm can provide the best results for all situations. The HBO algorithm should be used by the authors to resolve the hybrid energy system’s optimal sizing optimization issue.
Due to the higher rates of solar radiation and wind speed in Egypt, several feasibility studies have been performed for determining the optimal sites for the establishment of new RES projects. Egypt built a large wind farm with a capacity of 380 MW in the Gabal Elzeit region in 2015. The government plans to install new power plants based on renewable sources in the region of the Suez Gulf. The Ataka region in the coast of the Red Sea in Egypt (east longitude of 28.938 and north latitude of 25.576) was chosen to apply the proposed system as a case study. The main reasons for selecting this location include its high intensity of solar radiation, high wind speeds that are sufficient for operating the wind turbines, and the high biomass energy potential.
The major objective of the current work is to achieve the optimal sizes of the components of an isolated hybrid PV/WT/biomass/hydro-pumped energy storage system. This objective is achieved by using two different metaheuristic optimization techniques, namely, HBO and GWO. The results are compared with the standard PSO optimization algorithm. The primary objective function of the proposed hybrid renewable energy system is minimizing the COE while achieving high-power-supply reliability, as presented by a low LPSP and low energy dissipated in the dumper load.
The main objectives of this study are as follows:
- The mathematical modelling of the hybrid PV/WT/biomass/hydro-pumped storage energy system is demonstrated and applied for a case study in the Ataka region in Egypt.
- A novel metaheuristic algorithm, namely, heap-based optimizer, is employed for the optimal sizing of the studied system.
- The developed algorithm is employed to accurately determine the optimal subsystem capacities of the proposed hybrid system.
- The obtained results based on the proposed algorithm are comprehensively compared with the well-known grey wolf optimizer and the standard PSO optimization algorithms.
- Statistical measurements are conducted to assess the effectiveness and stability of the utilized algorithms in addressing the optimization problem.
The remaining parts of this paper are organized as follows: The mathematical modelling of the proposed hybrid system is illustrated in Section 2. The description of the case study is provided in Section 3. The formulation of the optimization problem is addressed in Section 4. The proposed optimization algorithms are addressed in Section 5. The simulation results and discussions are reported in Section 6. Section 7 presents the main conclusions and future work.
2. Mathematical Model of the Hybrid System
A simplified diagram of the standalone hybrid PV/WT/biomass/hydro-pumped renewable energy storage system under study is presented in Figure 1. The suggested energy system comprises PV, WT, biomass generator, inverter, upper reservoir, pump, and hydraulic turbine. The mathematical representation of all subsystems are presented in brief in the following subsections.
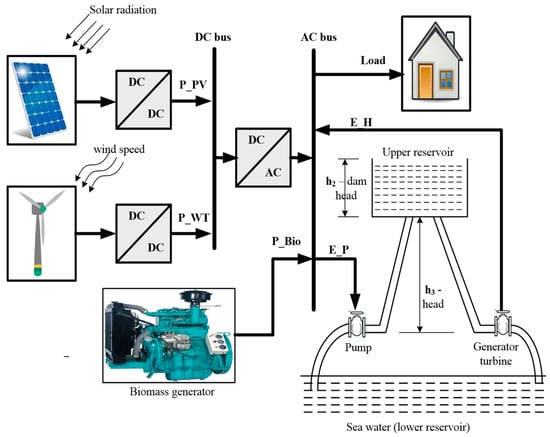
Figure 1.
Simplified configuration of the standalone hybrid system.
2.1. Photovoltaic System
The power produced from the series combination of solar cells is calculated as presented in Equation (1) [11,40]:
where is the number of PV modules, denotes the rated PV electrical power at standard atmospheric conditions of operation (25 °C and 1000 W/m2), implies the efficiency of the solar panels, symbolizes the solar radiation at time t, denotes the coefficient of temperature, and TC represents the cell temperature. From Equation (1), it can be noticed that depends on solar irradiation and the surrounding temperature. In this study, includes the efficiency of the DC/DC converter, tracking systems, and the connections wires.
The actual temperature of the solar cell can be formulated based on the ambient temperature as presented in Equation (2) [11]:
where is the ambient temperature and is the temperature recorded during the examination of the module.
2.2. Wind Turbine Model
The basics of aerodynamic engineering express that there is a certain relation between the wind speed and the height at which it was measured. The wind speed (v2) at the wind turbine hub (h2) can be calculated using the wind speed (v1) that is measured at the anemometer height (h1), as shown in the following expression [11,41]:
where α is the friction coefficient (equals to 0.11 for extreme wind conditions and 0.20 for normal wind conditions, according to IEC recommendations) [41,42]. The electrical power produced from a group of wind turbines at a defined speed v can be computed as shown in Equation (4) [41,43]:
where represents the WT numbers; represents the WT efficiency, implies the rated power of a single wind turbine operated at the rated wind speed (); and denotes the velocity at which the WT starts running. denotes the shutdown speed at which the turbine is stopped due to high wind speeds and for safety reasons. The rated power of the proposed type of WT in the current work was 45 kW.
2.3. Biomass System
A biomass energy system utilizes the energy of the sun in its chemical form; hence, biomass might be used directly for heating or used in the form of liquid fuel or environmentally friendly gas after a series of industrial processes. One of the main features that regulates the process and technology utilized for producing biomass energy is the kind of raw material (biomass) applied and the form of the product (fuel) from the transformation processes [44]. In this study, the transformation process employed was biomass gasification, which is a pyrolysis process. In this process, bolted-pressurized vessels are utilized to heat up the raw materials of biomass. Sugarcane bagasse is utilized as the input to a small gasifier, as sugar cane crops are grown in large quantities in Egypt [45]. In the current study, the biomass generator (BG) was taken as the base-generating unit for supplying the load demand in addition to photovoltaic and wind farms. The electric power produced from the BG, , can be formulated as shown in Equation (5) [46,47]:
where implies the gasifier efficiency and was taken as 75%, is a parameter for transforming kJ to kWh (27.78 × 10⁻⁵), symbolizes the higher heat value of raw materials used as input to the system, and denotes the flow rate of the raw materials (kg/h).
The electric energy produced from the biomass system per year was calculated as follows:
where denotes the number of BG units and signifies the output power of the biomass generator.
2.4. Hydro-Pumped Storage System
To simplify the mathematical calculations, we only used one upper reservoir with a cube shape as a storage tank for storing the water in the case of pumping. The height of the tank is h2, and the main head of the hydraulic system is h3. The potential energy of water in the upper tank mainly depends on the quantity of the stocked water. The processes of filling and discharging the upper reservoir cause changes in the water head with time. So, an additional water head (hadd) was added and it can be computed as shown in [3,48]:
The operation of the hydraulic system depends on difference in electrical energy between the renewable generations (PV, wind, and biomass) and the load demand (). The energy balance () can be computed according to the following formula:
where denotes the inverter efficiency, and and denote the energy produced from PV and wind farms, respectively. The simulation was conducted on a time interval of one hour; therefore, the energy produced from PV and WT were taken as the power generated during this interval because the solar radiation and the wind speed also varied on the basis of time interval one hour.
The hydraulic system works in the generating phase if the energy balance is less than zero and, in this case, the electrical energy generated from the turbine/generator set () was calculated as follows [3,48]:
where denotes the rate of the sea water discharge through the turbine/generator set (m3/s), denotes the efficiency of the hydraulic turbine, is the pipeline efficiency, denotes the water density (kg/m3), and g represents the gravitational acceleration (m/s2). From Equation (9), the quantity of water discharged during a time interval (Δt = 1 h) was computed as follows:
The hydraulic system works in the pumping mode if the energy balance is higher than zero and the electrical energy consumption of the motor/pump unit (Ep) was calculated as shown in [3,48]:
where represents the maximum volume of the upper reservoir, is the pumping rate (m3/s), and denotes the efficiency of the pump/motor set. From Equation (11), the quantity of water stored upward in the upper reservoir during a time interval is calculated as in Equation (12):
2.5. Inverter
The DC/AC inverter is an electronic device employed for providing AC power to consumers. The output power from the inverter model is expressed as follows [49]:
where denotes the power supplied from renewable sources to load and symbolizes the efficiency of the inverter, which was taken as 95% in the current study.
3. Case Study Description
The proposed hybrid RES is an isolated system to cover the load demand in the selected location. The Ataka region on the coast of the Red Sea in Egypt (east longitude of 28.938 and north latitude of 25.576) was chosen as the location of our case study.
Why did we choose the Ataka area of the Red Sea? There are several reasons for choosing this location, the most important being the presence of a natural depression above the Al-Galalah mountain, forming a lake with a capacity of about 8 million cubic meters. This place is located near the Suez Gulf and the Zafarana region, which has the highest wind speeds throughout the year and is a promising place for installing solar power plants. Moreover, this location has a high intensity of solar radiation. The proposed model was applied to design a small-scale isolated hybrid system to supply electric household loads, where the maximum demand takes place during the summer. The load demand of the Ataka region for one year over an interval of one hour is depicted in the graph presented in Figure 2. It can be noticed that the maximum residential load is 410 kW and the average load is 260 kW. Figure 3 and Figure 4 show the annual solar irradiance, ambient temperature, and wind speed of the proposed area under study. These data were obtained from the website of NASA Surface Meteorology and Solar Energy, and the obtained data were the average of 25 recorded years. It can be observed that the maximum ambient temperature is 37 °C and the maximum wind speed is about 9.48 m/s. The biomass raw material fed to the gasifier is bagasse. Sugar cane is one of the strategic crops cultivated in the country, where the harvesting time starts in January and continues until May. It is assumed that the amount of biomass input at the proposed region has different values over the year. The biomass rate (kg/h) over the year in the selected region is presented in Figure 5.
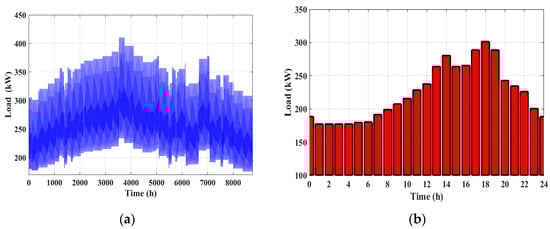
Figure 2.
Load curve in the proposed location: (a) annual and (b) daily values.
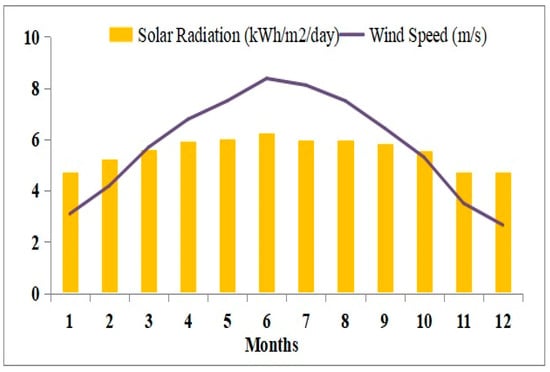
Figure 3.
The average monthly solar irradiance and wind speed in the selected location.
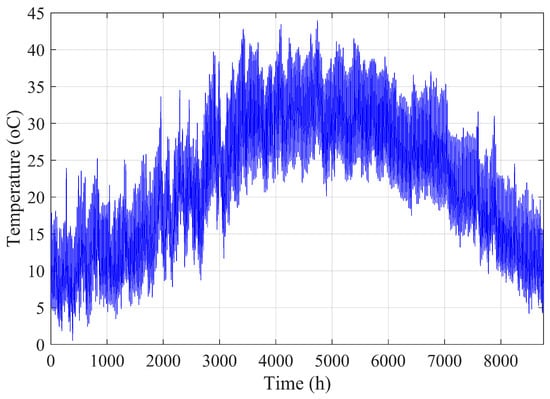
Figure 4.
The temperature of the proposed area over a year.
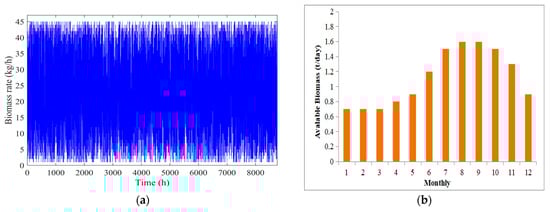
Figure 5.
The rate of biomass raw material (kg/h) in the proposed location: (a) annual and (b) daily values.
4. Optimization Problem
4.1. Cost of Energy
The major target of this study was to optimally design a RES to feed the electrical load with sufficient electrical energy and with minimum COE. Moreover, the reliability of the power system should be within the predefined limit (LPSP < βL), which was taken as not exceeding 0.05 in this study. The COE is a relation in the net present cost (NPC) that is a symptom of the total cost of the proposed system. The total annual cost () of the studied system included the annual investment costs (), the annual replacement cost () if the subsystem lifetime is not same as the lifetime of the proposed system, and the cost of operating and maintenance per year (). The annual cost of the entire system as formulated as:
The NPC of the studied hybrid system is expressed as [11]:
where CRF represents the capital recovery factor and can be computed as follows:
where denotes the rate of interest and denotes the lifetime of the entire hybrid system. For each system component, the annual interest of investment was computed as:
where implies the capital investment of the subsystem. The annual cost of replacement for each component was calculated according to the following formula:
where is the entire system lifetime (25 years). The denotes the cost of the energy generated by the proposed energy system in (USD/kWh) and it can represented as [11,48]:
4.2. Objective Function and Constraints
In this work, to optimize the capacity of each subsystem in the proposed hybrid system, a group of constraints were taken into consideration.
First, the quantity of stored water in the upper reservoir should range between the minimum and maximum limits, which can be expressed as:
The LPSP should be within the predefined limit , which was taken as not exceeding 0.05.
The loss of power supply probability can be computed according to the following expression:
The OF of the proposed isolated hybrid system is to minimize the COE, , and excess power () dissipated in the dummy load ().
where x represents a vector of the parameters that must be optimally determined (NPV, NWT, Vmax, Ngen, QP, and QT). γ1, γ2, and γ3 are weight factors and can be generated via a trial-and-error principle until the best solution is achieved, and they were considered as γ1 = 0.2, γ2 = 0.4, and γ3 = 0.4. The dummy load power and excess power can be formulated as follows:
4.3. Operation Strategy
The procedure of the proposed hybrid isolated PV/WT/biomass/HPS energy system is as follows:
- When the electrical power generated from renewable energy resources (PV, wind, and BG) equals the load requirements, the demand is achieved by a RES without the hydro-pumped storage power plant.
- If the electrical power produced by the renewable energy resources is greater than the load requirements, the difference is transmitted to the HPS system to work in the pumping mode, letting the water pump set work and raising the water to the higher tank.
- If the upper reservoir is fully charged and the produced power from the RES is greater than the reservoir capacity, the surplus is consumed by a dummy load.
- When the electrical power generated by the RES does not cover the load needs, the deficit in power is covered by operating the HPS system in the generator mode.
- If the water volume in the upper reservoir reaches the lowest margin and the deficit power is higher than the rated power of the turbine/generator set, the LPSP increases.
A flowchart that summarizes the operation strategy of the proposed energy system is shown in Figure 6.
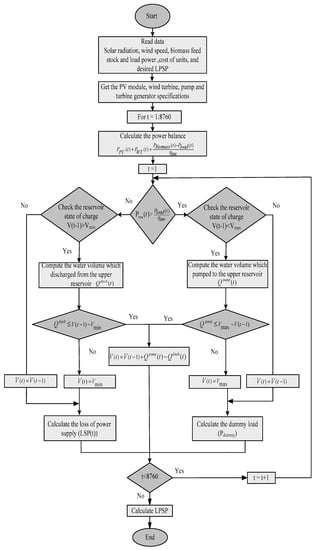
Figure 6.
Flowchart summarizing the operation of the proposed system.
5. Optimization Algorithms
Two different optimization algorithms were used in order to find the optimal solution of the studied optimization problem, mainly the heap-based optimization and grey wolf optimization algorithms. The results obtained from the proposed algorithms were compared with the standard PSO technique.
5.1. HBO Algorithm
The heap-based optimization algorithm was created by Qamar Askari [38], and it was motivated by the social attitude of humans based on the hierarchy of organizations. This algorithm mimics the corporate rank hierarchy (CRH). The CRH means that the members of a teamwork in a certain organization arrange themselves in a hierarchical form to complete a certain task. The proposed HBO algorithm uses the CRH concept to arrange the search candidates in a hierarchical way based on the fitness of these candidates. The heap-based data organization is used for the construction of the hierarchy.
In addition to the modelling of the CRH, the entire concept includes another three phases: i.e., (i) modelling of the collaboration between the subordinators and their direct manger; (ii) modelling of the interactivity among the employees; and (iii) finally, the modelling of the self-contribution of the subordinator in order to achieve the desired task. The next subsections are dedicated to briefly explaining these steps.
5.1.1. Modelling of the CRH Concept
A non-linear tree-shaped data structure is utilized for building the corporate rank hierarchy. In the proposed algorithm, the developed CRH is considered as the population. During the simulation, the search agent in the search spaces corresponds to the heap node, while the fitness function of the optimization problem is the master key to the heap node. The value of the heap node was taken as the population index of the search candidate.
5.1.2. Modelling of the Interaction with the Direct Manger
In large organizations that follow a centralized structure, regulations and laws are applied in one direction from the senior leadership to the employees and the employees must obey the instructions directed to them by their superiors. This phase can be mathematically described by updating the location of the search candidates:
where x denotes the location of the search agent; t and k signify the present iteration and the component vector, respectively; and B represents the parent node. The term (2r − 1) denotes the k-th component of the vector γ and is generated in a random manner and described in Equation (27):
where r denotes an arbitrary variable in the range of [0, 1] in a uniform distributed form. γ can be expressed as follows:
where T implies the maximum number of iterations and C denotes an adjustable variable defined by the user according to the studied case and depends on the iterations according to the following formula:
5.1.3. Modelling of the Interactivity between the Subordinators
Subordinators (colleagues) in a certain organization cooperate to achieve official tasks. In the proposed algorithm, the nodes at the same position in the heap are assumed to be colleagues. The position (xi) of each search agent is updated based on the randomly selected colleague (Sr), as mathematically presented in Equation (30):
5.1.4. Modelling of the Employee’s Self-Contribution
The self-contribution of each subordinator in the organization is described by Equation (31):
5.1.5. Position Update
In this subsection, the three position update equations described in the previous subsections are merged into one equation. A roulette wheel was used to make a balance between the exploration and exploitation processes. The three probabilities P1, P2, and P3 were used to achieve the balance between these phases. The first probability p1 was used for updating the position of the search agents in the population and is expressed as:
The second proportion p2 was calculated as follows:
Finally, the probability p3 was calculated according to Equation (34):
Accordingly, a general equation of the position update for the proposed HBO is presented in Equation (35):
where p denotes an arbitrary number in the range of [0, 1]. The flowchart of the HBO is presented in Figure 7.
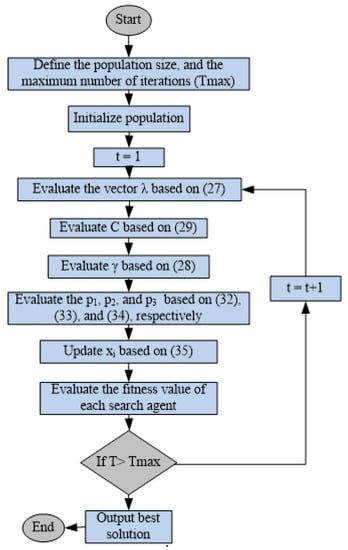
Figure 7.
Flowchart of the HBO algorithm.
5.2. GWO Algorithm
The GWO algorithm mimics the hunting mechanism and leadership hierarchy of the society of grey wolves [50]. Grey wolves can be sorted into four categories. The first class is the leader, which is called alpha (α), and is considered the best wolf as well as being accountable for making decisions concerning the regulation of the community, especially during the striking of prey. The other members of the community must comply and follow the orders of the group leader. The second category is called beta (β), which observes the remaining wolves of the group and ensures that they follow instructions. Beta grey wolves participate in chasing the prey. Beta wolves are the major candidates to replace the leader in the future. The third category is the delta (δ) wolves. They have various jobs in the group, such as hunting, monitoring, and looking after unwell wolves. The other wolves are the omega (ω) wolves and they must obey and follow the α, β, and δ wolves [50]. A mathematical model for the chasing mechanism is expressed as follows:
where t denotes the current iteration, and represent the coefficient vectors, implies a vector that presents the position of the subjected prey, and symbolizes a vector describing the location of the grey wolf. and can be calculated by Equation (37).
where are the components of vector that increases from 2 to 0 in each iteration. and are randomly generated vectors in the range of [0, 1]. In the GWO technique, the wolves change their positions in the search space in a random motion around the prey, according to Equation (37). The first three α, β and δ wolves have good knowledge about the location of the prey. The initial three answers are also noted. Additionally, other search agents modify their position in accordance with the following equations based on the precise position of the most effective search agent:
The behavior that a search agent follows to update its location is depicted in Figure 8 based on Equations (38)–(40), in accordance with the location of the α, β, and δ wolves in the search field of the optimization problem [1]. According to the locations of the α, β and δ wolves, a suggested position was randomly generated in the search field and it was circulated by the positions of the α, β, and δ wolves. After the α, β, and δ wolves define the position of the prey, the other wolves shift places in relation to the prey. More information about the GWO algorithm is reported in [50].
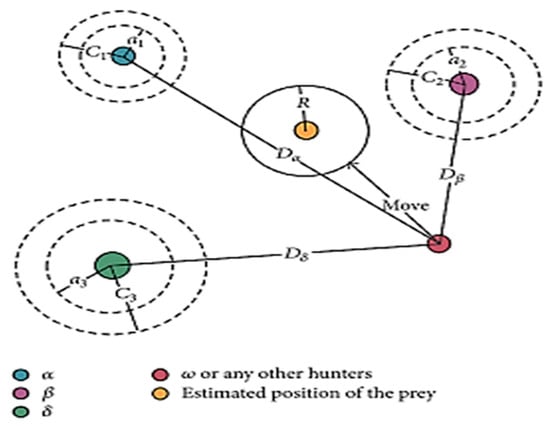
Figure 8.
Position updating in GWO.
6. Simulation Results and Discussion
In this part, the proposed isolated hybrid PV/WT/biomass/HPS energy system is investigated to evaluate the accuracy of the proposed metaheuristic optimization techniques, namely, GWO, HBO, and PSO. The problem of the optimal sizing of standalone hybrid RES comprising photovoltaic, wind turbine, biomass, and a hydro-pumped storage system was considered an optimization problem. The technical and economic specifications of the proposed hybrid components are listed in Table 1 [51]. In the present work, the lifetime of the proposed system was selected to be 25 years and the interest rate was assumed to be 6%. The commonly used MATLAB simulation environment was utilized to apply HBO, GWO, and PSO to solve this optimization problem. The optimization approach was implemented in 50 individual runs and the best solution of the optimization problem was taken according to the minimum value of the fitness function. The HBO, GWO, and PSO algorithms were applied, and statistical analysis based on various indices was conducted. For both algorithms, the maximum iterations were adjusted to be 100 and the number of search agents was 20.

Table 1.
Technical and economic specifications of the proposed system.
The convergence curves of the 50 executions for HBO, GWO, and PSO optimization methods are shown in Figure 9. Additionally, the best objective function values over the 50 runs are shown in Figure 10. The reader can obviously observe from Figure 9 and Figure 10 that the values of the OF achieved by HBO oscillate to a small extent and are roughly constant, which confirmed the stability and robustness of the HBO algorithm compared with the GWO and PSO algorithms.
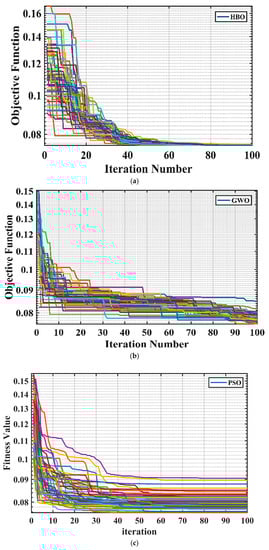
Figure 9.
Convergence trends over the 50 individual runs: (a) HBO algorithm, (b) GWO algorithm, and (c) PSO algorithm.
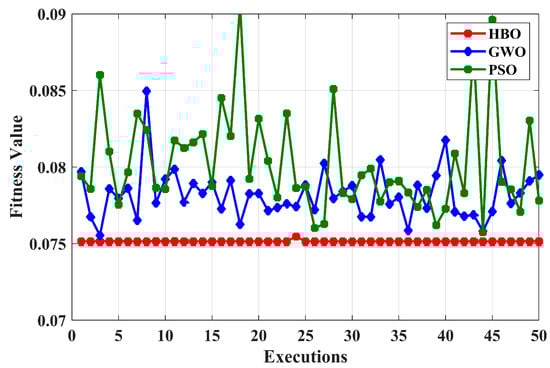
Figure 10.
Values of the objective function over the 50 individual runs.
Parametric and non-parametric statistical measures were computed to evaluate the accuracy of the two suggested algorithms. The statistical analysis and comparisons are based on different indices, such as the minimum, worst, and average values of the OF. The stability of the proposed algorithms was evaluated according to other metrics, such as standard deviation (), relative error (), mean absolute error (), root mean square error (), and efficiency (). Table 2 provides the calculated values of such indices. The results obtained from the statistical study prove the precision and robustness of the two proposed algorithms, while the HBO algorithm provides the best minimum value of the OF compared with the GWO and PSO algorithms.
Table 2.
Comparison of the statistical analysis of HBO, GWO, and PSO.
The convergence curves for the execution in which the best value of OF is produced are presented in Figure 11. The reader can clearly observe that the HBO algorithm succeeded in attaining the minimum objective function value of 0.0751 in 82 iterations. The obtained results of the optimal solution of the optimization problem and other evaluation variables such as NPC, COE, LPSP, and PEXC are shown in Table 3. Based on the results obtained by the HBO algorithm, the minimum COE at the proposed site was 0.2750 USD/kWh, which results in a NPC of USD 8,055,051.133 and LPSP of 0.03296, which fall within the defined criterion (), as well as satisfying the low dissipation of the excess energy in the dummy load, which equals to 0.017 of the annual load consumption.
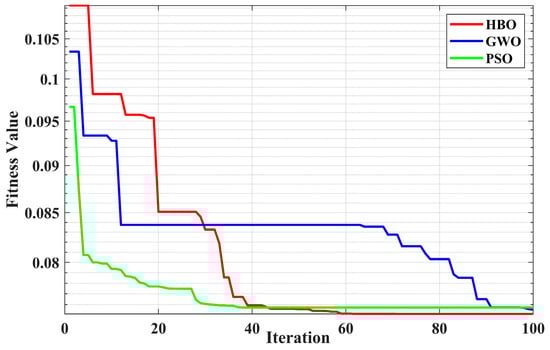
Figure 11.
Convergence curves for the best case for all algorithms.
Table 3.
The optimal sizes of the proposed system components based on HBO, GWO, and PSO.
After obtaining the optimal sizes of each component of the proposed hybrid system by using HBO, the operation of the proposed system for one year was investigated. The hourly changes in power produced by each component of the studied system are presented in Figure 12. The results shown in Figure 12 include the load power (Pload), the power supplied by the PV farm (PPV) and wind farm (PWT), the power generated by the biomass generator (PBG), the power consumption in the motoring mode (PP), the power produced in the generating mode (PH). The stored water in the tank as a percentage of its maximum volume (SOC) is presented in Figure 13, and the excess power dissipated in the dummy load power (Pdummy) is shown in Figure 14. The quantity of water raised to the upper tank (QP) is presented in Figure 15, while the quantity of water discharged from the upper reservoir in the case when the power generated from the renewable sources is less than the load demand is presented in Figure 16. It is observed from Figure 12 that the generated energy from the renewable energy resources (PV, WT, and biomass) is enough to meet the load and store the extra generated energy in the form of potential energy in the upper reservoir to be reused again during low generation from the RE resources. Additionally, the system works in a balanced mode as the power consumed by the dummy load is small and continued for a short duration in the year.
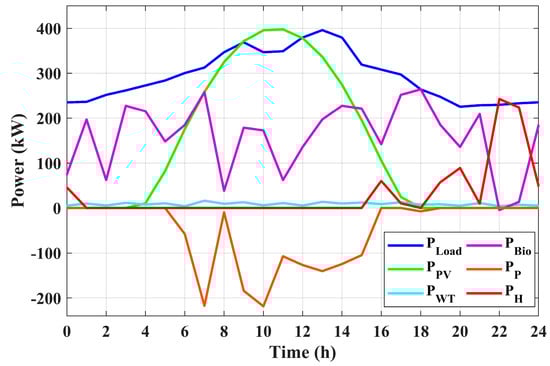
Figure 12.
Operation of the proposed hybrid system based on the results of the HBO algorithm.
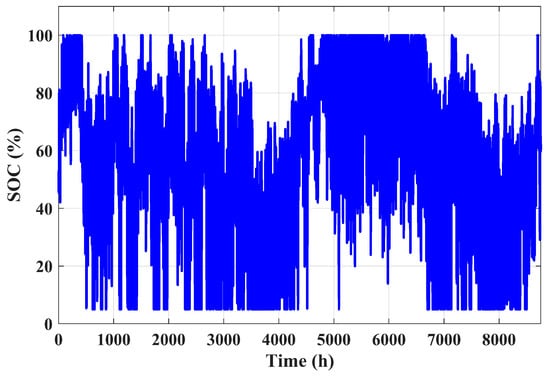
Figure 13.
The percentage of the amount of water stored in the upper tank.
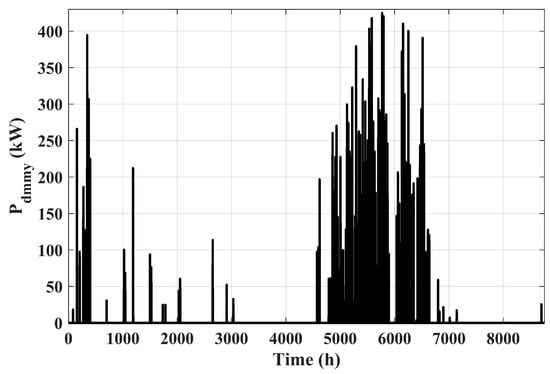
Figure 14.
Power dissipated in the dummy load.
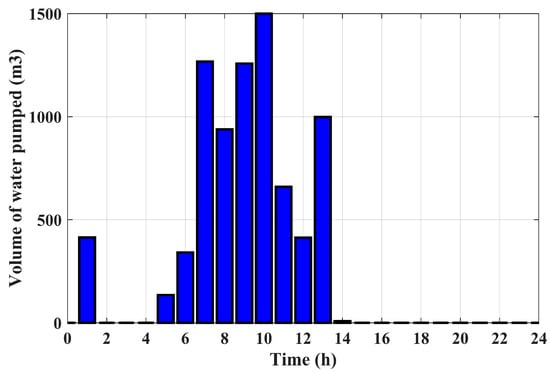
Figure 15.
Amount of water pumped to the upper tank per hour.
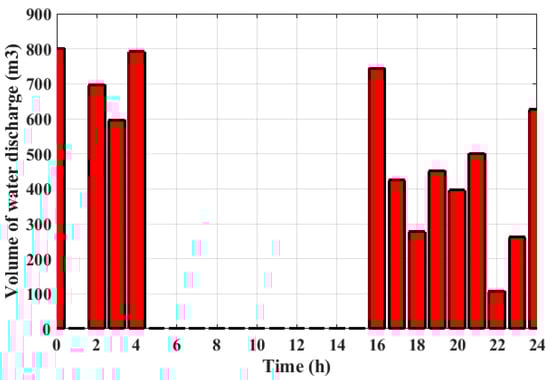
Figure 16.
Amount of water drawn from the tank per hour.
The impact of each system component on the net present cost is provided in Figure 17, from which it is clearly evident that the upper reservoir has the highest share in the annual cost of the system. The division of each cost type between the different generating technologies is provided in Figure 18. It is shown that the capital cost is the highest and specifically that of the tank is the highest compared to that of the other system components. The division of the annual cost of each system component according to the cost type is presented in Figure 19.
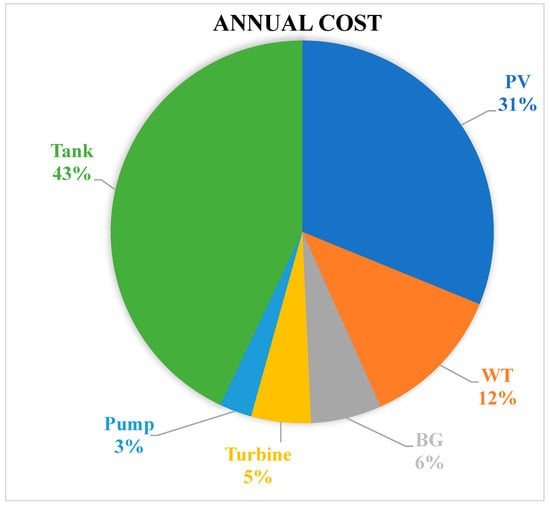
Figure 17.
Share of the annual cost between the different technologies.
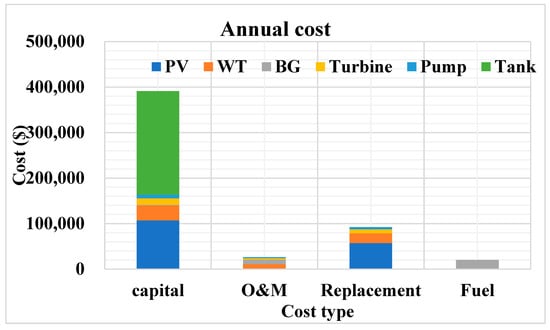
Figure 18.
Division of each cost type according to the different technologies.
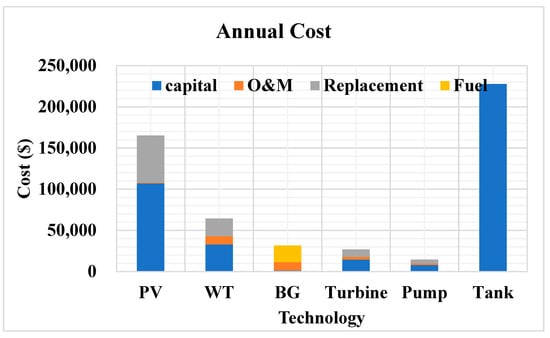
Figure 19.
Division of the annual cost for each technology according to the cost type.
The advantages of constructing such a mixed renewable energy production system are examined in this section along with the opportunity costs of not erecting a conventional facility to meet the load demand under consideration. With a 25-year study period, it is predicted that the suggested system covers the annual energy consumption of 2.2913 million kWh. Recommended traditional power plants should have an average power of 265 kW. The opportunity costs are broken down into different costs: the social cost of carbon, fuel usage, pollution, and methane.
Social cost of Carbon: Numerous studies were conducted by the Environmental Protection Agency to determine how much each extra tons of carbon released into the atmosphere would cost. The cost was determined according to the negative effects on human health, agricultural productivity, anticipated damage from flooding, and variations in the prices of heating and air conditioning facilities. The organization calculated that carbon costs USD 40 per metric ton [52]. The Energy Information Administration reported that 2.15 pounds of carbon dioxide are released into the atmosphere for each kWh generated by a traditional station that burns coal [53]. In this research, 2234.65 metric tons of carbon dioxide were produced equivalently. As a result, it was calculated that the annual cost of carbon for coal is about USD 89,381.299. When natural gas is used as a fuel, it is believed that 1.21 pounds of carbon dioxide are released into the atmosphere for every kWh. The amount of carbon dioxide released for the system under study is 1257.579 metric tons. As a result, the expense of carbon for natural gas is roughly USD 50,303.19 per year.
Fuel usage costs: In its reports, the Energy Information Administration (EIA) lists the typical prices of coal and natural gas as well as the quantities required to produce 1 kWh in thermal power plants. The aforementioned numbers show that, in order to produce 1 kWh of electricity, 0.05 pounds of coal or 10.1 cubic feet of natural gas are needed [52]. This research used the average of coal and natural gas prices over the previous ten years. The yearly fuel expense for coal was, therefore, USD 128,095.58 and for natural gas USD 256,021.076.
Pollutant cost: The cost of extra non-climate pollution caused by the use of coal and natural gas in power systems was the subject of a study conducted by the Harvard Medical School Center for Health and Global Environments. The Energy and Policy Institute estimated these costs for coal and natural gas at USD 0.178/kWh and USD 0.0016/kWh, respectively, in light of the findings of this research [54]. Applying these prices to the system under consideration yields an estimated annual pollutant cost for coal and natural gas of USD 407,851.4 and USD 3666.08, respectively, for 2.2193 million kWh.
Social cost of Methane: Every extra ton of methane released into the atmosphere was estimated to cost USD 810 by the National Center for Environmental Economics. As was previously stated, 10.1 cubic feet of natural gas are required to produce 1 kWh of electricity [52]. The amount of natural gas needed by the thermal power plant was calculated using the entire number of kWh (2.2913 million kWh) required to meet the load demand in the case study. According to the Environmental Protection Agency, 2% of the natural gas used to produce electricity is lost, and this quantity is then converted to methane emissions. Therefore, a thermal power plant uses 1.02 of the prior value to produce the necessary number of kWh. The power facility thus extracts 23,604,972.6 cubic feet of natural gas. A total of 472,099.45 cubic feet makes up the two percent loss in output. The amount of methane released is equal to 80% of that number, or 377,679.56 cubic feet of methane, or 7.7505 metric tons. So, it is calculated that methane costs USD 6277.936 per year.
7. Conclusions
In this paper, the optimal design of an isolated solar PV/wind turbine/biomass/hydro-pumped storage energy system for a real case study located in the Ataka region in Egypt was studied. In this work, three different optimization techniques, i.e., HBO, GWO, and PSO, were suggested to obtain the optimal sizing of the proposed system, while the objective was to minimize the cost of the generated kWh units with high-power-supply reliability. In addition, statistical analyses were conducted to validate the effectiveness and robustness of the used algorithms. The simulation results obtained by applying these two algorithms were comprehensively compared. The obtained results confirm the goodness and robustness of HBO algorithm in addressing this optimization problem as it succeeds in reaching the minimum objective function value of 0.0751 in 82 iterations compared with the GWO algorithm, which reaches the objective function value of 0.0755 in 99 iterations. In addition, the results clarify that the HBO algorithm succeeded in obtaining the best design for the selected RE system with the minimum COE 0.2750 USD/kWh and NPC of USD 8,055,051. This work can help decision makers in Egypt to increase the penetration level of such intermittent RES and ensure the full-time supply of electrical energy.
Due to the study’s exclusion of many factors, including energy loss, transmission loss, and system malfunction, the results are approximate rather than exact. It calls for more expensive and high-efficiency numerical facilities than those that are presently being used for the present study. Despite these limitations, a variety of theoretical conclusions that were near to the factual conclusions were produced.
In order to provide comparable findings in other applications, particularly for various load typologies and meteorological conditions, this procedure is suggested as a standard for the subsequent stage of research. More sustainable criteria, such as component level analyses, which can aid in the construction of rural networks, smart towns, and anticipated demand predictions, can be added to the suggested approach.
Author Contributions
Conceptualization, H.M.S. and A.S.M.; methodology, M.K.; software, H.M.S.; validation, A.S.M., H.M.S. and K.R.K.; formal analysis, H.M.S.; investigation, H.M.; resources, I.O.H.; data curation, H.M.; writing—original draft preparation, A.S.M.; writing—review and editing, H.M.S.; visualization, K.R.K.; supervision, I.O.H.; project administration, M.K.; funding acquisition, M.K. All authors have read and agreed to the published version of the manuscript.
Funding
This research received no external funding.
Data Availability Statement
Data is unavailable due to privacy.
Acknowledgments
The authors would also like to acknowledge the support received from Saudi Data and AI Authority (SDAIA) and King Fahd University of Petroleum and Minerals (KFUPM) under SDAIA-KFUPM Joint Research Center for Artificial Intelligence Grant No. JRC-AI-RFP-08.
Conflicts of Interest
The authors declare no conflict of interest.
References
- Goedecke, M.; Therdthianwong, S.; Gheewala, S.H. Life cycle cost analysis of alternative vehicles and fuels in Thailand. Energy Policy 2007, 35, 3236–3246. [Google Scholar] [CrossRef]
- Ellabban, O.; Abu-Rub, H.; Blaabjerg, F. Renewable energy resources: Current status, future prospects and their enabling technology. Renew. Sustain. Energy Rev. 2014, 39, 748–764. [Google Scholar] [CrossRef]
- Diab, A.A.Z.; Sultan, H.M.; Kuznetsov, O.N. Optimal sizing of hybrid solar/wind/hydroelectric pumped storage energy system in Egypt based on different meta-heuristic techniques. Environ. Sci. Pollut. Res. 2020, 27, 32318–32340. [Google Scholar] [CrossRef] [PubMed]
- Sultan, H.M.; Menesy, A.S.; Kamel, S.; Alghamdi, A.S.; Zohdy, M. Optimal Sizing of Isolated Hybrid PV/WT/FC System Using Manta Ray Foraging Optimization Algorithm. Int. Trans. J. Eng. Manag. Appl. Sci. Technol. 2020, 11, 1–12. [Google Scholar]
- Alfakih, N.M.; Menesy, A.S.; Wang, P.; Ali, M.A.; Sultan, H.M.; Mosaad, M.I.; Kamel, S. Efficiency Improvement of Solar Cells by Coating with Chlorophyll and Different Types of Oils. In Proceedings of the 2021 IEEE International Conference on Automation/XXIV Congress of the Chilean Association of Automatic Control (ICA-ACCA), Online, 22–26 March 2021; IEEE: Piscataway, NJ, USA, 2021; pp. 1–6. [Google Scholar]
- Ishraque, M.F.; Shezan, S.A.; Ali, M.; Rashid, M. Optimization of load dispatch strategies for an islanded microgrid connected with renewable energy sources. Appl. Energy 2021, 292, 116879. [Google Scholar] [CrossRef]
- Sultan, H.M.; Kuznetsov, O.N.; Menesy, A.S.; Kamel, S. Optimal configuration of a grid-connected hybrid PV/wind/hydro-pumped storage power system based on a novel optimization algorithm. In Proceedings of the 2020 International Youth Conference on Radio Electronics, Electrical and Power Engineering (REEPE), Moscow, Russia, 12–14 March 2020; IEEE: Piscataway, NJ, USA, 2020; pp. 1–7. [Google Scholar]
- Xu, D.; Kang, L.; Chang, L.; Cao, B. Optimal sizing of standalone hybrid wind/PV power systems using genetic algorithms. In Proceedings of the Canadian Conference on Electrical and Computer Engineering, Saskatoon, SK, Canada, 1–4 May 2005; IEEE: Piscataway, NJ, USA, 2005; pp. 1722–1725. [Google Scholar]
- Barik, A.K.; Jaiswal, S.; Das, D.C. Recent trends and development in hybrid microgrid: A review on energy resource planning and control. Int. J. Sustain. Energy 2022, 41, 308–322. [Google Scholar] [CrossRef]
- Abd El-Sattar, H.; Sultan, H.M.; Kamel, S.; Menesy, A.S.; Rahmann, C. Optimal design of hybrid stand-alone microgrids using tunicate swarm algorithm. In Proceedings of the 2021 IEEE International Conference on Automation/XXIV Congress of the Chilean Association of Automatic Control (ICA-ACCA), Online, 22–26 March 2021; IEEE: Piscataway, NJ, USA, 2021; pp. 1–6. [Google Scholar]
- Diab, A.A.Z.; Sultan, H.M.; Mohamed, I.S.; Kuznetsov, O.N.; Do, T.D. Application of different optimization algorithms for optimal sizing of PV/wind/diesel/battery storage stand-alone hybrid microgrid. IEEE Access 2019, 7, 119223–119245. [Google Scholar] [CrossRef]
- Sultan, H.M.; Menesy, A.S.; Kamel, S.; Alghamdi, A.S.; Rahmann, C. Optimal design of a grid-connected hybrid photovoltaic/wind/fuel cell system. In Proceedings of the 2020 IEEE Electric Power and Energy Conference (EPEC), Edmonton, AB, Canada, 9–10 November 2020; IEEE: Piscataway, NJ, USA, 2020; pp. 1–6. [Google Scholar]
- Al-qadasi, D.M.; Menesy, A.S.; Wang, P.; Alfakih, N.M.; Zhang, Q.; Mosaad, M.I.; Kamel, S. Study on Preparation Method of Heat-Insulated Super-Hydrophobic Film and Improvement of Photovoltaic Modules Efficiency. In Proceedings of the 2021 IEEE International Conference on Automation/XXIV Congress of the Chilean Association of Automatic Control (ICA-ACCA), Online, 22–26 March 2021; IEEE: Piscataway, NJ, USA, 2021; pp. 1–5. [Google Scholar]
- León, L.M.; Romero-Quete, D.; Merchán, N.; Cortés, C.A. Optimal design of PV and hybrid storage based microgrids for healthcare and government facilities connected to highly intermittent utility grids. Appl. Energy 2023, 335, 120709. [Google Scholar] [CrossRef]
- Thirunavukkarasu, M.; Sawle, Y.; Lala, H. A comprehensive review on optimization of hybrid renewable energy systems using various optimization techniques. Renew. Sustain. Energy Rev. 2023, 176, 113192. [Google Scholar] [CrossRef]
- Sawle, Y.; Gupta, S.; Bohre, A.K. Optimal sizing of standalone PV/Wind/Biomass hybrid energy system using GA and PSO optimization technique. Energy Procedia 2017, 117, 690–698. [Google Scholar] [CrossRef]
- Ma, T.; Yang, H.; Lu, L.; Peng, J. Optimal design of an autonomous solar–wind-pumped storage power supply system. Appl. Energy 2015, 160, 728–736. [Google Scholar] [CrossRef]
- Spyrou, I.D.; Anagnostopoulos, J.S. Design study of a stand-alone desalination system powered by renewable energy sources and a pumped storage unit. Desalination 2010, 257, 137–149. [Google Scholar] [CrossRef]
- Dong, W.; Li, Y.; Xiang, J. Optimal sizing of a stand-alone hybrid power system based on battery/hydrogen with an improved ant colony optimization. Energies 2016, 9, 785. [Google Scholar] [CrossRef]
- Ashari, M.; Suryoatmojo, H.; Robandi, I.; Hiyama, T. Optimal design of hydrogen based stand-alone wind/microhydro system using genetic algorithm. In Proceedings of the ICSIIT 2010, Bali, Indonesia, 1–2 July 2010; Volume 71. [Google Scholar]
- Upadhyay, S.; Sharma, M. Selection of a suitable energy management strategy for a hybrid energy system in a remote rural area of India. Energy 2016, 94, 352–366. [Google Scholar] [CrossRef]
- Akram, U.; Khalid, M.; Shafiq, S. An innovative hybrid wind-solar and battery-supercapacitor microgrid system—Development and optimization. IEEE Access 2017, 5, 25897–25912. [Google Scholar] [CrossRef]
- Khalid, M.; Ahmadi, A.; Savkin, A.V.; Agelidis, V.G. Minimizing the energy cost for microgrids integrated with renewable energy resources and conventional generation using controlled battery energy storage. Renew. Energy 2016, 97, 646–655. [Google Scholar] [CrossRef]
- Mohammadi, S.; Soleymani, S.; Mozafari, B. Scenario-based stochastic operation management of microgrid including wind, photovoltaic, micro-turbine, fuel cell and energy storage devices. Int. J. Electr. Power Energy Syst. 2014, 54, 525–535. [Google Scholar] [CrossRef]
- Ma, T.; Yang, H.; Lu, L. Feasibility study and economic analysis of pumped hydro storage and battery storage for a renewable energy powered island. Energy Convers. Manag. 2014, 79, 387–397. [Google Scholar] [CrossRef]
- Khan, A.; Javaid, N. Optimal sizing of a stand-alone photovoltaic, wind turbine and fuel cell systems. Comput. Electr. Eng. 2020, 85, 106682. [Google Scholar] [CrossRef]
- Ahmad, J.; Imran, M.; Khalid, A.; Iqbal, W.; Ashraf, S.R.; Adnan, M.; Ali, S.F.; Khokhar, K.S. Techno economic analysis of a wind-photovoltaic-biomass hybrid renewable energy system for rural electrification: A case study of Kallar Kahar. Energy 2018, 148, 208–234. [Google Scholar] [CrossRef]
- Samy, M.; Elkhouly, H.I.; Barakat, S. Multi-objective optimization of hybrid renewable energy system based on biomass and fuel cells. Int. J. Energy Res. 2021, 45, 8214–8230. [Google Scholar] [CrossRef]
- Sun, H.; Ebadi, A.G.; Toughani, M.; Nowdeh, S.A.; Naderipour, A.; Abdullah, A. Designing framework of hybrid photovoltaic-biowaste energy system with hydrogen storage considering economic and technical indices using whale optimization algorithm. Energy 2022, 238, 121555. [Google Scholar] [CrossRef]
- Zhang, K.; Pan, M.; Li, X. A novel efficient and economic integrated energy system based on solid oxide fuel cell with energy storage and carbon dioxide capture. Energy Convers. Manag. 2022, 252, 115084. [Google Scholar] [CrossRef]
- Akram, U.; Khalid, M.; Shafiq, S. Optimal sizing of a wind/solar/battery hybrid grid-connected microgrid system. IET Renew. Power Gener. 2018, 12, 72–80. [Google Scholar] [CrossRef]
- Owebor, K.; Diemuodeke, E.; Briggs, T. Thermo-economic and environmental analysis of integrated power plant with carbon capture and storage technology. Energy 2022, 240, 122748. [Google Scholar] [CrossRef]
- He, M.; Forootan Fard, H.; Yahya, K.; Mohamed, M.; Alhamrouni, V.; Awalin, L.J. Optimal design of hybrid renewable systems, including grid, PV, bio generator, diesel generator, and battery. Sustainability 2023, 15, 3297. [Google Scholar] [CrossRef]
- Okoduwa, E.O.; Imoedemhe, H.O.; Orukpe, P.E. Optimal sizing of a hybrid photovoltaic/fuel cell grid-connected power system including hydrogen storage. J. Adv. Sci. Eng. 2023, 8, 18–26. [Google Scholar]
- Muleta, V.; Badar, A.Q. Designing of an Optimal Standalone Hybrid Renewable Energy Micro-grid Model through Different Algorithms. J. Eng. Res. 2023, 11, 100011. [Google Scholar] [CrossRef]
- Ghobadpour, A.; Cardenas, A.; Monsalve, G.; Mousazadeh, H. Optimal Design of Energy Sources for a Photovoltaic/Fuel Cell Extended-Range Agricultural Mobile Robot. Robotics 2023, 12, 13. [Google Scholar] [CrossRef]
- Chisale, S.W.; Eliya, S.; Taulo, J. Optimization and design of hybrid power system using HOMER pro and integrated CRITIC-PROMETHEE II approaches. Green Technol. Sustain. 2023, 1, 100005. [Google Scholar] [CrossRef]
- Askari, Q.; Saeed, M.; Younas, I. Heap-based optimizer inspired by corporate rank hierarchy for global optimization. Expert Syst. Appl. 2020, 161, 113702. [Google Scholar] [CrossRef]
- Adam, S.P.; Alexandropoulos, S.A.N.; Pardalos, P.M.; Vrahatis, M.N. No free lunch theorem: A review. Approx. Optim. Algorithms 2019, 145, 57–82. [Google Scholar]
- Lei, G.; Song, H.; Rodriguez, D. Power generation cost minimization of the grid-connected hybrid renewable energy system through optimal sizing using the modified seagull optimization technique. Energy Rep. 2020, 6, 3365–3376. [Google Scholar] [CrossRef]
- El-Sattar, H.A.; Kamel, S.; Sultan, H.; Tostado-Véliz, M.; Eltamaly, A.M.; Jurado, F. Performance Analysis of a Stand-Alone PV/WT/Biomass/Bat System in Alrashda Village in Egypt. Appl. Sci. 2021, 11, 10191. [Google Scholar] [CrossRef]
- Salman, U.T.; Al-Ismail, F.S.; Khalid, M. Optimal sizing of battery energy storage for grid-connected and isolated wind-penetrated microgrid. IEEE Access 2020, 8, 91129–91138. [Google Scholar] [CrossRef]
- Sultan, H.M.; Menesy, A.S.; Kamel, S.; Korashy, A.; Almohaimeed, S.; Abdel-Akher, M. An improved artificial ecosystem optimization algorithm for optimal configuration of a hybrid PV/WT/FC energy system. Alex. Eng. J. 2021, 60, 1001–1025. [Google Scholar] [CrossRef]
- El-Sattar, H.A.; Kamel, S.; Jurado, F. Fixed bed gasification of corn stover biomass fuel: Egypt as a case study. Biofuels Bioprod. Biorefin. 2020, 14, 7–19. [Google Scholar] [CrossRef]
- Abd El-Sattar, H.; Kamel, S.; Vera, D.; Jurado, F. Tri-generation biomass system based on externally fired gas turbine, organic rankine cycle and absorption chiller. J. Clean. Prod. 2020, 260, 121068. [Google Scholar] [CrossRef]
- Eteiba, M.; Barakat, S.; Samy, M.; Wahba, W.I. Optimization of an off-grid PV/Biomass hybrid system with different battery technologies. Sustain. Cities Soc. 2018, 40, 713–727. [Google Scholar] [CrossRef]
- Alshammari, N.; Asumadu, J. Optimum unit sizing of hybrid renewable energy system utilizing harmony search, Jaya and particle swarm optimization algorithms. Sustain. Cities Soc. 2020, 60, 102255. [Google Scholar] [CrossRef]
- Sultan, H.M.; Diab, A.A.Z.; Oleg, N.K.; Irina, S.Z. Design and evaluation of PV-wind hybrid system with hydroelectric pumped storage on the National Power System of Egypt. Glob. Energy Interconnect. 2018, 1, 301–311. [Google Scholar]
- Khan, M.J.; Iqbal, M.T. Pre-feasibility study of stand-alone hybrid energy systems for applications in Newfoundland. Renew. Energy 2005, 30, 835–854. [Google Scholar] [CrossRef]
- Mirjalili, S.; Mirjalili, S.M.; Lewis, A. Grey wolf optimizer. Adv. Eng. Softw. 2014, 69, 46–61. [Google Scholar] [CrossRef]
- Alturki, F.A.; Awwad, E.M. Sizing and cost minimization of standalone hybrid wt/pv/biomass/pump-hydro storage-based energy systems. Energies 2021, 14, 489. [Google Scholar] [CrossRef]
- U.S. Energy Information Administration (EIA). Quarterly Coal Report (Abbreviated); EIA: Washington, DC, USA, 2015.
- Marten, A.L.; Newbold, S.C. Estimating the social cost of non-CO 2 GHG emissions: Methane and nitrous oxide. Energy Policy 2012, 51, 957–972. [Google Scholar] [CrossRef]
- U.S. Environmental Protection Agency (EPA). The Social Cost of Carbon; U.S. Environmental Protection Agency: Washington, DC, USA, 2019.


Disclaimer/Publisher’s Note: The statements, opinions and data contained in all publications are solely those of the individual author(s) and contributor(s) and not of MDPI and/or the editor(s). MDPI and/or the editor(s) disclaim responsibility for any injury to people or property resulting from any ideas, methods, instructions or products referred to in the content. |
© 2023 by the authors. Licensee MDPI, Basel, Switzerland. This article is an open access article distributed under the terms and conditions of the Creative Commons Attribution (CC BY) license (https://creativecommons.org/licenses/by/4.0/).