
The Evaluation of Torrefaction Efficiency for Lignocellulosic Materials Combined with Mixed Solid Wastes

Abstract
:1. Introduction
2. Materials and Methods
2.1. Biomass Collection
2.2. Torrefaction Procedure
2.3. Analytical Methods
2.3.1. Proximate and Ultimate Analyses
2.3.2. HHV, Mass Yield, Energy Density, and Energy Yield Analyses
2.3.3. Energy Returns on Investment Analysis
2.3.4. GHG Emissions
3. Results and Discussion
3.1. Effects of Torrefaction Temperature and Time on Obtained Biomaterial
3.1.1. Proximate and Ultimate Analyses
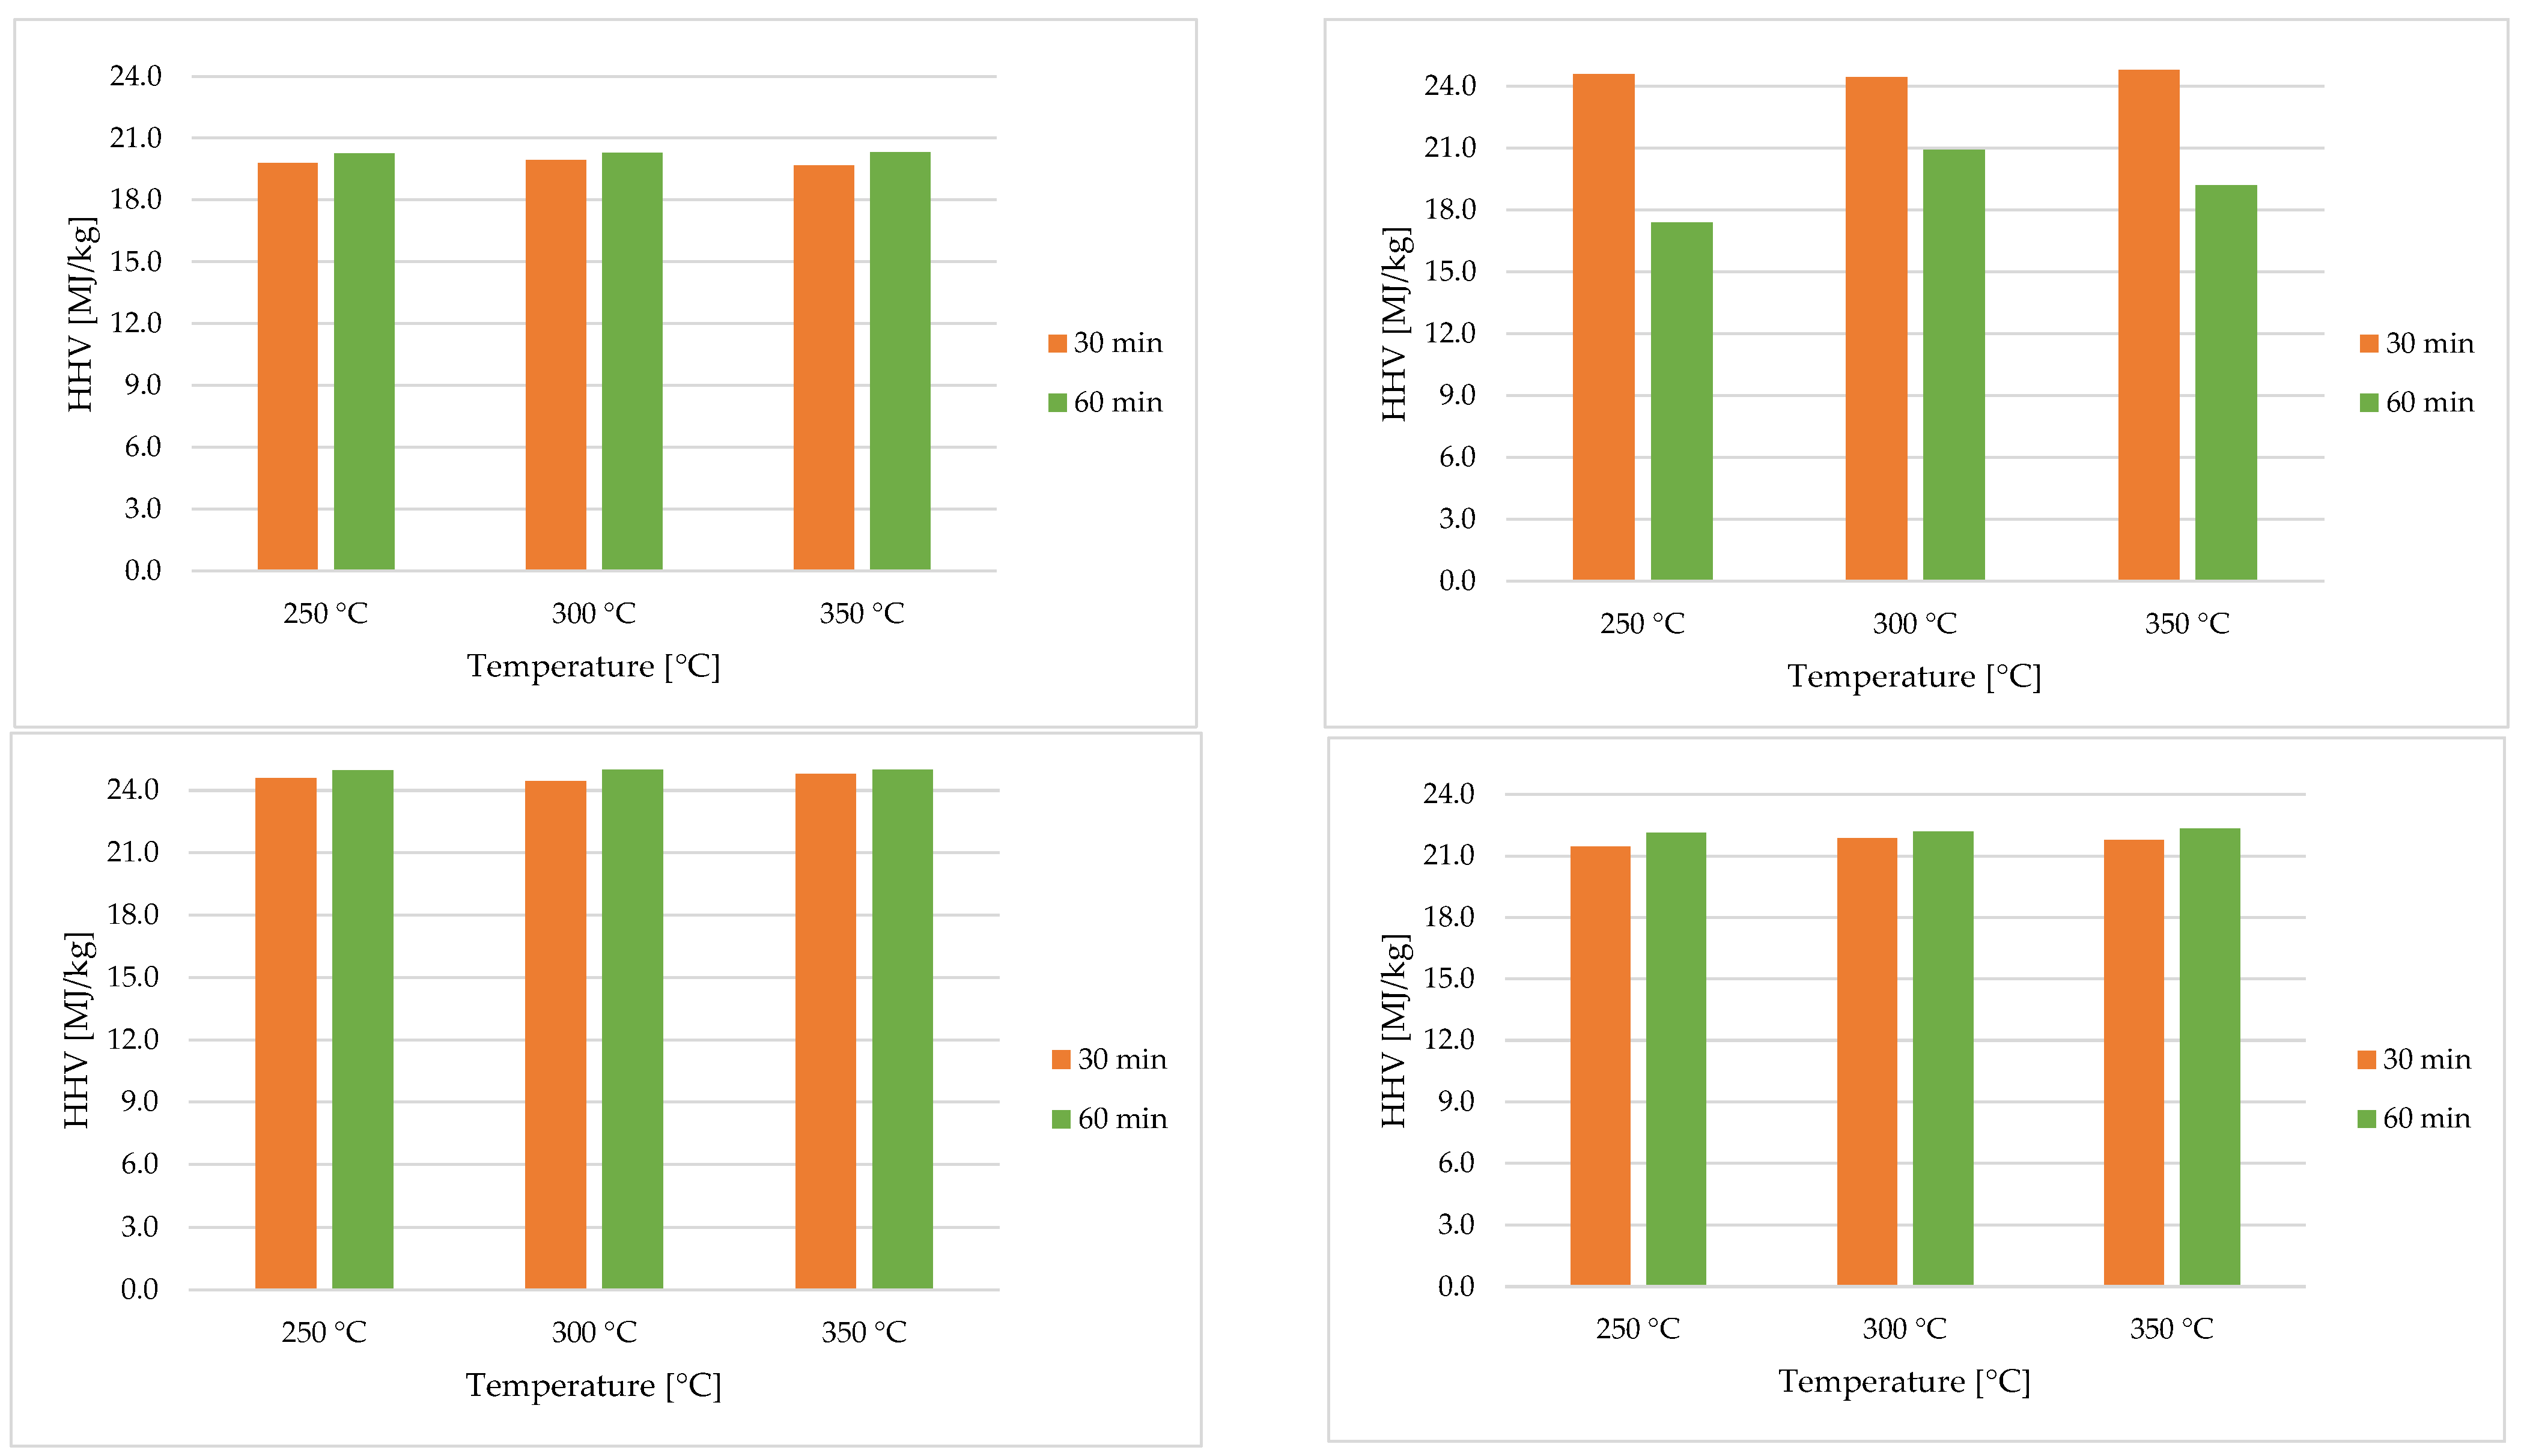
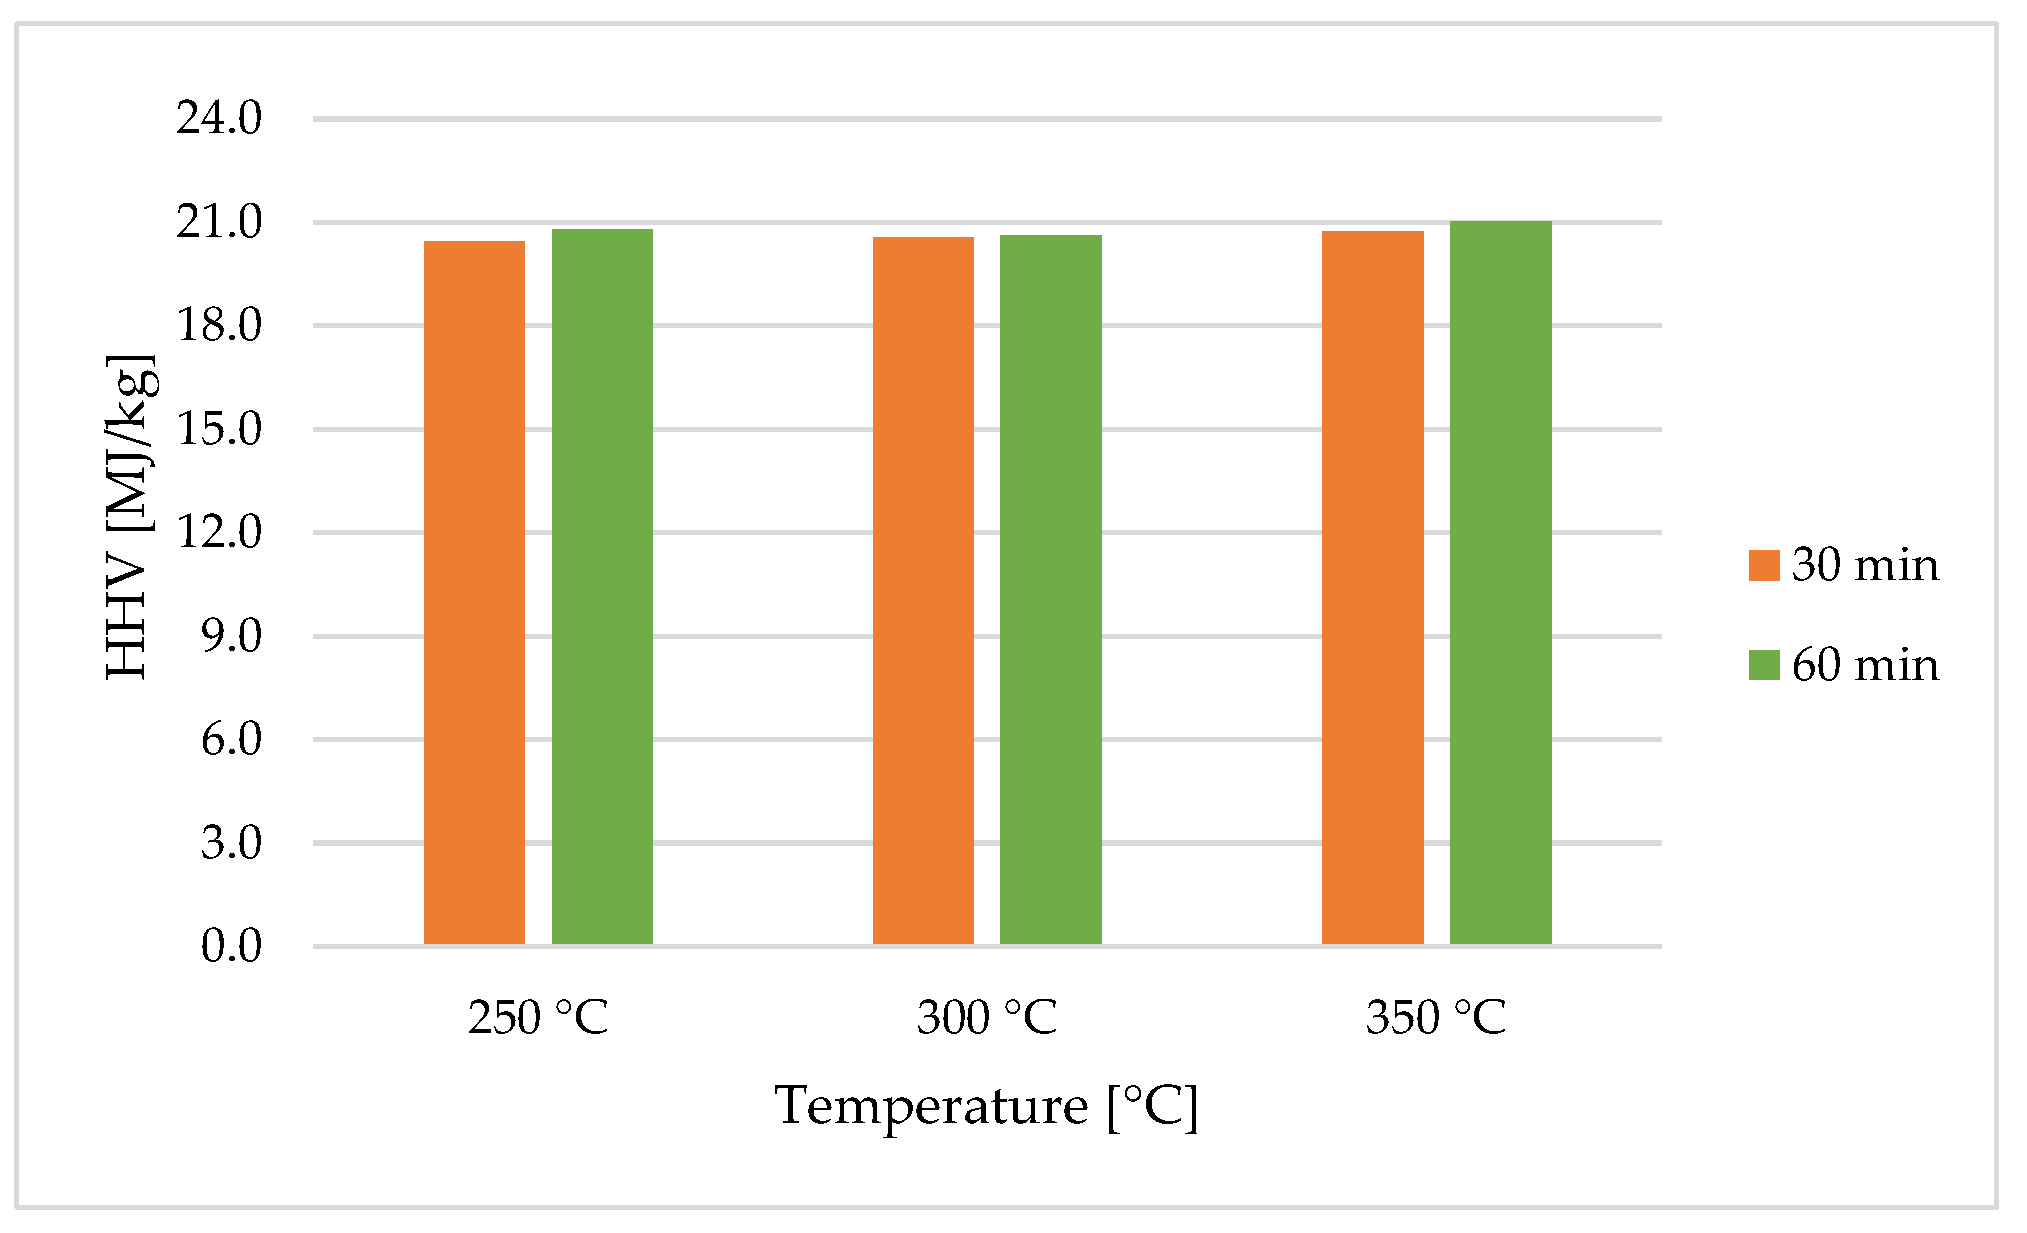
3.1.2. HHVs
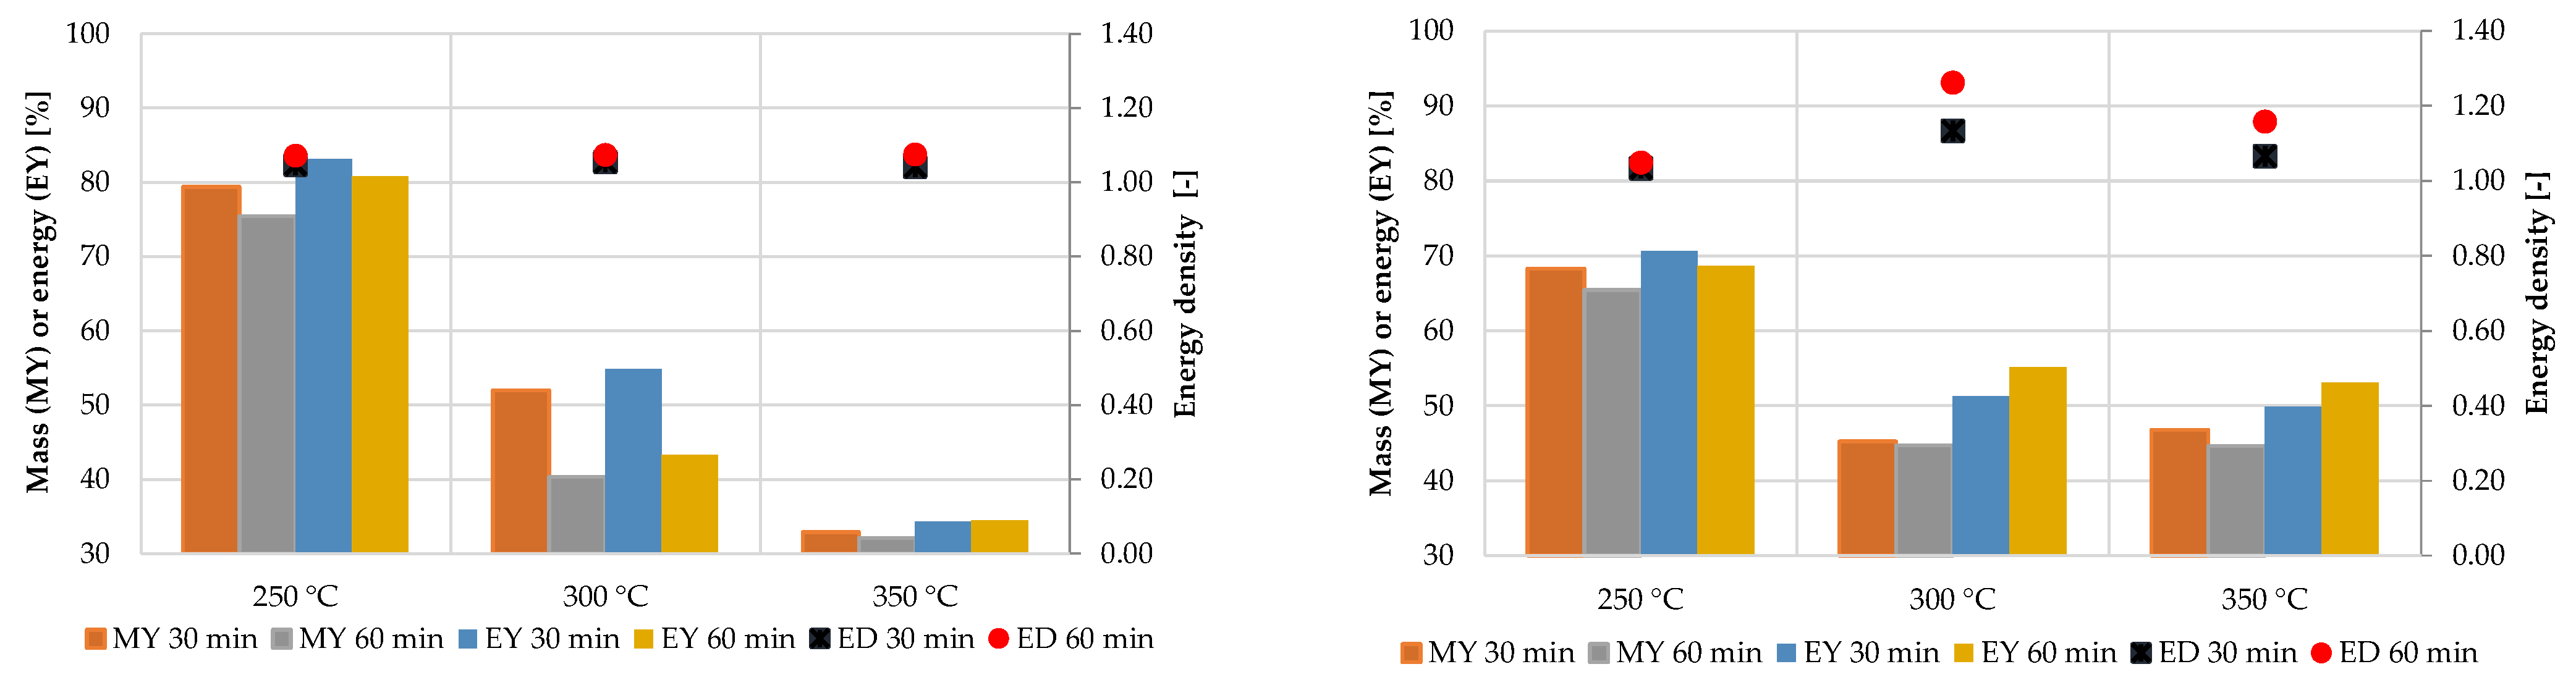
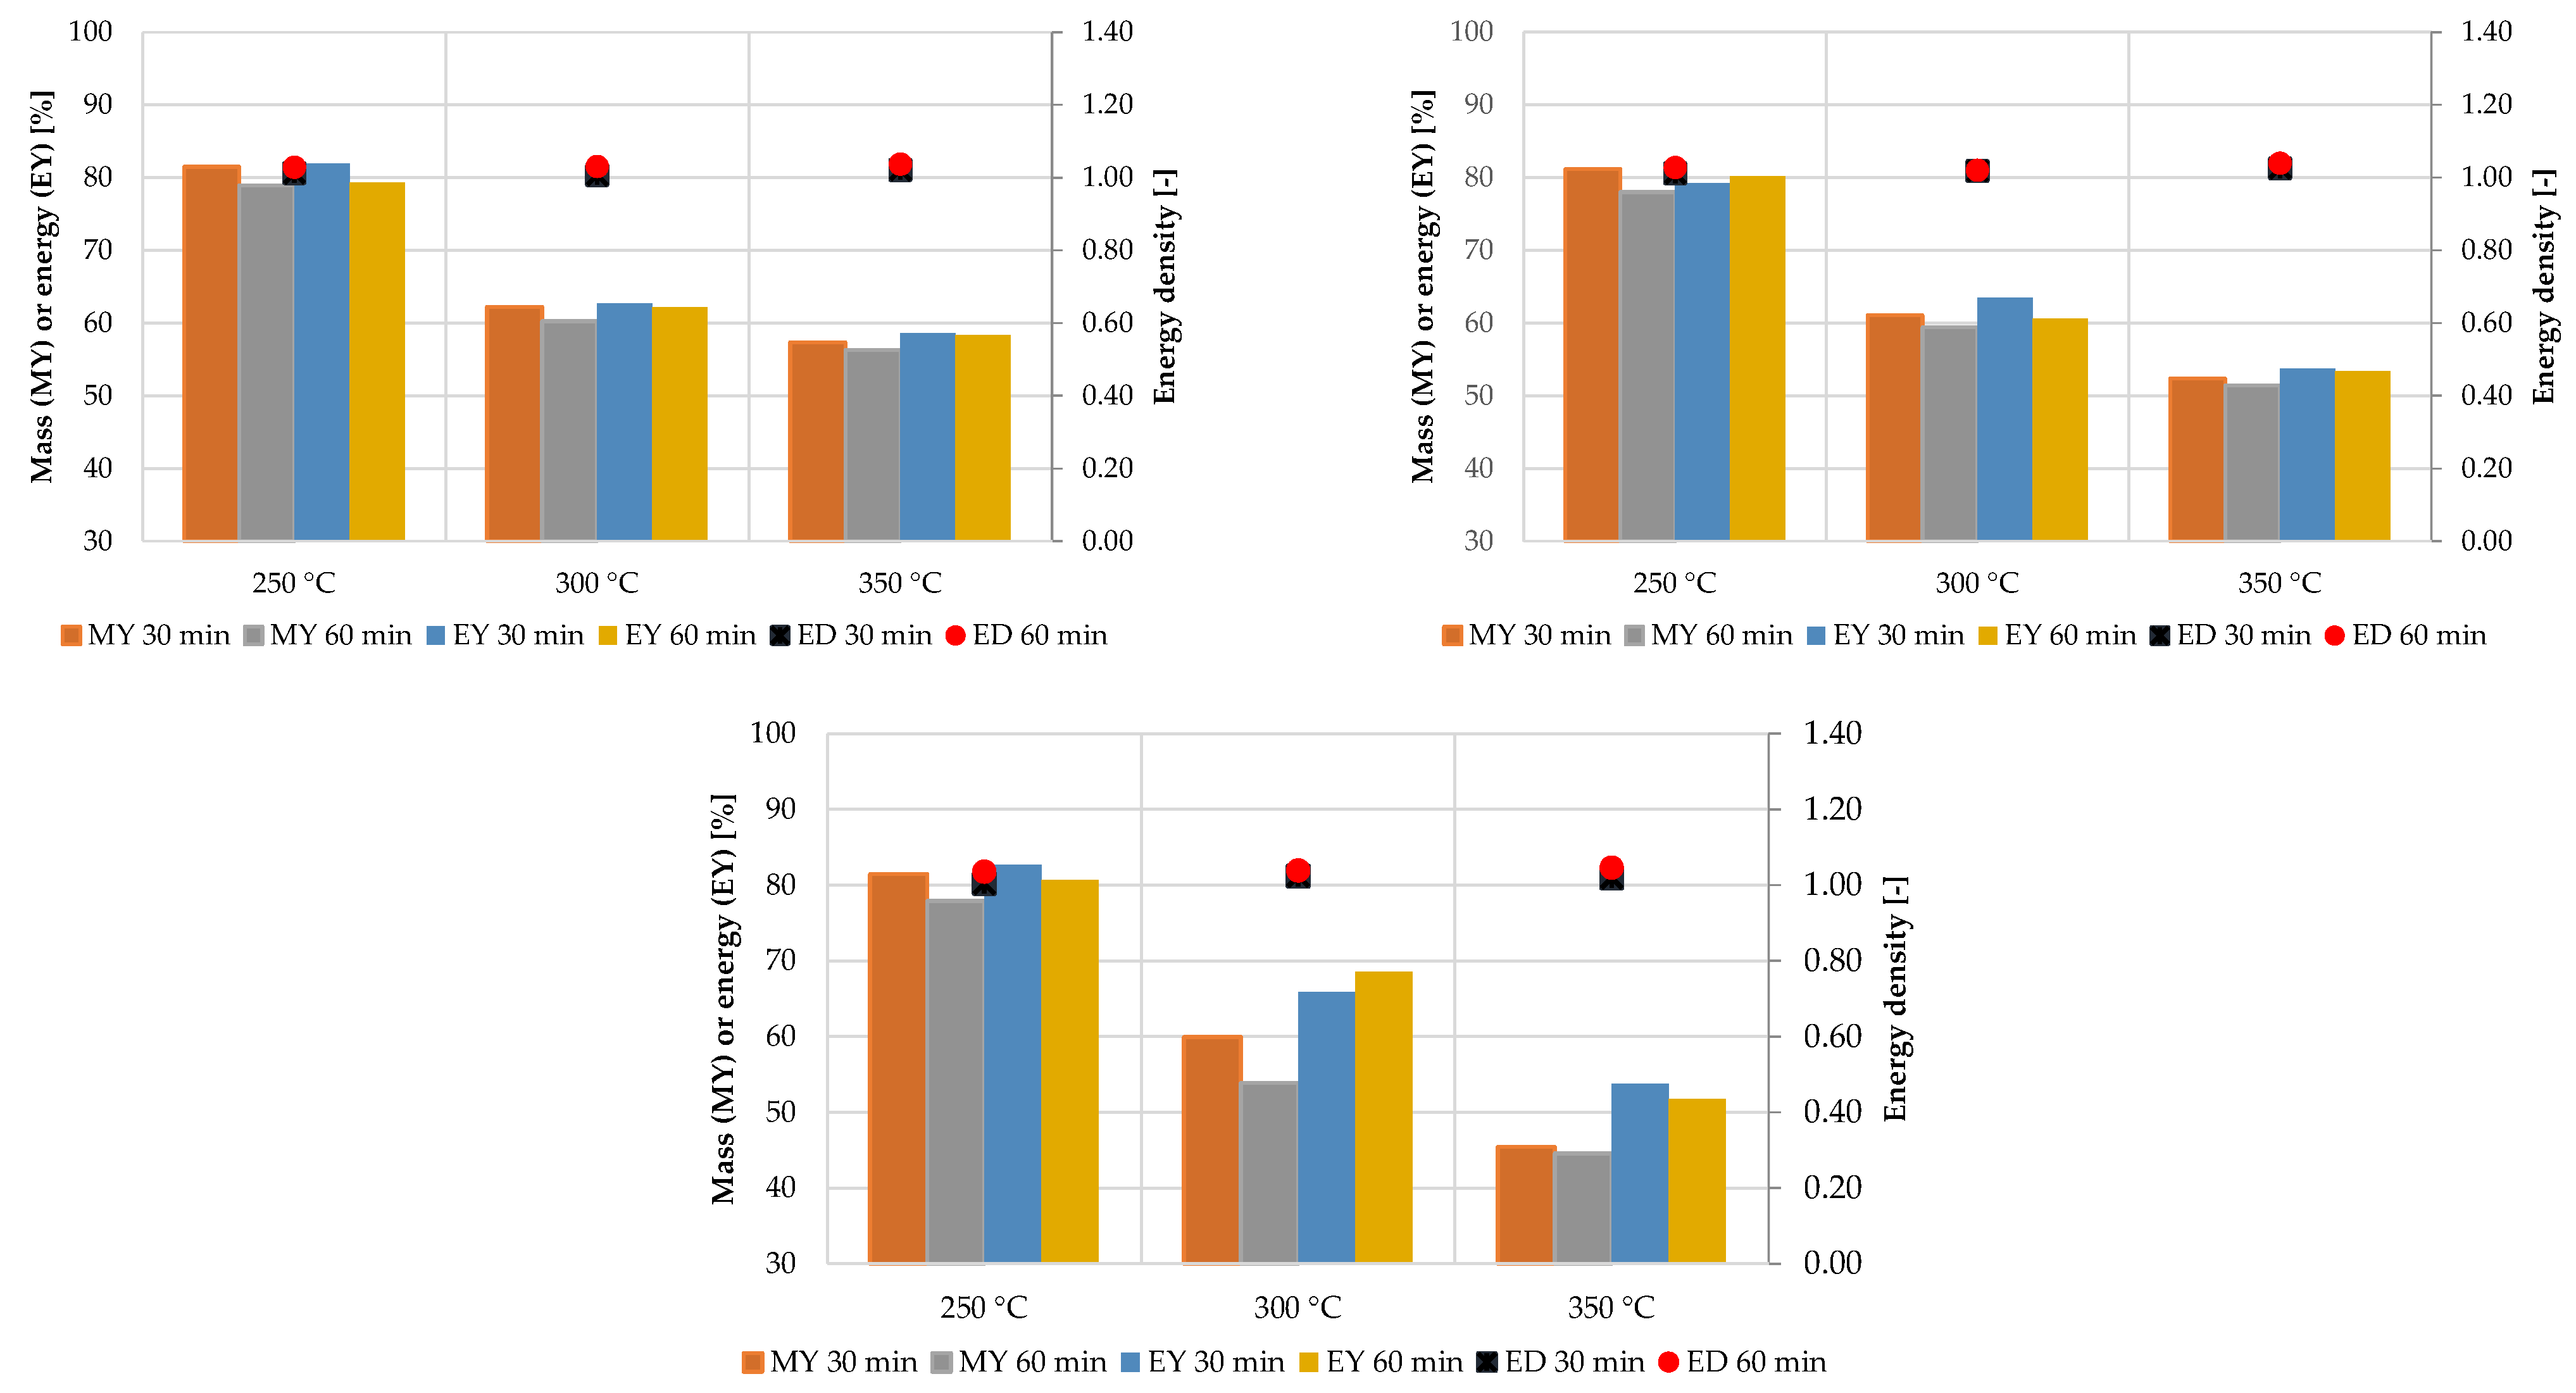
3.1.3. Mass Yield, Energy Yield, and Energy Density
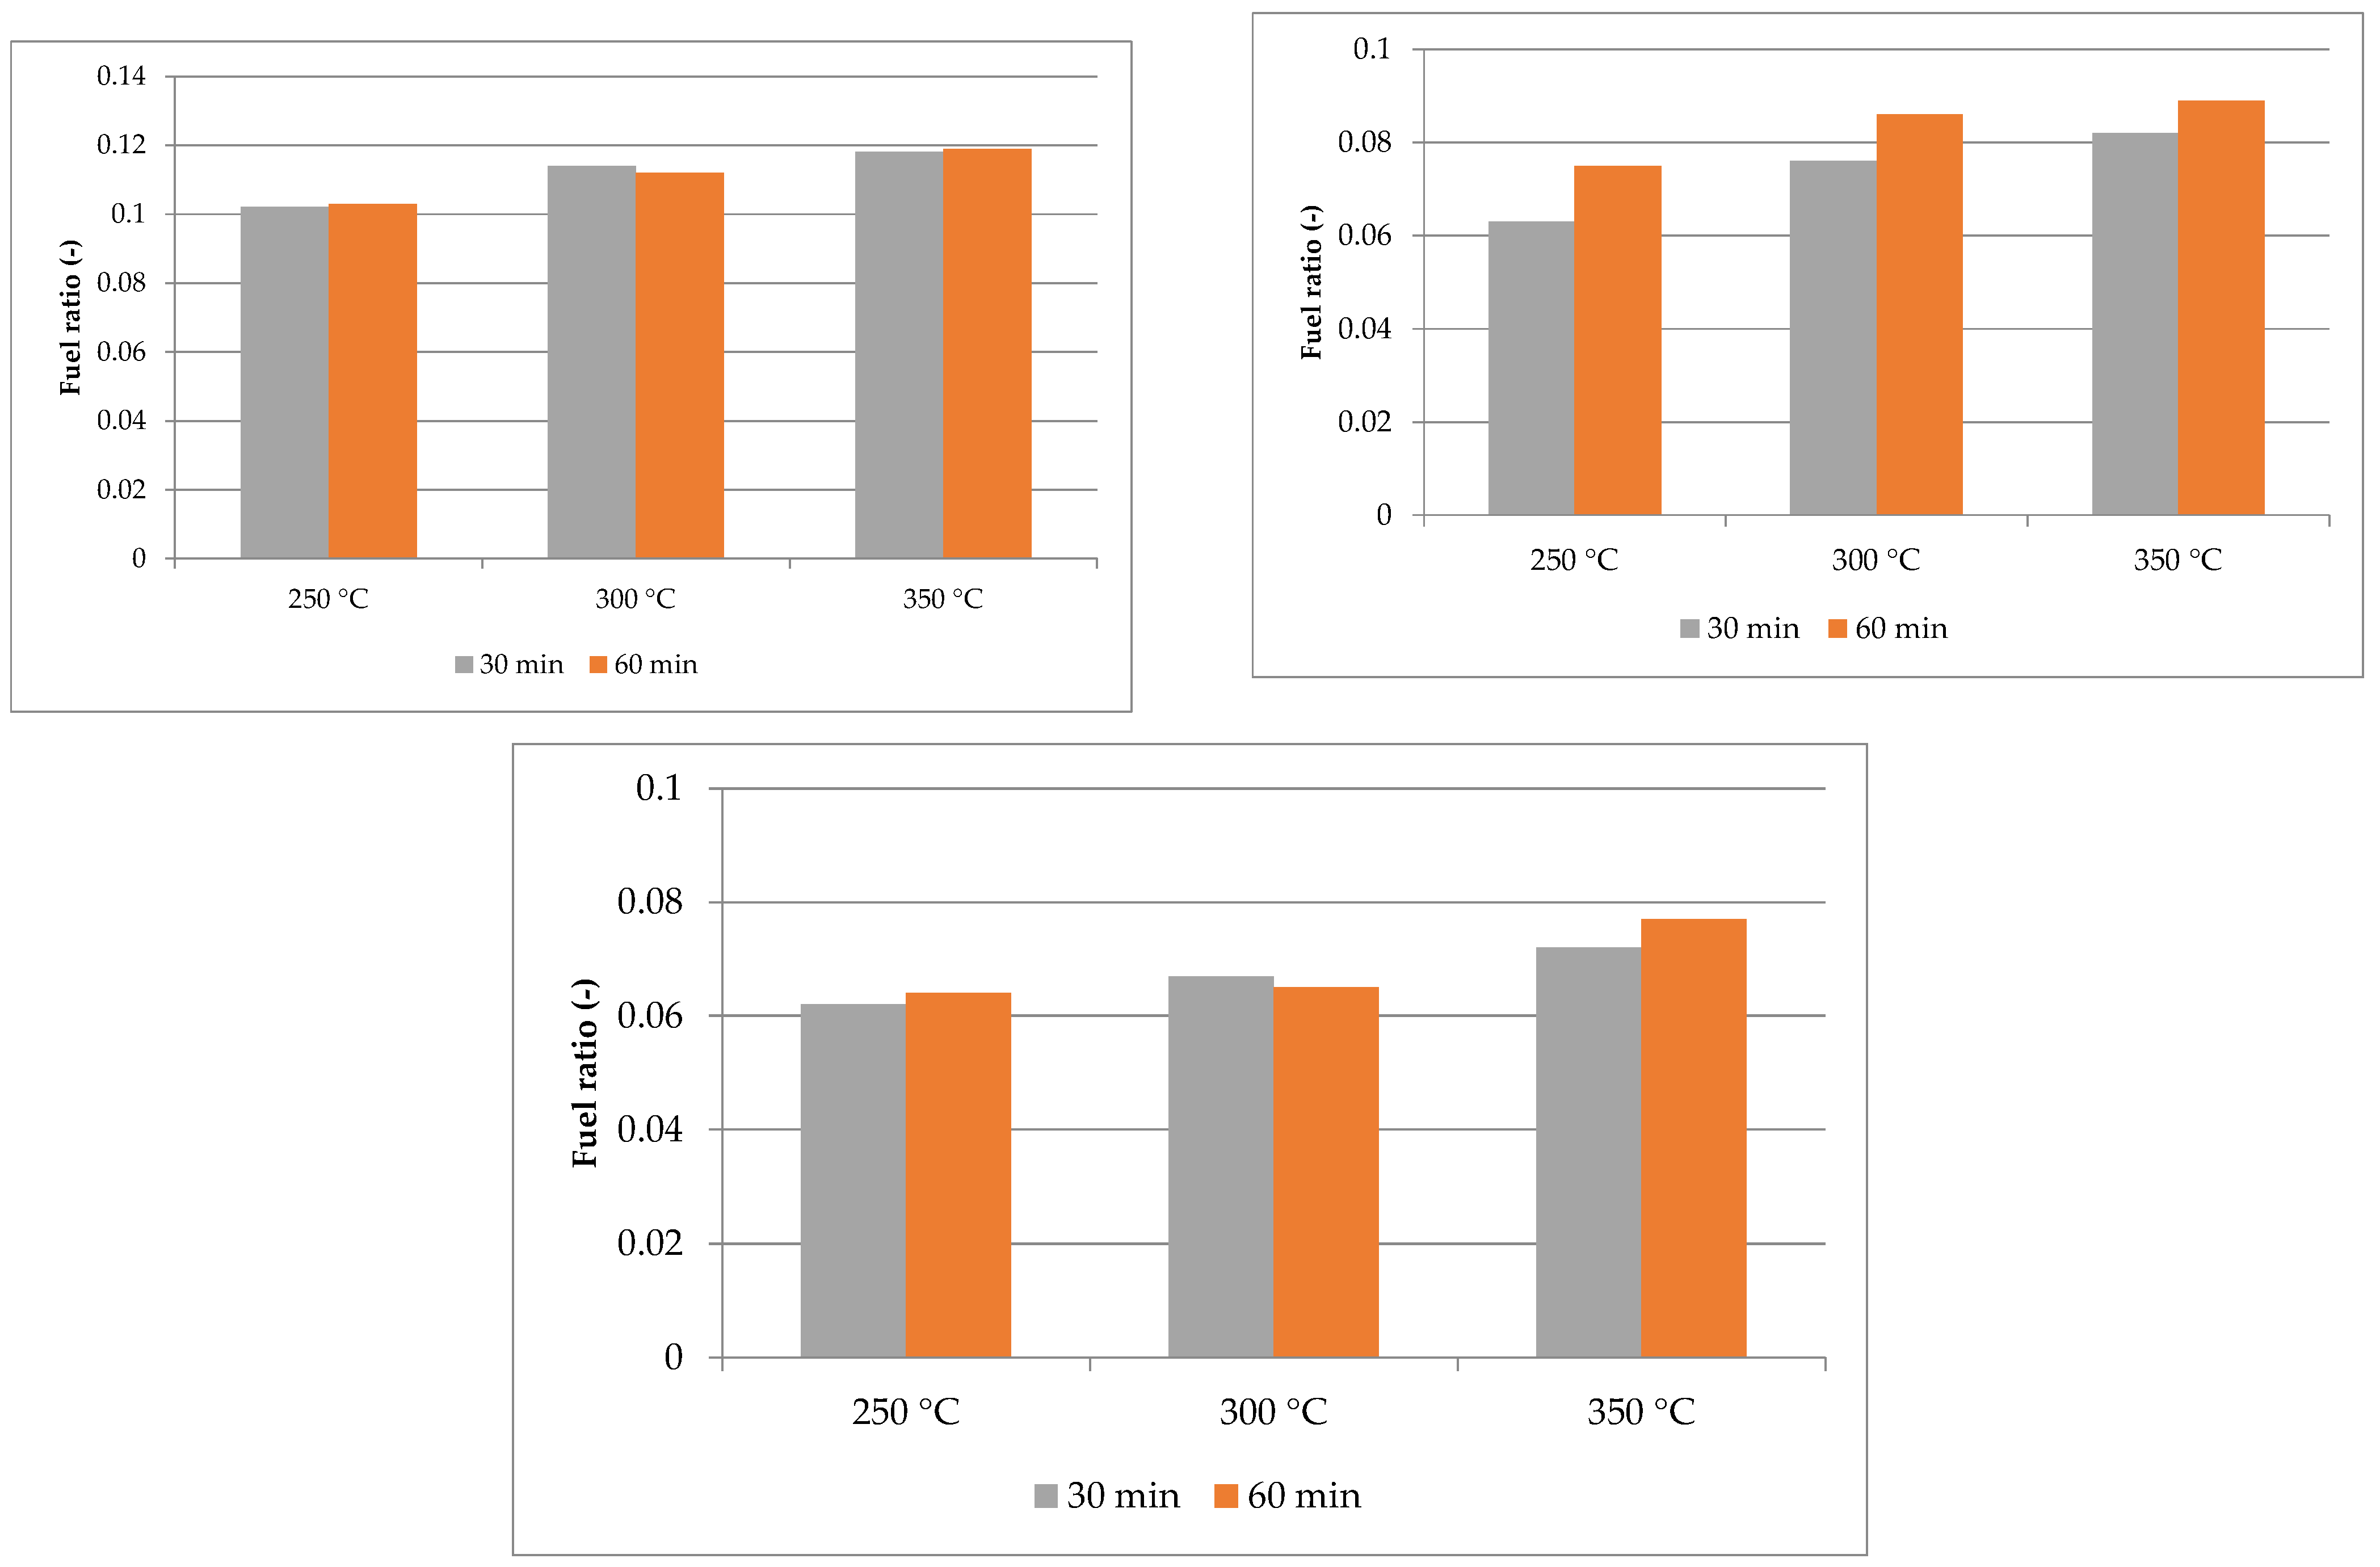
3.1.4. FR Results
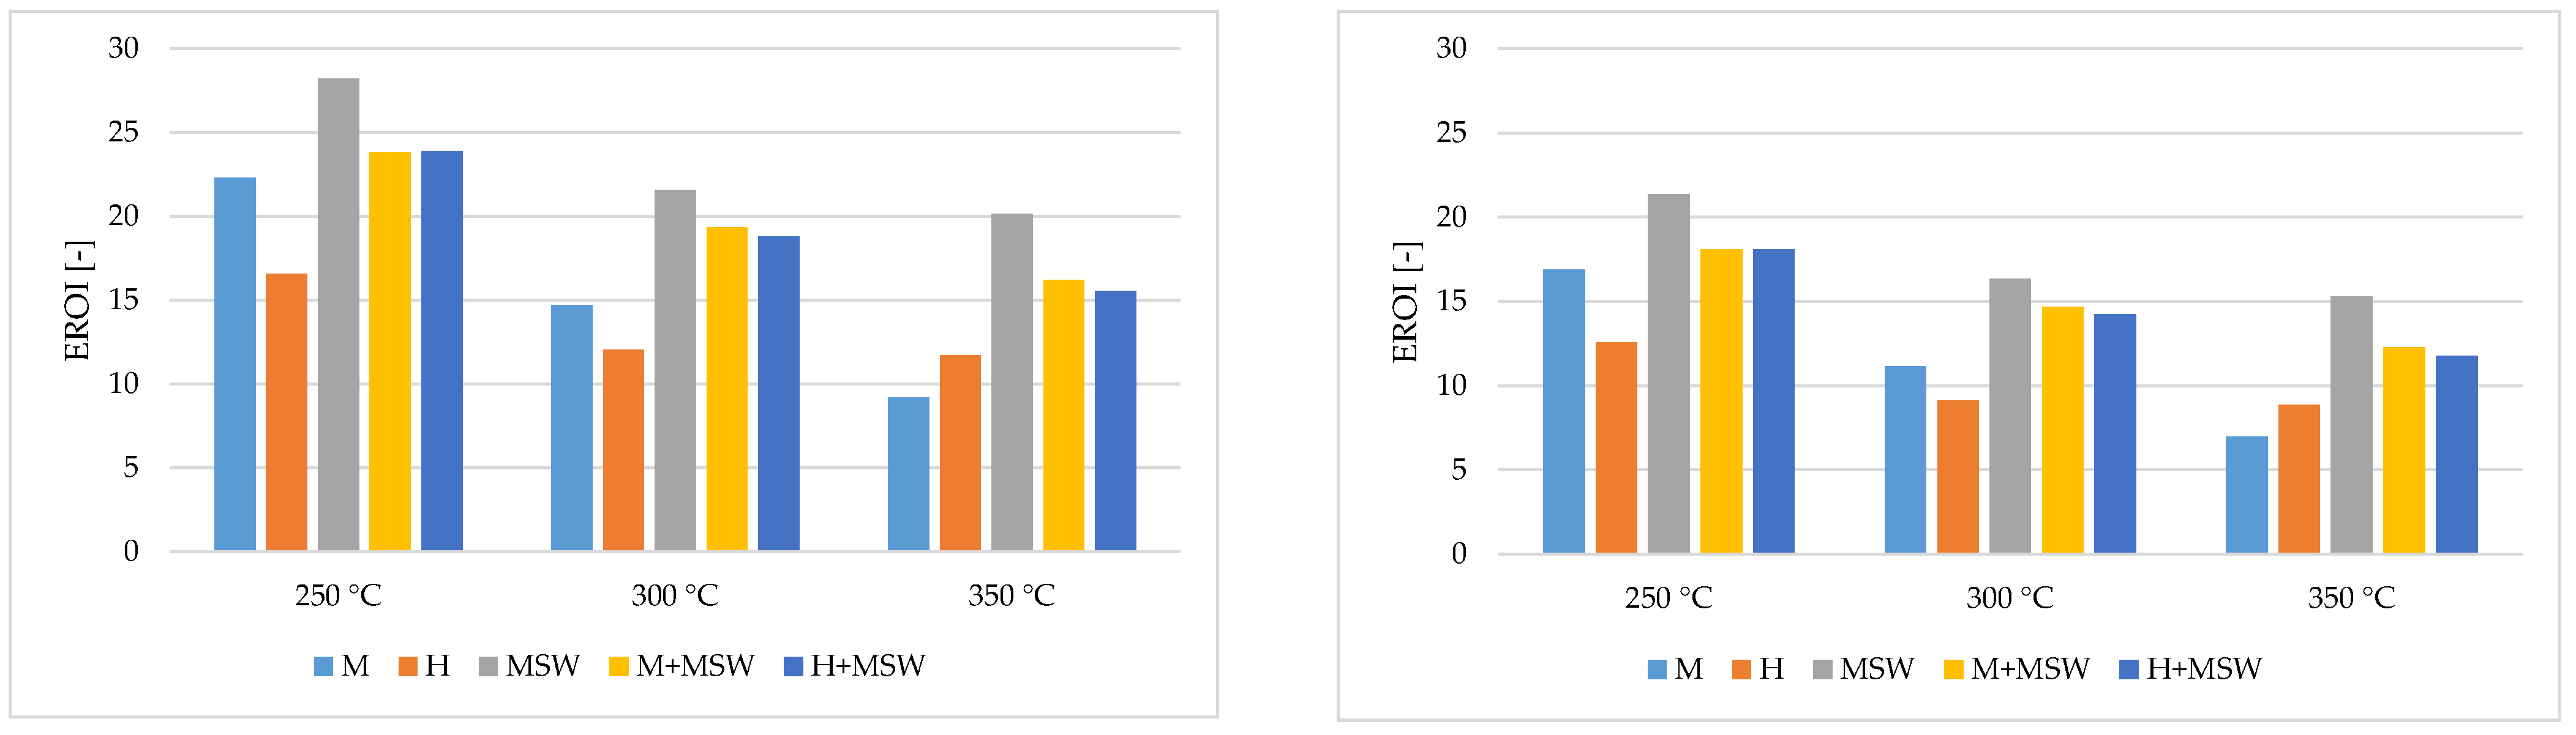
3.2. EROI Results
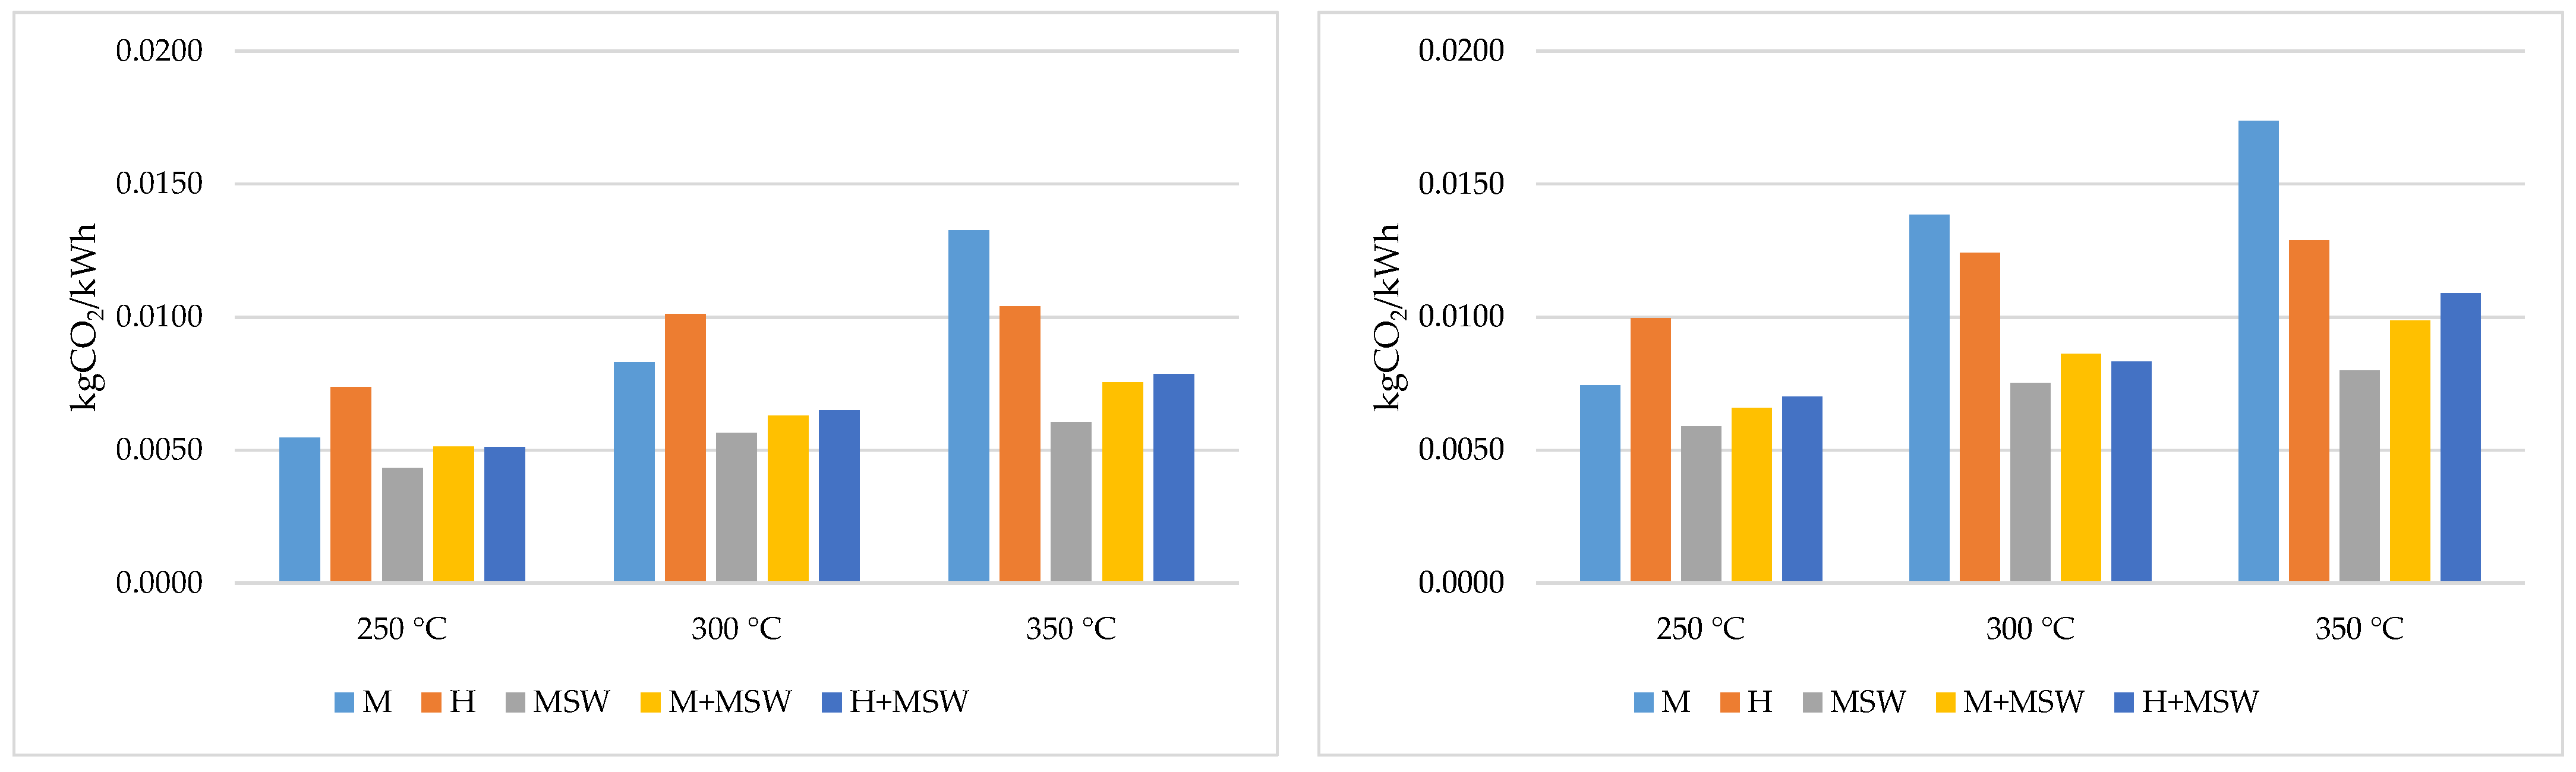
3.3. GHG Emissions
4. Conclusions
Author Contributions
Funding
Data Availability Statement
Conflicts of Interest
Abbreviations
| ED | Energy density |
| EF | Enhancement factor |
| EU | European Union |
| EY | Energy yield |
| EROI | Energy return on investment analysis |
| FC | Fixed carbon |
| FR | Fuel ratio |
| GHG | Greenhouse gas emissions |
| HHV | High heating value (MJ kg−1) |
| MC | Moisture content |
| MSW | Municipal solid waste |
| MY | Mass yield |
| RES | Renewable energy sources |
| SURS | Statistical Biro of Slovenia |
| VM | Volatile matter content |
References
- Anca-Couce, A.; von Berg, L.; Pongratz, G.; Scharler, R.; Hochenauer, C.; Geusebroek, M.; Kuipers, J.; Vilela, C.M.; Kraia, T.; Panopoulos, K.; et al. Assessment of Measurement Methods to Characterize the Producer Gas from Biomass Gasification with Steam in a Fluidized Bed. Biomass Bioenergy 2022, 163, 106527. [Google Scholar] [CrossRef]
- European Commission European. Green Deal. Available online: https://commission.europa.eu/strategy-and-policy/priorities-2019-2024/european-green-deal_en (accessed on 25 March 2023).
- European Commission European. Climate Law. Available online: https://www.europarl.europa.eu/news/en/press-room/20210621IPR06627/eu-climate-law-meps-confirm-deal-on-climate-neutrality-by-2050 (accessed on 25 March 2023).
- Lin, Y.L.; Zheng, N.Y.; Lin, C.S. Repurposing Washingtonia Filifera Petiole and Sterculia Foetida Follicle Waste Biomass for Renewable Energy through Torrefaction. Energy 2021, 223, 120101. [Google Scholar] [CrossRef]
- Inayat, A.; Raza, M. District Cooling System via Renewable Energy Sources: A Review. Renew. Sustain. Energy Rev. 2020, 107, 360–373. [Google Scholar] [CrossRef]
- Mudryk, K.; Jewiarz, M.; Wróbel, M.; Niemiec, M.; Dyjakon, A. Evaluation of Urban Tree Leaf Biomass-Potential, Physico-Mechanical and Chemical Parameters of Raw Material and Solid Biofuel. Energies 2021, 14, 818. [Google Scholar] [CrossRef]
- Gucho, E.M.; Shahzad, K.; Bramer, E.A.; Akhtar, N.A.; Brem, G. Experimental Study on Dry Torrefaction of Beech Wood and Miscanthus. Energies 2015, 8, 3903–3923. [Google Scholar] [CrossRef]
- Kalak, T. Potential Use of Industrial Biomass Waste as a Sustainable Energy Source in the Future. Energies 2023, 16, 1783. [Google Scholar] [CrossRef]
- European Union (EU). EU Strategy on Biofuels. Available online: https://energy.ec.europa.eu/topics/renewable-energy/bioenergy/biofuels_en (accessed on 25 March 2023).
- Cahyanti, M.N.; Doddapaneni, T.R.K.C.; Madissoo, M.; Pärn, L.; Virro, I.; Kikas, T. Torrefaction of Agricultural and Wood Waste: Comparative Analysis of Selected Fuel Characteristics. Energies 2021, 14, 2774. [Google Scholar] [CrossRef]
- Orisaleye, J.I.; Jekayinfa, S.O.; Pecenka, R.; Ogundare, A.A.; Akinseloyin, M.O.; Fadipe, O.L. Investigation of the Effects of Torrefaction Temperature and Residence Time on the Fuel Quality of Corncobs in a Fixed-Bed Reactor. Energies 2022, 15, 5284. [Google Scholar] [CrossRef]
- Doddapaneni, T.R.K.C.; Pärn, L.; Kikas, T. Torrefaction of Pulp Industry Sludge to Enhance Its Fuel Characteristics. Energies 2022, 15, 6175. [Google Scholar] [CrossRef]
- He, Y.; Zhang, S.; Liu, D.; Xie, X.; Li, B. Effect of Biomass Particle Size on the Torrefaction Characteristics in a Fixed-Bed Reactor. Energies 2023, 16, 1104. [Google Scholar] [CrossRef]
- Zachl, A.; Buchmayr, M.; Gruber, J.; Anca-Couce, A.; Scharler, R.; Hochenauer, C. Development of Stability Criteria for Biomass Open-Top Downdraft Gasifiers. J. Energy Inst. 2022, 105, 442–453. [Google Scholar] [CrossRef]
- Cahyanti, M.N.; Doddapaneni, T.R.K.C.; Kikas, T. Biomass Torrefaction: An Overview on Process Parameters, Economic and Environmental Aspects and Recent Advancements. Bioresour. Technol. 2020, 301, 122737. [Google Scholar] [CrossRef]
- Das, P.; Chandramohan, V.P.; Mathimani, T.; Pugazhendhi, A. A Comprehensive Review on the Factors Affecting Thermochemical Conversion Efficiency of Algal Biomass to Energy. Sci. Total Environ. 2021, 766, 144213. [Google Scholar] [CrossRef] [PubMed]
- Poudel, J.; Karki, S.; Oh, S.C. Valorization of Waste Wood as a Solid Fuel by Torrefaction. Energies 2018, 11, 1641. [Google Scholar] [CrossRef]
- Pidlisnyuk, V.; Newton, R.A.; Mamirova, A. Miscanthus Biochar Value Chain—A Review. J. Environ. Manag. 2021, 290, 112611. [Google Scholar] [CrossRef]
- Phanphanich, M.; Mani, S. Impact of Torrefaction on the Grindability and Fuel Characteristics of Forest Biomass. Bioresour. Technol. 2011, 102, 1246–1253. [Google Scholar] [CrossRef]
- Wang, Z.; Lim, C.J.; Grace, J.R.; Li, H.; Parise, M.R. Effects of Temperature and Particle Size on Biomass Torrefaction in a Slot-Rectangular Spouted Bed Reactor. Bioresour. Technol. 2017, 244, 281–288. [Google Scholar] [CrossRef] [PubMed]
- Ivanovski, M.; Urbancl, D.; Petrovič, A.; Stergar, J.; Goričanec, D.; Simonič, M. Improving Lignocellulosic and Non-Lignocellulosic Biomass Characteristics through Torrefaction Process. Appl. Sci. 2022, 12, 12210. [Google Scholar] [CrossRef]
- Barskov, S.; Zappi, M.; Buchireddy, P.; Dufreche, S.; Guillory, J.; Gang, D.; Hernandez, R.; Bajpai, R.; Baudier, J.; Cooper, R.; et al. Torrefaction of Biomass: A Review of Production Methods for Biocoal from Cultured and Waste Lignocellulosic Feedstocks. Renew. Energy 2019, 142, 624–642. [Google Scholar] [CrossRef]
- Nunes, L.J.R. Torrefied Biomass as an Alternative in Coal-Fueled Power Plants: A Case Study on Grindability of Agroforestry Waste Forms. Clean Technol. 2020, 2, 270–289. [Google Scholar] [CrossRef]
- Chang, S.S.; Sambeth, S.K.; Abdul Samad, N.A.F.; Saleh, S. Effect of Torrefaction on Thermal Degradation and Functional Group of Oil Palm Solid Waste. Mater. Today Proc. 2022, 57, 1248–1255. [Google Scholar] [CrossRef]
- Kota, K.B.; Shenbagaraj, S.; Sharma, P.K.; Sharma, A.K.; Ghodke, P.K.; Chen, W.H. Biomass Torrefaction: An Overview of Process and Technology Assessment Based on Global Readiness Level. Fuel 2022, 324, 124663. [Google Scholar] [CrossRef]
- Grams, J. Surface Analysis of Solid Products of Thermal Treatment of Lignocellulosic Biomass. J. Anal. Appl. Pyrolysis 2022, 161, 105429. [Google Scholar] [CrossRef]
- Pulidori, E.; Gonzalez-Rivera, J.; Pelosi, C.; Ferrari, C.; Bernazzani, L.; Bramanti, E.; Tiné, M.R.; Duce, C. Thermochemical Evaluation of Different Waste Biomasses (Citrus Peels, Aromatic Herbs, and Poultry Feathers) towards Their Use for Energy Production. Thermo 2023, 3, 66–75. [Google Scholar] [CrossRef]
- Wang, J.; Zhang, X.; Li, Z.; Ma, Y.; Ma, L. Recent Progress of Biomass-Derived Carbon Materials for Supercapacitors. J. Power Sources 2020, 451, 227794. [Google Scholar] [CrossRef]
- Phuang, Y.W.; Ng, W.Z.; Khaw, S.S.; Yap, Y.Y.; Gan, S.; Lee, L.Y.; Thangalazhy-Gopakumar, S. Wet Torrefaction Pre-Treatment of Yard Waste to Improve the Fuel Properties. Mater. Sci. Energy Technol. 2021, 4, 211–223. [Google Scholar] [CrossRef]
- Zhu, X.; Li, S.; Zhang, Y.; Li, J.; Zhang, Z.; Sun, Y.; Zhou, S.; Li, N.; Yan, B.; Chen, G. Flue Gas Torrefaction of Municipal Solid Waste: Fuel Properties, Combustion Characterizations, and Nitrogen/Sulfur Emissions. Bioresour. Technol. 2022, 351, 126967. [Google Scholar] [CrossRef] [PubMed]
- The World Bank. The Solid Waste Management. Available online: https://www.worldbank.org/en/topic/urbandevelopment/brief/solid-waste-management (accessed on 25 March 2023).
- Xing, Z.; Ping, Z.; Xiqiang, Z.; Zhanlong, S.; Wenlong, W.; Jing, S.; Yanpeng, M. Applicability of Municipal Solid Waste Incineration (MSWI) System Integrated with Pre-Drying or Torrefaction for Flue Gas Waste Heat Recovery. Energy 2021, 224, 120157. [Google Scholar] [CrossRef]
- Jóźwiak, P.; Hercog, J.; Kiedrzyńska, A.; Badyda, K. CFD Analysis of Natural Gas Substitution with Syngas in the Industrial Furnaces. Energy 2019, 179, 593–602. [Google Scholar] [CrossRef]
- Ivanovski, M.; Goricanec, D.; Krope, J.; Urbancl, D. Torrefaction Pretreatment of Lignocellulosic Biomass for Sustainable Solid Biofuel Production. Energy 2021, 240, 122483. [Google Scholar] [CrossRef]
- Ivanovski, M.; Petrovic, A.; Ban, I.; Goricanec, D.; Urbancl, D. Determination of the Kinetics and Thermodynamic Parameters of Lignocellulosic Biomass Subjected to the Torrefaction Process. Materials 2021, 14, 7877. [Google Scholar] [CrossRef] [PubMed]
- Simonic, M.; Goricanec, D.; Urbancl, D. Impact of Torrefaction on Biomass Properties Depending on Temperature and Operation Time. Sci. Total Environ. 2020, 740, 140086. [Google Scholar] [CrossRef]
- Liu, S.; Li, Z.; Dai, B. Energy, Economic and Environmental Analyses of the CO2 Heat Pump System Compared with Boiler Heating System in China. Energy Procedia 2017, 105, 3895–3902. [Google Scholar] [CrossRef]
- Lin, Y.L.; Zheng, N.Y. Torrefaction of Fruit Waste Seed and Shells for Biofuel Production with Reduced CO2 Emission. Energy 2021, 225, 120226. [Google Scholar] [CrossRef]
- Hall, C.A.S.; Lambert, J.G.; Balogh, S.B. EROI of Different Fuels and the Implications for Society. Energy Policy 2014, 64, 141–152. [Google Scholar] [CrossRef]
- Huang, Y.F.; Syu, F.S.; Chiueh, P.T.; Lo, S.L. Life Cycle Assessment of Biochar Cofiring with Coal. Bioresour. Technol. 2013, 131, 166–171. [Google Scholar] [CrossRef]
- Chen, W.H.; Lin, B.J.; Lin, Y.Y.; Chu, Y.S.; Ubando, A.T.; Show, P.L.; Ong, H.C.; Chang, J.S.; Ho, S.H.; Culaba, A.B.; et al. Progress in Biomass Torrefaction: Principles, Applications and Challenges. Prog. Energy Combust. Sci. 2021, 82, 100887. [Google Scholar] [CrossRef]
- Lin, Y.L.; Zheng, N.Y.; Hsu, C.H. Torrefaction of Fruit Peel Waste to Produce Environmentally Friendly Biofuel. J. Clean. Prod. 2021, 284, 124676. [Google Scholar] [CrossRef]
- European Environment Agency (EEA). GHG Emissions Factors for Electricity Consumption. Available online: https://data.jrc.ec.europa.eu/dataset/919df040-0252-4e4e-ad82-c054896e1641 (accessed on 25 March 2023).
- European Environemntal Agency (EEA). Efficiency of Conventional Thermal Electricity and Heat Production in Europe. Available online: https://www.eea.europa.eu/data-and-maps/indicators/efficiency-of-conventional-thermal-electricity-generation-4/assessment-2 (accessed on 25 March 2023).
- Niu, Y.; Lv, Y.; Lei, Y.; Liu, S.; Liang, Y.; Wang, D.; Hui, S. Biomass Torrefaction: Properties, Applications, Challenges, and Economy. Renew. Sustain. Energy Rev. 2019, 115, 109395. [Google Scholar] [CrossRef]
- Rago, Y.P.; Collard, F.X.; Görgens, J.F.; Surroop, D.; Mohee, R. Torrefaction of Biomass and Plastic from Municipal Solid Waste Streams and Their Blends: Evaluation of Interactive Effects. Fuel 2020, 277, 118089. [Google Scholar] [CrossRef]
- Ong, H.C.; Chen, W.H.; Singh, Y.; Gan, Y.Y.; Chen, C.Y.; Show, P.L. A State-of-the-Art Review on Thermochemical Conversion of Biomass for Biofuel Production: A TG-FTIR Approach. Energy Convers. Manag. 2020, 209, 112634. [Google Scholar] [CrossRef]
- Doddapaneni, T.R.K.C.; Kikas, T. Advanced Applications of Torrefied Biomass: A Perspective View. Energies 2023, 16, 1635. [Google Scholar] [CrossRef]
- Monteiro, E.; Ferreira, S. Biomass Waste for Energy Production. Energies 2022, 15, 5943. [Google Scholar] [CrossRef]
- Gan, Y.Y.; Ong, H.C.; Ling, T.C.; Chen, W.H.; Chong, C.T. Torrefaction of De-Oiled Jatropha Seed Kernel Biomass for Solid Fuel Production. Energy 2019, 170, 367–374. [Google Scholar] [CrossRef]
- González Martínez, M.; Dupont, C.; Anca-Couce, A.; da Silva Perez, D.; Boissonnet, G.; Thiéry, S.; Meyer, X.m.; Gourdon, C. Understanding the Torrefaction of Woody and Agricultural Biomasses through Their Extracted Macromolecular Components. Part 2: Torrefaction Model. Energy 2020, 210, 118451. [Google Scholar] [CrossRef]
- Urbancl, D.; Zlak, J.; Anicic, B.; Trop, P.; Goricanec, D. The Evaluation of Heat Production Using Municipal Biomass Co-Incineration within a Thermal Power Plant. Energy 2016, 108, 140–147. [Google Scholar] [CrossRef]
- Wilk, M.; Magdziarz, A. Hydrothermal Carbonization, Torrefaction and Slow Pyrolysis of Miscanthus Giganteus. Energy 2017, 140, 1292–1304. [Google Scholar] [CrossRef]


| Analysis | M | H | MSW | M + MSW | H + MSW | |
|---|---|---|---|---|---|---|
| Proximate analysis (wt.%, dry basis) | Fixed carbon | 3.89 | 3.01 | 6.69 | 4.25 | 4.54 |
| Volatile matter | 82.79 | 84.23 | 78.11 | 82.60 | 80.47 | |
| Ash content | 2.83 | 4.18 | 3.12 | 3.37 | 3.65 ± 0.18 | |
| Moisture content (wt.%, dry basis) | 9.21 | 8.58 | 12.08 | 9.78 | 11.34 ± 0.57 | |
| Elemental analysis (wt.%, dry basis) | C | 45.11 | 42.12 | 43.20 | 44.12 | 43.97 |
| H | 3.71 | 4.54 | 8.10 | 6.19 | 6.42 | |
| N | 0.80 | 3.49 | 0.78 | 1.02 | 2.33 | |
| O | 50.33 | 49.82 | 47.89 | 48.65 | 47.25 | |
| S | 0.05 | 0.03 | 0.03 | 0.02 | 0.03 | |
| Energy content (wt.%, dry basis) | HHV (MJ/kg) | 18.91 | 16.56 | 24.27 | 21.37 | 20.23 |
| Proximate Analysis (wt.%) | Moisture Content (wt.%) | Elemental Analysis (wt.%) | Energy Content (wt.%) | ||||||||
|---|---|---|---|---|---|---|---|---|---|---|---|
| FC | VM | Ash | C | H | N | O | S | HHV (MJ/kg) | |||
| 30 min | |||||||||||
| 250 °C | M | 4.30 | 83.20 | 3.50 | 9.00 | 50.61 | 4.00 | 0.50 | 44.88 | 0.01 | 19.80 |
| H | 3.45 | 82.80 | 4.80 | 8.95 | 46.35 | 4.10 | 2.80 | 46.74 | 0.01 | 17.12 | |
| MSW | 7.80 | 76.45 | 6.78 | 8.97 | 48.11 | 7.23 | 0.84 | 43.54 | 0.28 | 24.58 | |
| M + MSW | 5.13 | 81.24 | 4.56 | 9.07 | 50.71 | 6.78 | 0.84 | 41.46 | 0.21 | 21.45 | |
| H + MSW | 4.93 | 79.26 | 4.57 | 11.24 | 49.78 | 6.52 | 2.11 | 41.36 | 0.23 | 20.45 | |
| 300 °C | M | 4.80 | 82.00 | 4.20 | 9.00 | 55.11 | 3.89 | 0.70 | 40.29 | 0.01 | 19.94 |
| H | 4.58 | 81.08 | 5.88 | 8.46 | 48.17 | 3.92 | 3.01 | 44.89 | 0.01 | 18.78 | |
| MSW | 8.52 | 75.02 | 7.58 | 8.88 | 52.7 | 6.78 | 0.83 | 39.48 | 0.21 | 24.45 | |
| M + MSW | 6.05 | 79.70 | 5.20 | 9.05 | 56.78 | 6.25 | 0.88 | 35.89 | 0.20 | 21.88 | |
| H + MSW | 5.23 | 78.58 | 4.86 | 11.33 | 54.22 | 6.48 | 2.14 | 36.96 | 0.20 | 20.58 | |
| 350 °C | M | 5.13 | 81.56 | 4.50 | 8.81 | 61.80 | 3.52 | 0.78 | 33.89 | 0.01 | 19.70 |
| H | 5.45 | 80.01 | 6.01 | 8.53 | 55.89 | 3.84 | 3.24 | 37.02 | 0.01 | 17.65 | |
| MSW | 8.87 | 74.88 | 7.99 | 8.26 | 53.78 | 6.23 | 0.86 | 39.12 | 0.01 | 24.78 | |
| M + MSW | 6.45 | 79.03 | 5.85 | 8.67 | 60.00 | 5.98 | 0.95 | 32.89 | 0.18 | 21.78 | |
| H + MSW | 5.58 | 78.03 | 5.06 | 11.33 | 59.89 | 6.01 | 2.33 | 31.59 | 0.18 | 20.74 | |
| 60 min | |||||||||||
| 250 °C | M | 4.88 | 82.12 | 4.00 | 9.00 | 53.99 | 3.89 | 0.52 | 41.59 | 0.01 | 20.26 |
| H | 3.88 | 82.00 | 5.23 | 8.89 | 47.12 | 4.00 | 2.89 | 45.98 | 0.01 | 17.38 | |
| MSW | 7.87 | 76.12 | 7.05 | 8.96 | 50.00 | 7.02 | 0.86 | 41.84 | 0.28 | 24.97 | |
| M + MSW | 6.01 | 80.33 | 4.78 | 8.88 | 52.01 | 6.78 | 0.83 | 40.17 | 0.21 | 22.12 | |
| H + MSW | 5.00 | 78.09 | 6.50 | 10.41 | 53.96 | 6.35 | 2.11 | 37.35 | 0.23 | 20.79 | |
| 300 °C | M | 4.90 | 81.77 | 4.60 | 8.73 | 55.78 | 3.65 | 0.71 | 39.85 | 0.01 | 20.30 |
| H | 5.35 | 81.16 | 5.13 | 8.36 | 48.00 | 3.92 | 3.01 | 45.06 | 0.01 | 20.90 | |
| MSW | 8.52 | 75.78 | 7.58 | 8.12 | 51.52 | 6.88 | 0.88 | 40.51 | 0.21 | 25.02 | |
| M + MSW | 6.78 | 78.74 | 5.60 | 8.88 | 56.78 | 6.35 | 0.92 | 35.75 | 0.20 | 22.19 | |
| H + MSW | 5.10 | 78.60 | 6.61 | 9.69 | 54.01 | 6.08 | 2.29 | 37.42 | 0.20 | 20.64 | |
| 350 °C | M | 5.33 | 81.45 | 4.78 | 8.44 | 57.10 | 3.5 | 0.75 | 38.64 | 0.01 | 20.32 |
| H | 5.47 | 80.04 | 6.13 | 8.36 | 55.89 | 3.84 | 3.28 | 36.98 | 0.01 | 19.18 | |
| MSW | 8.93 | 74.87 | 7.99 | 8.21 | 54.00 | 3.74 | 0.93 | 41.32 | 0.01 | 25.18 | |
| M + MSW | 6.99 | 78.22 | 6.18 | 8.61 | 60.00 | 6.12 | 0.97 | 32.73 | 0.18 | 22.36 | |
| H + MSW | 5.99 | 78.22 | 6.63 | 9.16 | 56.08 | 6.03 | 2.34 | 35.37 | 0.18 | 21.03 | |
| Energy Required | ||
| Pre-drying | ||
| Temperature | 105 °C | |
| Power of heating processes | 2700 W (6 min) | |
| Power of torrefaction process | 600 W (10 min) | |
| Torrefaction | ||
| Temperature | 250, 300, 350 °C | |
| Time | 30, 60 min | |
| Power of heating processes | 2700 W (6 min) | |
| Power of torrefaction process | 600 W (30 and 60 min) | |
| Energy Produced | ||
| Weight of biochar obtained 4.8 kg (air-dried material) × MY of each biochar | ||
| HHV of each biochar torrefied at specific torrefaction temperature and time | ||
Disclaimer/Publisher’s Note: The statements, opinions and data contained in all publications are solely those of the individual author(s) and contributor(s) and not of MDPI and/or the editor(s). MDPI and/or the editor(s) disclaim responsibility for any injury to people or property resulting from any ideas, methods, instructions or products referred to in the content. |
© 2023 by the authors. Licensee MDPI, Basel, Switzerland. This article is an open access article distributed under the terms and conditions of the Creative Commons Attribution (CC BY) license (https://creativecommons.org/licenses/by/4.0/).
Share and Cite
Ivanovski, M.; Goričanec, D.; Urbancl, D. The Evaluation of Torrefaction Efficiency for Lignocellulosic Materials Combined with Mixed Solid Wastes. Energies 2023, 16, 3694. https://doi.org/10.3390/en16093694
Ivanovski M, Goričanec D, Urbancl D. The Evaluation of Torrefaction Efficiency for Lignocellulosic Materials Combined with Mixed Solid Wastes. Energies. 2023; 16(9):3694. https://doi.org/10.3390/en16093694
Chicago/Turabian StyleIvanovski, Maja, Darko Goričanec, and Danijela Urbancl. 2023. "The Evaluation of Torrefaction Efficiency for Lignocellulosic Materials Combined with Mixed Solid Wastes" Energies 16, no. 9: 3694. https://doi.org/10.3390/en16093694
APA StyleIvanovski, M., Goričanec, D., & Urbancl, D. (2023). The Evaluation of Torrefaction Efficiency for Lignocellulosic Materials Combined with Mixed Solid Wastes. Energies, 16(9), 3694. https://doi.org/10.3390/en16093694